Article

Temporal Variations of Heavy Metal Sources in Agricultural Soils in Malta

1
Institute of Engineering and Transport, Malta College of Arts, Science and Technology, PLA 9032 Paola, Malta
2
Institute of Applied Sciences, Malta College of Arts, Science and Technology, PLA 9032 Paola, Malta
*
Authors to whom correspondence should be addressed.
Appl. Sci. 2022, 12(6), 3120; https://doi.org/10.3390/app12063120
Submission received: 2 February 2022 / Revised: 11 March 2022 / Accepted: 14 March 2022 / Published: 18 March 2022
(This article belongs to the Topic Sustainable Environmental Technologies)

Abstract

:
In the opportunity to understand the benefits of Maltese soil and its importance to our climate, the content of heavy metals—including Co, Cr, Cu, Fe, Mn, Ni, Pb, Sr, and Zn—was studied in two fields in proximity in the south-east region of Malta. Analytical determinations were carried out using atomic absorption spectroscopy following heated aqua regia digestion on 50 collected samples using triple repeatability. The decreasing pattern of the concentrations obtained is Fe > Zn > Mn > Sr > Pb > Cu > Ni > Cr > Co. Correlations between pre-harvesting and post-harvesting concentrations were examined to assess lithogenic and anthropogenic relationships. Multivariate analysis including principal component analysis and factor analysis clarified the origin of heavy metals content reviewed. Some of the heavy metals studied showed a dominant relationship between concentration variation and their possible sources. Potential ecological risk assessment demonstrated that the fields reviewed are not contaminated by any of the heavy metals assessed except for Zn which posed a moderate/strong contamination but presented an overall low potential for ecological risk. Concentrations of heavy metals demonstrated no risk to human health and no carcinogenic risk through ingestion and dermal contact with the soil.

Graphical Abstract

1. Introduction

Maltese soils are a natural resource with agricultural, environmental, and cultural value which have undergone human influence over time and due to intensive land-use are experiencing erosion, loss of organic matter, structural deterioration and chemical contamination from excess nitrates and salinity [1]. Desertification is another issue identified within Malta’s ecosystem intensifying environmental problems resulting from changes in agricultural practices and increased urban development. Malta unfortunately ranks above the EU average for artificial land coverage with 23.6%, which correlates with a high percentage in population density [2]. The total cultivated area in Malta is around 10,000 hectares amounting to approximately 18.9% of the total land area [1]. An annual soil loss of 19.3% which equates to 10–25 tons per hectare per year indicates that Maltese north-western and Gozitan areas are at the risk of moderate to severe soil erosion [2]. This erosion is very typical of high inclination in arable land areas where poor management and conservation practices are used. The fragmentation of soil reduces its economic viability costing an average agricultural farmer in Malta € 1164.24 per 0.01 km2 per year to replace eroded soils and artificially maintain the soil quality in eroded zones [2]. Malta has registered 135 zones that are undergoing potentially polluting activities in the issued JRC report in the EU and has remediated one registered site. According to the RUSLE2015 model, Malta has an average soil loss rate of 6.02 tons per hectare per year, which is high compared to the EU average of 2.46 tons per hectare per year [2]. Such data depends on the conditions of each individual country and proves that soil degradation is of high importance because of its role in carbon cycling and climate change. The pH level for 56% of Maltese soil lies between 8 and 8.5; thus, soil in Malta has a slightly alkaline pH [3].
There are three main soil types in Malta: Terra Rossa soil, Xerorendzina soil, and Carbonate Raw soil [3]. These have been subdivided into subgroups according to the area of location. As reported by Lang in 1960 [3], the soil types found in the sampling zone are Terra Rossa, Xerorendzina, and the L-Iklin and Tad-Dawl complexes. Terra Rossa soil is a red clay-like soil resulting from both types of coralline limestone existing on the island. Its reddish color is derived from the high iron oxide content and has a calcium carbonate content of 2–15%. Xerorendzina soil ranges from a whitish to red soil with a calcium carbonate content of 58–80%. It is a constituent of Globigerina limestone which is made up of clay and lime [3]. Calcisol soil is characterized by calcium carbonate concentrations which are found as coatings on the soil structure faces. Such Calcisol horizons are present in the lower topsoil or subsoil horizons, are rich in lime and form in dry areas. If their dryness factor is adequately controlled through irrigation, drainage, and fertilization to prevent salinization, Calcisol soil is highly productive for crops [3].
A heavy metal is a dense metal with high atomic weight which is toxic at low concentration. Heavy metals are regarded as pollutants in soil because of their persistence and toxicity upon high concentration or unwanted presence. Since agricultural and industrial processes have changed over time due to modernization, several geo-chemical cycles, degradation processes, and ecosystem functions have been altered leading to significant concern over their polluting effects [4]. Trace elements accumulated in the soil are mainly due to industrial, mining, agricultural practices, and the disposal of waste from communal sources. Several trace elements have essential metabolic functions in living organisms, but some others influence the biological, chemical, and morphological traits in plants, animals and humans upon physical contact, inhalation, or ingestion [5].
Various ecological functions make soil an extremely complex matrix which provides a suitable environment for the development of living organisms, conditions water flow and biological activities, detoxifies and immobilizes organic and inorganic matter, regulates biotic diversity, and transforms potential harmful compounds [5]. Heavy metals are bound in the soil with their oxides or dissolved with aquo complexes, with inorganic complexes or with organic complexes and chelates [6]. Heavy metal dynamics in the soil and their uptake by plants is directly linked to the soil properties, altering their bioavailability. Nortcliff and Schulte-Bisping stated that the pollutant content of soil depends on the background values which represent its appropriate content [6]. Some of the chemical processes involved in the transformation of trace elements in soil include precipitation–dissolution, adsorption–desorption, and complexation. These processes control bioavailability and mobility of such elements to manage both deficiency and toxicity levels in agroecosystems. This allows the buffering of nutrients and pollutants to occur whereby the input of acids in the soil naturally through the absorption of nutrient ions by plants, and anthropogenically through fertilization and atmospheric absorption are balanced out by the corresponding salts maintaining a constant pH in a particular range [6]. The transformation function of soil occurring abiotically or biotically, provides a self-cleansing process from chemical compounds found in the pedosphere. Soils with good nutrient supply, good aeration, and water balance have an optimal microbial activity, and the degradation process of such elements is considerably high. This is essential for plants and microorganisms building up their cellular material, and thus is vital for plant growth [6,7]. The fractional concentration of pollutants entering the soil as soluble compounds depends on the ion affinity with reaction centers in the soil components and are in their metal oxide or in salt form. Their transformation depends on their solubility rate, metal salts being more mobile than their respective oxides, thus having an increased probability of causing an ecological danger [8]. Ghosh and Devi [9] have studied the effect of using inorganic fertilizer on crop yield and have reported that higher yield was attributed to the compost increasing organic carbon, which reduced the release of carbon dioxide from the soil as well as the water retention. This matched the work by Pomazkina and Semenova [10], which outlined that a change in the microbial activity could be observed with the transformation of carbon containing substances, tying in with concepts of mineral transformation processes discussed by Nortcliff and Schulte-Bisping [6] and Mulder and VanVeen [7]. Zhang et al. [11] reported that increasing nitrogen deposition in the soil, increased the amounts of pollutants following a parabolic diffusion relationship. This contrasts conclusions drawn by Ghosh and Devi [9], who documented that high yield is associated with the blending of inorganic fertilizer with compost lowering the total nitrogen content in the soil, thus reducing the need for nitrogen fertilizers, preventing nitrogen percolation and the release of nitrous oxide into the atmosphere. Several studies concluded that fertilizer addition should be appropriate to the needs of the cultivated plants to avoid excess of nutrients in the soil and their eventual release into the environment [6,9].
During crop cultivation, the concentration requirement of non-essential elements varies with the crop growth stage [12]. Mulder and Van Veen, O’Neill and Micó, et al., reported several chemical elements which are essential for the growth of a living organism, especially plants, hence linking sub-optimal growth to the deficiency of major and trace elements [4,7,12]. Some of the elements mentioned include chromium, manganese, iron, cobalt, nickel, copper, and zinc, all of which are trace elements—occurring in plants with less than 0.01% concentrations, but which are important for organism growth. Chemical processes involved in the transformation of trace elements in soil control bioavailability and mobility of such elements to manage both deficiency and toxicity levels in agroecosystems [13]. If these trace elements are in their insoluble state, or are dispersed in other minerals, their availability for uptake depends on the relative stability and mobility of the compound [12]. Sorption interaction with the solid phase may be masked if a significant release of metals into solution from the soil matrix at favorable conditions occurs [14]. This pH adjustment is achieved by shifting the soil pH to alkaline by adding organic matter to the soil, immobilizing heavy metals in their solid state, and thus reducing the leaching probability of heavy metals into the plants [15], altering also the humus content in the soil [10]. The mobility of heavy metal ions decreases slowly with time until equilibrium is achieved possibly after decades while their availability in the soil is highly linked to the origin of the soil and its history [16].
The aim of this study is to provide scientific insight on the chemical pollutants pertaining to Maltese soil through the characterization of heavy metals in two neighboring fields which are worked using traditional methods. The heavy metals characterized include Co, Cr, Cu, Fe, Mn, Ni, Pb, Sr, and Zn. Another study regarding the content of heavy metals on soils in the Maltese Islands carried out by Briffa (2020) has focused on general concentration values of several heavy metals in different locations around the island and only one location has been chosen close to the study areas chosen for this study; thus, comparison of the results obtained and adequate mapping of the contamination effects on the soil was limited. This research should provide knowledge regarding heavy metals concentrations typical of common agricultural practices on the island. Changes in heavy metals content in the soil is to be further analyzed in conjunction with different stages in crop cultivation. Further research and analysis of the concentrations acquired from 50 soil samples with triple repeatability collected from two different fields is to be undergone to assess whether the fields under review are polluted with heavy metals and are in a heavily degraded stage by using multivariate analysis. A classification of the pollution sources outlined in this study is to be done using principal component analysis on the dominant heavy metals being reviewed.

2. Materials and Methods

2.1. Location of Study Area

Two fields, Field A and Field B, located in the south-east region of Malta in proximity (about 500 m away from each other) as illustrated in Figure S1 were studied. Field A has an area equal to approximately 1058 m2 and is located on coordinates (35.827699, 14.508289), and Field B has an area of approximately 1248 m2 and is located on (35.828808, 14.509760).

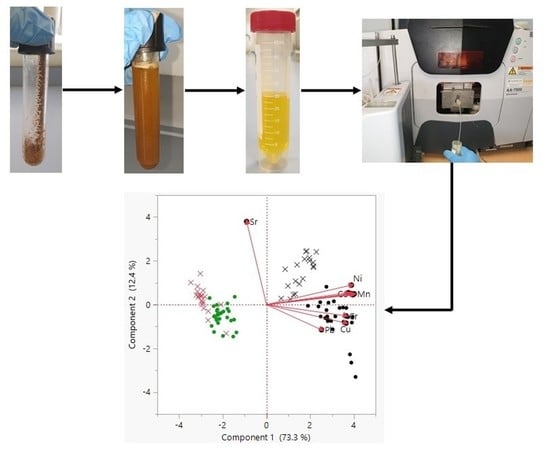
2.2. Sampling and Pre-Treatment

Two groups of samples were collected—at the pre-harvesting stage where the soil has already been fertilized, ploughed, and the crops have just been planted and were possibly germinating in November 2020; and at the post-harvesting stage where the crops were fully grown and had just been picked in April 2021. A total of 9.4 mm of rainfall and a temperature of approximately 16 °C was recorded on the day of the pre-harvesting sample collection, while no precipitation and a temperature of approximately 19 °C was documented for the sample collection at the post-harvesting stage [17]. This gives concentrations of the heavy metals after fertilizer addition and before any possible uptake by the crops during the pre-harvesting sampling stage and proves if any differences occur once crops have been grown. Fertilization was done in August 2020 for both fields to allow ample time for the nutrients to dissolve in the soil before sampling. Field A was fertilized using approximately 1.134 kg/m2 of rabbit manure while Field B was fertilized using 0.100 kg/m2 organic fertilizer in pellet form. The same type of crops was grown in both fields, namely, potatoes, beans, onions, spinach, and cauliflower, and potable water used for irrigation was obtained from the same supplier. Such analysis would demonstrate the benefits or drawbacks of the presence of heavy metals in the soil upon product cultivation. Samples were taken from the top 20–25 cm range since upper soil horizons have a wider interaction with atmospheric environmental conditions including dust particles, fertilizers, and pesticides, using a hand shovel, and stored in sealed plastic bags. Fifty samples were collected from both fields for each sampling stage to account for any spatial variability from different zones in the fields. Stratified random sampling system was used, whereby the entire area was divided into smaller sections in a grid pattern, and random sampling was applied on some of the sections. Samples were not collected close to the roots of large trees, buildings, or piles of manure as the natural heavy metal content distribution in such locations is altered. Soil samples were oven-dried at 105 °C until constant mass was obtained [18].

2.3. Physical Analysis

Soil physical parameters were analyzed to describe soil texture, friability, structure, and type, as these influence the chemical composition of the soil effecting nutrients and pollutants mobility, and chemical and biological processes involved in soil functions. Each of the physical characteristics tests was carried out on 5 random samples from each field, which were then worked in triplicate to obtain an average value for each field. Physical parameters studied include bulk density, specific gravity, and moisture content. Bulk density is important for root penetration and soil permeability and varies inversely with pore space. Bulk densities for soil generally vary between 0.8 and 1.7 g/cm3 [18]. Bulk density was calculated upon drying 5 collected soil samples from each field to obtain an average representative value.
Specific gravity is directly related to the bulk density and is used to describe soil porosity indicating the amount of water saturation in the soil. Typical values of soil specific gravity lie in between 2.65 and 2.80 [19]. Specific gravity was calculated for 5 soil samples from each field.
Soil moisture content was determined on dried and sieved samples using a 2 mm mesh on 5 soil samples from each field. Water content analysis is important for highlighting any undesirable effects on plant roots and their growth as well as chemical and microbial activities taking place in the soil levels.

2.4. Chemical Analysis

All glassware for use during the chemical analysis process was washed with soap and water before soaking in an acid bath for at least 24 h before use to remove contaminants. The acid wash used was made from diluted aqua regia solution which consisted of 1 part concentrated nitric acid and 3 parts concentrated hydrochloric acid, mixed with 1 part water to reduce the generation of chlorine gas since the solution was to be stored over a short period of time [20]. The acid bath was made using the same grades of acids used for analysis. Some soil from each sample was crushed manually using a pestle and mortar and sieved using a 2 mm mesh size sieve, upon cooling. One gram of this sieved soil was taken; with a repeatability of 3. Thus, a total of 150 samples were then available for processing, each of which was adequately labelled for full traceability. Digestion was carried out using aqua regia solution made from nitric acid with 69.5% concentration RPE ACS-Reag.PH.EUR.-Reag. USP grade and hydrochloric acid with 37% concentration RPE ACS-Reag.PH.EUR.-Reag. USP grade in molar ratio of 1:3. 15 mL of aqua regia were added gradually in steps (1 mL, 1 mL, 1 mL, 2 mL, 10 mL) to control the reaction of the acid solution with the calcareous stones in the soil in order to reduce soil sample loss as much as possible. In between each addition of solution, each sample was slightly swirled to completely wet the sample, speed up the reaction and entirely dissolve the calcareous deposits for easier processing. Digestion was carried out, heating the samples with acid solution in heating blocks for 30 min at 50 °C and 2 h at 120 °C. Once cooled, each was filtered using vacuum filtration setup with a sintered ceramic membrane and a filter paper Grade 393 which retains 1–2 μm. The filtrate was transferred to a 50 mL plastic falcon tube, and each sample was reconstructed using 10 mL nitric acid.

2.5. Analysis of Heavy Metals Using Spectroscopy

Upon digestion to extract heavy metals from the soil samples collected, analysis using Atomic Absorption Spectroscopy (AAS) was used to give the concentrations of such metallic elements, based on the quantity of light being absorbed at a specific wavelength corresponding to the known characteristics of the element being tested. AAS gives readings with a high degree of accuracy, results generally fall in the range of 0.5–5% accuracy, and is a highly sensitive method of analysis [21]. The amount of light absorbed by the sample is proportional to the concentration of metal ion in solution. Since AAS is used to measure trace elements, contamination from equipment or storage of the sample can lead to severe sources of error. The sample must be conserved in terms of pH, and constituent elements. Since the material of the storage containers may absorb some of the analyte, perflouroalkoxy (PFA) polymers, or glass were used as storage materials to affect the analyte as least possible. To prevent analyte ions from adhering to the walls of the containers used, solution acidification with nitric acid was carried out. A continuous flame-type Atomic Absorption Spectrophotometer produced by Shimadzu Europa GmbH model AA-7000 was used. The lamp mode was set to BGC-D2 type for all elements tested except for Sr for which a Non-BGC lamp mode was used. Burner height was set at 7 mm for all elements tested except for Cr and Fe for which this parameter was set to 9 mm. For all elemental readings, burner lateral and burner angle were set at 0 pulse and 0 degrees. The Air-Acetylene flame was used, which supply flow rate was in the range of 1.6 L/min to 2.8 L/min, and the support gas was supplied with a flow rate of 15.0 L/min for all elements. Wavelength settings used were: 240.7 nm Co, 324.8 nm Cu, 357.9 nm Cr, 248.3 nm Fe, 279.5 nm Mn, 232.0 nm Ni, 283.3 nm Pb, 460.7 nm Sr, 213.9 nm Zn respectively. Slit widths were set at 0.2 nm for Co, Fe, Mn, and Ni respectively, and at 0.7 nm for Cu, Cr, Pb, Sr, and Zn respectively.
Upon sample analysis using AAS, absorbance values were obtained. To obtain concentration of analytes in the solution, standard calibration curves of absorbance against concentration were created with water. Percentage recovery values computed showed a substantial amount of matrix interference; thus, calibration curves were then set up using sample analyte solution to reduce the matrix effect to a minimum using standard addition calibration method. All analysis was carried out in triplicates, against a method blank.
A calibration check was carried out prior to each experiment and included every 6–10 samples. Apart from that precision was checked by preparing 6 standards of same concentration to check that the Percentage Relative Standard Deviation (% RSD) was always less than 2%.

2.6. Statistical Analysis

IBM SPSS Statistics 24 software was used to carry out correlation analysis, regression analysis and normality tests with a 95% confidence interval on the data obtained. JMP Trial 16 software was utilized to perform parametric tests, multivariate analysis, PCA, and FA. PCA was used to identify elemental dominance when variation of their respective concentrations was tested, and to distinguish possible elemental sources. In carrying out factor analysis, a rotating component matrix was used to separate the possible elemental combinations and two factors with accumulative variance contributions were chosen for analyses.

2.7. Health Risk Assessment

Exposure to heavy metals and other chemicals present in the environment such as arsenic, cadmium, chromium, cobalt, copper, lead, mercury, molybdenum, selenium, nickel, and zinc [22] may pose risks to human health through inhalation, dermal contact, and ingestion. Impacts of the content of various heavy metals in soil samples are assessed by calculating the average daily doses (ADD) by ingestion and by dermal contact as shown in the below equations.
ADD ingestion = C s × IR ingest × EF × ED × CF BW × AT
ADD dermal = C s × SA × AF × ABS × EF × ED × CF BW × AT
where Cs is the average heavy metal concentration in the sample; IRingest is the ingestion rate of heavy metals; EF is the frequency of exposure; ED is the duration of exposure; BW is the average body weight for adults; AT is the averaging time for carcinogens and non-carcinogens; CF is a unity conversion factor; SA is the estimated average exposed skin area; AF is the adherence factor; and ABS is the dermal absorption fraction [22]. Typical values used to compute ADDingestion and ADDdermal are included in Table 1.
The Hazard Quotient (HQ) shows the tendency of non-carcinogenic toxicity which may come about from a long-time exposure of humans to a non-carcinogenic heavy metal. The HQ and the Hazard Index, HI, for all metallic elements in the soil samples analyzed are calculated using:
HQ = ADD RFD
HI = i = 0 n HQ i
where RFD is the reference dose for each heavy metal that an individual is exposed to per day either by ingestion or dermal contact throughout his entire life without any harm; HI is the overall toxic risk and n is the total number of metals under consideration as stated in the United States Environmental Protection Agency IRIS (USEPA IRIS) (2011), and referenced by Agoro, et al. (2020), Anyanwu and Nwachukwu (2010), and Liang, et al. (2017) [22,24,25,26] shown in Table 2. If HQ > 1, it represents adverse non-carcinogenic effects and if HQ < 1, it shows an acceptable level of these concentrations without any concerns. If the Hazard Index, HI < 1, the non-carcinogenic adverse effects are assumed to be negligible [24,25].
Cancer risk (CR) is the incremental risk of a person having cancer over a lifetime by means of exposure to carcinogenic substance (like heavy metals) because of the exposure of twenty-four hours per day for almost a full year for a lifetime i.e., seventy years [27]. The following equation is used to calculate this incremental probability:
CR = ADD × SF
RI = i = 0 n CR i
where SF is the slope factor (mg/kg/day) defined as an incremental rate of cancer development originating from a lifetime exposure to contaminants and is represented by the upper bound estimate approximating 95% confidence limit of the increased cancer risk [28]. SF values for ingestion are outlined in Table 2, based on USEPA IRIS (2011) standards [25]. RI is the cancer risk index including the summation of individual cancer risk attributing to each metallic element in the soil sample analyzed [27].

2.8. Potential Ecological Risk Assessment

To assess the pollution level of an environment, the identification between anthropogenic activities and the natural level of a given substance is important. Soil pollution assessment with heavy metals is possible using pollution indices to determine the provenance of such trace elements accumulated in the soil and calculating the respective ecological risk. The geo-accumulation index gives a direct evaluation of the extent of heavy metal accumulation in the soil. Such values are important to quantify the degree of anthropogenically or lithogenically accumulated contaminants in the studied areas. The Müller relationship is used to calculate the geo-accumulation index [29]. Different background concentration values for different world sediments are outlined in the reference document issued by Turekian and Wedepohl [30].
I geo = log 2 C n 1.5 ×   B n
where Cn is the metal concentration in the sample for each metal from this study, and Bn is the background level for individual metals, taken as 0.1 ppm, 11 ppm, 4 ppm, 1100 ppm, 20 ppm, 9 ppm, 20 ppm for Co, Cr, Cu, Mn, Ni, Pb, and Zn, respectively [30]. Seven classes of the geo-accumulation index are listed in Table 3.
The Contamination Factor (CF) represents the relationship between the concentration of the metal being tested and its corresponding background level. The Potential Ecological Risk Index is used to assess the degree of metal pollution in sediments according to the toxicity of metals and the response of the environment. It is calculated using the equation:
CF = C metal C background
E i = T i CF i
PERI = i = 0 n E i
where, Ei is the monomial potential ecological risk factor; Ti is the toxic response factor for a given substance; typical values include Co = 5, Cr = 2, Cu = 5, Pb = 5, Mn = 1, Ni = 5, Zn = 1 [29,31,32], and CFi is the contamination factor for each metal under study.
Table 4 describes the classification of resulting values for the risk index to better understand the overall effect of environmental contamination by the respective heavy metals.

3. Results and Discussion

3.1. Physical Analysis

Physical studies of bulk density and specific gravity on the soil tested indicated a high organic content owing to the soil natural nutrients, high porosity, and a crumbly texture, proving it healthy and abundant in microorganisms making it suitable for crop cultivation. This ties in with the alkalinity level found in literature for soil in Malta [3,15]. Results of the water content from both fields differed with changes in the weather conditions, since samples collected at the pre-harvesting stage were taken during the precipitation season and the post-harvesting stage were taken during summer. An average water content difference of 48.5% was recorded; hence, the solubility of soil minerals [7,11] could affect the bioavailability of the heavy metals concentrations reviewed.

3.2. Chemical Analysis

3.2.1. Descriptive Statistics

The concentrations of the heavy metals studied listed in decreasing order are Fe > Zn > Mn > Sr > Pb > Cu > Ni > Cr > Co as shown in the descriptive statistics for the pre- and post-harvesting results in Table 5. The concentration results obtained indicate primarily that the fields under study are not polluted by heavy metals since none of the concentrations quantified exceed reference limits set by legislation as documented in Table 6.
With reference to Table 6, micronutrients Fe, Zn, and Mn presented higher concentrations in agricultural soil while Cr and Co had the lowest values, which results match findings from Spain and Iraq reported by Micó, et al., (2006) and Salah, et al., (2015) [4,33] respectively. Upon comparison of means for each element reviewed during the post-harvesting stage, it is observed that all concentrations have decreased considerably, except for Sr content which has slightly increased. This reduction in concentration may be attributed to several physical environmental changes such as the weather, water content variation due to differences in seasons, pH levels in the soil and crop uptake of the heavy metals analyzed which varies according to the macronutrient content and the time of crop harvesting [11,15,39].
The average heavy metals concentrations for all samples collected over both sampling stages do not exceed the reference values for Malta outlined in the 86/278/EEC Directive for agricultural soils except for Zn content which average exceeds the limit values marginally. Another study carried out by Briffa (2020) about agricultural soil in Malta used Dutch and Finland reference values for concentration limits [37]. The concentration results obtained in this study are within these limit values except for Zn content. Compared to other studies carried out in the Mediterranean region shown in Table 6, Zn content was higher but still within the legislation range outlined. The closest documented results (with an exception to Zn) are the ones reported by Nunes, et al., (2014), which focused on soil from the Caia area in Portugal and Spain [35]. Further statistical analysis shall confirm whether the fields in this study are in fact polluted with high Zn content and aid in outlining possible Zn sources to remediate and reduce such contamination. The only study that determined Sr content is by Khatita, et al., (2020) but the values documented by this work are by far higher than found in this study [36]. No limit reference values were found for Sr content in agricultural soil.
The distributions at the pre-harvesting stage of Co and Ni are symmetrical since the skewness coefficient is close to zero. The other distributions are asymmetrical since a discrepancy between the mean and median values could be observed, and high values for the skewness coefficients resulted. From the post-harvesting stage analysis, the distributions of Sr and to a certain extent of Zn for Field A resulted symmetrical proving homogenous distributions. Cr is the only elemental distribution that is symmetrical and thus homogenous over Field B in both sampling stages. Non-point sources could be attributed to the origin of these homogenous distributions, such as air pollution effects from vehicle, aircraft emissions, industrial emissions, and urban dust. Serelis, et al., (2010) suggested that Co and Ni are derived from the parent material since their highest concentrations were recorded at a lower sampling depth (<25 cm) and both metals are usually rich in soil with high organic matter [34]. The other distributions for Fe, Zn, Mn, Sr, Pb, Cu, and Cr could be linked to the dumping of waste or inorganic material, falling hunting shots, and the use of paint and oil on site.
Upon analyzing the pre-harvesting and post-harvesting samples with the Kolmogorov–Smirnov tests, Cr is the only normal distribution in all the data with p = 0.143. This result could originate from the fact that Cr is found in an insoluble fraction of soil which makes up structural silicate minerals that are inert [16]. This links to the homogeneity of the Cr distribution across both fields reported in the descriptive statistics and matches similar results documented by Orrono and Lavado (2009) [16]. Sr content is marginally significant with p = 0.031 < 0.05.
Various hypotheses were analyzed using the Mann–Whitney U-test to check whether elemental concentrations had the same distributions across both fields at the pre-harvesting stage and the post-harvesting stage, or the same across Field A and Field B distinctively at the pre-harvesting and post-harvesting stages combined.
As shown in Table 7, the null hypothesis stating that the elemental distributions were the same across both fields was retained for Ni and Zn at the pre-harvesting stage (Mean Rank = 5.96, N = 50, U = 245, z = −1.089, p = 0.276 for Ni and Mean Rank = 24.97, N = 50, U = 364, z = 1.267, p = 0.205 for Zn) and for Fe and Zn at the post harvesting stage (Mean Rank = 25.59, N = 50, U = 289, z = −0.218, p = 0.828 for Fe and Mean Rank = 24.685, N = 50, U = 398, z = 1.941, p = 0.052 for Zn). It can be observed that Zn content is the same across Field A and Field B both at pre-harvesting and post-harvesting stages; thus, crop growth has not altered the widespread distribution of this element in the existing soil even though its concentration has decreased. Sr content has remained unchanged upon crop growth over Field A but has shown a slight increase in content between the pre-harvesting stage and post-harvesting stage. This could be affected by Sr solubility since this element tends to be highly mobile in the soil profile, depending on the physicochemical and mineralogical characteristics of the soil. Dubchak (2018) documented that an increase in Sr content is directly linked to an increase in exchangeable calcium content, an increase in soil acidity and an increase in organic matter content [40]. Dubchak (2018) stated that only a small fraction is taken up by crops from the soil to supply the physiochemical and physiological needs of the plant for adequate growth, which mostly affects root crops and legumes [40].

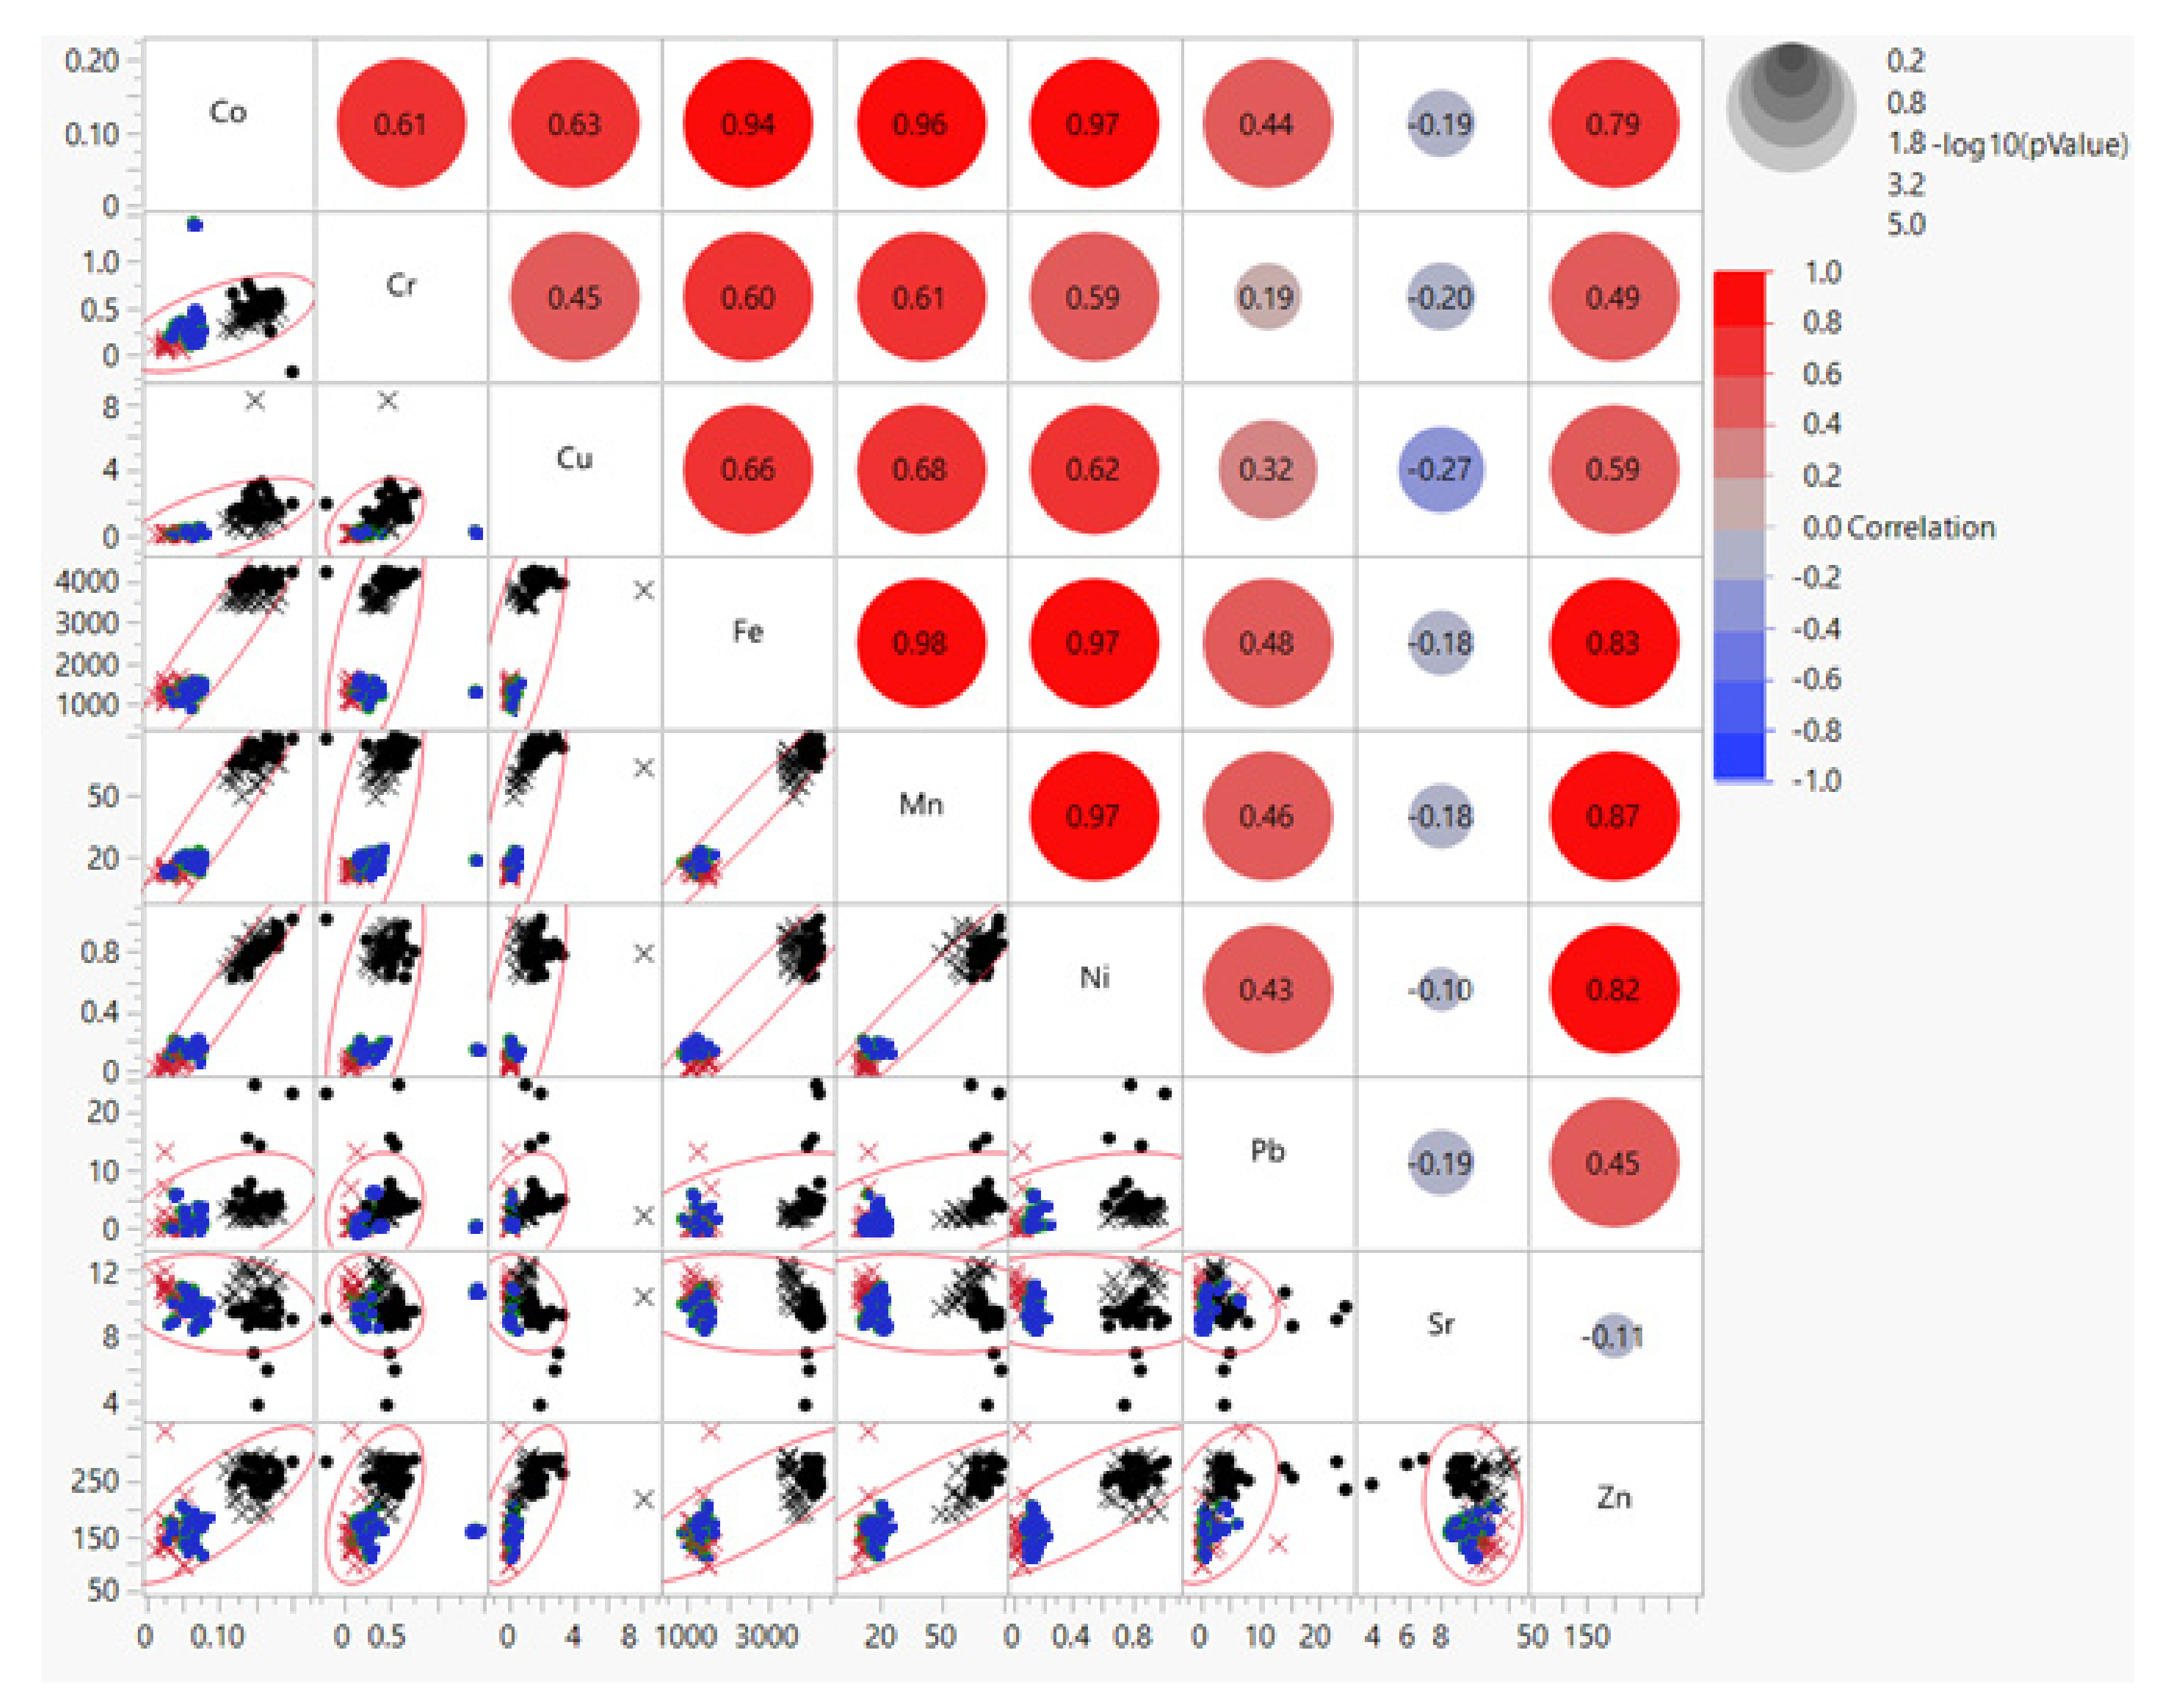
3.2.2. Correlation Analysis

A combined correlation analysis of the results obtained for the pre-harvesting and post-harvesting concentrations proved very strong linear relationships with r > 0.7 among most elements, hinting towards a common source for these naturally occurring elements as shown in Figure 1. Thus, upon the reduction of concentrations of elements in the soil, correlations among elements increased. This matches studies by Salah, et al. (2015) showing moderate correlations among Cu, Co, Pb, and Zn [33], and those published by Micó, et al. (2006) and Khatita, et al. (2020) [4,36].
Weak negative relations between each of the elements with Sr are observed consolidating the outcomes of the individual analysis carried out on the each of the sampling stages whereby, relations with Sr were also negatively represented. This proves that the behavior of Sr is different to that of the other elements, coinciding also with the results obtained from the Mann–Whitney U-test showing that Sr content remained the same or increased slightly across seasons in each of the fields. Weaker but positive relationships with Pb are also observed for all elements, the weakest being between Cr and Pb, with r = 0.19 from the multivariate correlations having a 95% confidence interval. This contrasts the results of the study by Stofejova’, et al. (2021) for which the correlation between Cr and Pb was a slightly weak negative relation with r = −0.343 [41]. These interactions have been reported using the multivariate correlations and match the results obtained using the Spearman’s Rho correlations analysis.

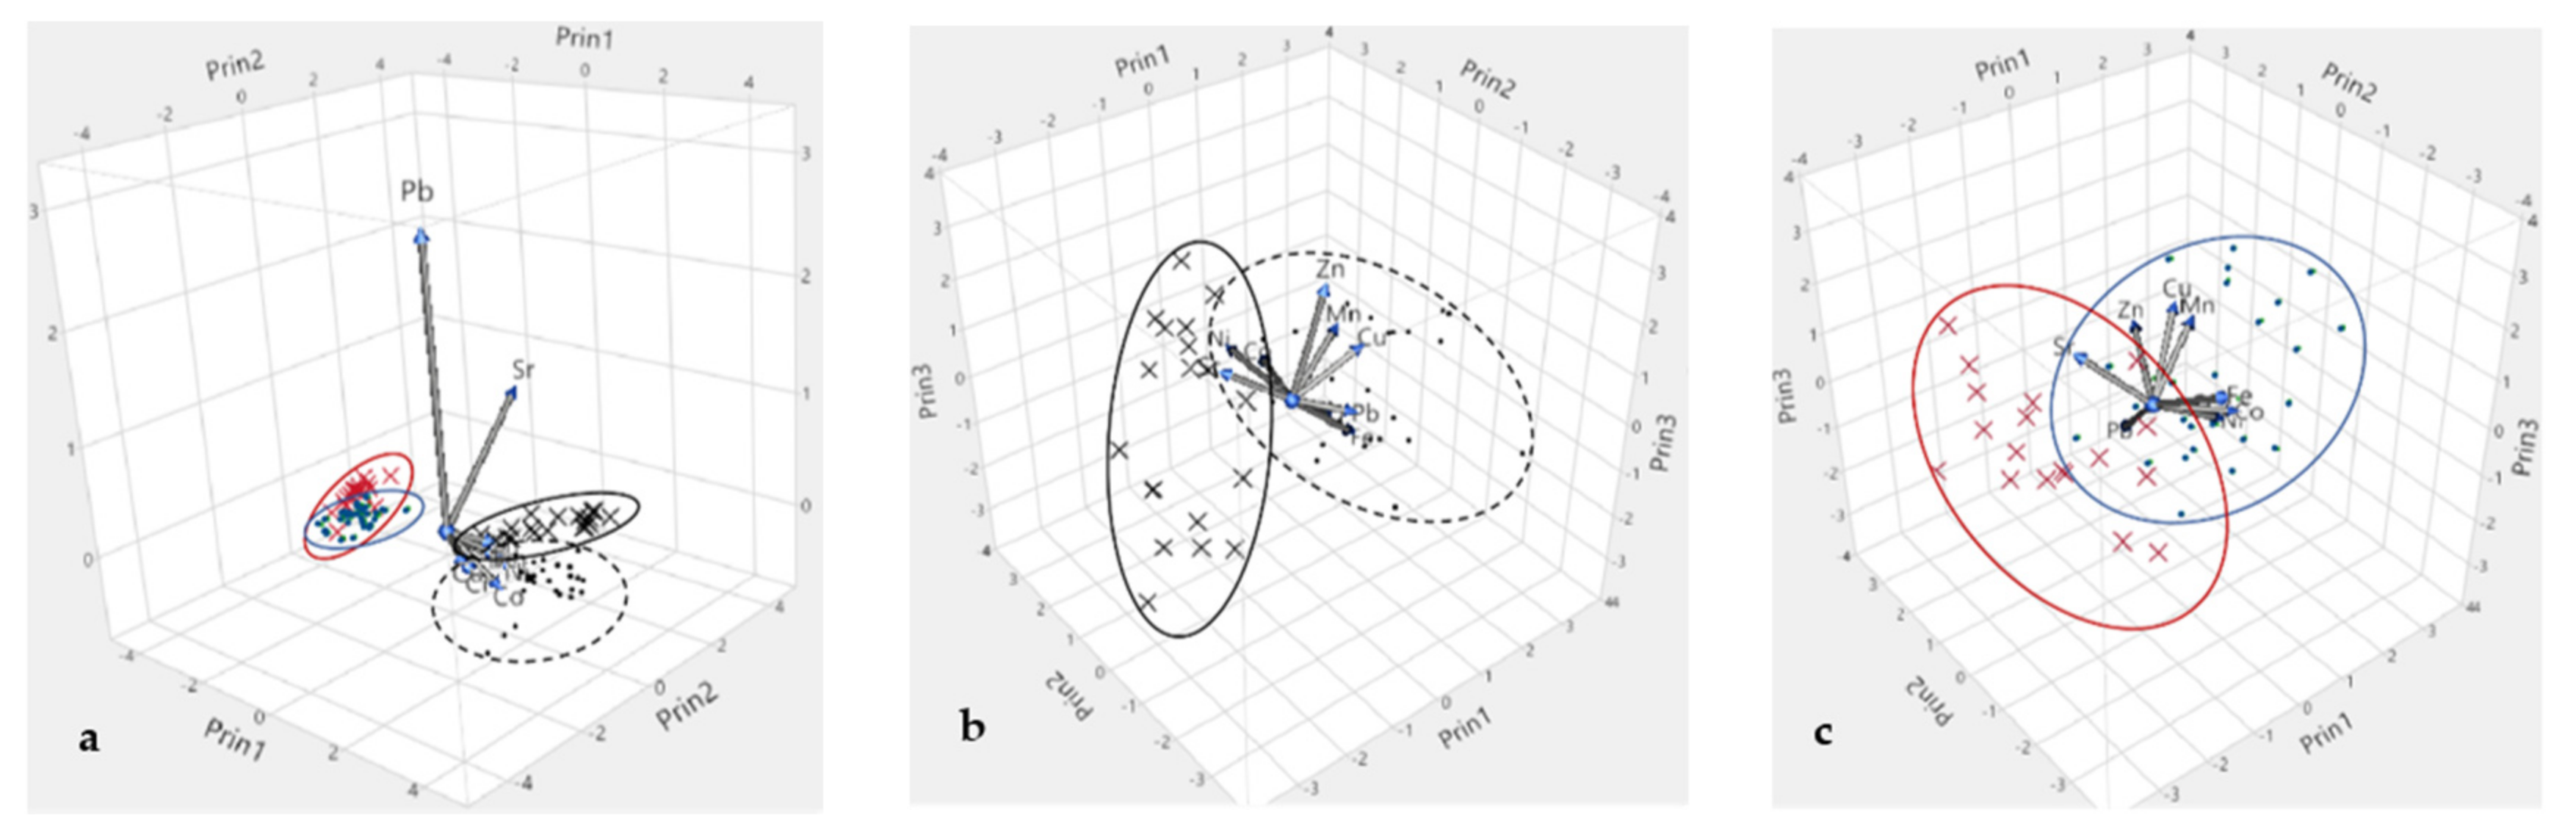
3.2.3. Multivariate Statistical Analysis

Chemometric studies showed an interdependency of the elemental concentrations in the soil matrix and their possible sources. The concentration outcomes were combined for PCA analysis to review the effect of varying concentration on the element dominance in the soil matrix. PCA was then conducted for the sets of results individually to analyze differences in loadings to obtain the elemental sources.
An eigenvalue of 380.277 with 98.322% and a cumulative percentage of 98.322% for PC1, while an eigenvalue of 6.488 with 1.678% and a cumulative percentage of 100.000% for PC2 for the combined analysis of pre-harvesting stage and post-harvesting stage were obtained. A variance of 5.911 and 1.017, a percentage variance of 65.678% and 11.296% and a cumulative percentage of 65.678% and 76.974% for Factor 1 and Factor 2, respectively, for the combined pre-harvesting and post-harvesting analysis of results was obtained as tabulated in Table 8a.
An eigenvalue of 22.707 with 65.859% and a cumulative percentage of 65.859% for PC1, while an eigenvalue of 11.7711 with 34.14% and a cumulative percentage of 100.000% for PC2 at pre-harvesting stage were obtained. A variance of 3.287 and 1.817, a percentage variance of 36.520% and 20.192% and a cumulative percentage of 36.520% and 56.712% for Factor 1 and Factor 2 respectively for the pre-harvesting results analysis shown in Table 8b.
An eigenvalue of 3.27 × 10⁸ with 100.000% and a cumulative percentage of 100.000% for PC1, while an eigenvalue of 5.518 with 0.000% and a cumulative percentage of 100.000% for PC2 at post-harvesting stage were obtained. A variance of 2.499 and 2.174, a percentage variance of 27.763% and 24.160% and a cumulative percentage of 27.763% and 51.924% for Factor 1 and Factor 2 respectively for the post-harvesting results analysis Table 8c.
Table 8. PCA initial loading matrix and rotated factor loadings matrix 2.
(a) Pre- & Post-Harvesting Stages(b) Pre-Harvesting Stage(c) Post-Harvesting Stage
PC1aPC2aF1aF2aPC1bPC2bF1bF2bPC1cPC2cF1cF2c
Co0.9520.1240.9670.1000.4430.8240.2410.8350.822−0.3430.7090.410
Cr0.9190.1340.8610.3290.7090.1140.5300.2140.8430.1110.6630.448
Cu0.893−0.1250.8070.2710.854−0.1590.8960.0300.7120.2840.2120.777
Fe0.893−0.2070.7350.5920.810−0.1170.6690.0370.229−0.6370.1990.072
Mn0.9700.1110.9580.2160.8640.1700.8570.3090.8280.1720.3100.951
Ni0.9850.1210.9610.2650.0600.951−0.1500.9640.864−0.1580.8180.359
Pb0.9540.2190.9950.0530.529−0.3730.468−0.1720.2720.5580.2050.031
Sr0.618−0.2810.4580.394−0.7160.297−0.6480.096−0.6840.351−0.812−0.066
Zn−0.2230.932−0.022−0.4460.458−0.0190.5500.0940.4070.5270.0780.399
2 PC1a, PC1b, PC1c—Principal Component 1 for the three results configurations; PC2a, PC2b, PC2c—Principal Component 2 for the three results configurations; F1a, F1b, F1c—Factor 1 for the three results configurations; F2a, F2b, F2c—Factor 2 for the three results configurations.
PC1 in Table 8a indicates the dominant element concentrations. Large loadings for Cr, Cu, Mn, and Sr prove that concentration effects are strong. PC1 in Table 8b,c can be interpreted as the indicator of anthropogenic sources for these elements, while PC2 suggests a lithogenic origin of the elements with high loadings.
It can be observed that the concentration of the elements has affected considerably the classification of the elements with their respective possible sources. Fertilizer addition and surrounding environmental pollutants have unbalanced the ecosystem, which was possibly at least partly restored after crop growth. Results from the pre-harvesting stage indicate that Cr, Cu, Fe, Mn, Pb, Sr, and Zn are associated to anthropogenic sources available which were present due to the precipitation of pollutants in the rain from the atmosphere, fertilizer addition to prepare the soil for crop cultivation, urban dust, and vehicle and industrial emissions. Post-harvesting results for the same elements suggest a prevalent lithogenic source or mixed with an anthropogenic one in the case of Cr, Fe, and Mn. It also resulted that Fe is only partially affected by the concentration available in the soil matrix. This is due to the high natural Fe content in the soil which was proven in the high loading assigned to Fe in the post-harvesting PCA and rotated factor loadings. These results tie in with studies from Micó, et al. (2006) [4] and Nunes, et al. (2014) [35], who suggest that Cr, Zn, Fe, and Mn are precipitated from the oxides and hydroxides of sedimentary rocks within the Mediterranean region and are present in areas which are of calcareous nature [4,41]; hence, consolidating a lithogenic nature towards these elements when a low quantity of added nutrients is present in the soil. A similar pattern is observed with Pb which results match perfectly those issued by Khatita, et al. (2020) [36].
Zn is the only element which for which a change in concentration between pre-harvesting and post-harvesting stage showed no particularly dominant link to its possible source. This is due to having high Zn concentration even available after growing crops. Such concentrations are probably affected by the accumulation of Zn content added anthropogenically over the years. Lithogenically, this owes its origin to the high natural Zn content in typical Mediterranean soils, while anthropogenic sources accounting for such accumulations including vehicle exhaust, combustion of fossil fuels, industrial emissions, and the leaching of wastewater [21,36].
Concentration variations for Sr content are dominant and PC2 values for pre-harvesting and post-harvesting stages prove that its sources are of natural form. The negative correlations obtained with the Spearman’s Rho and multivariate correlation analyses prove an inverse relation with the other elemental concentrations. Sr was attributed to the anthropogenic component in the work carried out by Khatita, et al. (2020) [36], and to radioactive sources by Dubchak (2018) [40]. As shown in the 3D scatter plots (Figure 2), Sr has a different coordinate loading from all other elements whose coordinates are closely grouped together. Sr is the most mobile element and since it can be present in a soluble or insoluble form, its uptake by plants during cultivation depends on its solubility state and thus its bioavailability [40].
Co and Ni loadings in both the PCA and factor loading matrix show that their sources differed with fluctuating concentrations. Initial loadings and factor rotations demonstrate a dominant lithogenic origin at the pre-harvesting stage with loadings >0.8, although an anthropogenic origin is present. This confirms results documented by Micó, et al. (2006) and Khatita, et al. (2020) but contrasts with those of Salah, et al. (2015) in the case of Co origins [4,33,36]. Loadings for Co and Ni with the post-harvesting stage analysis associate these elements to the anthropogenic source, although these are at a lower concentration. Such concentration variation in the results could have come about upon the combination with the surrounding activities in the vicinity of the fields, namely, from vehicular exhaust from neighbouring main roads, from the use of agricultural fertilizers which include natural manure for Field A and mineral fertilizer for Field B, from the leaching of wastewater which could possibly occur during precipitation seasons from neighbouring rabbit farms in the case of Field A, and from residues of fossil fuel combustion [18,33,35]. The latter source could be originating from an industrial zone in proximity of the fields, and from low flying aircraft at the airport which is close by. Increased activity during spring/summer months from such industry could possibly bring about such results. The overall analysis proves that Co and Ni content is not placing an anthropogenic negative effect on the soil because their effect was balanced out upon crop uptake.

3.3. Health Risk Assessment

HQ values calculated for adults and children (shown in Table 9) are all less than the benchmark value of unity, thus as referenced in literature by Anyanwu and Nwachukwu (2010), none of the heavy metals present in the soil for Field A and Field B present quantifiable adverse non-carcinogenic risks [24]. Since the Hazard Index (HI) is also less than unity, these non-carcinogenic adverse effects which may originate through soil ingestion and dermal contact are assumed to be negligible.
Cancer Risk (CR) values in Table 8 demonstrate that concentrations obtained through analysis pose very low cancer risk in both adults and children. The RI is also very low since the results obtained are below 10−6 [22,26], which suggests that the risk of cancer development is extremely low in any person exposed to the metallic elements reviewed, thus ensuring safety to the landowner and any persons farming the land, together with children who might visit the respective fields.
This health risk assessment study matches the outcome of concentration results for the heavy metals studied. None of the elements was higher than limit values set, and although Zn content was higher than documented in other studies, its content was still within the acceptable range; thus, its level of contamination was minimal.

3.4. Potential Ecological Risk Assessment

The calculations for the potential ecological risk assessment were based on the mean concentration values of the metals studied and the respective baseline values for carbonate sedimentary rock which is typical in the Maltese Islands [42]. With reference to the geo-accumulation index calculated, Zn is the only element posing contamination of a moderate/strong level on the fields studied, with a Class 3 level as shown in Table 2. All other elements have given a negative geo-accumulation index, proving not to be contaminating the fields. Zn is also the element with higher Contamination Factor (CF) and Potential Ecological Risk Index (Ei) values, thus demonstrating that Zn is the element, which is mostly contaminating the soil, but is overall posing a low potential ecological risk, since its Ei = 10.363 < 40, as established in Table 9.
These results tie in with those from the statistical analysis since Zn behaviour was not dependent on concentration variation and is of an anthropogenic accumulated nature. CF results also show that Zn is the most metal contaminating the soil, followed by Co. Statistical results for Co at the post-harvesting stage show that anthropogenic sources for this heavy metal were affecting the soils more than at the pre-harvesting stage. It is important to note that its geo-accumulation index is negative; thus, although its sources have not accumulated over time, these could still be anthropogenic. Its concentration factor and ecological risk factor prove that it possesses a very low potential of ecological risk, even though its value is higher than that of the other heavy metals assessed.
The value of Potential Ecological Risk Index (PERI) calculated for the fields under review demonstrates that the overall effect of the heavy metals in the soil portrays a low ecological risk potential to the environment. This proves that there was not any significant pollution level in the area studied and the pollution indices assessed showed a moderate pollution level of Zn.

4. Conclusions

The results obtained in this research increase the knowledge of heavy metals and their possible sources in Maltese agricultural soils. Physical studies have proven that the soil tested has a high organic content proving it healthy and abundant in natural nutrients making it adequate for crop cultivation. Concentrations obtained indicate that the fields under study are not polluted by heavy metals since none of the concentrations quantified exceed reference limits set by legislation. All elemental concentrations have decreased between the pre-harvesting and the post-harvesting sampling stages, proving the uptake of heavy metals by the growing crops from the soil matrix.
The PCA carried out on the nine heavy metals reviewed at the pre-harvesting and post-harvesting stages, identified by two principal components, demonstrate the concentration dependency of all the elements to their possible sources affecting agricultural soils, except for Zn, whose concentration was marginally high even after harvesting the crops. The geo-accumulation index proved that the fields are moderately/strongly contaminated with Zn content.
Results from the pre-harvesting stage indicate that Cr, Cu, Fe, Mn, and Pb are associated with anthropogenic sources available including the precipitation of pollutants in the rain from the atmosphere, fertilizer addition to prepare the soil for crop cultivation, urban dust, and vehicle and industrial emissions. Post-harvesting results for the same elements suggest a prevalent lithogenic source mixed with an anthropogenic one in the case of Cr, Fe, and Mn. Fe is only partially affected by the concentration available in the soil matrix due to the high natural Fe content typical of the soil. Results for Co and Ni reflect that, at the pre-harvesting stage, these elements were linked to a lithogenic origin, while at the post-harvesting stage their content was linked to an anthropogenic origin which could be originating from surrounding activities in the vicinity of the fields by neighboring industry, and other farming practices. Sr content, although concentration dependent, varies inversely to the other elements concentrations. Sr content remained relatively unchanged between the pre-harvesting and post-harvesting sampling stages hinting at natural sources.
A health risk assessment study associated with the heavy metal content observed, showed that the concentrations available in both fields do not pose a carcinogenic risk or a hazard to human health upon ingestion or inhalation of the soil being studied during exposure. An assessment of the potential ecological risks associated with heavy metals content in the soil have demonstrated that the area studied is not contaminated by any of the metals except for Zn which creates a moderate to strong contamination but gives an overall low potential ecological risk.

Supplementary Materials

The following supporting information can be downloaded at: https://www.mdpi.com/article/10.3390/app12063120/s1, Figure S1: Geographical information of the study areas and positioning of sampling points.

Author Contributions

Conceptualization, C.C. and F.L.; methodology, C.C. and F.L.; formal analysis, C.C. and F.L.; writing—original draft preparation, C.C. and F.L.; writing—review and editing, C.C. and F.L. All authors have read and agreed to the published version of the manuscript.

Funding

This research received no external funding.

Institutional Review Board Statement

Not applicable.

Informed Consent Statement

Not applicable.

Data Availability Statement

Not applicable.

Conflicts of Interest

The authors declare no conflict of interest.

References

  1. Hallett, S.; Sakrabani, R.; Thompson, A.; Deeks, L.; Knox, J. Improving Soil and Water Management for Agriculture: Insights and Innovation from Malta. MCAST J. Appl. Res. Pract. 2017, 1, 40–59. [Google Scholar] [CrossRef]
  2. Union, E. The EU Environmental Implementation Review 2019 Country Report—MALTA; European Commission: Brussels, Belgium, 2019. [Google Scholar]
  3. Environment and Resources Authority. Maltese Soils. 2020. Available online: https://era.org.mt/topic/maltese-soils/ (accessed on 20 May 2021).
  4. Micó, C.; Recatalá, L.; Peris, M.; Sánchez, J. Assessing heavy metal sources in agricultural soils of an European Mediterranean area by multivariate analysis. Chemosphere 2006, 65, 863–872. [Google Scholar] [CrossRef] [PubMed]
  5. Paul, E. Soil Microbiology, Ecology and Biochemistry, 4th ed.; Academic Press: Cambridge, MA, USA, 2015. [Google Scholar]
  6. Nortcliff, B.; Schulte-Bisping, L. Soil Definition, Function, and Utilization. In Ullmann’s Encyclopaedia; John Wiley & Sons: Hoboken, NJ, USA, 2011; pp. 400–420. [Google Scholar]
  7. Mulder, E.G.; VanVeen, W.L. Effect of Microorganisms on the Transformation of Mineral Fractions in Soil; Agricultural University: Wageningen, The Netherlands, 2010. [Google Scholar]
  8. Ladonin, D.V.; Karpukhin, M.M. Fractional Composition of Nickel, Copper, Zinc, and Lead Compounds in Soils Polluted by Oxides and Soluble Metal Salts. Eurasian Soil Sci. 2011, 44, 874–885. [Google Scholar] [CrossRef]
  9. Ghosh, M.; Devi, A. Assessment of crop growth, soil properties and crop yield in an upland acidic soil with inorganic fertilizer blended with organic amendments in summer rice cropping seasons. Int. J. Recycl. Org. Waste Agric. 2019, 8, S1–S9. [Google Scholar] [CrossRef] [Green Version]
  10. Pomazkina, L.V.; Semenova, Y.V. Effects of Climate Changes and Pollution with Heavy Metals on the Transformation of Carbon Compounds in Different Soil Types of Agroecosystems in the Forest-Steppe of Baikal Region. Eurasian Soil Sci. 2018, 51, 576–587. [Google Scholar] [CrossRef]
  11. Zhang, L.; Fu, K.; Yang, F.; Chen, Y.; Fu, C.; Huang, Y.; Guo, Z.; Li, T. Migration and Transformation of Heavy Metals in the Soil of the Water-Level Fluctuation Zone in the Three Gorges Reservoir under Simulated Nitrogen Deposition. J. Chem. 2021, 2021, 6660661. [Google Scholar] [CrossRef]
  12. O’Neill, P. Environmental Chemistry, 3rd ed.; Blackie Academic & Professional: London, UK, 1998. [Google Scholar]
  13. He, Z.L.; Yang, X.E.; Stoffella, P.J. Trace elements in agroecosystems and impacts on the environment. J. Trace Elem. Med. Biol. 2005, 19, 125–140. [Google Scholar] [CrossRef]
  14. Markiewicz-Patkowska, J.; Hursthouse, A.; Przybyla-Kij, H. The interaction of heavy metals with urban soils: Sorption behaviour of Cd, Cu, Cr, Pb and Zn with a typical mixed brownfield deposit. Environ. Int. 2005, 31, 513–521. [Google Scholar] [CrossRef]
  15. Zwolak, A.; Sarzyńska, M.; Szpyrka, E.; Stawarczyk, K. Sources of Soil Pollution by Heavy Metals and Their Accumulation in Vegetables: A Review. Water Air Soil Pollut. 2019, 230, 164. [Google Scholar] [CrossRef] [Green Version]
  16. Orroño, D.I.; Lavado, R.S. Distribution of extractable heavy metals in different soil fractions. Chem. Speciat. Bioavailab. 2009, 21, 193–198. [Google Scholar] [CrossRef]
  17. CustomWeather, Valletta Weather History. 2021. Available online: https://www.timeanddate.com/weather/malta/valletta/historic?month=11&year=2020 (accessed on 28 July 2021).
  18. Radojevic, M.; Bashkin, V. Practical Environmental Analysis, 2nd ed.; The Royal Society of Chemistry: Dorset, UK, 2006. [Google Scholar]
  19. Sarkar, D.; Haldar, A. Physical and Chemical Methods in Soil Analysis; New Age International (P) Ltd.: New Delhi, India, 2005. [Google Scholar]
  20. Shugar, G.; Ballinger, J. Chemical Technicians’ Ready Reference Handbook, 4th ed.; McGraw-Hill Inc.: New York, NY, USA, 1996. [Google Scholar]
  21. Sanz-Medel, A.; Pereiro, R. Atomic Absorption Spectrometry: An Introduction, 2nd ed.; Momentum Press, LLC: New York, NY, USA, 2014. [Google Scholar]
  22. Agoro, M.A.; Adeniji, A.O.; Adefisoye, M.A.; Okoh, O.O. Heavy Metals in Wastewater and Sewage Sludge from Selected Municipal Treatment Plants in Eastern Cape Province, South Africa. Water 2020, 12, 2746. [Google Scholar] [CrossRef]
  23. Adamiec, E.; Jarosz-Krzemińska, E. Human Health Risk Assessment associated with contaminants in the finest fraction of sidewalk dust collected in proximity to trafficked roads. Sci. Rep. 2019, 9, 16364. [Google Scholar] [CrossRef]
  24. Anyanwu, E.D.; Nwachukwu, E.D. Heavy metal content and health risk assessment of a South-eastern Nigeria River. Appl. Water Sci. 2020, 10, 209–210. [Google Scholar] [CrossRef]
  25. USEPA IRIS (US Environmental Protection Agency)’s Integrated Risk Information System. Environmental Protection Agency Region I; United States Environmental Protection Agency: Washington, DC, USA, 2011.
  26. Liang, Y.; Yi, X.; Dang, Z.; Wang, Q.; Luo, H.; Tang, J. Heavy Metal Contamination and Health Risk Assessment in the Vicinity of a Tailing Pond in Guangdong, China. Int. J. Environ. Res. Public Health 2017, 14, 1557. [Google Scholar] [CrossRef] [Green Version]
  27. Mohammadi AA Zarei, A.; Majidi, S.; Ghaderpoury, A.; Hashempour, Y.; Saghi, M.H.; Ghaderpoori, M. Carcinogenic and non-carcinogenic health risk assessment of heavy metals in drinking water of Khorramabad, Iran. MethodsX 2019, 6, 1642–1651. [Google Scholar] [CrossRef]
  28. Salhotra, A.M. Chapter Ten—Human Health Risk Assessment for Contaminated Properties. Prog. Mol. Biol. Transl. Sci. 2012, 112, 285–306. [Google Scholar]
  29. Rouhani, A.; Shahivand, R. Potential ecological risk assessment of heavy metals in archaeology on an example of the Tappe Rivi (Iran). SN Appl. Sci. 2020, 2, 1277. [Google Scholar] [CrossRef]
  30. Turekian, K.; Wedepohl, K. Distribution of the Elements in Some Major Units of the Earth’s Crust. Geol. Soc. Am. Bull. 1961, 72, 175–192. [Google Scholar] [CrossRef]
  31. Negahban, S.; Mokarram, M. Potential Ecological Risk Assessment of Ni, Cu, Zn, Cd, and Pb in Roadside Soils. Earth Space Sci. 2021, 8, e2020EA001120. [Google Scholar] [CrossRef]
  32. Al-Edresy, M.; Wasel, S.; Al-Hagibi, H. Ecological risk assessment of heavy metals in coastal sediments between Al-Haymah and Al-Mokha, south red sea, Yemen. Int. J. Hydrol. 2019, 3, 159–173. [Google Scholar] [CrossRef] [Green Version]
  33. Salah, E.; Turki, A.; Mahal, S.N. Chemometric Evaluation of the Heavy Metals in Urban Soil of Fallujah City, Iraq. J. Environ. Prot. 2015, 6, 1279–1292. [Google Scholar] [CrossRef] [Green Version]
  34. Serelis, K.; Kafkala, I.; Parpodis, K.; Lazaris, S. Anthropogenic and Geogenic Contamination Due to Heavy Metals in the Vast Area of Vari, Attica. Bull. Geol. Soc. Greece 2017, 43, 2390–2397. [Google Scholar] [CrossRef] [Green Version]
  35. Nunes, J.R.; Ramos-Miras, J.; Lopez-Piñeiro, A.; Loures, L.; Gil, C.; Coelho, J.; Loures, A. Concentrations of Available Heavy Metals in Mediterranean Agricultural Soils and their Relation with Some Soil Selected Properties: A Case Study in Typical Mediterranean Soils. Sustainability 2014, 6, 9124–9138. [Google Scholar] [CrossRef] [Green Version]
  36. Khatita, A.; Koch, R.; Bamousa, A. Sources identification and contamination assessment of heavy metals in soil of Middle Nile Delta, Egypt. J. Taibah Univ. Sci. 2020, 14, 750–761. [Google Scholar] [CrossRef]
  37. Briffa, J. Heavy Metals in Maltese Agricultural Soil, Malta. University of Malta Library. 2020. Available online: https://www.um.edu.mt/library/oar/handle/123456789/73391 (accessed on 17 May 2021).
  38. European Commision, DG Environment. Final Implementation Report for Directive 86/278/EEC on Sewage Sludge: 2013–2015. 2018. Available online: https://ec.europa.eu/environment/archives/waste/reporting/pdf/Final_Implementation_Report_2013_2015_Sewage_Sludge.pdf (accessed on 11 June 2021).
  39. Xie, Y.; Fan, J.; Zhu, W.; Amombo, E.; Lou, Y.; Chen, L.; Fu, J. Effect of Heavy Metals Pollution on Soil Microbial Diversity and Bermudagrass Genetic Variation. Front. Plant Sci. 2016, 7, 755. [Google Scholar] [CrossRef] [PubMed]
  40. Dubchak, S. Distribution of Strontium in Soil: Interception, Weathering, Speciation, and Translocation to Plants. In Behaviour of Strontium in Plants and the Environment; Gupta, D., Walther, C., Eds.; Springer: Cham, Switzerland, 2018. [Google Scholar] [CrossRef]
  41. Štofejová, L.; Fazekaš, J.; Fazekašová, D. Analysis of Heavy Metal Content in Soil and Plants in the Dumping Ground of Magnesite Mining Factory Jelsava-Lubenik (Slovakia). Sustainability 2021, 13, 4508. [Google Scholar] [CrossRef]
  42. Pedley, H.M.; House, M.R.; Waugh, B. The geology of Malta and Gozo. Geol. Assoc. 1976, 87, 325–341. [Google Scholar] [CrossRef]
Figure 1. Scatter plot on multivariate correlations—Pre-harvesting and Post-harvesting stages. (Key: × represents data from Field A pre-harvesting stage; • represents data from Field B pre-harvesting stage; × represents data from Field A post-harvesting stage; represents data from Field B post-harvesting stage.)
Applsci 12 03120 g001
Figure 2. 3D Scatterplot showing Principal 1, Principal 2, and Principal 3: (a) Pre-harvesting and Post-harvesting stages; (b) Pre-harvesting stage; (c) Post-harvesting stage. (Key: × represents data from Field A pre-harvesting stage encircled in a black cluster; • represents data from Field B pre-harvesting stage encircled in a black dashed cluster; × represents data from Field A post-harvesting stage encircled in a red cluster; represents data from Field B post-harvesting stage encircled in a blue cluster.
Applsci 12 03120 g002
Table 1. Parameter values used to compute average daily dose by ingestion and dermal contact [22,23].
ParameterSymbolUnitAdult ValueChildren Value
Ingestion RateIRingestmg/day100200
Exposure FrequencyEFdays/year350350
Exposure DurationEDyears306
Average Body WeightBWkg7015
Non-Carcinogens Averaging TimeAT = ED × 365days10,9502190
Carcinogens Averaging TimeAT = 70 years × 365days25,55025,550
Unity Conversion FactorCFkg/mg1 × 10−61 × 10−6
Exposed Skin AreaSAcm257002800
Adherence FactorAFmg/cm30.070.07
Dermal Absorption FractionABS/0.0010.001
Table 2. RFD and SF values for heavy metals [22,24,25,26].
MetalRFD 1 by Ingestion (Mg/Kg/Day)RFD 1 by Dermal Contact (Mg/Kg/Day)Slope Factor (Mg/Kg/Day)
Fe0.007Not foundNot found
Mn0.014Not foundNot found
Zn0.3000.060Not found
Cr3.000 × 10−36.000 × 10−50.500
Ni0.0205.400 × 10−30.910
Pb3.5 × 10−35.25 × 10−40.085
Cu0.0400.012Not found
1 RFD is the reference dose for each heavy metal.
Table 3. Classification of geo-accumulation index (Igeo) [29].
Geo-Accumulation Index LevelIgeo ClassIgeo Value
Uncontaminated0Igeo ≤ 0
Uncontaminated/moderately contaminated10 < Igeo < 1
Moderately contaminated21 < Igeo < 2
Moderately/strongly contaminated32 < Igeo < 3
Strongly contaminated43 < Igeo < 4
Strongly/extremely contaminated54 < Igeo < 5
Extremely contaminated65 < Igeo
Table 4. Classification for the Potential Ecological Risk Factor (Ei) [29].
Risk Factor LevelEi Value
Low potential ecological riskEi < 40
Moderate potential ecological risk40 ≤ Ei < 80
Considerable potential ecological risk80 ≤ Ei < 160
High potential ecological risk160 ≤ Ei < 320
Very high potential ecological risk320 ≤ Ei
Table 5. Descriptive statistics of heavy metal contents in soil in μg/g—Pre-harvesting and Post-harvesting stages.
VariableSymbolUnitDescriptive Statistics
Pre-Harvesting ConcentrationsPost-Harvesting ConcentrationsMeanStandard Deviation
CobaltCoμg/g0.1500.0470.1000.055
ChromiumCrμg/g0.4500.1970.3390.214
CopperCuμg/g1.4560.1080.8181.092
IronFeμg/g3814.549729.8292594.4011290.501
ManganeseMnμg/g66.33815.11841.89827.021
NickelNiμg/g0.8240.09150.4610.370
LeadPbμg/g4.3731.3313.0344.026
StrontiumSrμg/g10.05010.1979.9691.236
ZincZnμg/g254.888157.437207.26259.237
Table 6. Heavy metals contents in Mediterranean soils.
ElementMean
Concentrations in This Study (mg/g)
Study From Spain by
Micó, et al. (2006) (mg/Kg) [4]
Study from Iraq by
Salah, et al. (2015) (mg/Kg) [33]
Study from Greece by
Serelis, et al. (2010) (mg/Kg) [34]
Study from Portugal-Spain Border by
Nunes, et al. (2014) (mg/Kg) [35]
Study from Egypt by
Khatita, et al. (2020) (ppm) [36]
Concentration target Values for Soil (ppm) [37] Target Values for Malta by 86/278/EEC (mg/Kg) [38]
Co0.10073.4308.300-3120-
Cr0.3392711.590-0.850128100-
Cu0.818232.010-1.23061.80036100
Fe2594.40113,608235.770--62,583--
Mn41.898295---1099200-
Ni0.461218.9609.4301.95070.6003570
Pb3.034233.820161.3603.16030.70085100
Sr9.969----308--
Zn207.262535.5003.5200.64014350200
Table 7. Hypothesis Test Summary for Mann–Whitney U-Tests for Field A and Field B—Pre-harvesting and Post-harvesting stages.
ElementsHypothesis 1: The Distribution Is the Same Across Field A & Field B.Hypothesis 2a: The Distribution Is the Same Across Field A.Hypothesis 2b: The Distribution Is the Same Across Field B.
Pre-HarvestingPost-HarvestingPre- & Post-HarvestingPre- & Post-Harvesting
CoRejectedRejectedRejectedRejected
CrRejectedRejectedRejectedRejected
CuRejectedRejectedRejectedRejected
FeRejectedRetained (0.828)RejectedRejected
MnRejectedRejectedRejectedRejected
NiRetained (0.276)RejectedRejectedRejected
PbRejectedRejectedRejectedRejected
SrRejectedRejectedRetained (0.165)Rejected
ZnRetained (0.205)Retained (0.052)RejectedRejected
Test significance level is 0.05.
Table 9. Results for the Health Risk Assessment and the Potential Ecological Risk Assessment variables 3.
ElementMean
Concentration
(mg/g)
HQadultsCRadultsHQchildrenCRchildrenIgeoCFEi
Co0.100N/A *N/A *N/A *N/A *−0.5841.0015.005
Cr0.3397.951 × 10−59.982 × 10−81.298 × 10−41.858 × 10⁻⁷−5.6060.0310.062
Cu0.8181.216 × 10−5N/A *2.248 × 10⁻⁵N/A *−2.8750.2041.022
Fe2594.401N/A *N/A *N/A *N/A *−1.1360.683N/A **
Mn41.898N/A *N/A *N/A *N/A *−5.2990.0380.038
Ni0.4611.374 × 10−52.475 × 10−72.537 × 10−54.606 × 10⁻⁷−6.0230.0230.115
Pb3.0345.225 × 10−41.520 × 10−89.563 × 10−42.829 × 10⁻⁸−2.1540.3371.686
Sr9.969N/A *N/A *N/A *N/A *−6.5200.016N/A **
Zn207.2624.137 × 10−4N/A *7.608 × 10⁻⁴N/A *2.78810.36310.363
HIadults1.042 × 10−3
HIchildren1.895 × 10−3
RIadults3.625 × 10−7
RIchildren6.746 × 10−7
PERI18.291
3 HQ represents the Hazard Quotient; CR represents the Cancer Risk values; Igeo represents the geo-accumulation index for each heavy metal; CF represents the carcinogenic factor; Ei represents the Potential Ecological Risk Index. * Ingestion Rate values required for the computation of HQ and CR respectively were not documented. ** Toxic response factor values for the respective elements were not documented in other researched studies.
Publisher’s Note: MDPI stays neutral with regard to jurisdictional claims in published maps and institutional affiliations.

