Article

A Method for Maximum Coverage of the Territory by Sensors with Minimization of Cost and Assessment of Survivability

1
Software Systems and Technologies Department, Faculty of Information Technologies, Taras Shevchenko National University of Kyiv, Bohdan Hawrylyshyn Str. 24, 01001 Kyiv, Ukraine
2
Department of Computer Science and Automatics, Faculty of Mechanical Engineering and Computer Science, University of Bielsko-Biala, 2 Willowa, 43-309 Bielsko-Biala, Poland
*
Author to whom correspondence should be addressed.
Appl. Sci. 2022, 12(6), 3059; https://doi.org/10.3390/app12063059
Submission received: 20 February 2022 / Revised: 13 March 2022 / Accepted: 15 March 2022 / Published: 17 March 2022

Abstract

:
In the modern technological world, there are several key factors in the construction of sensor networks. These include maximizing the coverage and minimizing the cost of the network. Like any information system, the sensor network must also meet the conditions of survivability. This is why the development of a method for assessing the survivability of the sensor network is also a key factor. The purpose of this study is to develop a method to establish the maximum coverage of the territory of the sensor network at minimum cost with the ability to assess the survivability of the network. Coverage maximization while minimizing the network’s cost is achieved by finding the optimal pair of values of the coverage radius and the level of the intersection of coverage areas. These values are found by solving a nonlinear multicriteria optimization problem with the use of the genetic algorithm. The designed method for estimating the survivability of sensor networks takes into account not only the importance of network components but also the bandwidth of the network elements. The result of using the proposed methods is a set of Pareto optimal pairs of values of the radii of coverage and the value of the intersection of the coverage areas. In the case of network survivability assessment, the result, in addition to the percentage assessment, is a set of vulnerable sensors and network communication channels. The proposed network survivability estimation method improved the estimation accuracy by 18% compared to methods used in previous works.

1. Introduction

Nowadays, sensors and sensor networks have become widespread in all areas of human activity. The use of sensors is extensive due to their many advantages including small size, different measured values, easy software development, low energy consumption, mobility, and lifetime. Additionally, many tasks such as data collecting, analysis, identification, and measuring can be resolved with the use sensors [1,2], and sensors are a part of worldwide concepts and technologies such as the Internet of Things, Internet of Everything, and smart dust [3,4].
Sensor networks must be able to maximize coverage and energy efficiency. Due to the use of high-tech materials and technologies in the production of sensors, the cost of sensors and their maintenance is increasing. Thus, minimizing the cost of the network must be added to the conditions that the sensor network must meet. This condition can be achieved by reducing the number of sensors used, which can reduce the area covered. The intersection of the sensor coverage areas should also be taken into account as this also affects the number of sensors in the coverage area and the total cost of the network. Thus, the problem is to find the optimal ratio of the radius of coverage and the value of the intersection of coverage areas at which the maximum coverage of the territory is achieved at the minimum cost of the network. An important property of any information system is survivability. Thus, the assessment of network survivability and finding vulnerable network components is an important step in the design and usage of sensor networks.
The aim of this work is to develop a method of building sensor networks of minimum cost and maximum coverage with the ability to assess survivability and find vulnerable components in the network.

2. Literature Review

The authors of a previous study [5] proposed a method for infrared and camera sensor fusion, which was applied to indoor positioning in intelligent spaces. The fused position was obtained with a maximum likelihood estimator from the independent observations of infrared and camera sensors. However, the authors did not take into account the intersection of the sensors’ coverage areas. In [6], a method for optimal coverage of the territory by sensors with different coverage radii was proposed. To solve this problem, the authors modified the least squares method. The criterion for optimality is the maximum coverage of the territory with a minimum intersection of coverage areas. The possibility of changing the intersection value and square of the uncovered territory was not mentioned. In [7], an algorithm for an aerial sensor network composed of fixed-wing unmanned aerial vehicles that perform surveillance and detect the early signs of wildfire in a given territory was presented. The main goal was to cover a given area while prioritizing areas of higher fire hazard risk. The authors did not take into account the value of the uncovered area. The authors of [8] focused on optimizing the placement of sensors to solve the problem of critical network coverage with two goals: accuracy and cost. However, the authors did not take into account the cost of the networks and elements of the networks. In order to enhance the network coverage range, in [9], an instance (node) redeployment-based Bodacious-instance coverage mechanism (BiCM) was proposed. The proposed mechanism creates new instance positions in the coverage area; however, the authors did not take into account the uncovered area and the network’s cost.
According to the authors of [10], the use of low-cost sensor networks is becoming increasingly popular in the environmental sciences, and the unprecedented amounts of monitoring data that are generated enable research across a wide spectrum of disciplines and applications. In [11], a mechanism based on probabilistic blacklisting is proposed for Internet of Things networks, which results in lowering power consumption. In particular, channels suffering from non-negligible disturbance may be skipped based on the perceived quality of communication so as to increase the reliability and decrease the likelihood that retransmissions have to be performed. In [12], the authors considered the optimization of the neighbor discovery to reduce the power consumption in wireless sensor networks and proposed an energy-efficient neighbor discovery scheme by adapting symmetric block designs, combining block designs, and utilizing the concept of activating nodes based on the multiples of a specific number. However, the network’s survivability was not mentioned. As shown in other research [13,14], modern sensor networks have become more and more expensive.
Due to the challenges of the modern technological world, survivability is an important parameter for information systems. Survivability is a property that characterizes the ability of a system to function effectively in the presence of damage or to restore this ability over a period of time. There is structural and functional survivability. A structure-based identification method to identify the influential nodes in industrial networks was proposed in [15]. The authors only identified vulnerable nodes, but connections between nodes can also be vulnerable. The authors of [16] present an approach to estimate the survivability of a sensor network based on Dijkstra and Lee algorithms; however, they did not take the bandwidth of network elements into account. The estimation of network viability using Markov chains is presented in [17]. In this work, the sensor network’s survivability was not taken into account.
Table 1 presents a comparison of the studies found in the literature review, the main focus/outcome of the study and the factors that were not taken into account.
Based on the studies reviewed above, it can be concluded that the deployment of cost-effective sensor networks with the ability to assess survivability is an urgent problem.

3. Materials and Methods

A description of the notation used in this article is presented in Table 2.
The task of maximizing the coverage of the sensor network while minimizing the cost and assessing the survivability will be solved in two steps. The first step is to find the optimal parameters of the network and territory coverage construction. The second step is an assessment of the survivability of the obtained network.
To find the optimal parameters of the network and for the construction of territory coverage, we consider an area of arbitrary shape with an area that is equal to T s m2. This area should be covered by sensors with a radius of coverage r m. The coverage area of one sensor is denoted as S 1 . The cost of the entire network will be equal to the number of network sensors multiplied by the cost of one sensor. The cost of the sensor is understood as the total costs associated with the purchase, operation and maintenance of the sensor. The cost of one sensor is denoted as P 1 , and the area of the covered area as S c o v e r e d . Thus, the task of minimizing the cost of the network with maximization of coverage can be presented as:
{ P = N P 1 m i n S c o v e r e d m a x .
In Equation (1), N is the number of sensors, which is calculated as follows:
N = [ T s S 1 ] ,
where T s —area of the territory, S 1 —the area covered by one sensor.
To find the exact number of sensors, the possibility of the intersection of the sensor coverage areas and the size of the uncovered area should be taken into account. Therefore, the coverage area of one sensor should not be considered as π r 2 . In our assumption, the coverage area of one sensor is calculated as the area of the square described around a circle with a coverage radius r as follows:
S 1 = 4 r 2 .
This assumption was introduced specifically to take into account the uncovered area around the sensor when calculating the number of sensors.
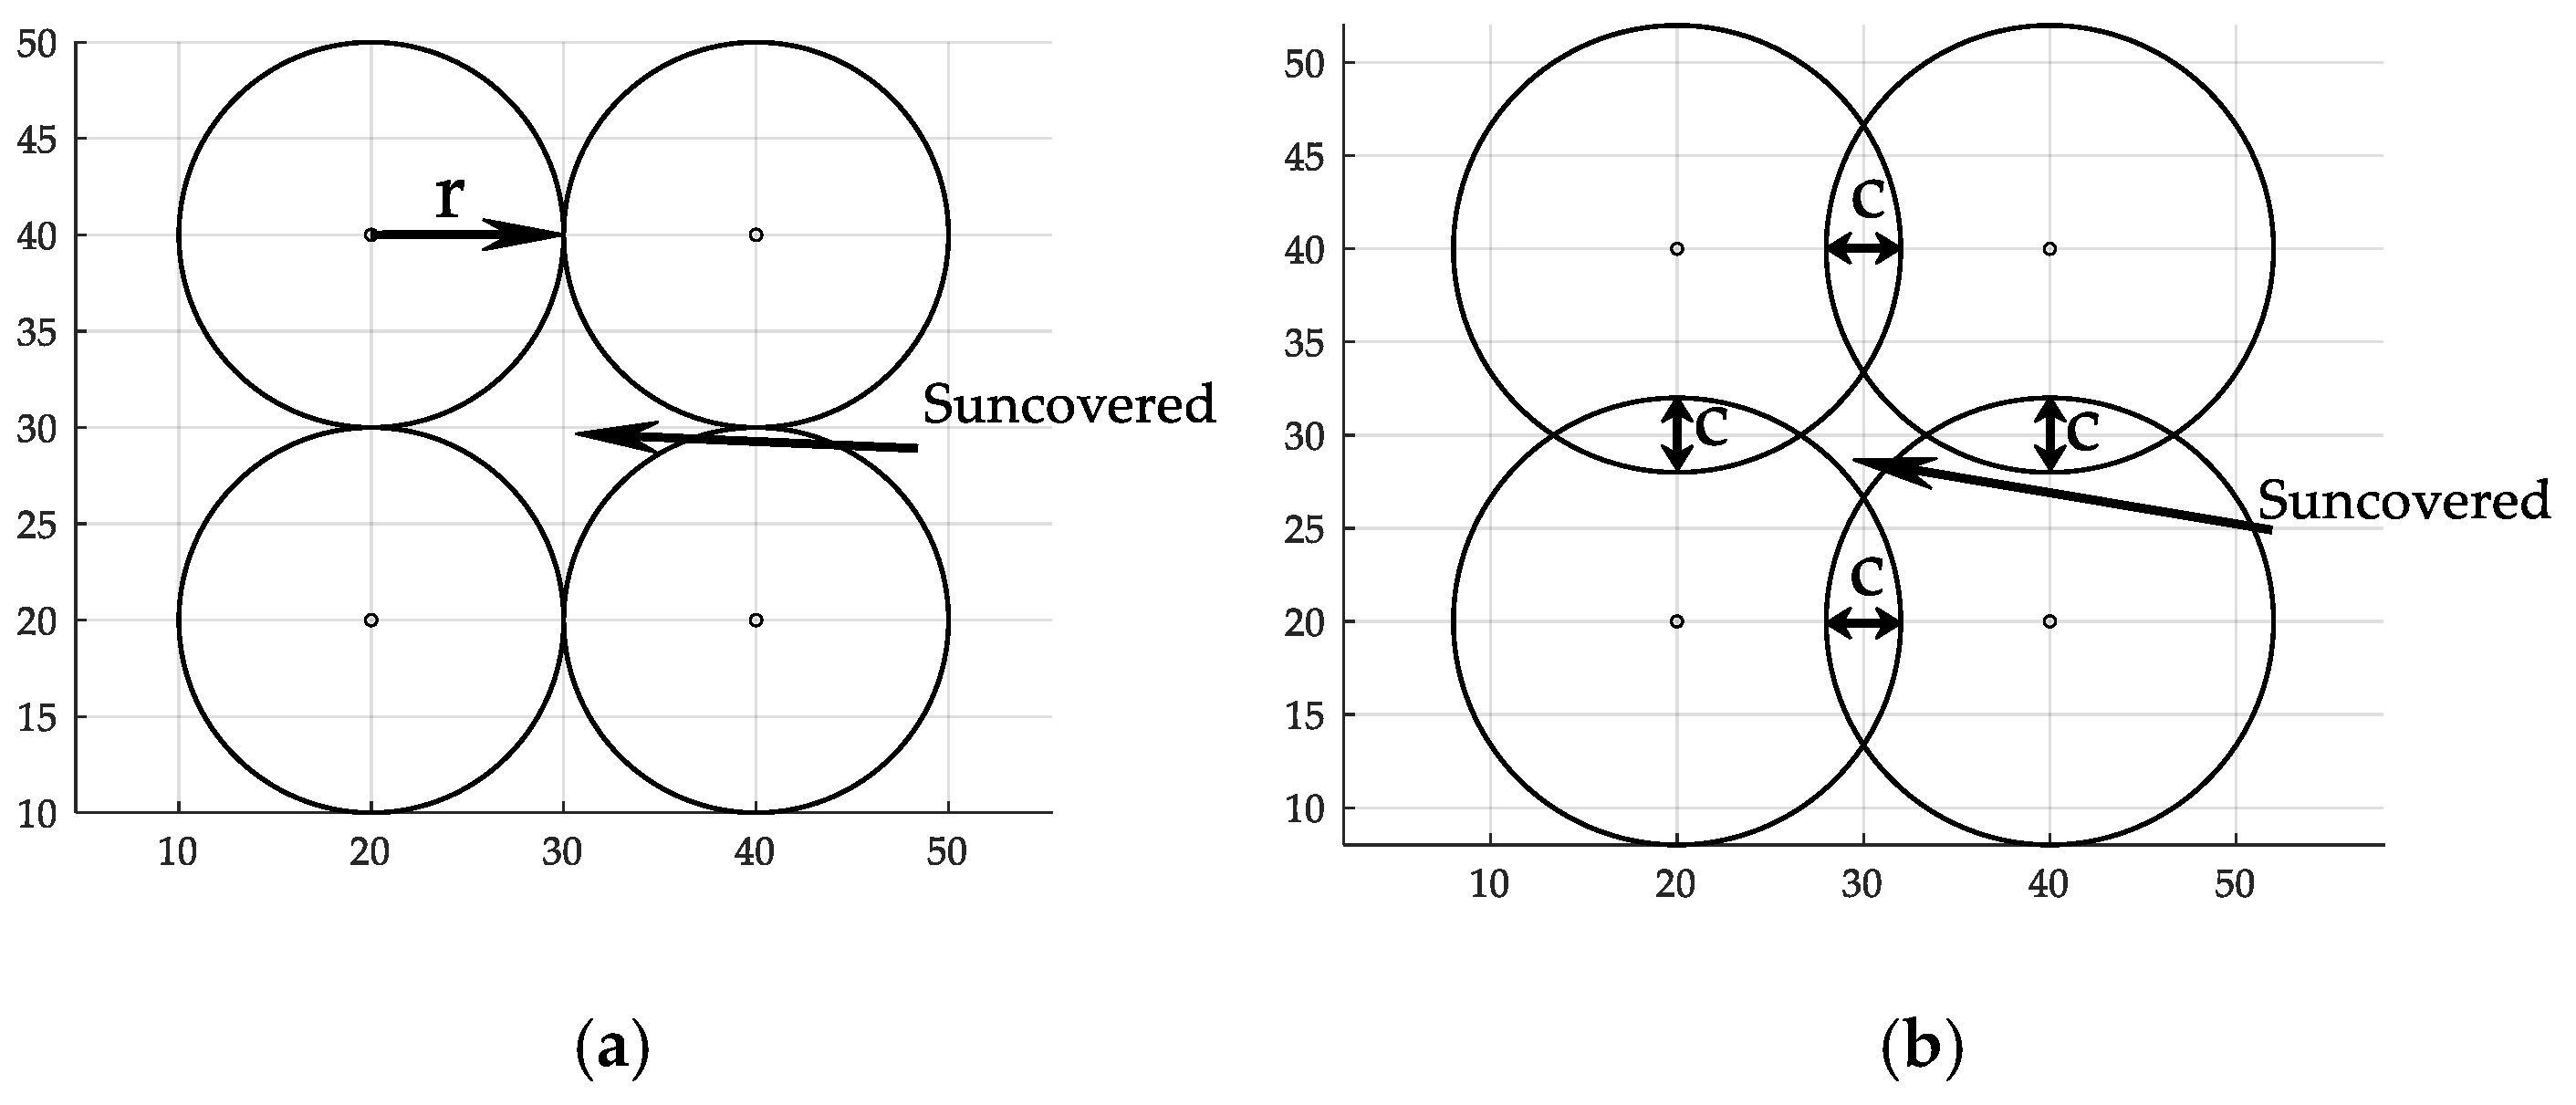
For example, we considered the case of coverage of the territory with four sensors with the intersection of coverage areas. This situation can be schematically represented as shown below in Figure 1.
According to Figure 1a, the value of the uncovered territory can be calculated as the difference between the area of a square with a side of 2 r and the area of four segments with an angle of 90 degrees as follows:
S u n c o v e r e d = ( 2 r ) 2 4 π r 2 90 360 0.86 r 2 .
In Figure 1b, the value c is an intersection level of the sensors’ coverage areas. Taking into account value c , values covered by one sensor area Equation (3) and uncovered territory Equation (4) can be calculated as follows:
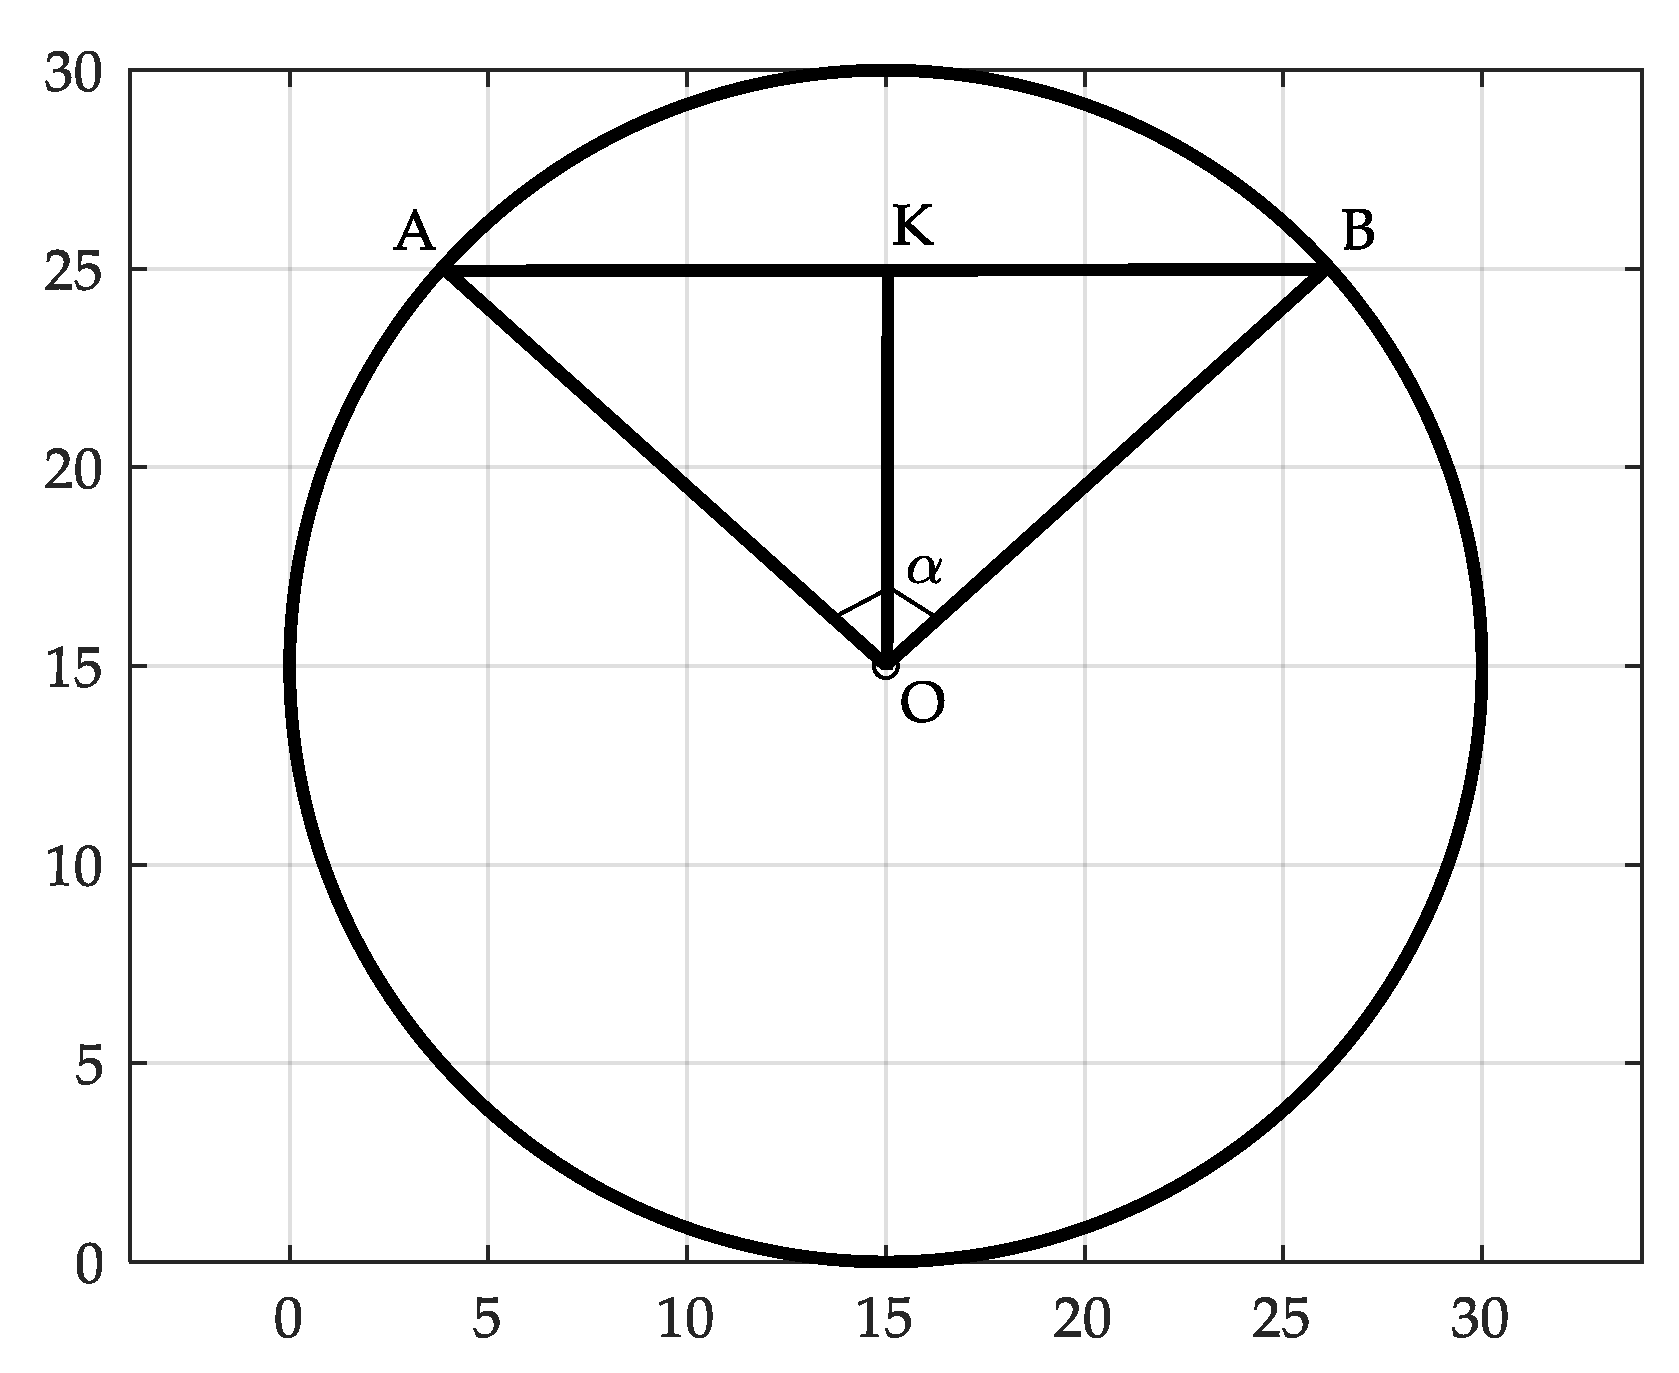
S 1 = ( 2 r c ) 2 ,
S u n c o v e r e d = ( 2 r c ) 2 ( π r 2 2 S ( c ) ) .
In Equation (6), S ( c ) is the value of the area of intersection of the coverage areas with intersection level c . This value is equal to twice the area of the circle segment with radius r = O A and chord A B (Figure 2).
Thus, the value of S ( c ) can be calculated as follows:
S ( c ) = 2 S ( c 2 ) = 2 ( 1 2 O A 2 ( α s i n ( α ) ) ) = O A 2 ( α s i n ( α ) ) ,  
where α = 2 a r c s i n ( K B O A ) , K B = O A 2 ( O A c 2 ) 2 , and O A = r .
As the coverage of the territory is maximized, the area of the uncovered territory decreases. In this regard, the condition of maximizing the coverage in problem formulation (1) can be replaced by the condition of minimizing the uncovered area. According to this replacement and taking into account Equations (2)–(7), problem (1) can be formulated as:
{ P ( r , c ) m i n S u n c o v e r e d ( r , c ) m i n ,
r m i n r r m a x ,
0 c c m a x .
The solution to the described problem is the set of Pareto optimal parameters of the coverage radius and the value of the intersection of the coverage areas of the sensors. Using the obtained parameters, the maximum coverage area is achieved at the minimum cost of the sensor network.
The second step after the network structure has been built with a designed approach, is the network survivability check. In [16], an approach for estimating the survivability of a sensor network based on Dijkstra and Lee algorithms is presented. The total network survivability estimation as the probability of simultaneous occurrence of two independent events [16,18] is equal as follows:
c s u r v = c s c h .
where c h = 1 c 0 m t is the sensor network survivability relative to the loss of communication between the sensors, c 0 —count of weak connections, m t —number of connections in the most important path, c s = 1 s 0 m s 2 is the sensor network survivability relative to the sensors’ loss, s 0 —number of weak sensors, m s —number of sensors in the most important path.
It is important to check the survivability in the case of sensor loss or connection loss. The bandwidth of the network elements is also a key and critical parameter of the network. We modified the algorithm described above to take the network bandwidth into account. We formed a connection importance matrix K * , the elements of which are equal to:
k i , j * = ( 1 a i , j c i + c j 2 ) ,  
where a i , j = { 1 ,   c o n n e c t i o n   b e t w e e n   s e n s o r s   i s   a v a i l a b l e 0 ,   c o n n e c t i o n   b e t w e e n   s e n s o r s   i s   u n a v a i l a b l e , c i and c j —experts estimations of sensors i and j importance, 0 c i 1 , 0 c j 1 .
Depending on the type of communication and the data transmission protocol, the bandwidth of the communication channels in the sensor network will be different [19]. It should also be borne in mind that different types of sensors may have different bandwidths, which may include the accumulation, reception, processing, and data transmission [20]. The sensor bandwidth was denoted as p i s and the bandwidth of the communication channel between the two sensors as p i , j h , i = 1 , n ¯ , j = 1 , n ¯ , n —number of sensors. The values of p i s and p i , j h must be normalized— 0 p i h 1 , 0 p i , j h 1 .
In the case of different bandwidth of data channels, the elements of the connection importance matrix K * (11) will be equal to:
k i , j * = ( 1 a i , j c i + c j 2 ) ,  
where i = 1 , n ¯ , j = 1 , n ¯ , n —number of sensors.
Additionally, in the case of different bandwidths, the survivability of the sensor network can be estimated in case of loss of the sensor or communication channel that provides the best bandwidth. To make an assessment, we find the channels and sensors that provide maximum data flow with the Ford–Fulkerson algorithm [21]. In our case, the result of using this algorithm will be a vector of network elements that provide the maximum data flow. The max flow sensors’ vector is denoted as P m a x s and max flow transition vector as P m a x h . Max flow value is denoted as P m a x . The assessment of the survivability of the sensor network in case of loss of the sensor or communication channel is similar to the algorithm described in [16]. The difference is in finding the value of the maximum flow. According to this, vectors h w e a k m a x and c w e a k m a x will contain elements in the absence of which the value of the maximum flow P m a x is not reached. Estimates of the survivability of the sensor network in case of loss of the sensor or communication channel, providing the maximum bandwidth of the sensor network are as follows:
c p h = 1 c 0 h m p h ,
c p s = 1 c 0 s m p s 2 .
where c 0 h —number of elements in the weak connections vector h w e a k m a x , m p h —number of elements in the P m a x h vector, s 0 h —number of elements in the weak sensors’ vector c w e a k m a x , m p s —number of elements in the P m a x s vector.
Taking into account the estimates of the survivability of the sensor network relative to the loss of network elements that provide the maximum flow, the final assessment of the network’s survivability is as follows:
c s u r v = c s c h c p h c p s .  
The value of c p h will be equal to 1 in the case of equal bandwidth of communication channels. In turn, the value of c p s will be equal to 1 in the case of equal bandwidth of the sensors.
Considering the case of sensors with different bandwidths and communication channels with equal bandwidth, it is difficult to find network elements that provide maximum data flow. This problem is due to the possibility that the sensors will have a bandwidth that is less than the bandwidth of the communication channel. To solve the described problem, an iterative procedure is proposed, which consists of assigning a bandwidth communication channel to the minimum bandwidth value of two sensors:
p i , j h = min { p i s , p j s }  
The next step is to change the value of the bandwidth of sensors using the communication channel p i , j h to a minimum value:
p i s = min { p i s , p j s } ,   p j s = min { p i s , p j s } .
This procedure is performed alternately for each communication channel and for sensors involved in data transmission. Schematically, the algorithm can be represented by the following figure (Figure 3).
The next method is to conditionally replace the sensor with two sensors connected by a communication channel with the bandwidth of the selected sensor. After solving the problem of finding the maximum flow and reverse replacement, we obtain sensors and appropriate communication channels that ensure maximum data transmission in the network. Schematically, this can be depicted as follows in Figure 4.
In the case of different bandwidths in the sensors and communication channels, the above approaches are used to obtain a matrix of the bandwidth of the communication channels.
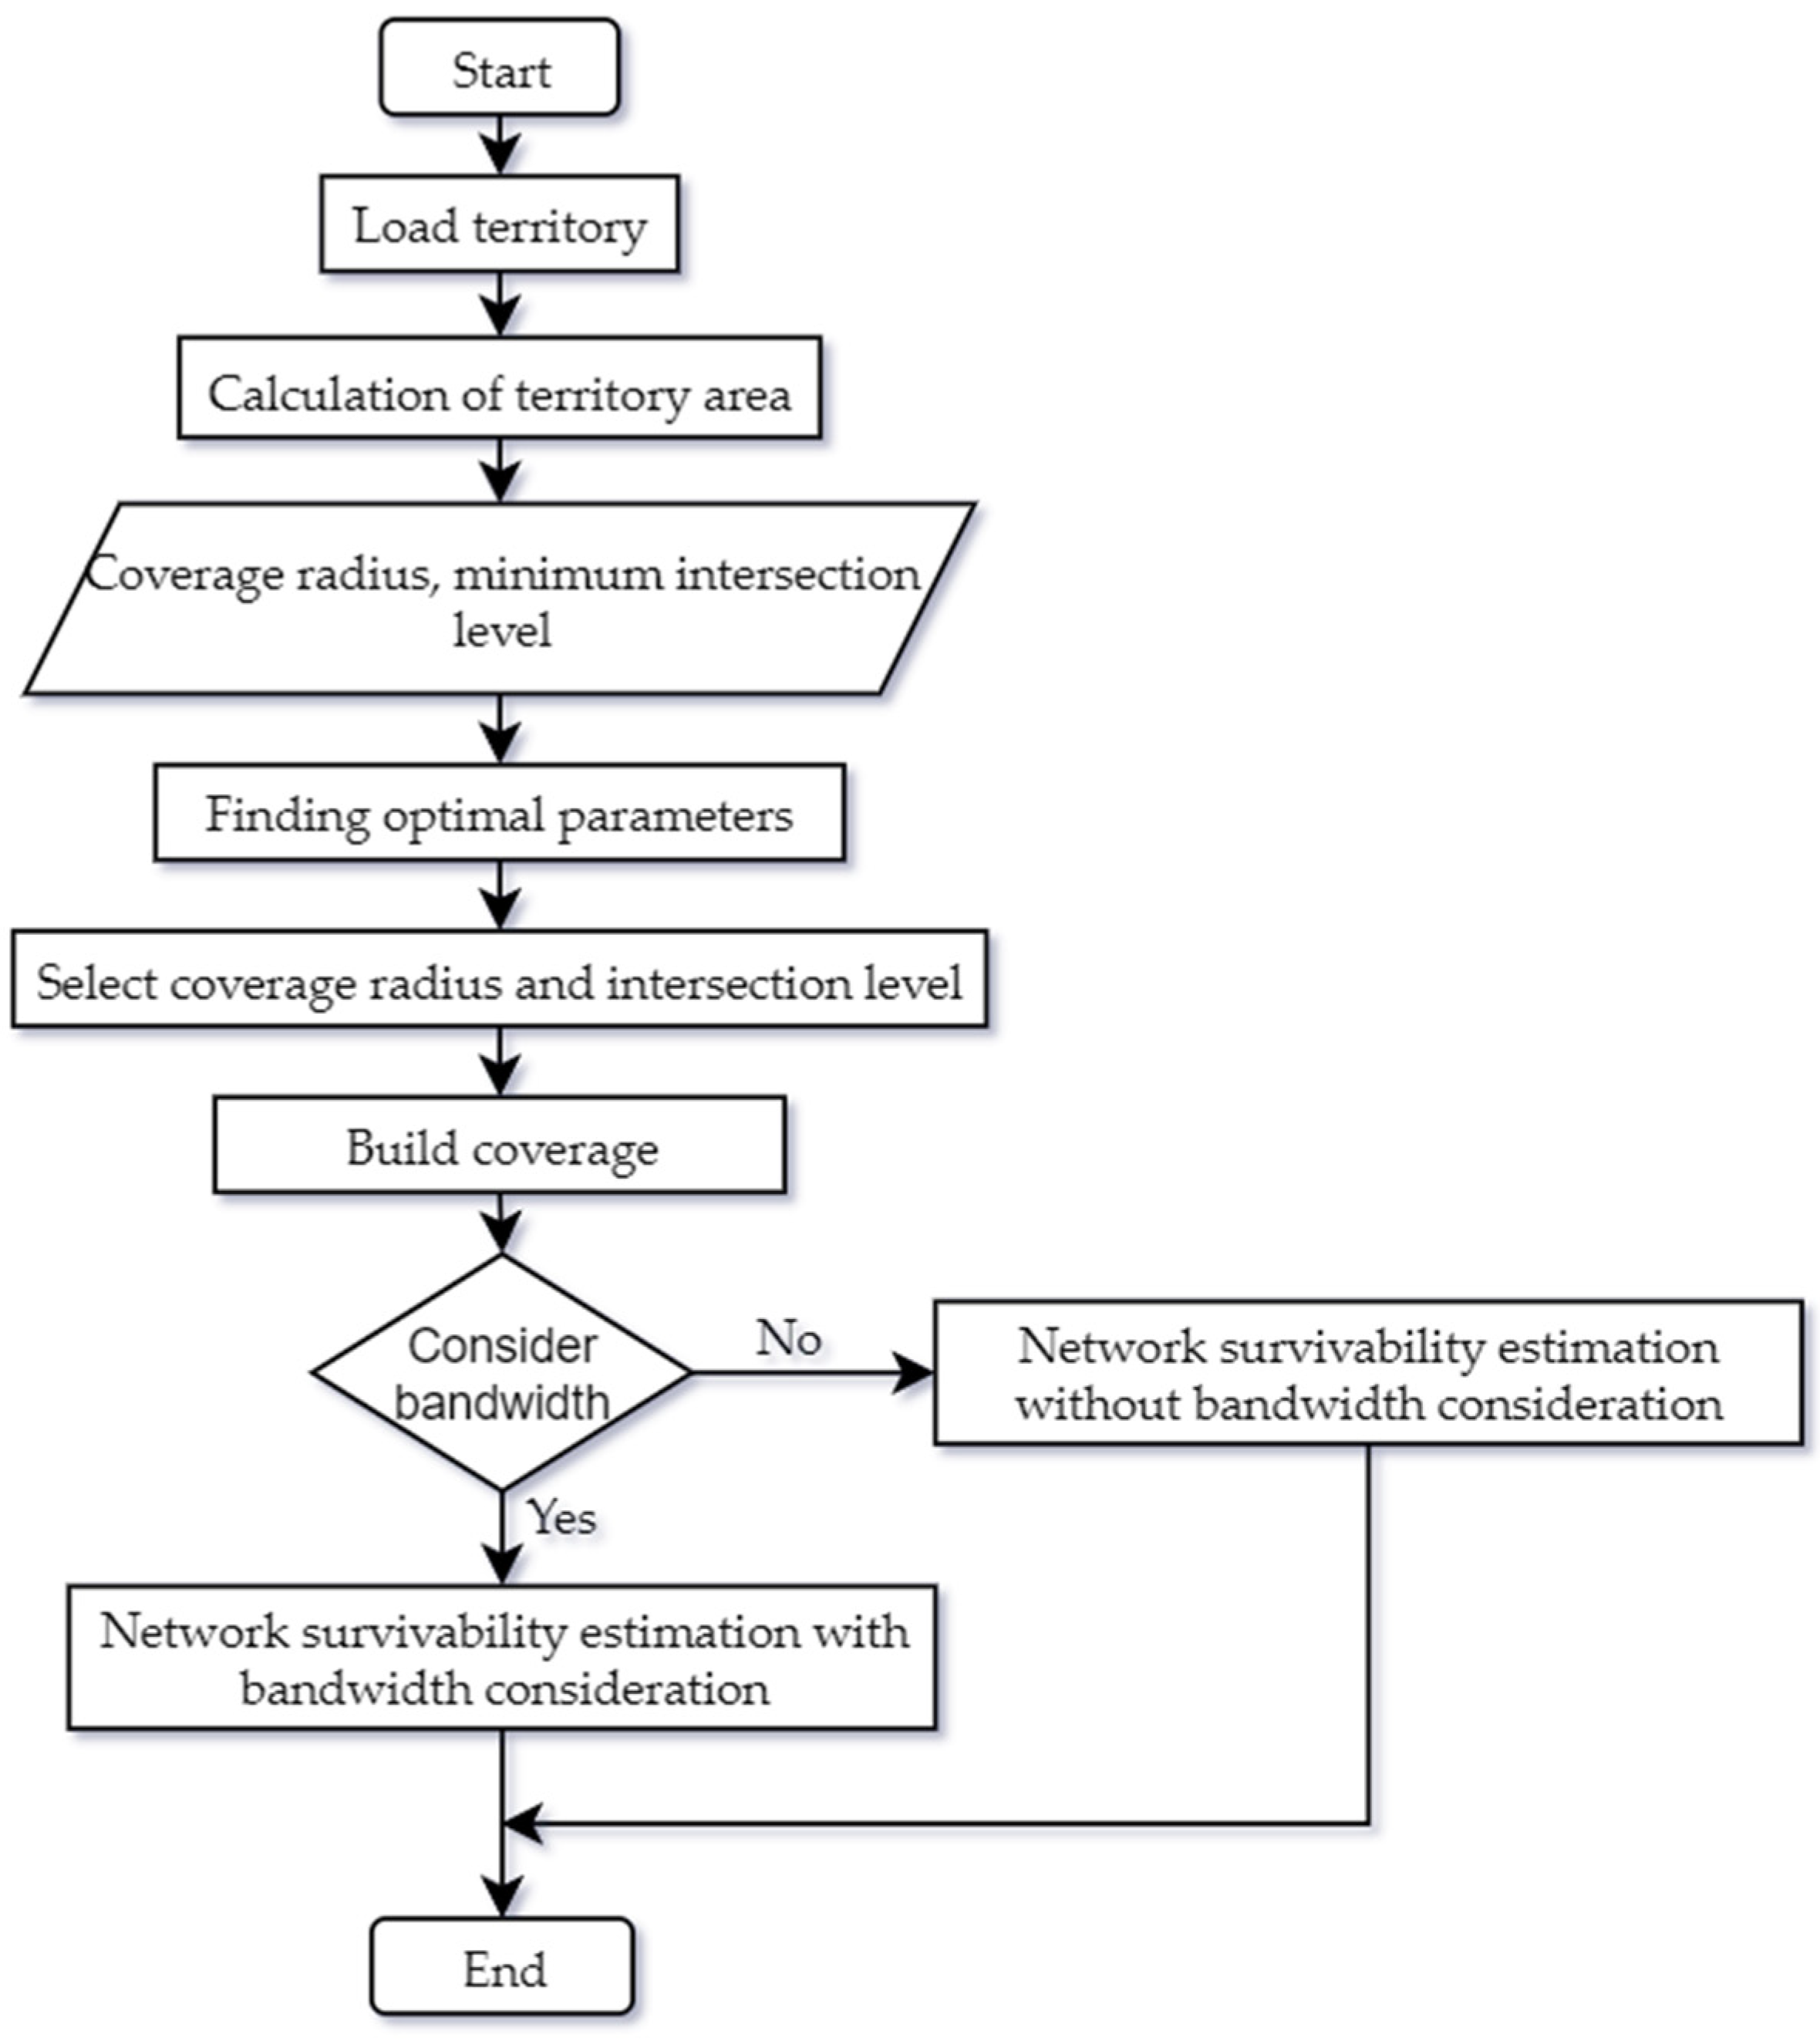
To sum up, the method of maximum coverage of the territory by sensors with the minimization of cost and assessment of survivability can be presented as shown in the flow chart in Figure 5.
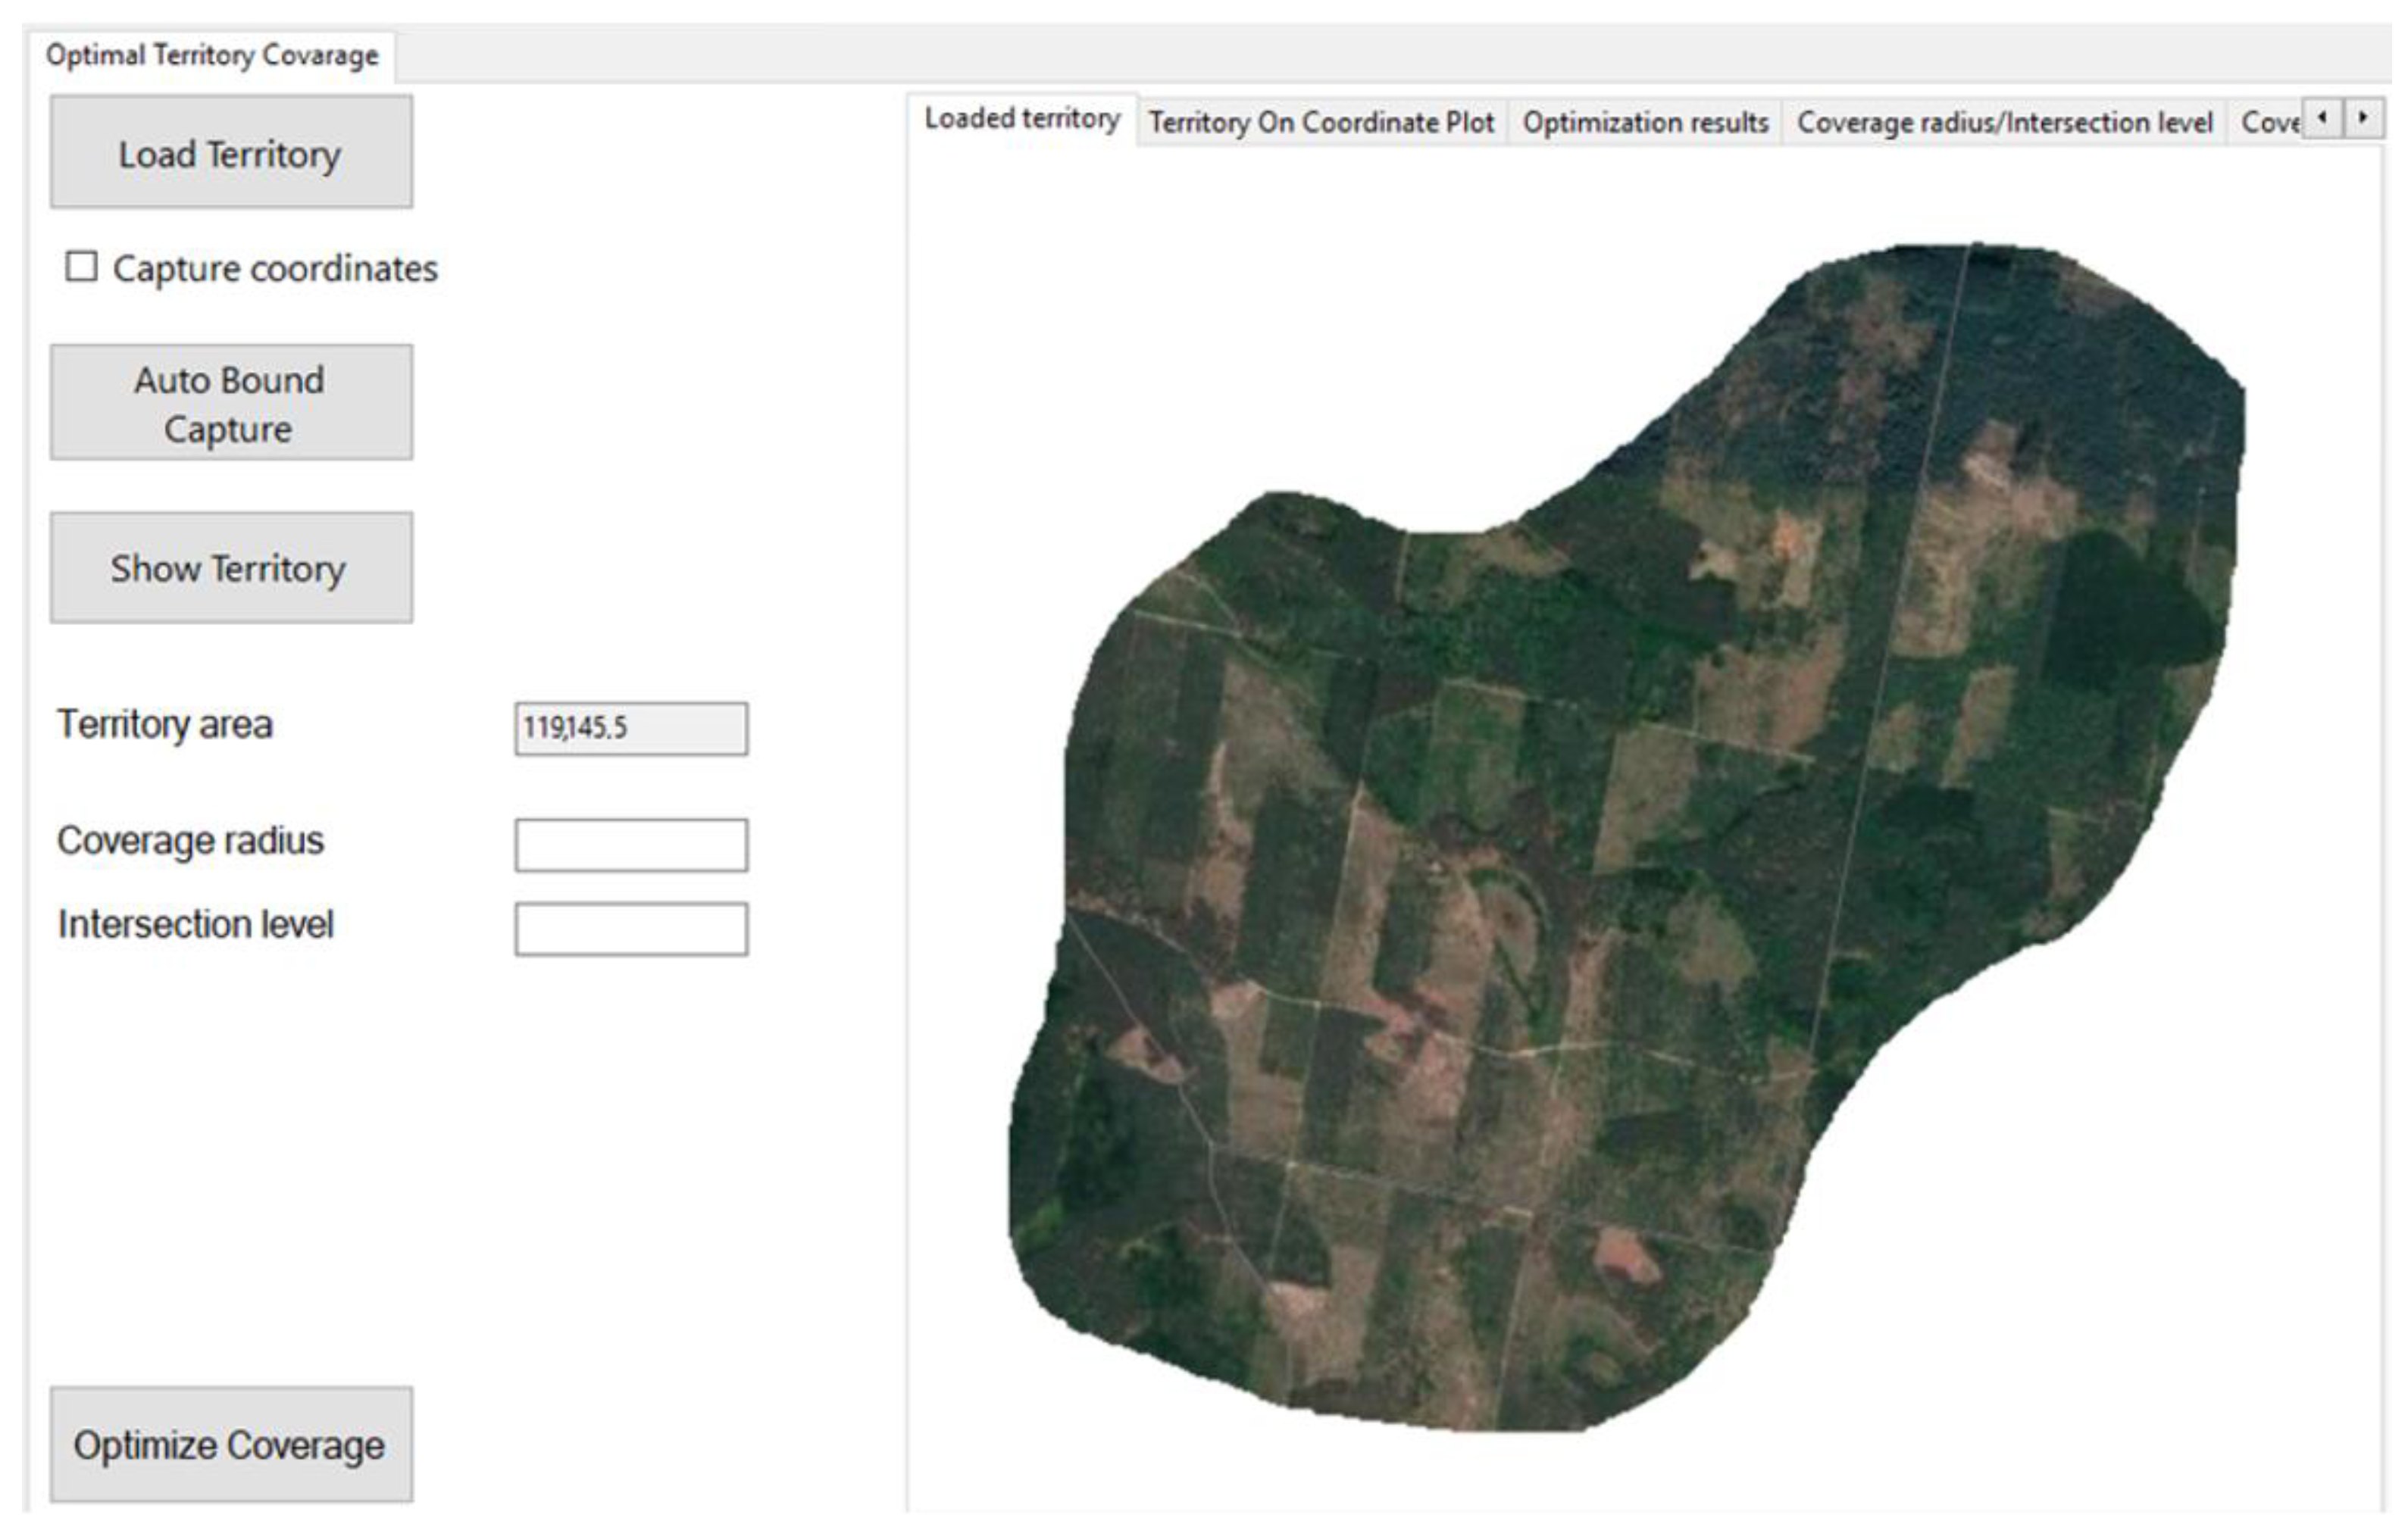
In the first stage after loading the territory, the area of the territory is automatically calculated. Next, the user must enter the input parameters, which include the radius of the coverage of the sensors and the minimum level of the intersection of the coverage areas. After the results are received in the form of Pareto-optimal pairs of the radius of coverage and the level of the intersection of the coverage areas, the user selects the required values. Then the coverage of the territory is built in accordance with the selected values of the parameters. Once the coverage is built, the survivability of the resulting network is assessed and vulnerable sensors and communication channels are searched. This procedure is available in two modes: taking into account the bandwidth of the network elements, and without taking into account the bandwidth of the network elements. The assessment results in five estimated values: the overall survivability of the network, survivability relative to the sensors’ loss, survivability relative to the loss of communication between the sensors, survivability relative to the loss of maximum bandwidth sensors, and survivability relative to the loss of maximum bandwidth connections. In the case of estimating the survivability of the network without taking into account the bandwidth of the network components, the corresponding estimates will be equal to one.

4. Results

4.1. Finding the Optimal Coverage Parameters

Let the area be covered by sensors with a given coverage radius and the level of the intersection of coverage areas. The territory was loaded in the form of a picture in any known format, the boundaries of the territory was captured automatically and the area was automatically calculated (Figure 6).
The input parameters are: area of the territory is 119,145.5 m 2 , the maximum available coverage radius is equal to 50 m; the maximum intersection level is equal to 10 m, the topography is not accounted for and coverage is limited to a circular communication path around each sensor. Using the developed method, the optimal pairs of coverage radii and the values of the intersection of the coverage areas with which the maximum coverage is achieved at the minimum cost of the network were obtained. This set is shown in Figure 7.
Different network parameters, such as the number of sensors, the values of the uncovered area, obtained using the obtained results of the solution of the optimization problem are presented on Figure 8, Figure 9 and Figure 10.
The negative value of the uncovered area in Figure 10 means the absence of uncovered area and the intersection of the coverage areas of the sensors, which provides coverage of the uncovered area by several sensors simultaneously.
Figure 11 presents the dependence of the cost of the network on the coverage radius of the sensors. The cost of one sensor is 7 conventional units.

4.2. Testing the Sensor Network’s Survivability

In the next computer simulation, the experimental sensor network’s survivability was estimated in two cases: without the sensors’ bandwidth and with the sensors’ bandwidth. Parameters of the estimated network are presented in Table 3.
In Table 1, the values of the sensors’ importance were provided by experts. A value of 1 means that this sensor is very important and if the sensor is not important, the value of importance is equal to zero. The results of the sensor network’s survivability estimation are presented in Figure 12:
According to the proposed method, a vitality value of 1 means that this network is viable in case of loss of the sensor, connection between sensors and maximum bandwidth elements. The obtained results indicate that the network is very vulnerable with total vitality of 6%. The developed user interface allows the user to clearly identify vulnerable network elements according to the relevant criteria and the results are displayed in the relevant tables and textboxes. Note, “Max flow” in the corresponding result columns means that the given sensor or connection is weak in vitality testing considering bandwidth. The user can also upload data about the network settings in the form of spreadsheets. The developed software can work in two modes: with and without bandwidth consideration.

5. Discussion

Based on the developed method, appropriate cross-platform software was created. It finds the optimal parameters that achieve maximum network coverage at minimum cost and has the ability to assess the survivability of the network.
A genetic algorithm was used to solve the problem of finding the optimal parameters that provide maximum coverage at a minimum cost. The parameters of the genetic algorithm are: population size is equal to 200; tournament selection with size 2; reproduction with crossover fraction of 0.8; crossover function is intermediate with ratio of 1; forward migration with fraction of 0.2 and interval of 20; count of generations is equal to 200; stall generation is equal to 100; and the function tolerance is equal to 10 4 . The results are presented in Figure 7, Figure 8, Figure 9, Figure 10 and 
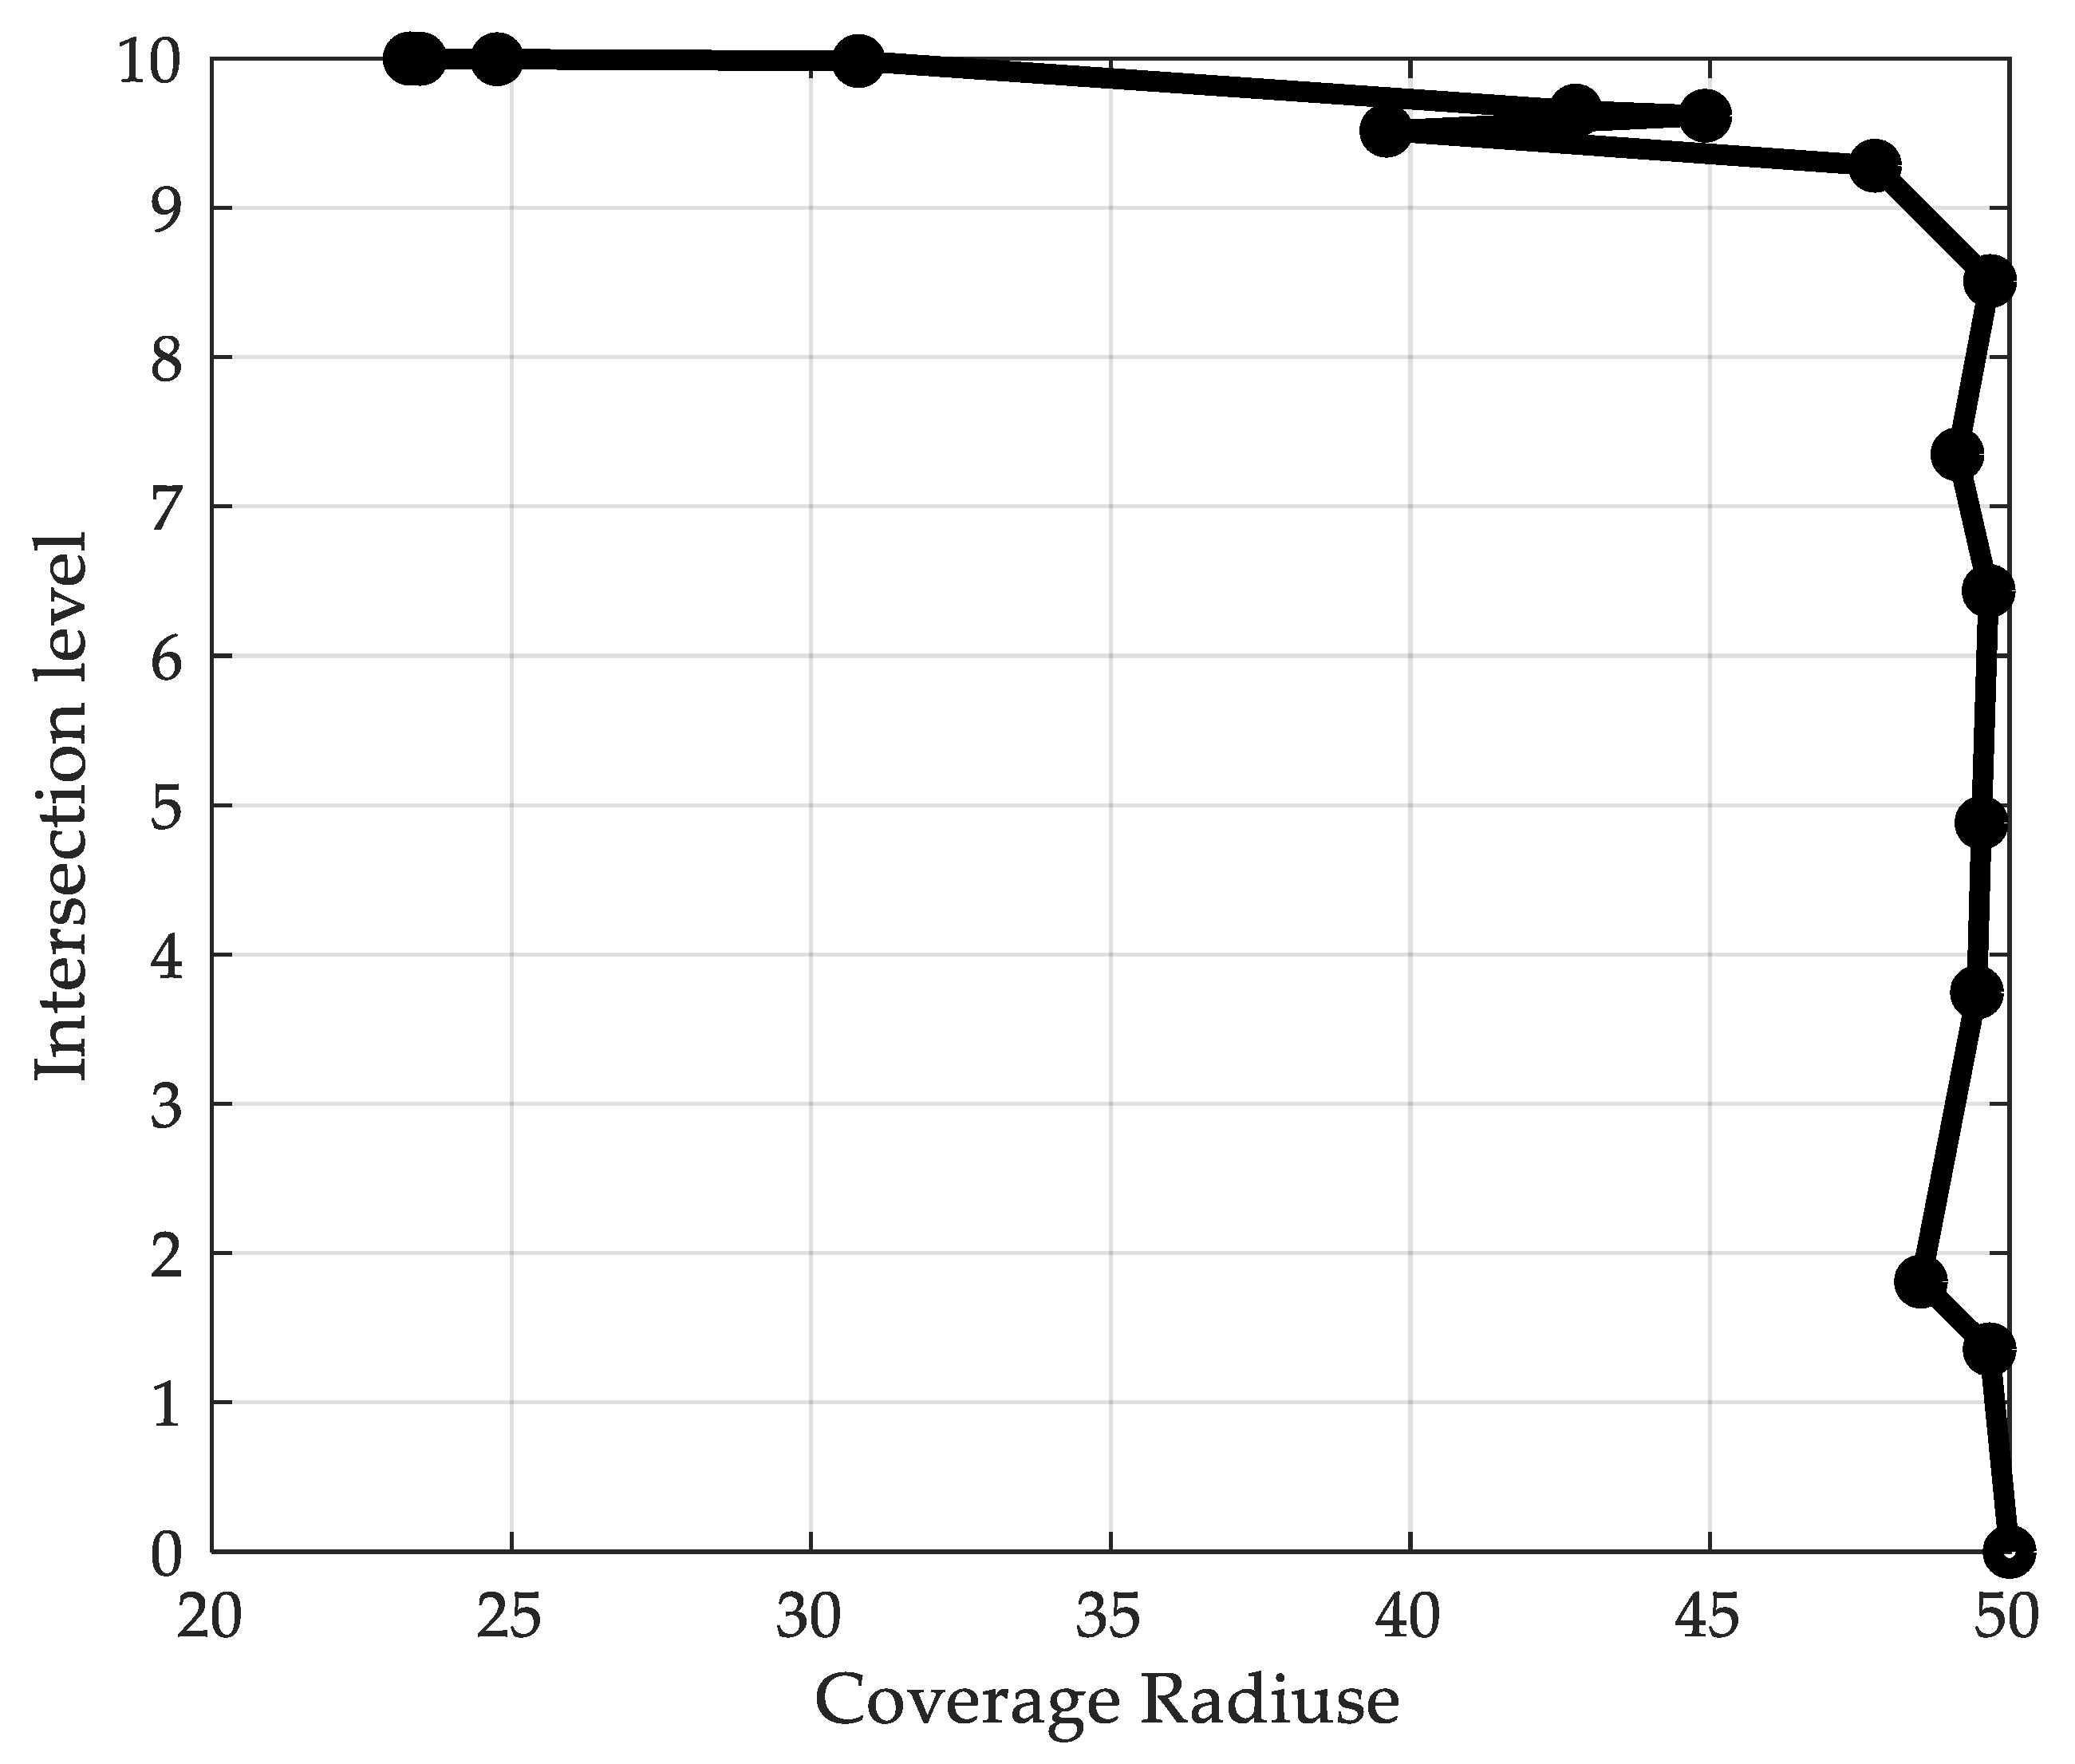
Figure 11. The Pareto optimal combination of the coverage radius and intersection level, which can be used to find the maximum coverage with minimum network’s cost are presented in Figure 7. The number of sensors with the appropriate coverage radius required to cover the area is shown in 
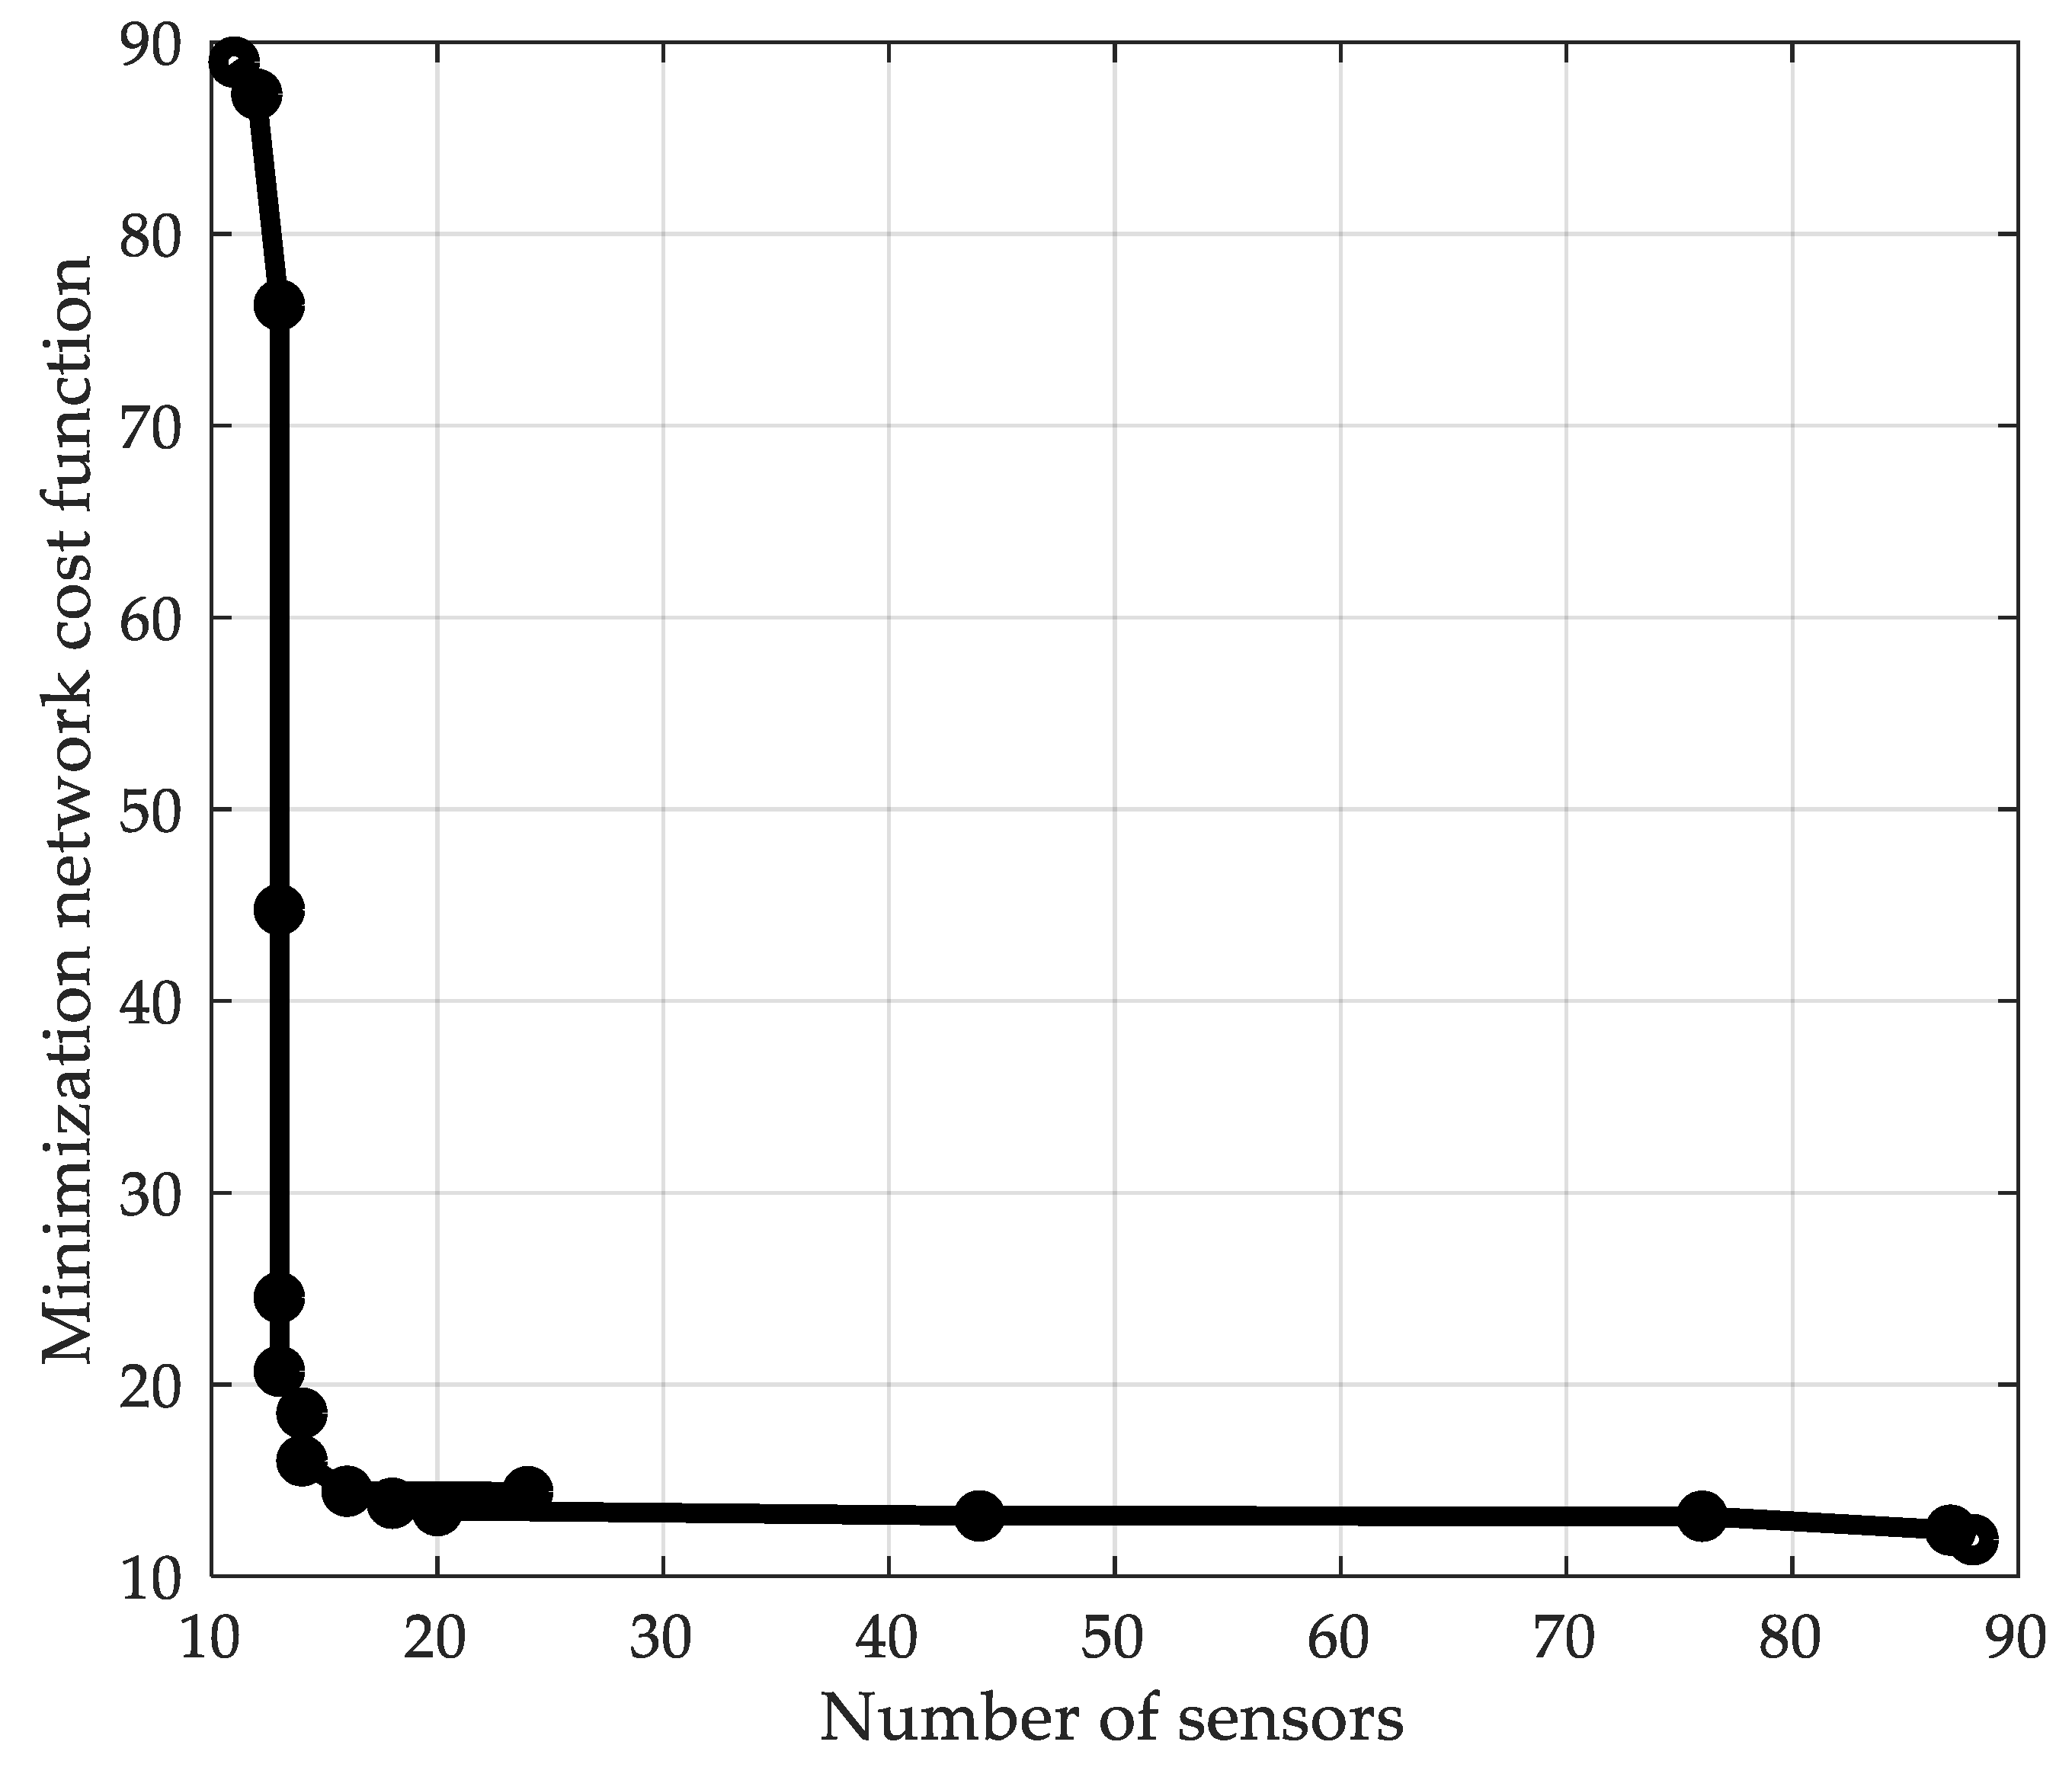
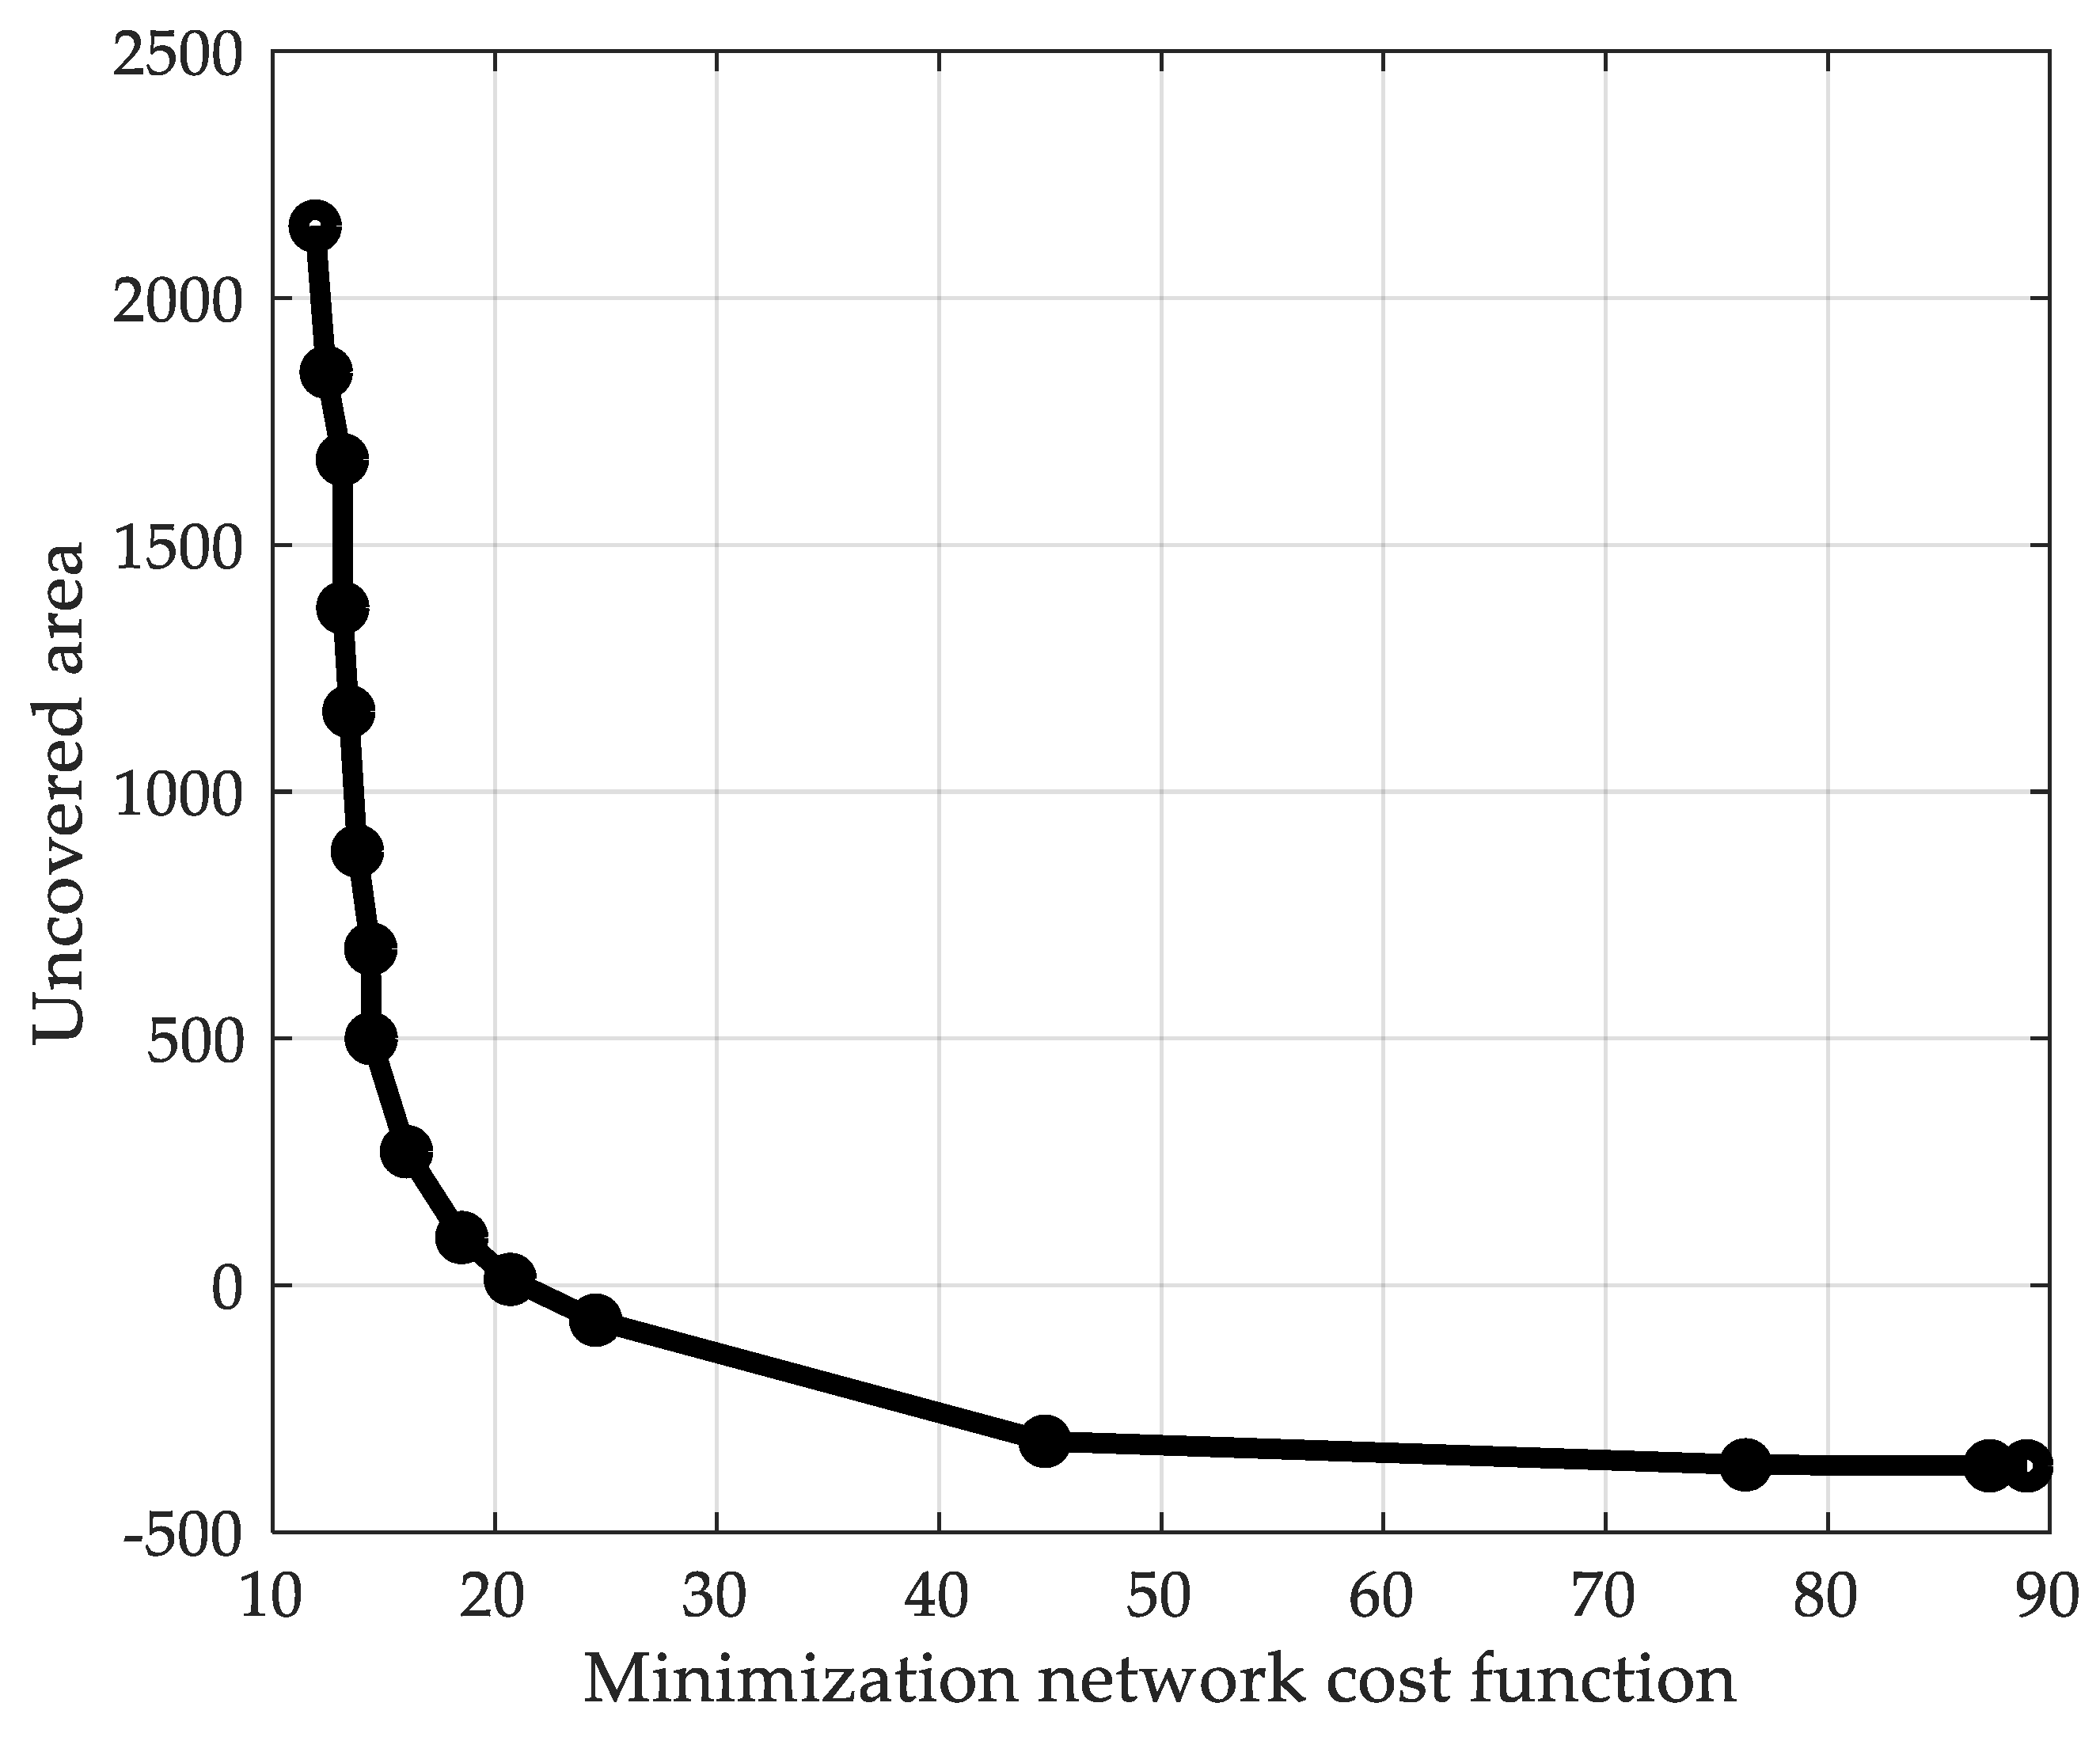
Figure 8. One of the objective functions of the presented problem is the network cost function. The relationship between the uncovered area, the number of sensors, and the network cost’s minimization function is shown in Figure 9 and Figure 10. In Figure 11, the cost of the network is shown depending on the coverage radius of the sensors costing 7 conventional units each.
After analyzing the results, we can conclude that increasing the radius of coverage decreases the number of sensors, which reduces the cost of the network. However, it should also be noted that increasing the radius of coverage leads to an increase in uncovered areas. To reduce the uncovered area, the cross-section of the sensor coverage areas should be taken into account. Therefore, the presented results allow you to choose the necessary network parameters depending on the needs and preferences of the user. According to Figure 7, when the coverage radius is increased, less sensor nodes will be required, but increasing the radius of coverage requires an increase in signal strength and received signal strength indicators, which in turn leads to an increase in the energy consumption of the sensor. This fact must be taken into account when choosing the optimal combination of network parameters in the design.
According to the designed method, nearly zero uncovered area can be achieved by changing sensors’ coverage radiuses, intersection level, position of sensors (mobility of sensor nodes).
Analyzing the results of the assessment of the survivability of the incoming network (Figure 12), we can conclude that the network is vulnerable, as its final survivability is 6%. This is due to the vulnerability of the network to the loss of sensors and communication channels between sensors. The components of the assessment are as follows: network survivability relative to sensor loss—50%, network survivability relative to communication channel loss—66.7%, network survivability relative to the loss of sensors that provide maximum information flow—25%, network survivability relative to channel loss communications that provide the maximum flow of information—71.4%. Half of all network sensors are vulnerable to the loss of elements that provide maximum data flow. To increase the survivability of the network, the user needs to add backup sensors and communication channels, as well as ensure the same bandwidth of all network elements.
According to the method presented in [16], the total survivability of the network presented in Figure 11 is equal to 33%. However, using the method presented in this article, the total survivability of the same network is equal to 6%. This means that the accuracy of estimating network survivability increased by 18% after taking the bandwidth of network elements into account.
Further research will be aimed at ensuring the possibility of using sensors of different radii at the same time during the construction of the coverage area. One of the areas of further research will be the development of a method to ensure the survivability of the network based on the assessment of survivability, calculated using the presented approach. As mentioned above, the topography is not accounted for and coverage is limited to a circular communication path around each sensor. In further research, topography will be accounted for. Taking into account the terrain will affect the geometry of the coverage area of the sensor, which will increase the accuracy of the coverage. Screenshots of the developed software are presented in Figure 6 and Figure 12. The software is not currently available to the reader and is developed in the form of a desktop application. One of the stages in the further development of the study is the improvement and presentation of software in a free access web application.

6. Conclusions

In this study, a method for the maximum coverage of the territory by sensors with minimization of cost and assessment of survivability was developed. The developed method consists of two steps: finding the value of the optimal combination of coverage radius and the intersection of coverage radiuses and a survivability assessment. The intersection of coverage areas is taken into account as the main condition for data transmission in the network and to maximize coverage. To find the optimal network parameters, a nonlinear multicriteria optimization problem was solved. A genetic algorithm was used to find the solution to the given problem. For survivability assessment, an improvement in the known sensor networks survivability assessment method was proposed. The improvement is that in addition to the loss of the most important network elements, the loss of network elements with the highest bandwidth is also taken into account. The improved method increases the accuracy of finding the viability estimate by up to 18%. In case of insufficient information on the bandwidth of network elements, methods for finding the bandwidth of sensors and communication channels were proposed. The software that implements the developed method was presented. The results of the computer experiments confirmed that reducing the radius of coverage of the sensors leads to an increase in the number of sensors and increases the cost of the network, and with the help of the developed software it is possible to choose the optimal combination of the radius of coverage and the level of the intersection of the coverage areas in the territory. The developed software assesses the survivability of the sensor network and identifies vulnerable sensors and data transport channels. The novelty of the proposed approach is the simultaneous maximization of coverage of the territory while minimizing the network’s cost, and it has the ability to assess the survivability of the network and identify vulnerable sensors and data transport channels.
The paper presents Big Data good practice in relation to the stage of data ingestion with the help of an optimal sensor network. This was fulfilled within the framework of the iBigWorld project [22], which is devoted to gaining skills for developing innovative solutions based on Big Data in real-world applications. Working to build an optimal sensor network to cover the area while minimizing the cost of the network and maximizing the covered territory is be a good opportunity to gain competencies while using cutting-edge technologies based on Big Data and data science.

Author Contributions

Conceptualization, O.B. and V.M.; methodology, V.P.; software, V.S.; validation, V.P. and V.S.; formal analysis, V.P.; investigation, V.S.; resources, V.P.; data curation, V.S.; writing—original draft preparation, V.P., O.B., V.S., V.M. and M.B.; writing—review and editing, V.P., O.B., V.S., V.M. and M.B.; visualization, V.S.; supervision, M.B.; project administration, V.P.; funding acquisition, V.M. All authors have read and agreed to the published version of the manuscript.

Funding

The work was co-funded by the European Union’s Erasmus + Programme for Education under KA2 grant (Project no. 2020-1-PL01-KA203-082197 “Innovations for Big Data in a Real World”). The APC was funded by the University of Bielsko-Biala.

Institutional Review Board Statement

Not applicable.

Informed Consent Statement

Not applicable.

Data Availability Statement

Not applicable.

Acknowledgments

The authors thank reviewers for comments that allowed to improve the paper significantly.

Conflicts of Interest

The authors declare no conflict of interest.

References

  1. Xin, B. Multimodal Sensor Collaborative Information Sensing Technology. In Environmental Perception Technology for Unmanned Systems; Springer: Singapore; Shanghai, China, 2020; pp. 169–202. [Google Scholar] [CrossRef]
  2. Mitro, N.; Krommyda, M.; Amditis, A. Smart Tags: IoT Sensors for Monitoring the Micro-Climate of Cultural Heritage Monuments. Appl. Sci. 2022, 12, 2315. [Google Scholar] [CrossRef]
  3. Evans, D. Internet of Everything Will Change the World. Available online: https://www.g-news.com.ua/news/10-it/-/13936-internet-of-everything-izmenit-mir-k-luchshemu.html (accessed on 15 February 2022).
  4. Watteyne, T. Crystal-Free Architectures for Smart Dust and the Industrial IoT. In Proceedings of the 7th International Conference on Internet of Things: Systems, Management and Security (IOTSMS), Paris, France, 14–16 December 2020. [Google Scholar] [CrossRef]
  5. Martin-Gorostiza, E.; Garcia-Garrido, M.A.; Pizarro, D.; Salido-Monzu, D.; Torres, P. An Indoor Positioning Approach Based on Fusion of Cameras and Infrared Sensors. Sensors 2019, 19, 2519. [Google Scholar] [CrossRef] [PubMed] [Green Version]
  6. Elangovan, U.; Prasanth, L. Sensor Coverage in Autonomous Mobile Sensor Networks. In Proceedings of the National Conference on Emerging Technologies for Sustainable Engineering & Management (NCETSEM’18), Chennai, India, 5 April 2019. [Google Scholar]
  7. Rocha, A.M.; Casau, P.; Cunha, R. A Control Algorithm for Early Wildfire Detection Using Aerial Sensor Networks: Modeling and Simulation. Drones 2022, 6, 44. [Google Scholar] [CrossRef]
  8. Wu, H.; Liu, Z.; Hu, J.; Yin, W. Sensor placement optimization for critical-grid coverage problem of indoor positioning. Int. J. Distrib. Sens. Netw. 2020, 16, 1550147720979922. [Google Scholar] [CrossRef]
  9. Ashraf, S.; Alfandi, O.; Ahmad, A.; Khattak, A.; Hayat, B.; Kim, K.; Ullah, A. Bodacious-Instance Coverage Mechanism for Wireless Sensor Network. Wirel. Commun. Mob. Comput. 2020, 2020, 8833767. [Google Scholar] [CrossRef]
  10. Mao, F.; Khamis, K.; Krause, S.; Clark, J.; Hannah, D.M. Low-Cost Environmental Sensor Networks: Recent Advances and Future Directions. Front. Earth Sci. 2019, 7, 221. [Google Scholar] [CrossRef]
  11. Cena, G.; Scanzio, S.; Valenzano, A. Ultra-Low Power Wireless Sensor Networks Based on Time Slotted Channel Hopping with Probabilistic Blacklisting. Electronics 2022, 11, 304. [Google Scholar] [CrossRef]
  12. Choi, S.; Yi, G. Neighbor Discovery Optimization for Big Data Analysis in Low-Power, Low-Cost Communication Networks. Symmetry 2019, 11, 836. [Google Scholar] [CrossRef] [Green Version]
  13. Markowicz, K.M.; Chiliński, M.T. Evaluation of Two Low-Cost Optical Particle Counters for the Measurement of Ambient Aerosol Scattering Coefficient and Ångström Exponent. Sensors 2020, 20, 2617. [Google Scholar] [CrossRef] [PubMed]
  14. Arroyo, P.; Gómez-Suárez, J.; Suárez, J.I.; Lozano, J. Low-Cost Air Quality Measurement System Based on Electrochemical and PM Sensors with Cloud Connection. Sensors 2021, 21, 6228. [Google Scholar] [CrossRef] [PubMed]
  15. Wang, T.; Zeng, P.; Zhao, J.; Liu, X.; Zhang, B. Identification of Influential Nodes in Industrial Networks Based on Structure Analysis. Symmetry 2022, 14, 211. [Google Scholar] [CrossRef]
  16. Petrivskyi, V.; Dimitrov, G.; Shevchenko, V.; Bychkov, O.; Garvanova, M.; Panayotova, G.; Petrov, P. Information Technology for Big Data Sensor Networks Stability Estimation. Inf. Secur. Int. J. 2020, 47, 141–154. [Google Scholar] [CrossRef]
  17. Sandhu, J.; Verma, A.K.; Rana, P.S. A Data-Driven Framework for Survivable Wireless Sensor Networks. In Proceedings of the Eleventh International Conference on Contemporary Computing (IC3), Noida, India, 2–4 August 2018. [Google Scholar] [CrossRef]
  18. Bremaud, P. Probability Theory and Stochastic Processes, 1st ed.; Springer: Berlin/Heidelberg, Germany, 2020; 713p. [Google Scholar]
  19. Petrivskyi, V.; Shevchenko, V.; Bychkov, O.; Brazhenenko, M.; Petrov, P. CAD technology for optimal territory. In Proceedings of the CADSM 2021, 16th International Conference on the Experience of Designing and Application of CAD Systems (CADSM), Lviv, Ukraine, 22–26 February 2021. [Google Scholar] [CrossRef]
  20. Guryanov, E.D.; Dubov, M.A.; Priorov, A.L. Building a Self-Organizing Radio Network for Mobile Objects. In Proceedings of the Systems of Signal Synchronization, Generating and Processing in Telecommunications (SYNCHROINFO), Yaroslavl, Russia, 1–3 July 2019. [Google Scholar] [CrossRef]
  21. Kyi, M.T.; Maw, S.S.; Naing, L.L. Mathematical Estimation for Maximum Flow in Electricity Distribution Network by Ford-Fulkerson Iteration Algorithm. Int. J. Sci. Res. Publ. (IJSRP) 2019, 9, 9229. [Google Scholar] [CrossRef]
  22. Innovations for Big Data in a Real World (iBIG World). Official Web Site of Erasmus+ Capacity Building in Higher Education Project. Available online: http://ibigworld.ni.ac.rs/ (accessed on 18 February 2022).
Figure 1. Territory coverage with four sensors: without intersection level (a); with intersection level (b).
Applsci 12 03059 g001
Figure 2. Finding the value of the area of intersection of coverage areas.
Applsci 12 03059 g002
Figure 3. An example of the formation of bandwidth of the communication channels.
Applsci 12 03059 g003
Figure 4. Sensors change approach using an example.
Applsci 12 03059 g004
Figure 5. Maximum coverage of the territory by sensors with minimization of cost and assessment of survivability method flow chart.
Applsci 12 03059 g005
Figure 6. User interface with the loaded territory.
Applsci 12 03059 g006
Figure 7. Values of optimal combinations of coverage radius and intersection level.
Applsci 12 03059 g007
Figure 8. Number of sensors with coverage radius for territory coverage.
Applsci 12 03059 g008
Figure 9. Number of sensors with coverage and minimization network cost value.
Applsci 12 03059 g009
Figure 10. Value of uncovered area and minimization network cost value.
Applsci 12 03059 g010
Figure 11. Coverage radius and minimization network cost value.
Applsci 12 03059 g011
Figure 12. Sensor network’s survivability estimation results considering bandwidth.
Applsci 12 03059 g012
Table 1. Literature review comparison.
AuthorsMain Focus/OutcomeFactors Not Taken into Account
E. Martin-Gorostiza, M. Garcia-Garrido, D. Pizarro, D. Salido-Monzu, P. Torres [5]Method for infrared and cameras sensor fusion applied to indoor positioning in intelligent spaces.Value of intersection of coverage areas.
U. Elangovan, L. Prasanth [6]The method of optimal coverage of the territory by sensors of different coverage radius.Square of uncovered territory. Possibility of changing intersection value.
A.M. Rocha, P. Casau, R. Cunha [7]An algorithm to cover a given area while prioritizing areas of higher fire hazard risk.Square of uncovered area, the intersection of coverage areas.
H. Wu, Z. Liu, J. Hu, W. Yin [8]The placement of sensors optimizing (accuracy and cost).Value of intersection of coverage areas. Network’s cost.
S. Ashraf, O. Alfandi, A. Ahmad, A. Khattak, B. Hayat, K. Kim, A. Ullah [9]Node redeployment-based Bodacious-instance Coverage Mechanism.Network’s cost. Uncovered area.
F. Mao, K. Khamis,
S. Krause, J. Clark, D. Hannah [10]
The use of low-cost sensor networks in the environmental sciences.The intersection of coverage areas, network’s survivability.
S. Choi, G. Yi [12]The optimization of the neighbor discovery to reduce the power consumption in wireless sensor networks.Network’s survivability.
K. Markowicz, M. Chiliński, P. Arroyo, J. Gómez-Suárez, J.I. Suárez, J. Lozano [13,14]Cost-effective wireless sensor network system.Uncovered area, system survivability.
T. Wang, P. Zeng, J. Zhao, X. Liu, B. Zhang [15]Structure-based identification method to identify the influential nodes in industrial networksConnections between nodes vulnerability
V. Petrivskyi, G. Dimitrov, V. Shevchenko, O. Bychkov, M. Garvanova, G. Panayotova, P. Petrov [16]Approach to estimating the survivability of a sensor network based on Dijkstra and Lee algorithms.Sensors and connections bandwidth.
J. Sandhu, A. Verma, P. Rana [17]Network viability using Markov chains.Sensor network’s survivability.
Table 2. Notation used in this article.
NotationDescription
T s Square of the territory
S 1 Square covered by one sensor
P 1 Cost of the one sensor
S c o v e r e d Square of the covered territory
S u n c o v e r e d Square of the uncovered territory
S ( c ) Square of the intersection of the coverage areas with intersection level c
c s u r v Total network’s survivability
c s Sensor network survivability relative to the sensors’ loss
c h Sensor network survivability relative to the loss of communication between the sensors
c p h Sensor network survivability relative to the loss of maximum bandwidth sensors
c p s Sensor network survivability relative to the loss of maximum bandwidth connections
Table 3. Parameters of the estimated network.
Sensor CoordinatesCoverage Radius, mImportanceBandwidth, Mb/s
(15;15)100.75100
(20;45)100.8595
(35;40)100.6987
(17;30)80.8120
(20;45)101110
(50;55)130.980
Publisher’s Note: MDPI stays neutral with regard to jurisdictional claims in published maps and institutional affiliations.

