1. Introduction
Auditing how resources are managed is a challenge that regulatory agencies all over the world have always had [
1,
2]. This challenge can be amplified when considering a country with a complex economic system. The amount of data that needs to be audited is of greater magnitude, for instance, in Brazil. With the exponential increase of digital information produced in recent decades, public entities are consistently looking for new solutions that improve the efficiency and results of processes that deal with big data [
3,
4,
5,
6], such as classification, clustering and anomaly detection in monetary transactions.
Regulating transactions that public agents perform with government money is one of the main priorities of the auditing process, where mismanagement, embezzlement, fraud and corruption can have a devastating impact on the country’s development and its citizens [
7,
8,
9,
10,
11]. These transactions are documented in fiscal documents, such as electronic invoices. Fiscal documents are available in many different formats in Brazil: receipts, service and consumer invoices and electronic invoices—which is the most common.
Brazilian Electronic Invoices, called NF-e (Nota Fiscal Eletrônica), is a document that records Business to Business transactions. NF-es are stored as XML files and divided into multiple fields that must be filled. Since the 7th of October 2021, 29.847 billion NF-es have been issued by 2.013 million different entities [
12]. In recent years, NF-es have shown a continuous growth trend, where the amount of issued NF-es from 2016 to 2018 has increased by over 100 million each year.
Issuing NF-es requires type checking of the entries, assuring that the information filled corresponds to the correct field. Even after initial validations, these documents can still present incorrect information, such as the wrong product category, misplaced dots and commas for prices and misspelling in the product description. Therefore, efficient data mining solutions for these problems are essential for better auditing electronic invoices.
Although many different methods are available for short-text data, the results are not optimal when applied to NF-e datasets. The fields based on text input have very noisy and non-standard documentation. In addition to these challenges, extracting information from short-texts to identify traces of mismanagement, embezzlement, business conducting fraudulent operations or tax evasion is a costly process.
Dealing with this type of data is not straightforward since meaningful patterns are still hard to find even when cleaned due to their unbalanced characteristics. In addition, standard data mining methods still have some limitations [
13,
14,
15]. For instance, it is challenging to notice variations in numerical fields when the processed data contains records about different products. That occurs mainly because the variations between record values cannot provide a reliable pattern in which a significant divergence can be noticed [
16,
17].
Strategies that group similar elements based on their description may provide better insights into the product to address these challenges. With this, significant variations in a different field, such as price and quantity, can be better analyzed for outliers [
18]. Clustering algorithms can be used for this purpose [
19,
20]. For this, a dataset is divided into smaller groupings based on an observed similarity, providing data that is easier to apply to different analyses, such as anomaly detection methods.
It is worth emphasizing that one of the main issues when it comes to most clustering algorithms is the average-case complexity, that in some cases, such as the agglomerative hierarchical algorithm, goes as far as
[
21]. On the other hand, more optimized solutions are also available, where DBSCAN, which has average-case complexity
[
22], can cluster data faster than other conventional algorithms. However, even when considering fast approaches, once
N reaches high numbers, time can still be a problem [
23]. With that in mind, alternatives, such as Neural Networks (NNs), may provide promising solutions, as explored in this research.
Several works in the current literature aim at improving clustering results [
24,
25,
26,
27,
28,
29]. Many of those use NNs for preprocessing the data before feeding the data into a clustering algorithm [
27,
28,
29], where most of them rely on algorithms, such as K-means, that are not time-efficient. Others also implement deep learning directly in the clustering process since it provides flexibility [
24,
25,
26]. Still, they are more focused on improving the clustering rather than providing solutions that may enhance big data performance. Other works use the autoencoder as a solution for anomaly detection [
30,
31,
32]. However, unlike this research, such complex solutions are not intended for faster clustering results for short-text data.
Aiming at providing a new solution when dealing with NF-e data, we propose a service for clustering short-text data in NF-es that uses an autoencoder for data clustering, called ELINAC. ELINAC’s purpose is to aid the auditing of transactions documented in NF-e, clustering similar data by short-text descriptions and making anomaly detection in numeric fields easier. For this, ELINAC transforms the data and creates clusters based on an autoencoder model. Doing so, ELINAC generates results that auditors can use to analyze NF-es or similar data in a time-efficient manner. The results show that the ELINAC can efficiently group data while performing three times faster than traditional algorithms in the worst case.
Additionally, the data transformation provides better outcomes for the autoencoder and every other clustering algorithm used in the experiments. To the best of our knowledge, this is a novel study for the following reasons:
Our work clusters short-text data in a short time based on an autoencoder network.
We rely on the possibility of adjusting the clustering parameters without retraining.
Our autoencoder model implemented in ELINAC is faster than traditional and hierarchical models.
We identified outliers based on the reconstruction error values produced by our model.
The remainder of this work is organized as follows.
Section 2 discusses and analyses related works to what is being proposed in ELINAC.
Section 3 presents the proposed service, describing the dataset used for experiments, how the data are transformed, the autoencoder model used and the algorithm used for clustering.
Section 4 presents the results and analysis of the performed experiments to assess the ELINAC. Finally,
Section 5 presents a retrospective of what was achieved with this research and discusses future works.
2. Related Works
This section presents works that model the autoencoder as a data mining solution to identify traces of mismanagement, embezzlement, business conducting fraudulent operations or tax evasion. In addition, works that explore autoencoders in conjunction with other clustering algorithms will be presented to picture what has been researched in the area. It is worth noting that, despite many studies proposing autoencoder-based solutions, thus far, we have not found a solution that models the autoencoder for short-text data with a time-efficient approach.
Data mining techniques applied in fiscal documents, e.g., clustering, classification and anomaly detection, are widely used for fraud detection in transactions [
30,
33,
34,
35] and financial operations in general [
36,
37,
38]. In the work of Paula et al. [
30], they proposed a model for detecting frauds in Brazilian fiscal documents, such as electronic invoices. The model was based on a deep autoencoder responsible for generating the reconstruction error used for the detection of frauds. The work aims at detecting actual cases of fraud in the data based on the model output.
Kieckbusch et al. [
39] developed a classification system for electronic invoices based on Convolutional Neural Networks (CNN). CNN training is based on a product short-text description and the product category code (NCM) used as the label. The objective is to improve the processing of invoices, identifying the correct product code for the invoices. Both solutions do not deal with unbalanced and distinct data in fiscal documents. Furthermore, even though the model proposed in [
39] has good performance for its task, NCM is a general code that is not suited for the analysis of more specific groups.
Clustering techniques have also been used for electronic invoices in the work of Tang et al. [
40]. In this instance, a deep fusion analysis method was proposed based on K-means and skip-gram, where abnormal electronic invoices were used for inter-enterprise and inter-user association analysis. While the aforementioned studies have dealt with electronic invoices data, none have pursued a more specific product-by-product analysis. Furthermore, works explored their results on the subject of the analysis and not the proposed method performance.
Other research fronts investigate clustering solutions with autoencoders [
24,
25,
26,
41]. Yang et al. [
24] presented a deep spectral clustering framework based on a Dual autoencoder network. The Dual autoencoder creates data more robust to noise in its latent representation while using mutual information estimation for more specific information. The proposed work aims to improve the clustering results of current state-of-the-art approaches. A deep clustering with a variational autoencoder method was proposed in the work of Lim et al. [
25]. The study is based on a modified autoencoder, where each point present in the latent space is artificially realigned to the nearest neighbor class during training. This approach aims at improving the results of previous studies using the same technique.
Another clustering approach through an autoencoder is presented by Mrabah et al. [
26]. The study addresses the problem of capturing significant variations in unsupervised learning, proposing a dynamic autoencoder. By following this approach, the method aims at achieving state-of-the-art results. These works validate the idea of using autoencoders for clustering, but none of them were proposed for data, such as the short-text data presented in NF-es. Furthermore, the clustering time is an essential factor that in most studies did not receive as much attention as explored in this research.
Other works deal only with the problem of short text categorization [
14,
15]. Enamoto et al. [
15] developed a generic framework for multilingual short text categorization based on CNN is proposed, titled GM-ShorT. The results show that GM-ShorT can be used efficiently for multilingual short text categorization. In Schmitz et al. [
14], a solution was proposed to categorize short texts derived from multiple sources of information to portray the current situation of the financial market, named the GOOSE. GOSSE was modeled based on a Bi-LSTM and GloVe Embeddings to aid reliability in classifying short texts. However, the works cited focus only on short text categorization, incapable of clustering short-text data. In other words, the works do not explore the use of the autoencoder for data clustering, unlike ELINAC.
Autoencoders can also be used in conjunction with other methods. Many studies have explored using deep learning solutions for preprocessing of data in clustering and anomaly detection [
27,
28,
29]. Yang et al. [
27] utilizes deep learning techniques for data preprocessing to create representations better suited for K-means. The proposed method validates the use of deep neural networks for a better data representation for clustering and validates the results using text and image datasets. The objective is to improve the clustering results and recover a more clustering-friendly latent representation of the data. Even though it uses text data, it is mainly based on words feature extraction that is not suited for NF-e data. Since it relies on K-means for the final clustering, the model is not performance-oriented.
A different approach for deep neural networks and K-means is presented by Fard et al. [
28]. The problem of generating learning representations suited for clustering algorithms is studied for better clustering performance. Autoencoder networks are used for better representation of high-dimensional data using only gradient updates for learning. This study also demonstrated better results when using deep learning before other clustering techniques in every dataset, but it does not explore the use of time-efficient clustering.
Kim et al. [
29] presented a solution based on autoencoder and K-means. For this, the autoencoder is used for data dimensionality reduction, which is then clustered using K-means. The resulting data are used for a deep-learning model to detect anomalies. While the work presents a solution using autoencoder and clustering for better anomaly detection, the clustering depends on the K-means algorithm, which is not time-efficient, different from this research.
Previous studies in clustering and anomaly detection have conducted extensive research presenting interesting results for various types of data. The studies presented form a solid foundation for our work, presenting successful solutions for fiscal documents analysis, autoencoders for clustering and autoencoders output for better data representation as input for other algorithms. However, it should be noted that, thus far research has not found solutions based on autoencoders to cluster short-text data, such as the description presented on NF-es. Furthermore, autoencoders have mainly been used for clustering results in optimization and not time-efficient approaches, as will be presented below.
3. ELINAC: ELctronic INvoices Autoencoder Clustering
This section presents ELINAC, a service for clustering short-text data in NF-es that uses an autoencoder for faster results. ELINAC’s purpose is to aid auditing of transactions documented in NF-e, clustering similar data by short-text descriptions and making anomaly detection in numeric fields easier. For this purpose, ELINAC transforms the data and creates clusters based on an autoencoder model. Therefore, ELINAC generates results that auditors can use to analyze NF-es or similar data in a time-efficient manner.
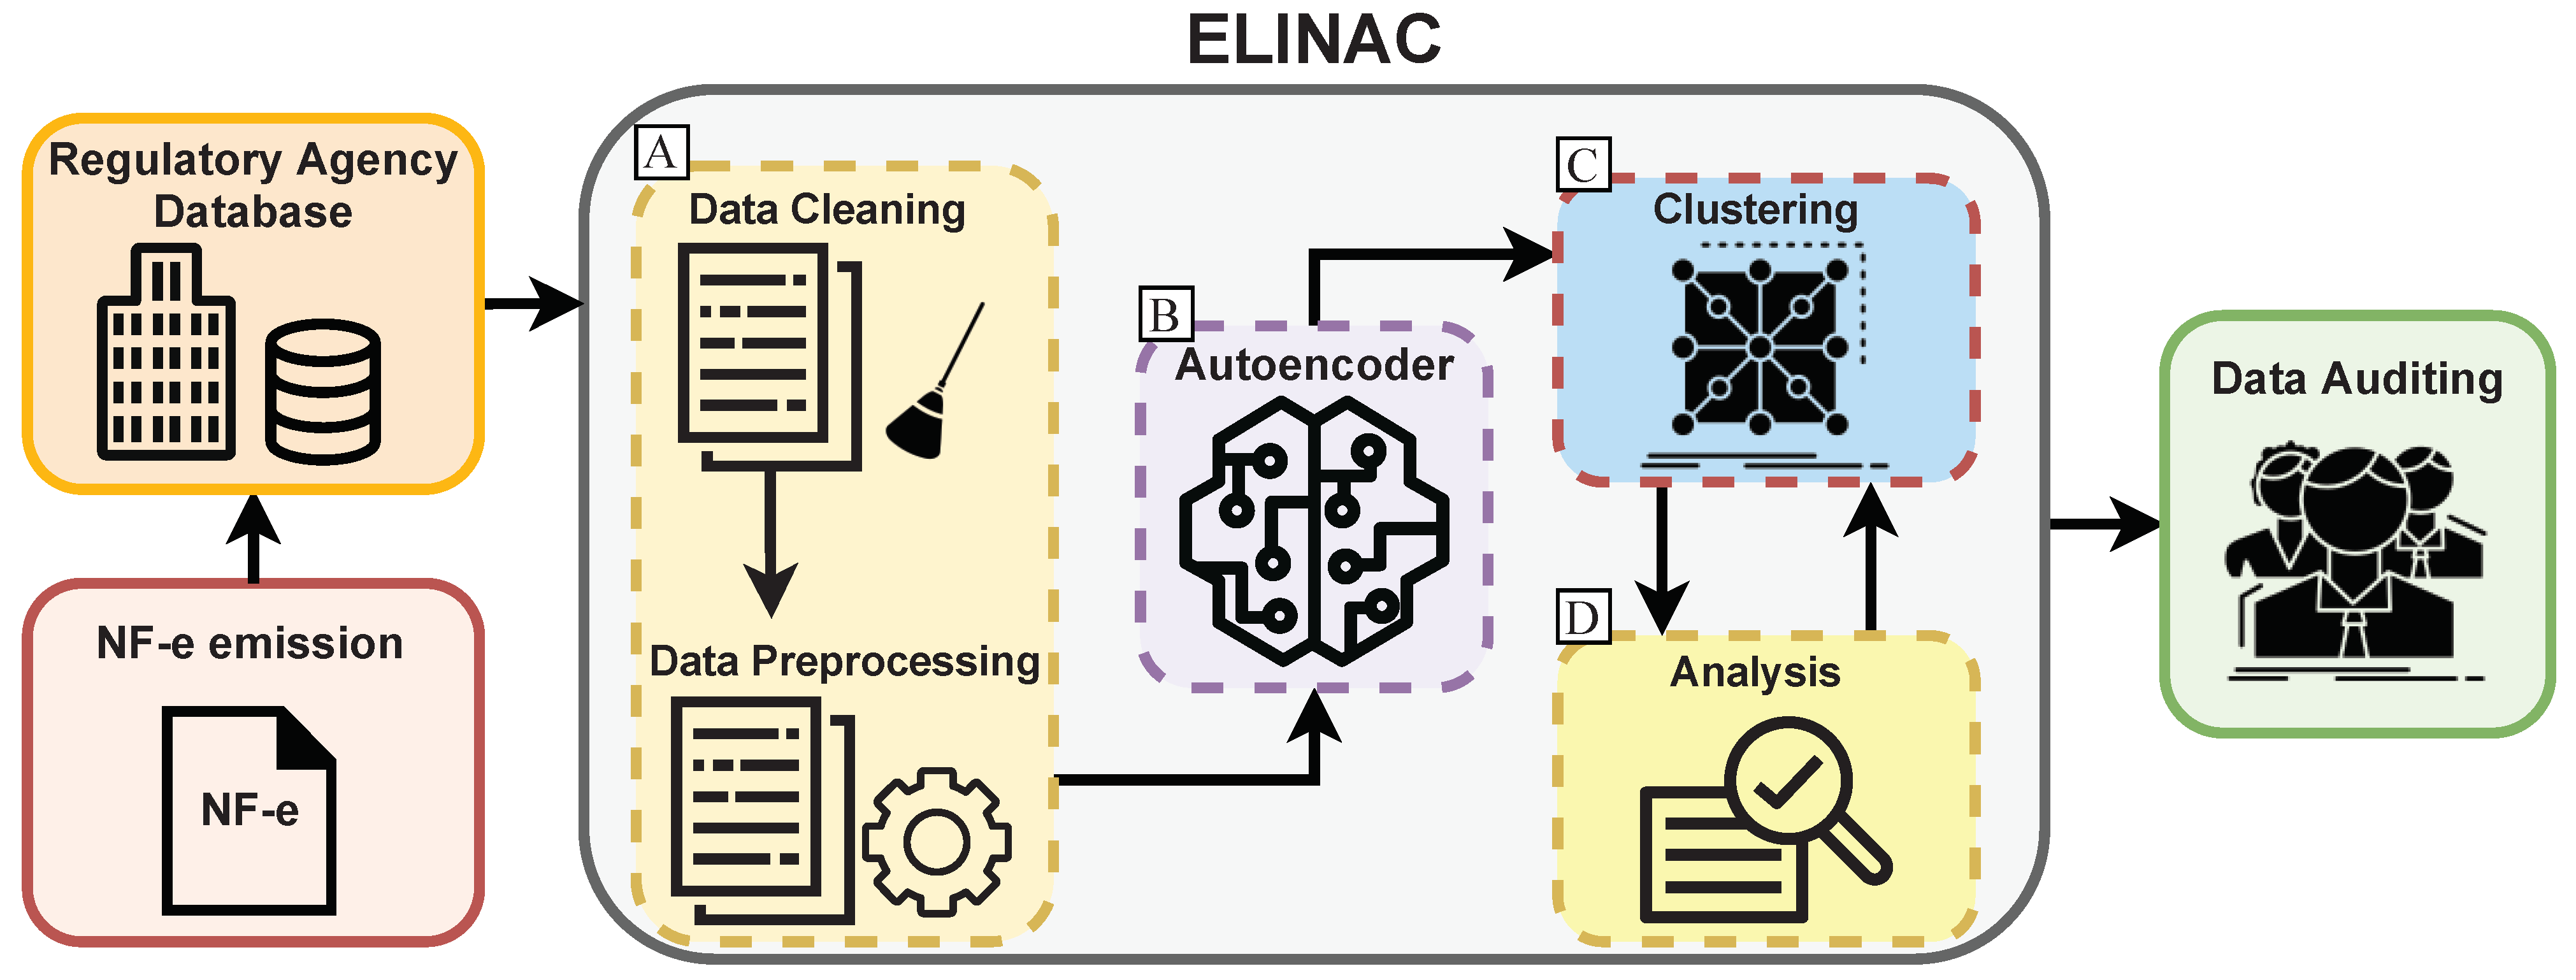
For a better understanding of the proposed service,
Figure 1 shows an overview of how ELINAC works, from the NF-e emission until the auditing. After the extraction of the data from a regulatory agency, the NF-e dataset goes through the process of removing unneeded information from the description field (Label A,
Figure 1), which is filled with human input and contains a significant amount of noise and is very unbalanced [
42,
43,
44,
45]. The data are now better suited for the next step (Label B,
Figure 1), where the autoencoder training generates a reconstruction value based on how similar the short-text description is to the learned features. The reconstruction error output from the autoencoder has significant variations to represent different data, and that variation is the threshold that defines a new cluster.
The clustering phase of ELINAC (Label C,
Figure 1) is performed by an algorithm that searches for the ideal threshold value that represents the necessary variations for the number of clusters requested as a parameter. The clustering is performed in conjunction with the analysis phase (Label D,
Figure 1) since it can be repeated more times depending on the generated clusters. One of the advantages of ELINAC is that when the number of clusters is unknown, the clustering can be performed multiple times in a short time since the data does not need to be retrained in the autoencoder model.
This way, if the analysis presents clusters too specific or too broad, the clustering algorithm can receive a different number of clusters and output the new result almost immediately. Every step in ELINAC is essential for adequate results: the autoencoder cannot generate similar reconstruction error values if the data are not standardized correctly, and if the autoencoder does not produce values with a perceivable variance, the clustering and analysis phase will not generate correct clusters.
3.1. Dataset Description
The dataset used for this research was provided by the Brazilian Federal Court of Accounts (TCU-Brazil), containing every NF-e issued in the state of Paraíba, between March and July of 2020, with more than 929 thousand records. NF-e was implemented to substitute physical invoices and give judicial validity in transactions for the tax office. The dataset used contains information from the Court’s database protected by Brazil’s General Personal Data Protection Law (LGPD). LGPD provides guidelines on how to collect and protect personal data in Brazil.
Table 1 shows a sample of the dataset used in ELINAC. Each row in the dataset contains information about one purchase made by a municipality of the state of Paraíba. The columns consist of product category identifier (NCM), product description (DESC), price (VAL), the quantity bought (QT), date of purchase (DATE), product’s measure (unity, box, gallon etc.) (TIP) and the municipality who operated (MUNICIPALITY). The DESC feature has the product description that is used for clustering.
It consists of a few words and values related to the product and does not form a meaningful sentence. Since ELINAC is based on text similarity, clearing the data is essential. Although removing special characters or capitalizing can impact the resulting clusters, there is still unnecessary information, such as the product’s manufacturer or unnecessary abbreviations. This is why ELINAC performs a preprocessing that filters the data to standardize the text.
3.2. Extracting Information from NF-es
The NF-e’s DESC feature has the following pattern: the first two words refer to the product name, followed by some extra description (e.g., if the medication is in the form of drops or ointment, how many pills or milligrams), and finally, the manufacturer and some meta-information, such as the product’s batch (see
Table 1). For our proposal, the only relevant information that we need to use is the product’s name and the numerical description values. For this, we developed an ad hoc filter mechanism that receives the original description and returns only the information that helps cluster the same products together. This process is described as follows:
Cleans the data by removing special characters, capitalizing the text and filtering stopwords to remove articles and prepositions.
Searches for the first word in the string, ignoring every character that comes beforehand.
Stores the first word and searches if another word follows: case negative, the first word is the product’s name; case positive, stores it together with the first word, and both become the product’s name.
Removes every character in the rest of the string that is not a number or the product name.
While keeping all the numbers after the product’s name can still include noise, these values are fundamental to identify anomalies in the invoice’s values in the formed clustering. For instance, product A boxed of 30 should not be clustered with product A boxed of 60 because the price would be higher and therefore be labeled as an anomaly. Meta information like the batch number and expiration date were removed in the cleaning step, so the numeric characters should refer to the product.
Table 2 shows NF-e’s DESC feature when using the filter mechanism. It is observed that such a mechanism returns only the information that helps cluster the same products together. For instance, in
Table 2, three different DESC are presented, in which the same product had different manufacturers, and its dosage and the amount of pills were written in different forms. After using the proposed mechanism, we get all the information that describes the product itself, discarding everything else. This technique makes the description field more standardized and better suited for clustering, especially for the autoencoder approach, which is mainly based on text similarity.
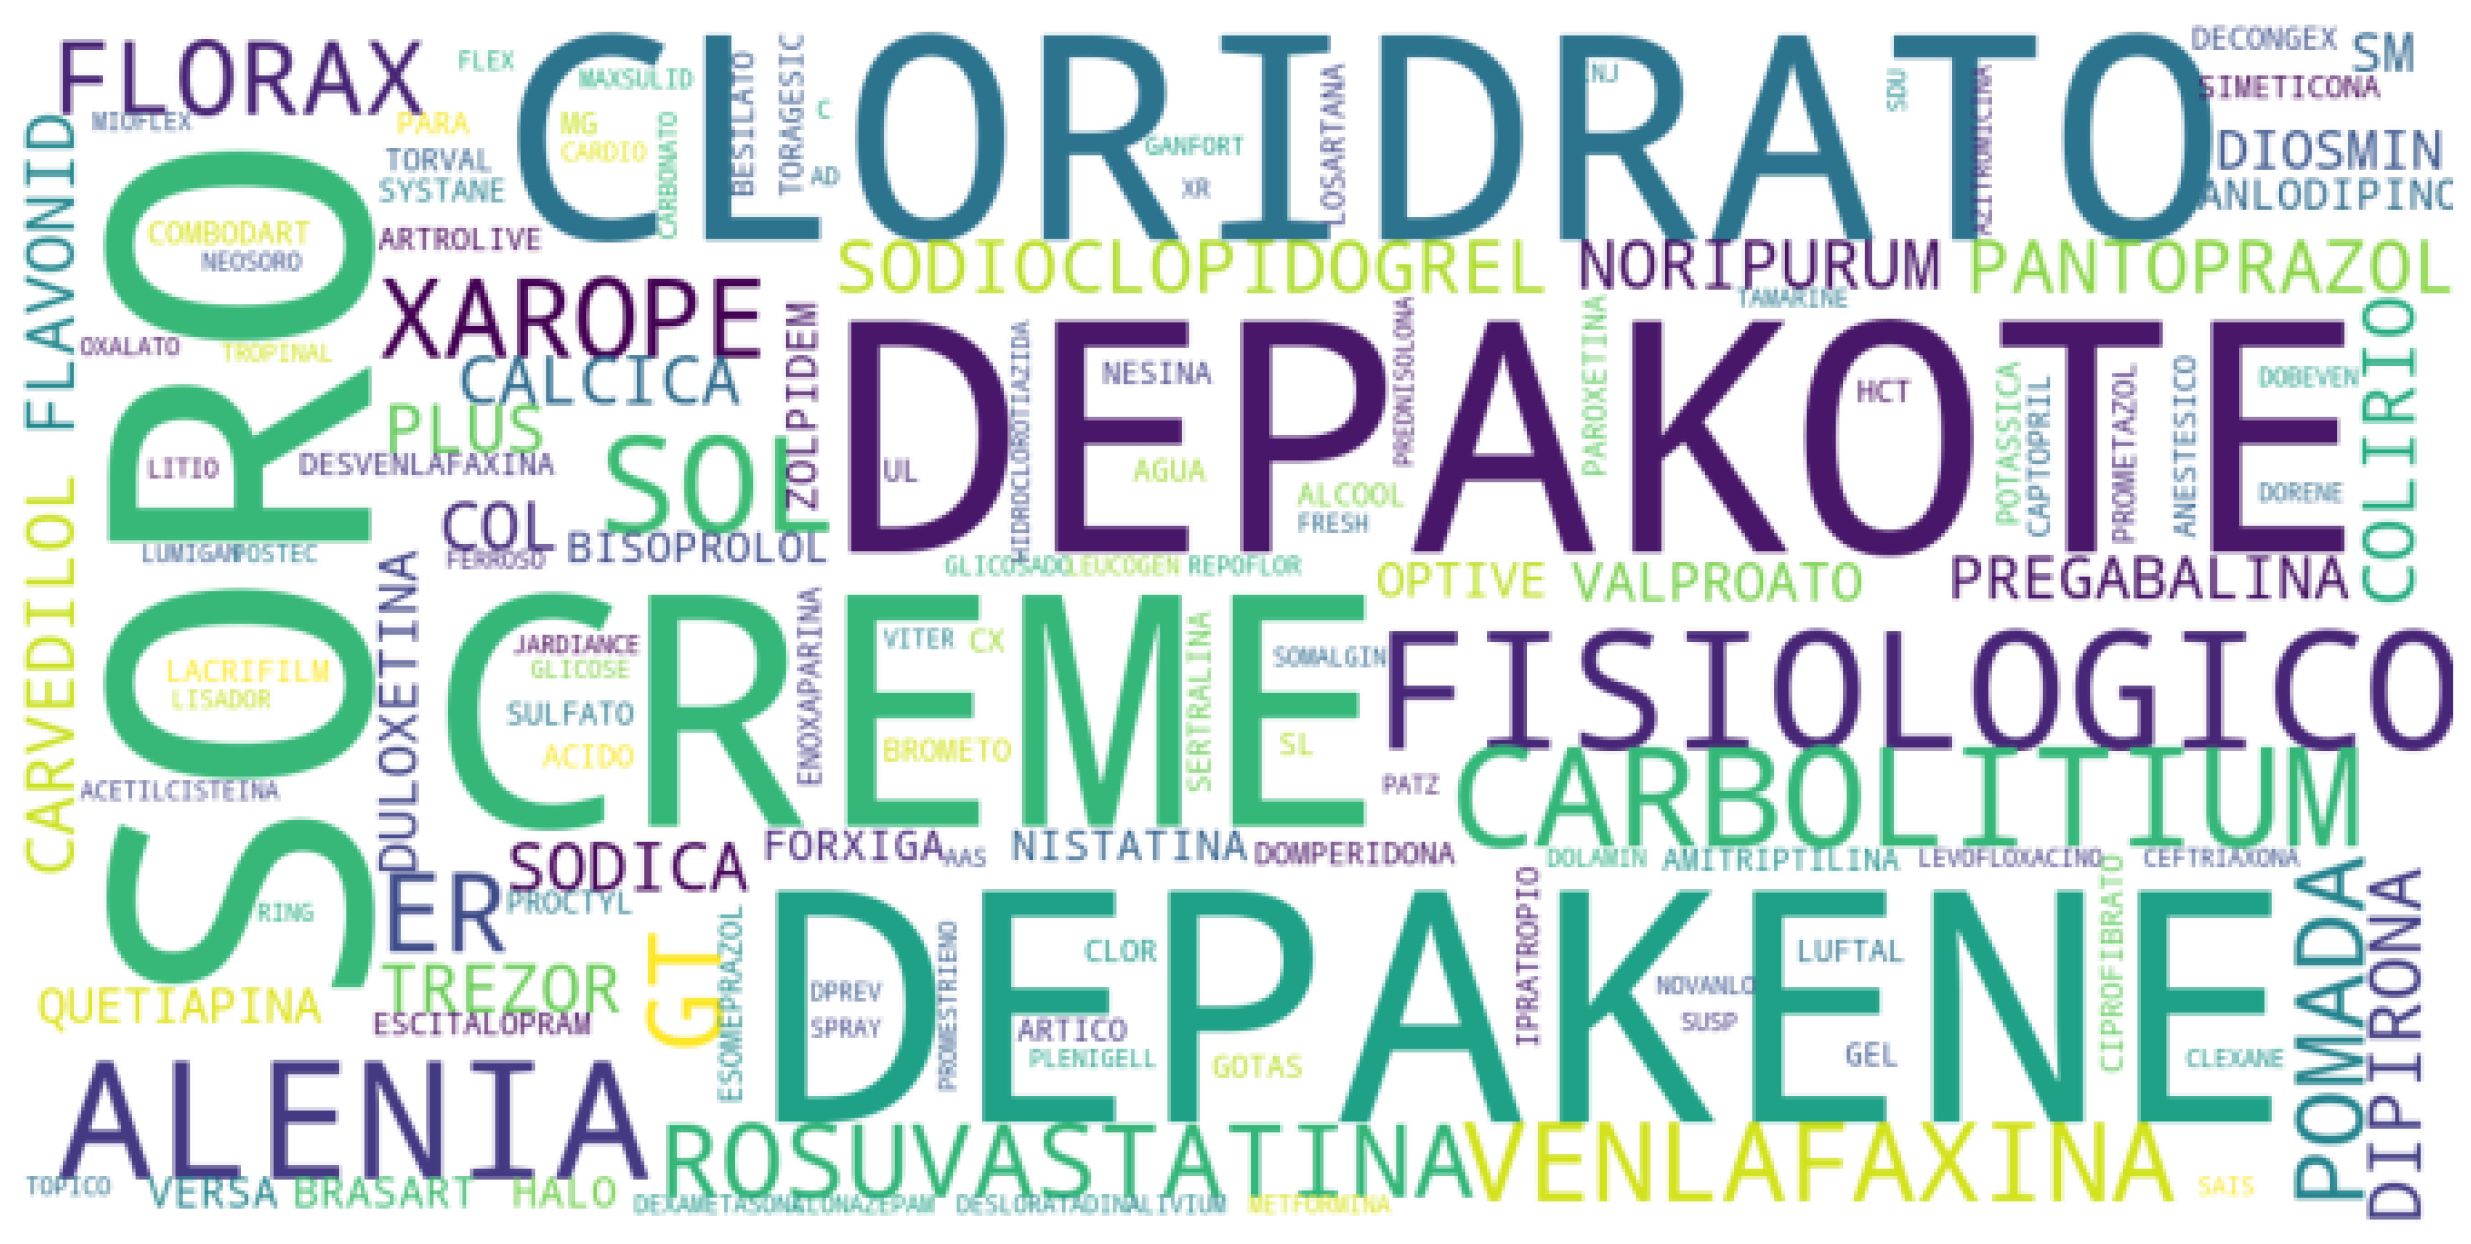
Evaluating clustering results is not a trivial task, especially when using unlabeled data. To support this task, we labeled a sample of the entire dataset used for the clustering metrics in the experiments. For this, we use the NCM field to filter the data with the most occurrences, “30049099”, consisting of medications and TIP field equal to “UN”, meaning the product purchased is unitary.
The resulting data has roughly 21 thousand records. The word cloud presented in
Figure 2 shows the most common words in the reduced data, in which the majority refers to a medication’s name or type.
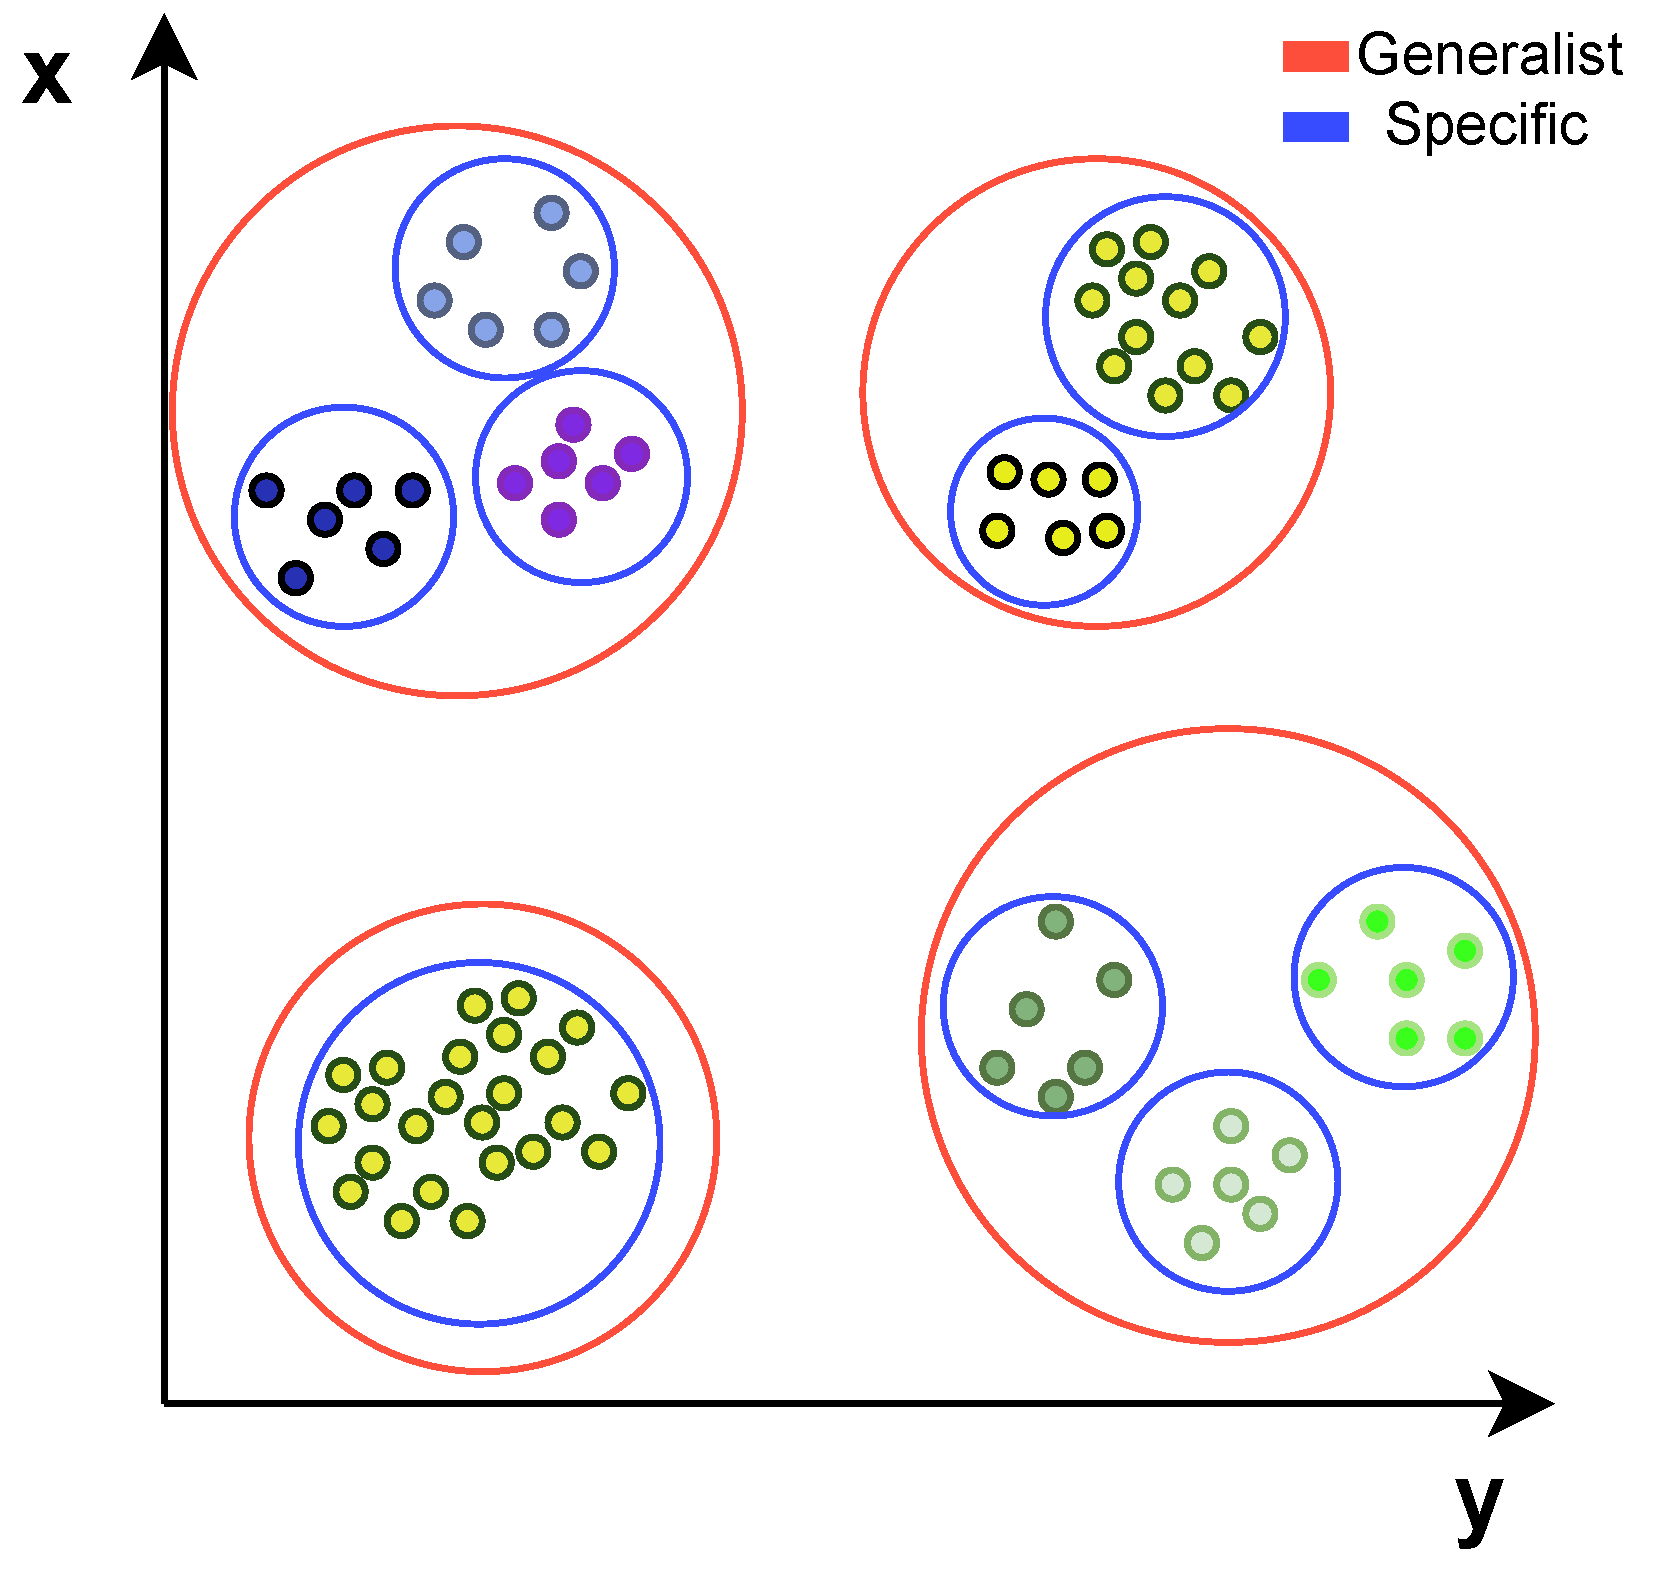
The reduced dataset received two labels for each record.
Figure 3 shows a representation of how the labels were assigned. The specific label describes medications with the same description, meaning they have the same name, dosage, amount of pills and others. It resulted in 3173 different clusters, meaning the average cluster size is close to 7. The generalist label ignores additional information related to the medication, meaning it groups only by name, resulting in 1564 clusters averaging the size of 13.
Labeling the dataset with this approach had mainly two reasons: the specific label tests the method capacity of grouping by text similarity since the descriptions are close to being the same, especially after preprocessing the data. The generalist label aims to test if an autoencoder approach for clustering can generalize the data and not depend only on literal text similarity.
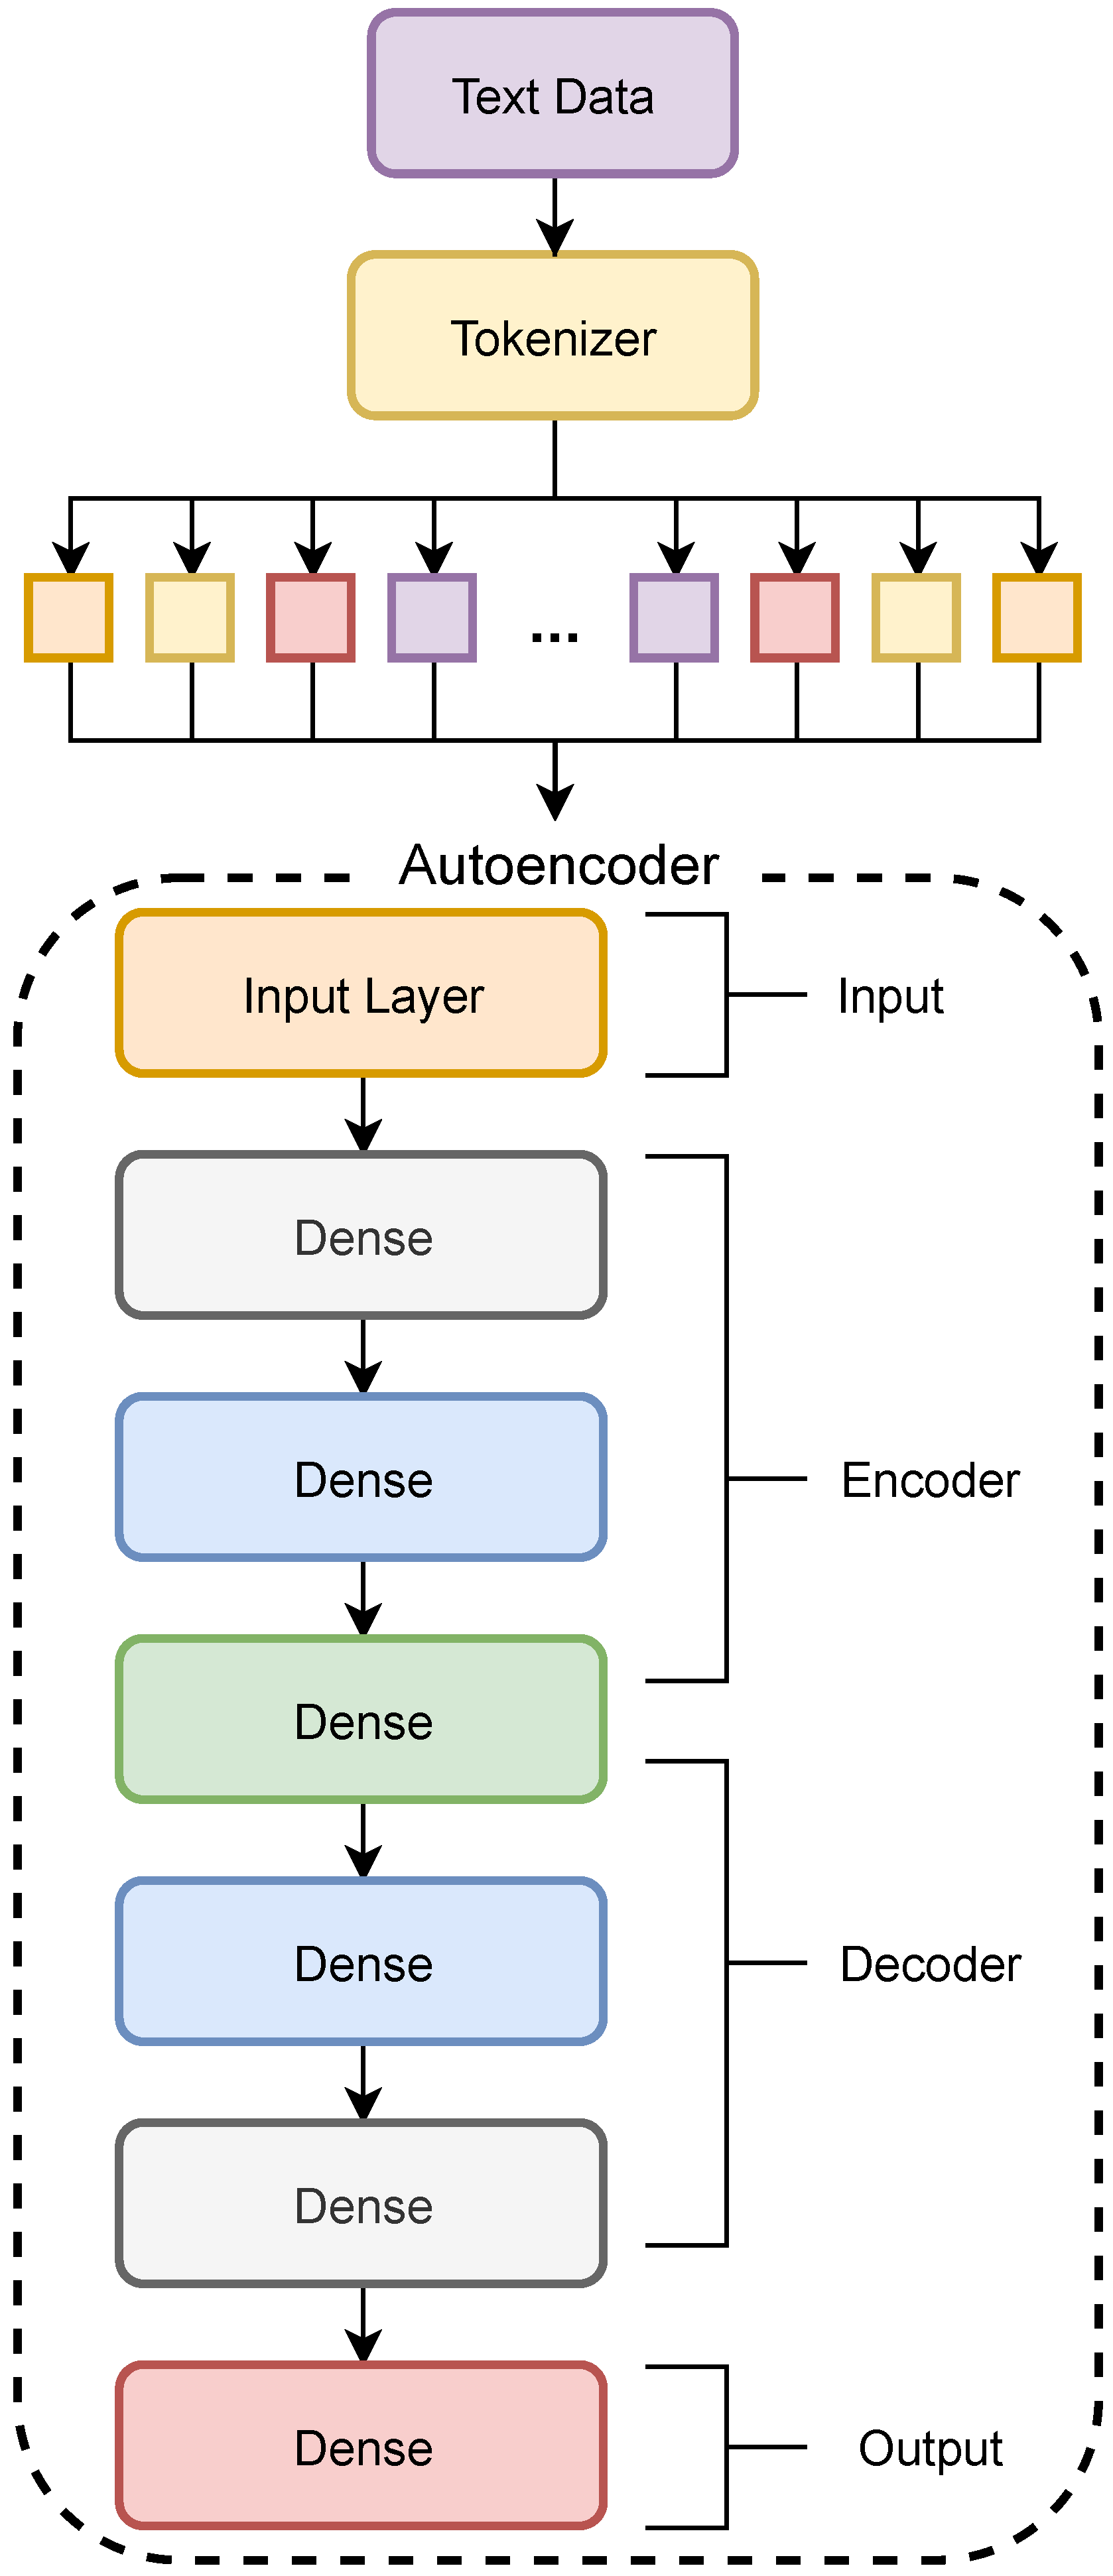
3.3. ELINAC’s Autoencoder Model
Autoencoders are NNs that can be used to detect anomalies due to their ability of dimensionality reduction for multidimensional data [
46]. In ELINAC, the modeled autoencoder follows the standard architecture (
Figure 4), which consists of hidden layers with fewer nodes than the input layer, and their outputs are reduced representations of the input data. The network is symmetric and can be split into two [
46]: the encoder, which learns the encoding function
, and the decoder, the decoding function
.
The modeled autoencoder works as follows: the input data
D is applied to the encoder function
and, after going through the dimensionality reduction, the resulting data are applied to the decoder function
, which outputs the reconstructed data [
46]. When enough hidden layers are used, the input data can be represented in a low-dimensional form. The reconstruction error is then calculated by
[
46].
The definition used for ELINAC’s autoencoder shows how a cluster can be formed using the same principle as to how an anomaly can be detected. This is, in ELINAC, the network compresses the input data and then reconstructs it in the decoder function, where the result is the reconstructed input data. Doing so, ELINAC returns a value showing how different one data record is from the dataset, providing us with a value that can be used for clustering. In other words, the output values of ELINAC represent how similar the data are compared to what the autoencoder learned from the input.
As shown in
Figure 4, the autoencoder input is created by tokenizing the description field, dividing the text into the same amount of tokens as the nodes of the input layer. Our autoencoder model architecture is symmetric and consists of an encoder and decoder with three hidden layers each, where the input layer consists of 16 nodes and the bottleneck layer consists of four nodes. The network’s layers are activated by the relu function, and the model is compiled using the Adam [
47] optimizer.
3.4. ELINAC’s Clustering
After the autoencoder processes the input data in ELINAC, we have our output data, where every row with a description has a value corresponding to its reconstruction error. The next step is applying our hypotheses that similar descriptions are already grouped by having similar reconstruction errors, and all that is left to do is to find these clusters and label them.
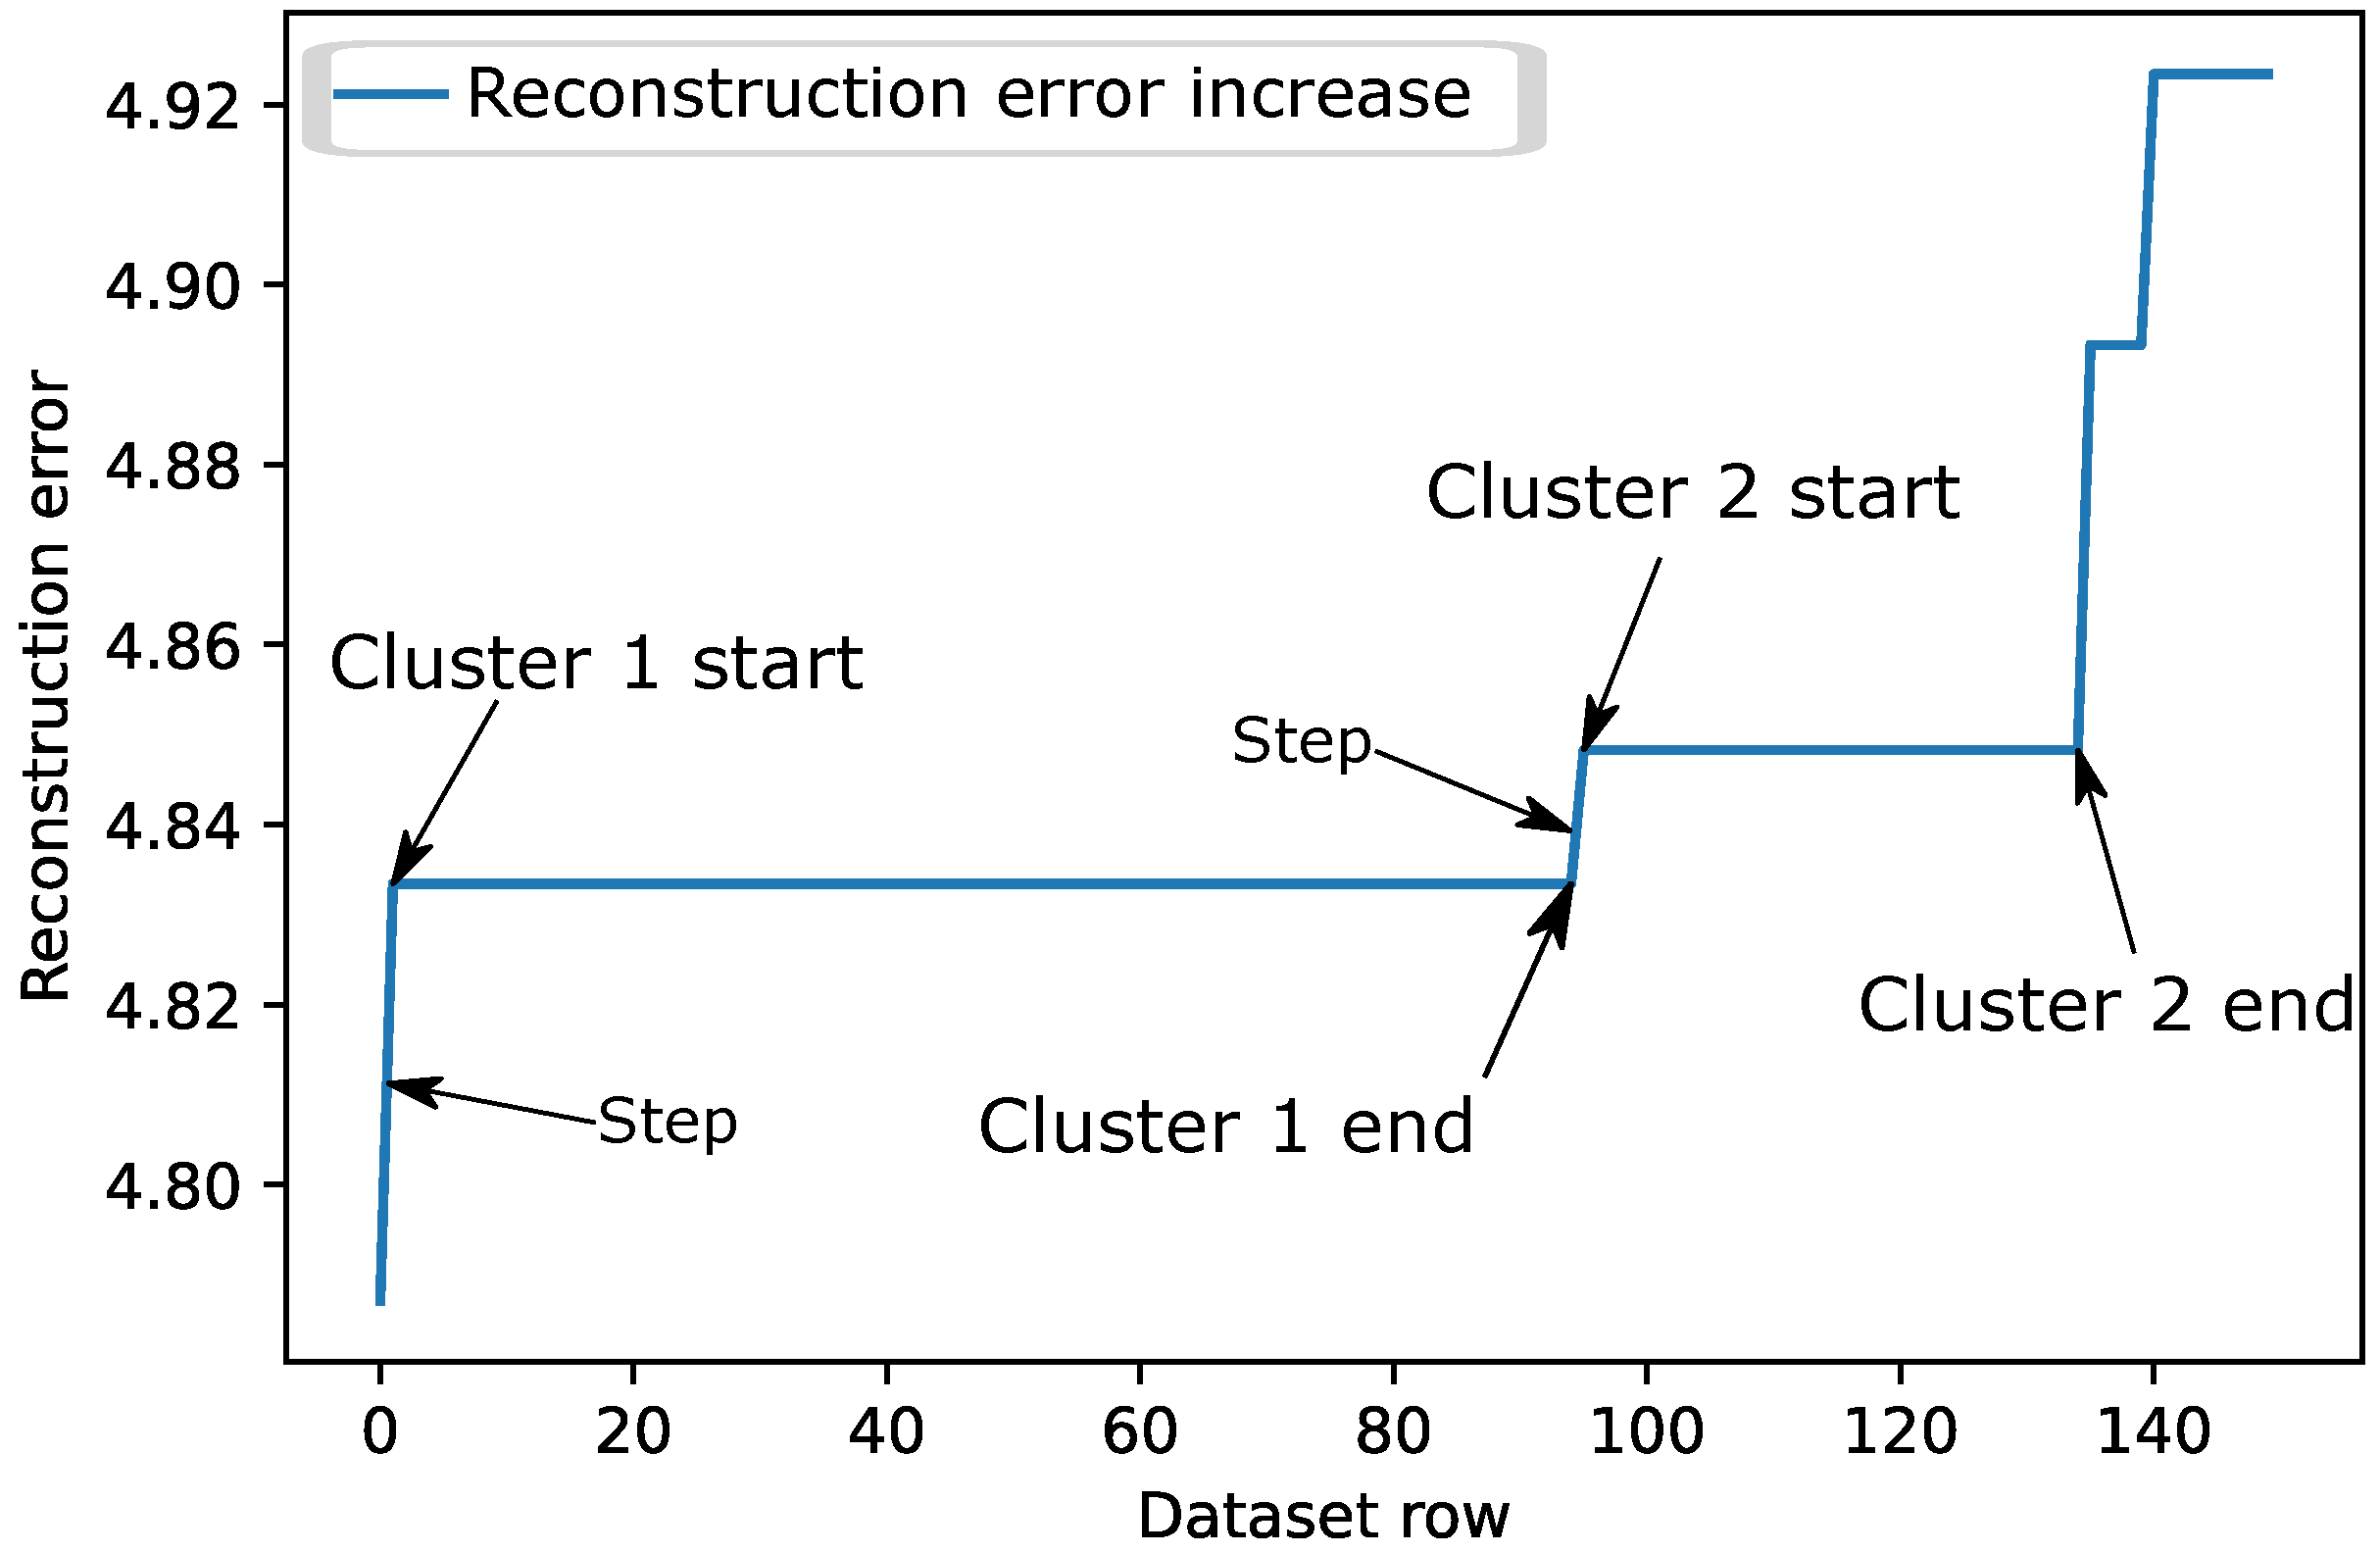
Figure 5 shows how the reconstruction error increases for the first 150 rows by sorting the reconstruction value from the lowest to the highest value. It is observed that the data presents itself in “steps”. Some of them are long, meaning that there are many similar descriptions, while others are short but also very high when only a few similar descriptions differ more from others. To be considered the start of a new cluster, the reconstruction error increase between two rows has to be higher than a threshold value used for comparison between every row.
The process used for searching and labeling the clusters based on the autoencoder output in ELINAC is described in Algorithm 1. Keeping in mind that efficient time is one of the desirable factors for our clustering, the algorithm was based on the binary search algorithm because of its average-case complexity of . The logarithmic complexity is applied in the range of possible threshold T, meaning the main loop has a complexity of .
For each iteration, the algorithm runs through every dataset row (lines 9 to 17), adding an extra
complexity for every repetition. Therefore, the final complexity of our algorithm comes to
, where
I represents the iterations of the while loop (average number of iterations when applying
), and
N is the dataframe size. The average value of
I in our experiments was
. Even when changing the values of
den (denominator value used to search the threshold ranging from 100 to 10,000), the number of clusters and the size of the dataset never surpassed 20 iterations. Therefore, the size of
I does not scale with the value of
N, which would make the algorithm’s final complexity
.
| Algorithm 1 Cluster algorithm. |
| Require:target ≥ 0 | ▹ Target amount of clusters |
| Ensure:df ≠ NULL | ▹ Dataframe |
| 1: den ← 4000 | ▹ Denominator of the threshold |
| 2: flag ← 0 | ▹ Stop flag |
| 3: clusters ← 0 | ▹ Clusters found |
| 4: max ← 0 | ▹ Maximum denominator |
| 5: min ← 0 | ▹ Minimum denominator |
| 6: while clusters ≠ target and den ≠ flag do | |
| 7: clusters ← 0 | |
| 8: flag ← den | |
| 9: for row in df do | |
| 10: row.shifted ← row.error.shift(1) | |
| 11: if row.error ≥ row.shifted ∗ 1 + (1/den) then | |
| 12: row.cluster ← 1 | |
| 13: clusters ← clusters + 1 | |
| 14: else | |
| 15: row.cluster ← 0 | |
| 16: end if | |
| 17: end for | |
| 18: if clusters > target then | |
| 19: max ← den | |
| 20: den ← (max + min)/2 | |
| 21: else if max ≠ 0 then | |
| 22: min ← den | |
| 23: den ← (max + min)/2 | |
| 24: else | |
| 25: den ← den ∗ 2 | |
| 26: end if | |
| 27: end while | |
The main difference between the binary search algorithm and ELINAC’s is that we do not have the start and end values used when searching a list. To solve this problem, Algorithm 1 initializes with a denominator value () (line 1), which is the value used to find the threshold. Based on the initial denominator value and the minimum () as 0, the algorithm runs its first iteration to check if the number of clusters found is higher or lower than our target (line 18).
If higher, it assigns the initial max as the denominator in line 19, and if lower, it doubles the denominator value in line 25 until the condition in line 18 passes and the maximum () value is updated in line 19. Now that we know the maximum and minimum limits for our denominator, the algorithm looks for the middle. If it is higher, update the minimum limit (line 22) and the middle value (line 23); if it is lower, update the maximum limit (line 19) and the middle value (line 20). Then, repeat the loop in line 6 until it finds the correct threshold.
The threshold calculated in line 11 of Algorithm 1 is a very low number, most of the time close to
, which is why the algorithm increases or decreases the denominator for its calculation
, and the starting
value is 4000. These values were chosen based on the average number of iterations needed to find the threshold value, where 4000 had the best result, which is shown in
Table 3. We then compare each row’s reconstruction error with the following. If the next value is higher than the current value times the threshold, mark it as a new cluster start. The clustering is finished if the number of clusters assigned is the same as our target.
The algorithm uses a stop flag variable called “flag” that breaks the loop when the target number of clusters cannot be achieved due to a lack of variance in the output values or data being smaller than the desired amount of clusters. Finally, it is necessary to enumerate each cluster. For this, the algorithm passes through every row assigning a label. Whenever is marked as 1, the cluster value increases.
In mathematical terms, the algorithm receives an array R of size N (dataset size), which consists of the values for the reconstruction error , , …, attributed to each short-text description, where, for each element i in the array, . The target value is the number of clusters , , …, being searched, and the number of clusters found in each iteration. There is a value of threshold calculated by , which is the number of pairs where is true is equal to .
To search for
, we assume an array
V of possible rational values
, knowing that values lower than 1 are not possible, and values greater than 2 are too divergent to be considered a cluster. The binary search algorithm is applied to
V, to search for
in its range of possible values. To start, the value for
is set to 4000, which is the value that, on average, produces the fewest number of iterations through
V. The maximum
and minimum
values are started as 0 and are updated according to the following function:
4. Performance Evaluation
This section presents the methodology used to validate ELINAC. For this, ELINAC was evaluated in two stages. In the first stage, ELINAC’s capacity in clustering short-text data is evaluated, presented in
Section 4.2. Then, in the second stage, the performance evaluation of the ELINAC to cluster short-text data is performed, comparing it with other approaches used in the literature, presented in
Section 4.3. The scenario setup, the parameters used to generate the models, and the chosen metrics are presented below.
4.1. Scenario Setup
The experiments were performed on an i7-4770k CPU (base clock), GTX 1660 6GB GPU and 16 GB of RAM running Python version 3.7.9 [
48]. ELINAC was implemented using the Tensorflow framework [
49] in conjunction with the scikit-learn library [
50]. To validate the ELINAC, the following algorithms from the literature were used for comparison: (i) K-means clustering [
51,
52]; (ii) Hierarchical clustering [
53]; and (iii) DBSCAN [
22].
Table 4 shows the parameter set used in the algorithms.
As the goal is to evaluate the efficiency of ELINAC in clustering, the following performance measures were used:
Clustering Time: Measures the efficiency of the clustering method, starting when the data input is fed to a clustering method and ending when all the clusters are assigned to the input data.
Homogeneity: Evaluates if each cluster contains only members of a single class.
Completeness: Evaluates if all members of a given class are assigned to the same cluster.
Mutual Information: Measures the agreement of the two assignments, ignoring permutations.
Pair Confusion Matrix: The matrix compares two clustering results, considering all samples and counting pairs assigned to the same or into different clusters. The matrix elements contain information about four types of pairings, (True Negatives), (False Positives), (False Negatives) and (True Positives).
Fowlkes-Mallows: Calculates the Fowlkes–Mallows score FMI, defined as the geometric mean of the pairwise precision and recall. Its formula is presented in Equation (
1), where
is the number of True Positives,
is the number of False Positives, and
is the number of False Negatives.
4.2. Performance Evaluation of ELINAC in Clustering Short-Text Data
ELINAC was trained using an 80/20 train-test-split. Although the number of epochs for clustering may vary, the model ran for 100 epochs to evaluate the training metrics progression for our NF-e dataset. The number of epochs needed for optimal clustering is discussed further in this section. The network’s hidden layers use the rectifier activation function (i.e., relu), which applies the rectified linear unit to the node’s input. The model is optimized by the Adam algorithm [
47], a stochastic gradient descent method based on adaptive estimation of first and second-order moments that is computationally efficient and suited for problems with large data [
47], with a default learning rate of
.
The first step to validating the ELINAC is to evaluate its training process using conventional autoencoder metrics and then compare it to the clustering metrics behavior when training the same data.
Figure 6 presents the values for the Mean Absolute Error (MAE, defined in Equation (
2)) and the Mean Squared Error (MSE, defined in Equation (
3)) over epochs. The results present a typical behavior for autoencoder training, where the curve starts with a sharp decrease until it rectifies and converges. This means that the ELINAC has a conventional training behavior for the data used for this research.
The resulting reconstruction error also evaluates ELINAC’s short-text data clustering process to identify outliers.
Figure 7 presents the reconstruction error value increase over each row of the dataset when sorted from lowest to highest. In a conventional outlier approach, the records in the sharp increase towards the end would be labeled as outliers. Therefore, the resulting reconstruction error follows the expected behavior to identify outliers.
The training results presented in
Figure 6 and
Figure 7 showed that the ELINAC has a typical training curve and produces the reconstruction error value with the same pattern used purely for outlier detection. This makes sense as ELINAC was modeled based on the autoencoder. The next step to validate the ELINAC is to evaluate the behavior of the clustering metrics when training the model with the same input data as before.
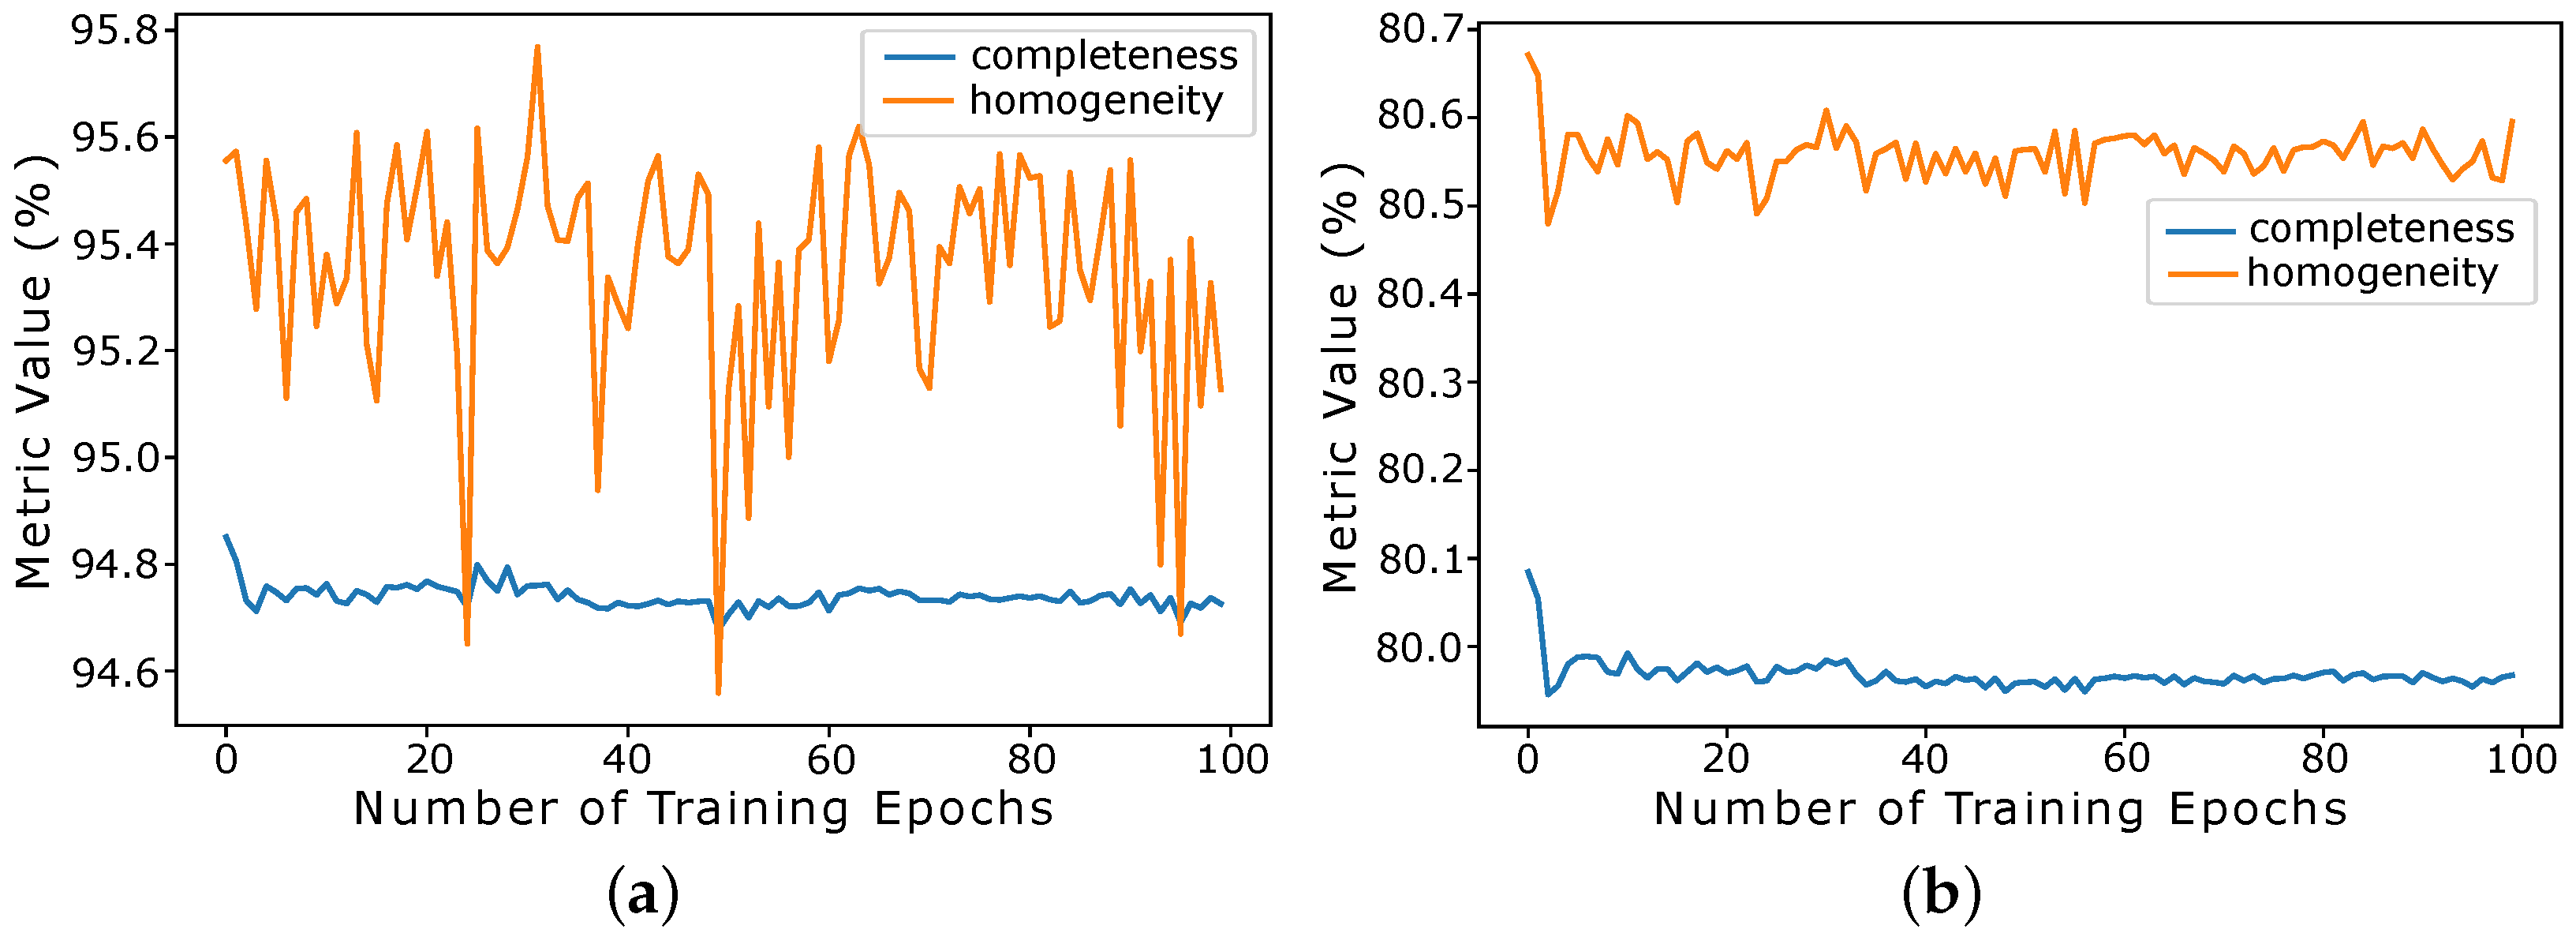
Figure 8 presents the variation of the Completeness and Homogeneity metrics in relation to epochs training, illustrating a comparative analysis with specific clusters (
Figure 8a) and generalist clusters (
Figure 8b). As the number of epochs increases, we observed that there is stability for the completeness metric and dispersion for the homogeneity metric, as presented in
Figure 8a. This is because specific clusters have a small average size, meaning that the homogeneity of a cluster is more prone to change when records are incorrectly assigned. It should be noted that, for generalist clusters (
Figure 8b), there is stability in accuracy regardless of the metric used. This makes sense because larger clusters are less prone to variations.
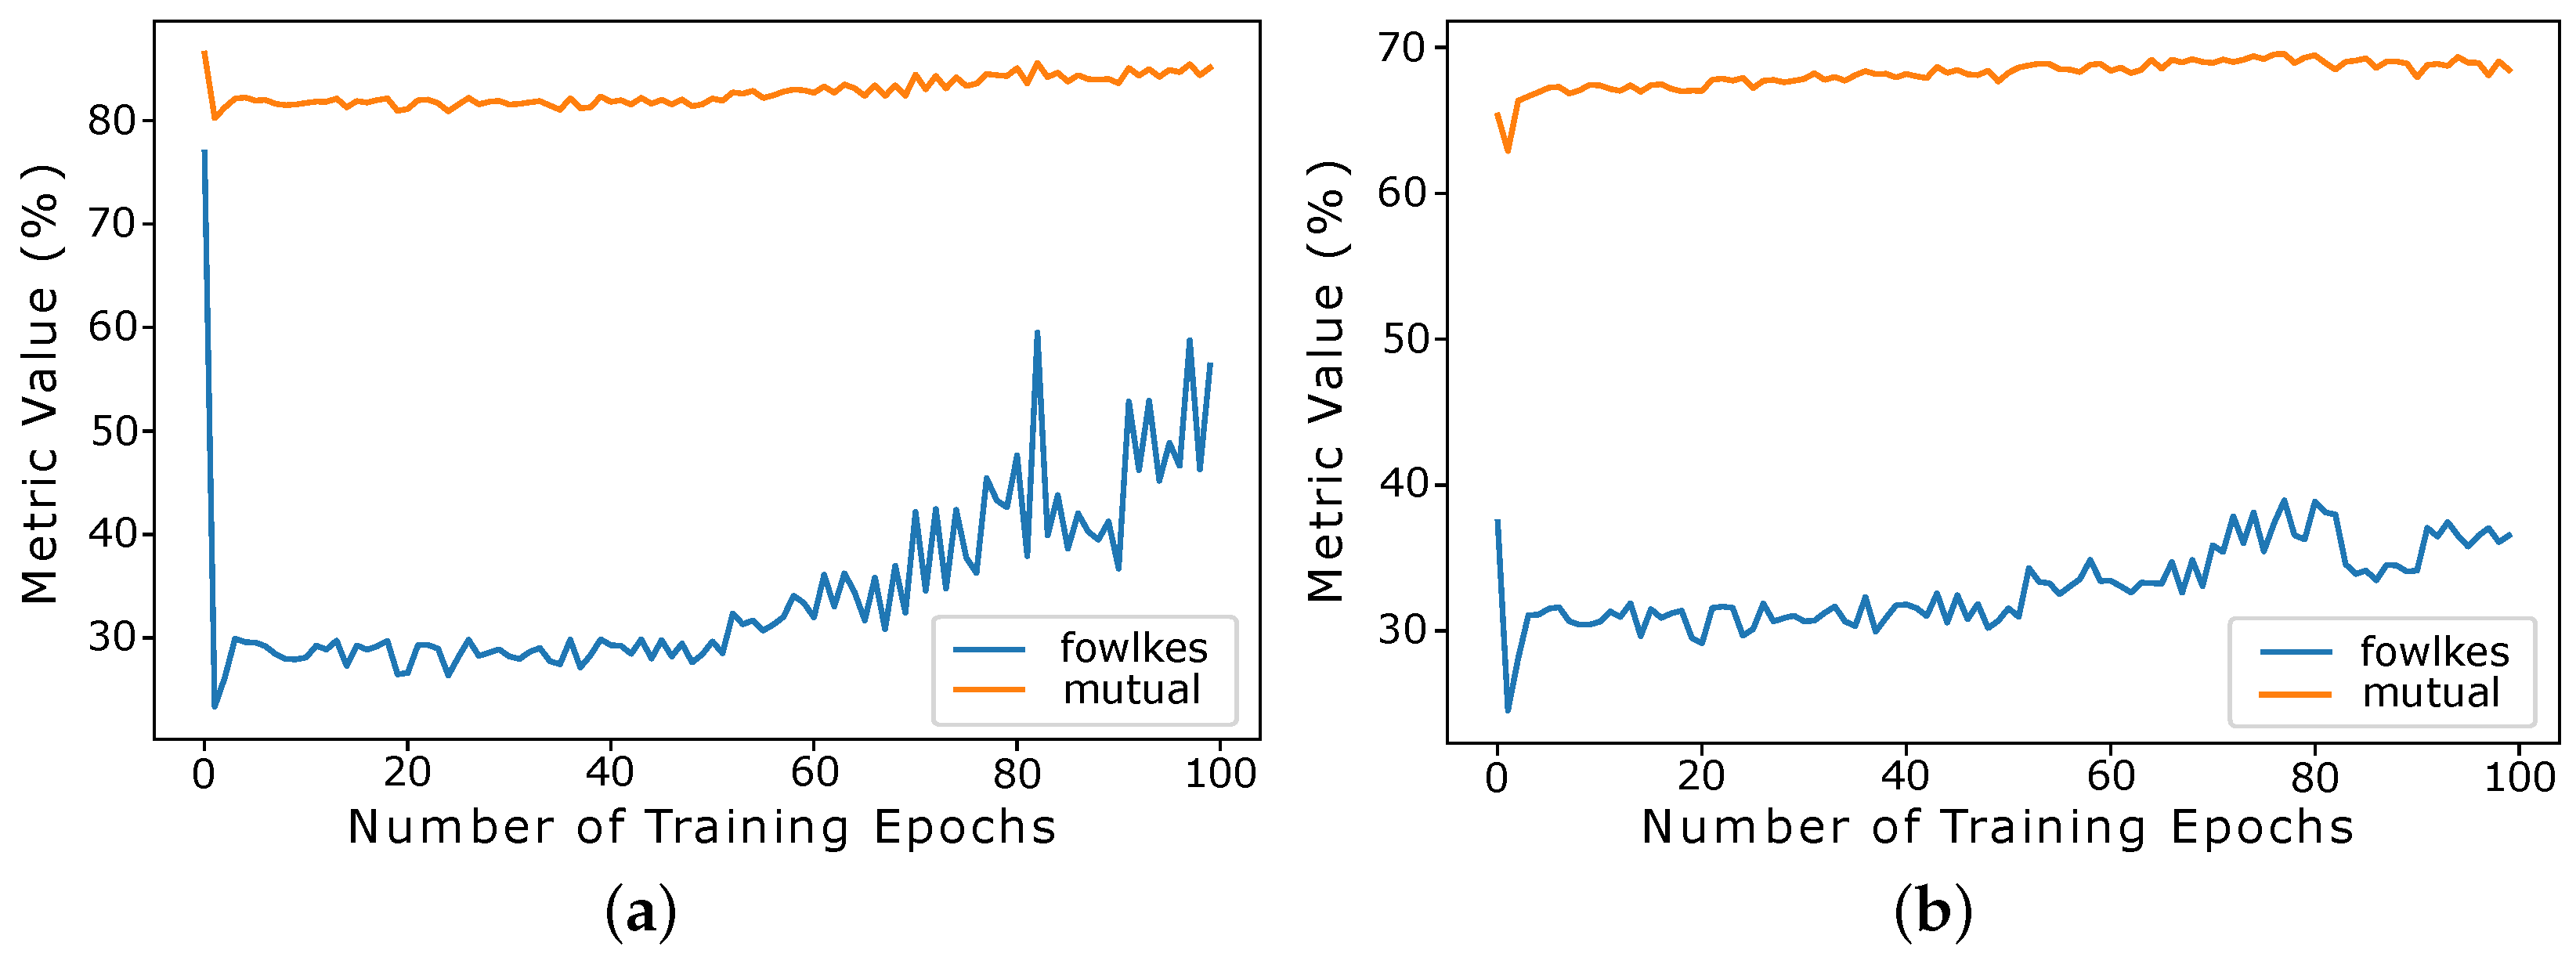
The variation for the Mutual Info and Fowlkes–Mallows metrics in relation to epochs training is shown in
Figure 9, comparing the behavior for specific clusters (
Figure 9a) and generalist clusters (
Figure 9b). The Mutual metric presents very consistent results with a slight increase towards the end, but not enough to justify the loss in other metrics. For the Fowlkes–Mallows metric, it is possible to notice a sharp decline after the first epoch, especially for specific clusters. These values confirm that ELINAC does not need many epochs to cluster this dataset, showing satisfactory results in the process of identifying outliers.
These results reveal that the ELINAC does not need many epochs to reach optimal clustering metrics and the reduced dataset used for the experiments. Although the reduced dataset only takes a few epochs to reach optimal results, we observed that ELINAC may need more training epochs to achieve optimal results for different datasets. This happens because the ELINAC’s purpose is to generate a value for each record so that similar values can group similar texts. Therefore, ELINAC proved to be efficient for clustering short-text data.
4.3. ELINAC’s Performance Evaluation versus Other Literature Approaches
To validate ELINAC, a comparative analysis with other approaches to literature was performed, as presented in
Table 5. The results are shown for both cluster types (i.e., specific and generalist), and the values of the clustering metrics are compared for the chosen clustering approaches. For specific clusters, the results for most metrics are relatively close, where ELINAC has a Completeness of 95% while others range between 96% and 97%, and for Homogeneity, ELINAC performs better than DBSCAN and is less than 2% away from the best scoring method, the Hierarchical algorithm.
For Mutual info, K-means stands out, being almost 2% better than second place. Fowlkes–Mallows is the metric that presents more variation. K-means has the higher value, and ELINAC and Hierarchical have very close results, both close to 78% with DBSCAN almost 3% lower. ELINAC presents a drop in performance for generalist clusters; however, the same also happens for DBSCAN and K-means. ELINAC and K-means can perform with consistency, whereas DBSCAN has very high Completeness but also low Homogeneity with only 19% for Fowlkes–Mallows.
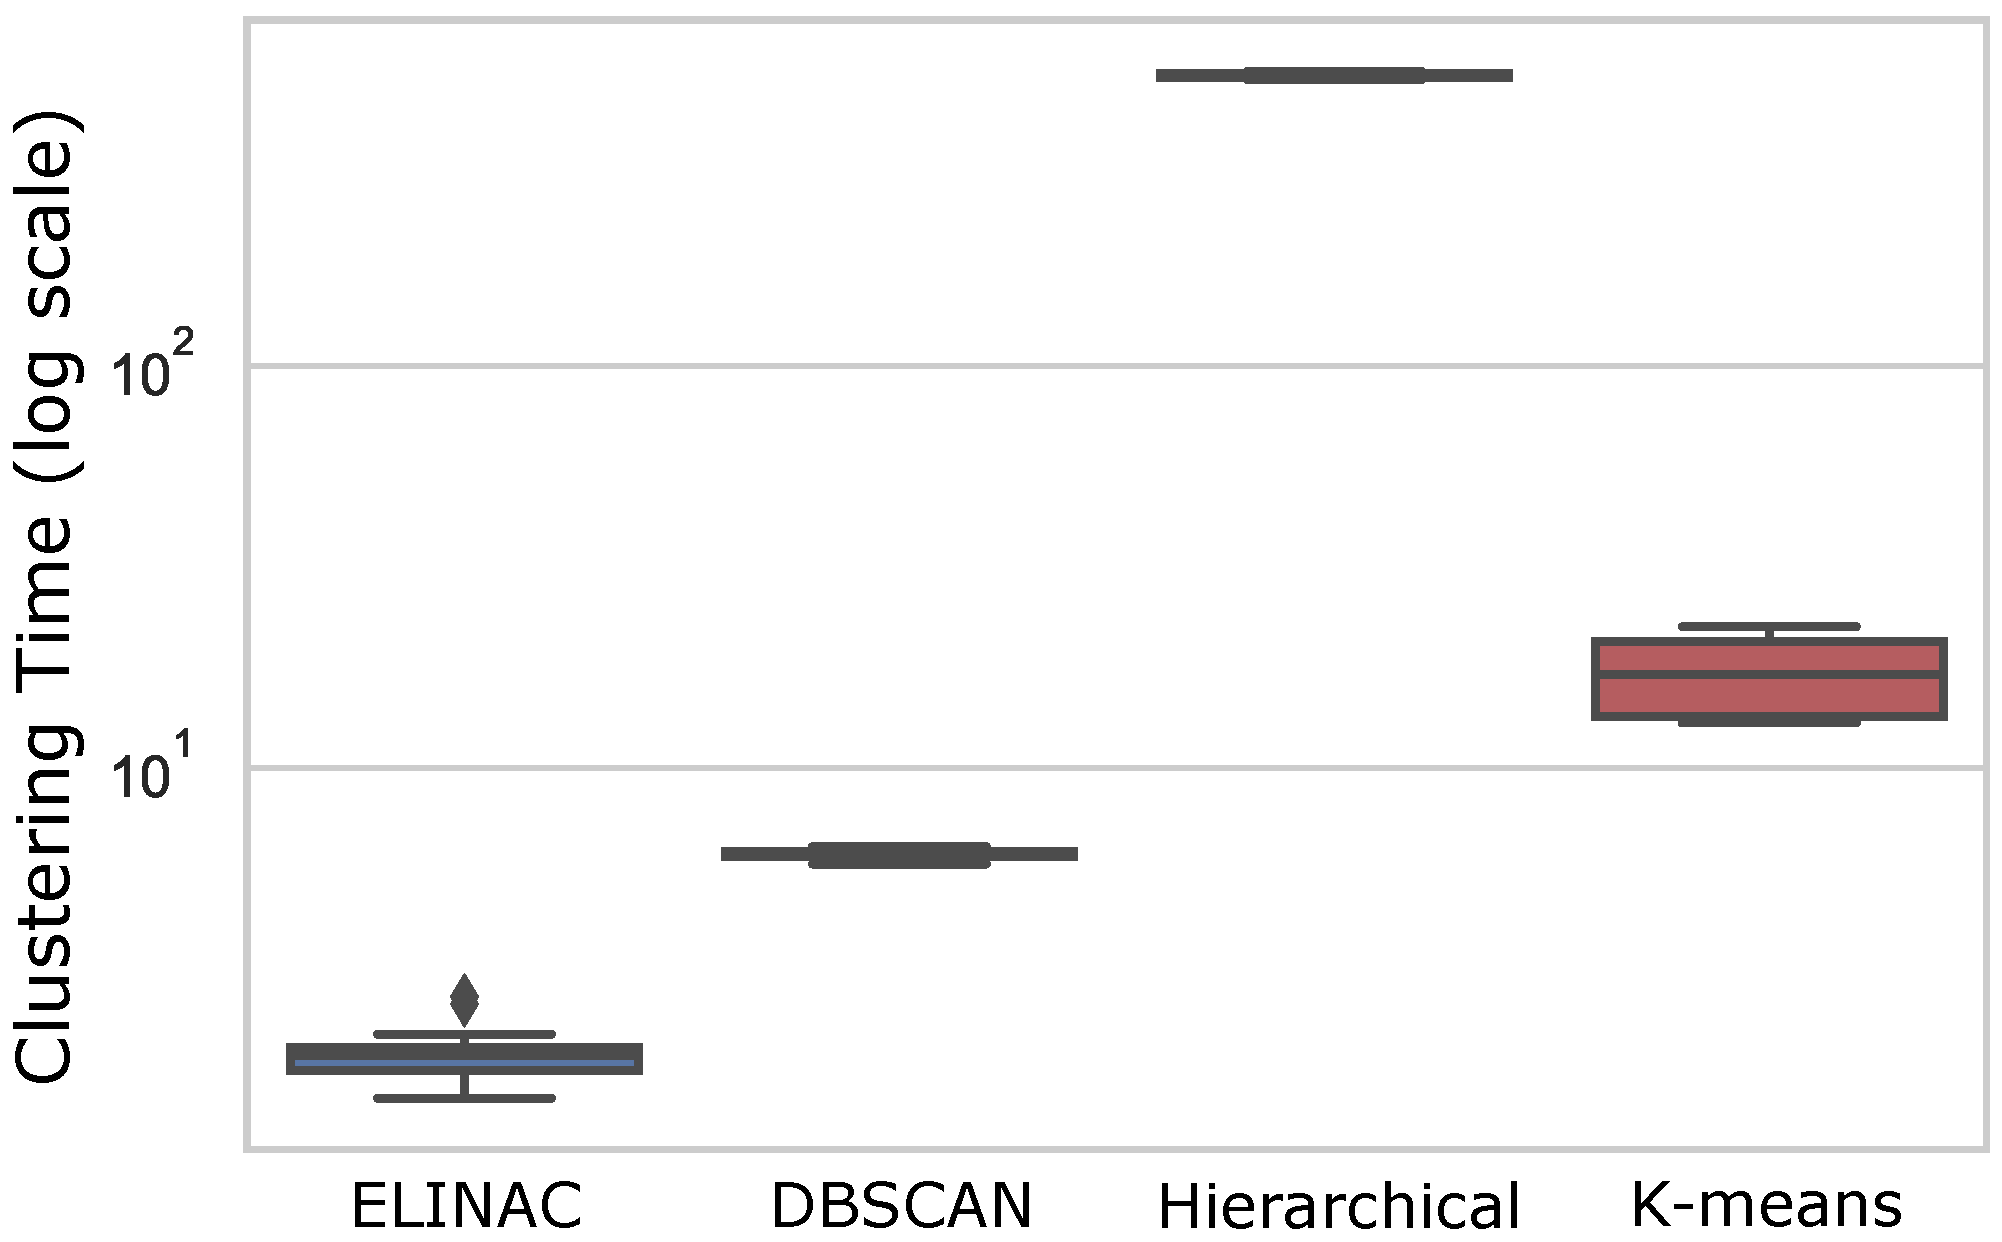
Figure 10 presents the plot of clustering time for each method. The
y axis consists of the logarithmic scale of the time in seconds to better visualize the spread in each box. The best performing method is ELINAC, which was capable of averaging a clustering time of 2 s for specific clusters and, even better, 1.8 s for generalist clusters. ELINAC presents more spread in the results than K-means and Hierarchical, which is caused by the fact that most of the time is spent during the autoencoder training phase. ELINAC’s clustering time is considerably better when compared to algorithms in the literature.
Its clustering shows superior performance, that is, three times faster in the worst case. DBSCAN performs second-best behind only ELINAC and produces very consistent times, averaging a clustering time of 6 s for both cluster types. K-means stands out as the method with more variance in time, which is caused by the number of clusters that scale its complexity. The average time for the algorithm is 13.2 s for generalist clusters and 22.1 s for specific clusters. Caused by its quadratic complexity, the worst-performing method is the Hierarchical algorithm, which consistently clusters both generalist and specific clusters in 527.3 and 526.3 s, respectively.
To better evaluate clustering time on big data, a dataset of 1 million NF-e records was used.
Table 6 shows the time needed for clustering, where only two methods were able to finish in a reasonable time. Since the experiment was based on data with the same characteristics as the labeled data set, it is reasonable to assume that the clustering results would be close to the labeled experiments using the same parameters. DBSCAN finished its clustering in 2.7 h (10,000 s) while ELINAC took 200 s per epoch, which means that ELINAC can perform 49 training epochs and still be faster than DBSCAN.
Judging by the algorithm’s complexity, it is reasonable to assume that K-means would eventually finish and have results close to those in the labeled dataset. For the Hierarchical algorithm, when analyzing how long it took for 21 thousand records, we can conclude that, following its quadratic complexity, it would not finish in an admissible time for this project. Based on these results, K-means and Hierarchical are not suited for the objective of extensive clustering NF-e data. We observed that ELINAC is the most appropriate approach to identifying outliers, significantly outperforming the second-best algorithm (i.e., DBSCAN) in the clustering time.
Table 7 presents the values of the pair confusion matrices for specific and generalist clusters in each algorithm. The values represent the number of paired records for each matrix coordinate (True Negatives, True Positives, False Negatives and False Positives).
Analyzing specific clusters in
Table 7, all four methods are very similar, with more noticeable variations in false negatives and false positives. K-means had the better result for the false positives and true negative pairings, while DBSCAN had the best result for false negatives and true positives. ELINAC’s results were close to k-means, with slightly more false negatives. This means that ELINAC is very consistent when compared to the other algorithms. Although the Hierarchical algorithm had similar values, there were more false positives and fewer true negatives when compared to ELINAC.
The variations are clearer for generalist clusters in
Table 7, where the most noticeable difference was between ELINAC and DBSCAN, which presented more false positives. While ELINAC performed worse for generalist clusters compared to its results for specific clusters, it still managed to be very consistent and reliable, in addition to being faster in clustering time (
Figure 10). Contrary to that, DBSCAN showed a great deal of inconsistency, having many more false positives than true positives. For the other methods, K-means and Hierarchical performed similarly for true negatives and false positives but very different for true positives and false negatives.
4.4. Discussion
The performed experiments presented valuable results, which did not diverge much from the initial expectations. Analyzing the results, there was a significant distinction between ELINAC and DBSCAN, which are more time-efficient, and K-means and Hierarchical, which are more time-consuming. While ELINAC and DBSCAN had similarities in clustering metrics, they also performed better when considering the clustering time. For K-means and Hierarchical, clustering metrics showed significantly better results with the penalty of taking more extended, especially for the Hierarchical algorithm.
The Hierarchical algorithm, which used the agglomerative approach, had a significant disadvantage in performance, unlike ELINAC. However, it was very consistent for the clustering metrics, especially for more generalist clusters. While this Hierarchical approach may not be viable for clustering extensive NF-e data, it presented clear advantages in searching for clusters with more variation.
K-means was one of the most consistent approaches, being similar to Hierarchical in most metrics and maintaining close results for generalist clusters. While it performed significantly faster than Hierarchical, its time complexity showed to be a barrier for more extensive datasets, as opposed to ELINAC.
DBSCAN is a common choice for time-efficient clustering solutions due to its complexity. The algorithm presented itself as a balanced solution, providing good clustering results while not consuming much time. The main disadvantage for the method was the inconsistency observed in the Homogeneity and Fowlkes–Mallows metrics, especially when forming homogeneous clusters for the generalist label, unlike ELINAC.
ELINAC accomplished what was proposed: clustering data fast and efficiently. The clustering time results showed that not only is the approach time-effective; however, it also managed to outperform the second fastest algorithm (i.e., DBSCAN) by almost three times regarding the clustering time. Therefore, ELINAC was able to cluster similar to other well-known approaches while doing so considerably faster, demonstrating its advancement to the state-of-the-art.
5. Conclusions and Future Works
A transparent society, where public money transactions are performed with demonstrable integrity and by the people’s need, is still far from reality. With the advance of technology, especially in the field of data science and machine learning, steps are being made in the right direction. This work was made to improve the auditing process of public expenses, providing a solution for entities in charge of supervising the money spent in Brazil.
ELINAC was developed to cluster NF-e data based on a short-text description while performing the process as fast as possible. For that, ELINAC was composed of various components that help achieve its purpose: preprocessing the description, transforming the short-text data through the dimensionality reduction of the autoencoder and, finally, clustering the resulting data with an optimized algorithm.
To evaluate ELINAC, a series of experiments were conducted to validate the results compared to other literature approaches for two different types of clusters. The chosen metrics are meant to represent each method’s ability to create accurate clusters and the computational cost required for that. The results show that ELINAC is efficient in clustering short-text data, showing superiority in the clustering time. Furthermore, ELINAC was able to finish its clustering process three times faster than the second-fastest method, validating its purpose for this work. ELINAC’s main contributions are: (i) clustering short-text data in a short time based on an autoencoder network; (ii) allowing clustering parameters to be adjusted without retraining; (iii) performing faster than traditional clustering models; and (iv) unifying the training process for outlier detection and clustering.
As future work, we intend to analyze the impact of ELINAC on real-time auditing processes. Furthermore, we intend to propose a space-time text collection service to improve the clustering of short-text data in ELINAC. We also intend to develop a tool based on ELINAC that is capable of detecting anomalies, regardless of the domain or structure adopted.


 ,
, 


