Featured Application
Slope engineering; stability analysis; safety evaluation; health monitoring.
Abstract
Due to the effects of time and space, there is a continuous deterioration of the surface layers of earthen sites and a corresponding decline in soil stability. Evaluating the stability of these sites is very important for potential site restoration. In this study, we analyze, evaluate, and summarize the factors that adversely affect the ancient moat site in Liye, a town of Longshan County, Hunan Province, China, through on-site investigation, sampling, and testing. An X-ray diffractometer and a scanning electron microscope were used to analyze the chemical composition and microstructure of the soil sample of the trench, and the ABAQUS software was used to produce two-dimensional models of seriously damaged areas. Using the strength reduction method, we obtained the minimum safety factor of the trench under its natural state and after rainfall; thus, the stability of the trench was examined under different working conditions. Additionally, we evaluated the safety and stability performance of the more dangerous sections to provide a basis for the safety evaluation, protection, and repair of the trench. The results show that rain erosion, freeze–thaw cycles, and man-made damage are the primary factors contributing to a deterioration of the soil site. The safety factor of the trench is found to decrease with increases in water content; thus, water has an impact on the strength of the site wall. The wall soil has larger pores and more initial cracks than does the trench soil, which is easy to peel off. As a result, there is a high probability of a secondary deformation of the wall slope. Our results identify the real state of the existing site and provide both a basis for stability evaluation and a scientific formulation for restoration schemes.
1. Introduction
Soil is one of the widely used building materials in the early stages of mankind. Examination of soil architectural sites in different environments has facilitated a greater understanding of soil and the mastery of its associated properties and characteristics [1]. Because site selection, technology, and materials that comprise earth sites reflect differences in political, military, and cultural information across time, earth sites have considerable research value [2]. Unfortunately, as shown in Figure 1, given the limitations of the material properties, these sites experience surface peeling, foundation erosion, fissure gullies, and other damage due to the effects of time and space [3,4]. Affected by climate conditions and the customs of local residents, the preservation of earth sites such as the Xixia King’s mausoleum in Ningxia, the old city of Jiaohe in Xinjiang, and the Great Wall along the silk road has become a major challenge [5]. Plus, strong weathering and destruction resulting from concentrated heavy rainfall in recent years [6,7,8,9] have led earth sites in Hunan also to be at risk.
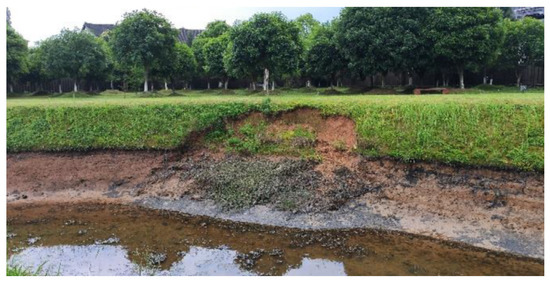
Figure 1.
Destruction of the earthen ruins of Liye.
The soil site of Liye, an ancient city in the Hunan Province of China, is one example. Although the shape and scale of the original moat can be studied, the soil site has shown large-scale deterioration due to long-term environmental effects. Zhao et al. [10] documented the historical changes and the functional evolution of the Nanjing Ming city wall. They also constructed a system to evaluate and quantify the cultural heritage of the ancient wall historical corridor and ensured the scientificity and accuracy of cultural heritage protection. Wu et al. [11] studied the deformation and failure modes of the wall by using the methods of classification and induction. By classifying the factors that have caused the deformation and failure of the ancient city wall, the authors put forward a set of corresponding protective measures and suggestions. Investigating four soil sites in the Qinghai Province, Wang et al. [12] found the sites have been poorly preserved, showing surface erosion, gullies, cracks, collapse, man-made damage, and other factors. The authors proposed strengthening the wall at the observation site to improve its seismic stability and to reduce the potential for interaction with the soil site. Hu et al. [13] showed that the moisture content/volume and the pore water pressure of the soil near the surface increased rapidly during rainfall and became saturated earlier than the lower levels of soil. Similarly, Zhou and Li [14] found that rainfall infiltration directly affected the stability of the Forbidden City wall, contributing to cracking, instability, and the collapse of the masonry outside the wall. Using the strength reduction method and ABAQUS software, this paper analyzed the mechanical properties and the stability of the Forbidden City wall to provide a basis for its safety evaluation, protection, and repair.
The related literature mainly analyzed the mechanical properties of the soil using macro tests or numerical simulations. As such, prior studies have not established a relationship between macro and micro scales. The structure of this paper is as follows: this paper analyzes, evaluates, and summarizes the factors that have contributed to the deterioration of the ancient moat site in Liye. Through field investigation, sampling, and testing, we have analyzed the chemical composition and microstructure of soil samples from the moat site using an X-ray diffractometer and a scanning electron microscope. Using the ABAQUS software, we have also constructed two-dimensional models of the seriously damaged portions of the site. Finally, we have compared and analyzed the stability performance of the trench under its natural state and after rainfall to evaluate the safety and stability of the most dangerous sections. The innovation of this paper is: due to the strong weathering and damage caused by heavy rainfall, the soil sites in Hunan are in danger. Considering that it is impossible to obtain a large number of samples required for repeated testing of existing soil sites, we conducted comprehensive analysis, evaluation and research on the structural composition and stability of soil sites through field investigation, sampling tests, microstructure analysis and numerical modeling. The research results provide a certain basis for the repair and protection of earthen sites. The results show that rain erosion, freeze–thaw cycles, and man-made damage are the primary factors contributing to the deterioration of the soil site. The safety factor of the trench was found to decrease with increases in water content; thus, water has an impact on the strength of the site wall. The wall soil has larger pores and more initial cracks than does the trench soil, which is easy to peel off. As a result, there is a high probability of a secondary deformation of the wall slope.
2. Overview of Soil Sites in the Ancient City of Liye
The Liye City is located on the West Bank of Youshui river in the southwest of Longshan County, which is situated within the Xiangxi Tujia and Miao Autonomous Prefecture in the Hunan Province. As an important part of the ancient city’s ruins, the moat of Liye is in the central area of the town. The moat, as shown in Figure 2, was built during the Warring States period. According to preliminary archaeological exploration, the existing site measures 210 m from north to south and about 105 m from east to west; thus, the total area is about 22,000 square meters.
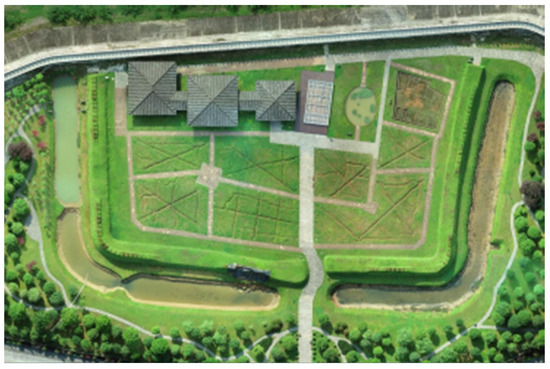
Figure 2.
Present situation of the ruins.
The remaining moat is divided into two areas. An “L-shaped” moat in the south retains its original shape, while damage from a collapse is found on the west side of the “L-shaped” moat in the north. The bottom anchor bolt heads that were buried in the early stages of construction to strengthen the slope are exposed, and a gravel slope that was also intended to provide protection is loose and partially collapsed. Additionally, the slope protection below the long-term storage surface in the west and the area east of the western and southern sections of the moat lacks aquatic plants, and the backfill is seriously damaged.
According to an inspection and evaluation, we concluded that the primary factors contributing to the deterioration of the moat in Liye included a perennial presence of water in the moat, the humid local environment, raw soil material defects, serious water erosion of the slope protection below the water level, and a large-scale collapse of the slope protection above the water level. At present, these factors have endangered the body of the inner moat, which urgently needs to be protected and reinforced. Specific results of our investigation into the current state of the moat include:
- (1)
- In the western section of the north city wall, a lack of aquatic vegetation coverage has resulted in decreased slope protection below the water surface of the trench. There is serious water erosion of the backfill. The water erosion depth is 120–300 mm and most of the anchor heads of the bottom anchor bolts are exposed. A combination of water and soil loss and the effect of rain erosion on the wall foundation have caused a collapse of the outer skin of the earth wall. This affects the rammed earth of the wall around the collapsed portion. Figure 3a shows peeling and shedding of the outer layer of a wall that has been damaged by rain and snow. Likewise, the top of the remaining wall has suffered rain erosion, thus decreasing the wall height. Many large vertical cracks and gullies are found in the internal corners, which reduce the constraints of the external wall. These areas threaten the stability of the trench.
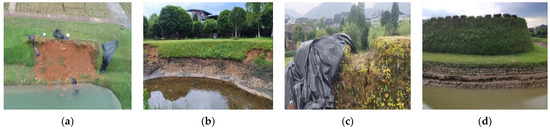 Figure 3. Damage status. (a) Wall surface stripping; (b) bottom erosion; (c) longitudinal cracking of wall; (d) complete part of trench.
 - (2)
- There is serious water erosion of the backfilled rammed earth platform under the gravel revetment in the western section of the south city wall. As shown in Figure 3b, the water erosion depth on the inner side of the platform is 120–180 mm and that on the outer side is 250–300 mm. The gravel masonry slope protection in the middle of the south slope is loose and locally collapsed. At the bottom of the trench lie collapsed stones, dead branches, rotten leaves, and sporadic sundries. Figure 3c shows that the wall is longitudinally cracked, the surface soil has completely lost the texture characteristics of the original compacted soil layer, and there is a wide range of flake crusts and powdery material being shed.
- (3)
- The remaining parts of the trench are well preserved, as shown in Figure 3d. Some areas of the outer layer remain intact, but there are many cracks in the wall. During the repair process, efforts should be made to distinguish between wall cracks and protective layer cracks.
3. Basic Properties of Earthen Soil
3.1. Basic Physical Indexes
Soil samples were collected from the moat site and then tested. Due to the special requirements of cultural relics protection, we adhered to the principle of minimizing the consumption of soil samples. According to the standard for geotechnical test methods (GB/T50123-2019), the natural moisture content, natural wet density, cohesion, and friction angle of the site soil were tested indoors. The basic physical properties of the soil samples are shown in Table 1.

Table 1.
Basic physical properties of the soil samples.
3.2. Direct Shear Test
Through field investigation in the ancient city of Liye, it was found that the water content is high due to the existence of long-term water storage ditches in the earthen site. In the direct shear test, considering the actual engineering problems to be solved, the soil sample was not completely saturated, but based on the water content of the trench soil sample and the water content continuing to increase after rain, so the water contents of 20%, 22%, 24% and 26% were taken for analysis, respectively. The test data can provide data support for the cracking of trench topsoil. To understand how the strength characteristics of the soil changed when underwater, we performed direct shear tests under different moisture content conditions that were based on the maximum dry density obtained from the test. The instruments used to test the samples were ZJ quadruple strain-controlled direct shear instruments. The obtained indexes are shown in Table 2.
Table 2.
Direct shear test results.
Based on the results in Table 2, we created a broken line diagram of the strength change of the site soil. This is shown in Figure 4. We observed a downward trend in the cohesion of the site soil that corresponded with increases in water content. When the water content is 20%, 22%, 24%, or 26%, the decreasing trend of the friction angle slows and remains stable while the cohesion continues to decrease with additional water content [15]. Because the soil particles are connected by a liquid bridge, when the water content is within a certain range, cohesion results from the surface tension that is generated by the liquid bridge and the van der Waals force between ions in the soil [16]. In this case, the phenomenon of basically stable cohesion and a decreasing friction angle can be explained.
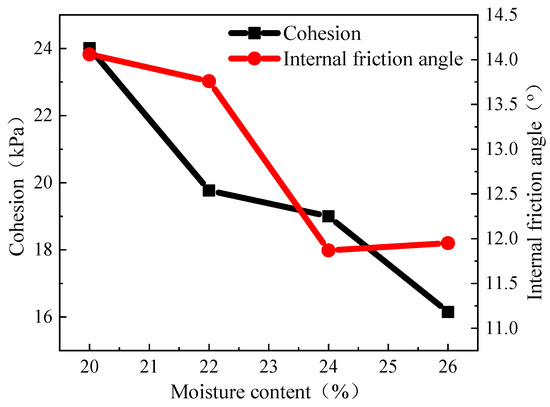
Figure 4.
Mechanical properties of the site soil.
3.3. XRF Test Results
The main components of the soil sample’s metal oxides are shown in Table 3. It can be seen that the metal oxide content of the wall soil samples and the trench soil samples are essentially the same, indicating that the mineral composition of the main body of the walls and the trenches at the Riya Old Town site is essentially unchanged. Table 4 shows the salt composition of soil samples. The results indicate that there are differences in the content of main salt ions in the wall soil samples and the trench soil samples. The salt ion content of trench soil samples is greater than that of the wall soil samples, indicating that the site soil has deteriorated under the influence of factors such as temperature, seepage, and capillarity [16]. In essence, salt migration occurs under the guidance of water salt coupling [17]. This provides the development conditions for subsequent basement erosion, sheet and block shedding, and collapse [18]. Therefore, temperature, moisture content, and salt migration are the root causes of site soil degradation [3].
Table 3.
Oxide composition of soil sample.
Table 4.
Salt composition of soil sample.
Analysis of the Liye soil site revealed a large day–night temperature difference, and decreases in the external temperature changes the temperature field inside the site soil. When the water content increases, the water accumulated on the wall surface penetrates the site soil, changes its seepage field, and the salt in the soil dissolves in the pore water. With an increase in temperature, along with the impact of water evaporation and capillarity, the internal water will carry salt to both the surface and the bottom of the city wall (i.e., a two-dimensional migration) [19,20], with the pores in the soil providing a channel for water and salt migration.
4. Microstructure Analysis
We further explored the structural damage at the soil site by scanning and analyzing soil samples from multiple locations. We observed the soil particle morphology and pore characteristics and further verified the deteriorating effects of natural factors by examining the micro characteristics of the soil site. Figure 5 presents the electron microscope images of wall soil samples and trench soil samples. The black areas in the images show the distribution of pores and cracks in the soil, while the light areas identify the skeleton distribution of soil particles. Comparing these images of the wall soil samples and trench soil samples, we see the macropores and cracks in the wall soil samples are distributed in response to the site soil outside the wall being directly exposed to the natural environment and having an obvious response to the deterioration of freeze–thaw cycle, dry–wet cycle, wind erosion, and rain erosion [21]. By comparison, the black areas of the trench soil sample images are small and the light color area has become brighter, and the chromaticity has decreased. This indicates that the macropores and cracks are shrinking or disappearing. Due to perennial water storage in the trench, smaller soil particles in the trench soil sample fill the macropores, which were gradually closed in the SEM diagram. This results in the obvious reduction of the distribution area of pores and fractures, with the distribution of soil particles in the soil skeleton and that of pores inside and between soil particles found to be relatively uniform. Since the wall soil samples are affected by the environment throughout the year, the surface soil sample skeleton is damaged and the macropores cannot be evenly filled by soil particles. The consequence is an obvious distribution of macropores and fractures in the SEM diagram.
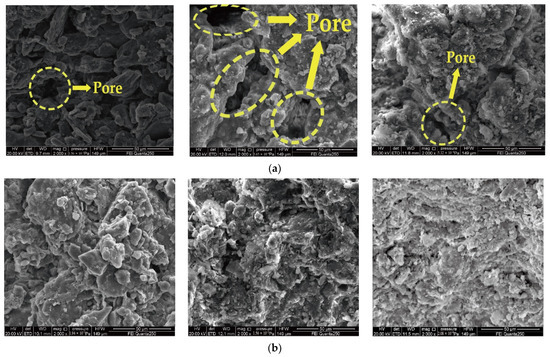
Figure 5.
Electron microscope images of wall soil samples and trench soil samples. (a) Wall soil samples; (b) trench soil samples.
From our analysis, we conclude that the mineral structure arrangement of the soil shows obvious directionality, and the soil sample gaps indicate that the samples from the city wall have large pores and the surface-to-surface and surface-to-edge contacts are relatively loose. The surface-to-surface and surface-to-edge contact gaps in the trench soil samples are smaller and the soil samples are denser. Therefore, we infer that the large gap between soil particles in the city wall has resulted from the continuous development of gaps between soil particles due to the loss of support (i.e., the connection mode of particle skeleton changes) and has resulted in fluffy soil. On the other hand, the micro cracks generated by expansion are continuously developing and connecting so that the bonding force between soil particles is reduced or even lost, which allows stripping to easily occur. The probability of secondary deformation of the slope surface at this location is large, with a landslide of considerable likelihood.
5. Stability Analysis
The moat in the site park is filled with water throughout the year. Due to the local humid environment, raw soil material defects, and other factors, the safety and stability of the moat are affected, and the mechanical properties of the moat slope protection are reduced [22]. There is serious water erosion of the slope protection below the water level of the trench and in many places above the water level. Some areas of erosion are quite large, and collapse has occurred. Therefore, based on the measured survey data of the site, we examined the areas with more dangerous profiles and used the ABAQUS software with the finite element model of the earth site to identify the four sections with serious damage to the trench. This facilitated simplification. Plus, in combination with the site’s stratigraphic structure and geomorphic characteristics and use of the strength reduction method, we built a numerical model to analyze the overall stability of the trench under different working conditions [23].
5.1. Model Establishment
Four dangerous sections (as identified in Figure 6) are selected for on-site investigation, namely, section B–B, section E–E, section H–H, and section J–J; and the section sizes are shown in Figure 7.
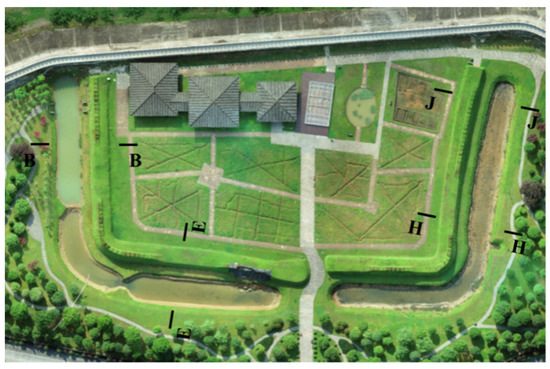
Figure 6.
Location of dangerous sections.
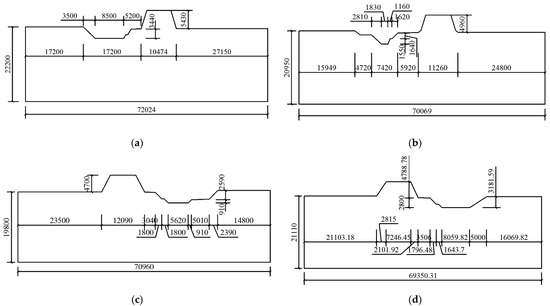
Figure 7.
Location of dangerous sections. (a) section B–B; (b) section E–E; (c) section H–H; (d) section J–J (distances are in mm).
To avoid errors in the determination of section sizes and angles that were probably caused by manual modeling, the design drawing of the section was completed using the AutoCAD software. A DXF file was created and imported into the ABAQUS software in the form of a sketch for modeling. The model material parameters were defined according to the results obtained from the laboratory test (Table 1 and Table 2). Among them, under condition 1, the initial cohesion and internal friction angle of soil were 24.01 kPa and 14.06°, respectively. Under condition 2, the initial cohesion and internal friction angle of soil were 16.15 kPa and 11.95°, respectively. The soil layer properties adopted the elastic–plastic constitutive model and the Mohr–Coulomb yield criterion. The number of field variables was set to 1, and then the cohesion and internal friction angle that varied with the field variables was set according to the strength reduction formula in the plastic part. The significance of the field variables lies in the strength reduction coefficient which serves to amplify strength. As it was convenient to search the limit failure state, and since the initial value of the strength reduction coefficient is generally less than 1, we set the initial value as 0.5 and allowed for a linear increase to produce a piecewise linear simulation, with increases equal to 0.25 and a final value of 1.5.
The research object of this paper is the earth ruins that have existed for hundreds of years, and the soil structure and geological conditions are basically stable. Secondly, when establishing the numerical model, the width and depth of the model have been set very large to avoid the size effect affecting the simulation results. Third, because the soil site only has surface soil sample spalling and no large-area collapse, the numerical model only focuses on the displacement of the existing soil site and the topsoil of the trench, and there is no movement of bedrock or outcrop. After the finite element model was established, the grid element type of the model adopted a four-node bilinear plane strain quadrilateral element (C3D8R), and the approximate global size of the grid was 1:1. Fixed constraints were used at the bottom of the model to limit its displacement and rotation in the transverse and longitudinal directions. Orientation constraints were set at both ends of the model to limit its displacement in the transverse direction. To prevent the given load step from being too large and resulting in iterative divergence and difficulty in achieving convergence, the initial value of the incremental step size was set to 0.001 and the minimum value was 1 × 10⁻²⁰. The final simulation models of four dangerous sections of the Liye trench are shown in Figure 8.
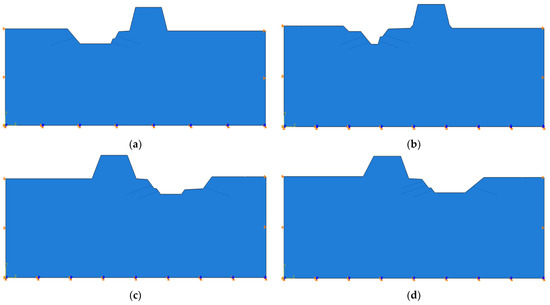
Figure 8.
Numerical models of dangerous sections. (a) section B–B; (b) section E–E; (c) section H–H; (d) section J–J.
The numerical simulation was divided into the following two working conditions. For condition 1, the soil moisture content was 20%, considering the self-weight of the soil (γ = 20 kN/m3), which is the current actual state of the trench. For condition 2, the moisture content of soil layer was 26% with the self-weight of the soil being considered (γ = 20 kN/m3). This simulated the state of the site in the event of abundant rain or excessive long-term water storage in the trench. Since the earthen site has existed for hundreds of years, the microstructure of the earthen site is very stable, and the unit weight of the earthen site can be assumed as a fixed value (γ = 20 kN/m3). Therefore, the self-weight load applied by the numerical model is γ = 20 kN/m3.
5.2. Stability Analysis
In the ABAQUS software, the X-axis is generally regarded as 1-axis, Y-axis as 2-axis and Z-axis as 3-axis. S22 then represents the stress in the Y-axis direction, the positive value is tensile stress and the negative value is compressive stress. Under different water content conditions, the soil sites mainly undergo downward deformation. Therefore, in this study, the stress changes in Y direction (longitudinal direction) are mainly analyzed. Figure 9 shows the diagram of the simulation results of displacement obtained from the numerical simulation of the four dangerous sections of the trench under condition 1. Figure 10 shows the diagram of the simulation results of longitudinal stress of the dangerous sections under condition 1. Given the assumption of condition 1, there is displacement at the top of the city wall and at the bottom of the trench, and the bank of the trench is large, with the earthen soil on the side facade tending to peel off. As a result, damage in the near future is not expected. However, when the external environment changes, the site soil will also deteriorate slowly, especially with the undercutting at the base being more serious and the displacement at the base generally being larger than that in the upper area. Figure 11 shows the diagram of the simulation results of displacement of the dangerous sections under condition 2. Figure 12 shows the diagram of the simulation results of longitudinal stress of the dangerous sections under condition 2. It can be seen from Figure 11 and Figure 12 that the maximum vertical stress on the soil is found at the bottom of the model, while the surface stress of the soil is small. This is in line with the actual situation. In the actual environment, rain, seepage, and other factors cause the most serious damage to the site soil base. Therefore, the site is prone to erosion damage as the pores in the soil expand, the skeleton collapses, and the connection between particles weakens.
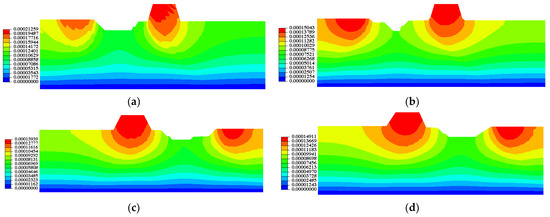
Figure 9.
Diagram of simulation results of displacement of dangerous sections under condition 1. (a) section B−B; (b) section E−E; (c) section H−H; (d) section J−J (the units in the legend are meters).
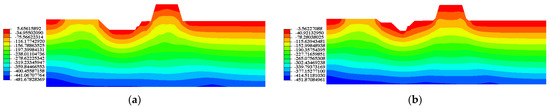

Figure 10.
Diagram of the simulation results of longitudinal stress of dangerous sections under condition 1. (a) section B−B; (b) section E−E; (c) section H−H; (d) section J−J. (The unit in the legend is N).
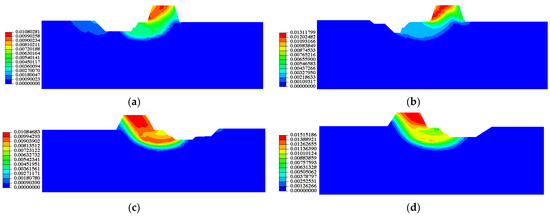
Figure 11.
Diagram of the simulation results of displacement of dangerous sections under condition 2. (a) section B−B; (b) section E−E; (c) section H−H; (d) section J−J (the units in the legend are meters).
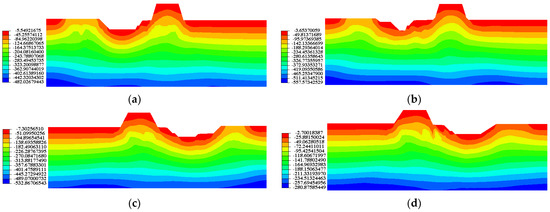
Figure 12.
Diagram of the simulation results of longitudinal stress of dangerous sections under condition 2. (a) section B−B; (b) section E−E; (c) section H−H; (d) section J−J (the unit in the legend is N).
Figure 13 shows the relationship between the displacement in the longitudinal direction and the safety factor of the wall slope top for each of the four dangerous sections. The reason why the ordinate in Figure 13 is negative is that the numerical model will produce longitudinal downward displacement under self-weight load. When the soil moisture content is 20%, the safety factor is 1.35. As the soil moisture content increases to 26%, the safety factor declines to 1.1. Under the action of load, the numerical model will produce small displacement, but when the displacement changes suddenly, it means that this time is the critical value for the destruction of earth sites, such as the position when the safety factor = 1.35 in Figure 13a and safety factor = 1.1 in Figure 13b. With the sudden change of displacement, the safety factor basically does not increase, which shows that the inflection point position (safety factor = 1.35 and safety factor = 1.1) is the failure limit condition of the soil sites. The results show that when the soil moisture content is low, the overall stability safety factor of each section is greater than 1, and the displacement magnitude is less than 1 mm. That is, the existing trench largely remains stable since the deterioration is not enough to pose a sudden threat to wall stability in the development period, and the surface cracks and gullies have little impact on the overall stability of the trench. When the moisture content of the soil is high, however, the safety factor of the trench decreases. This indicates that rainwater has a certain impact on the strength of the site wall. To prevent complex joint damage to the wall from rainwater and existing deterioration factors, we suggest that dewatering and drainage measures should be employed for the rammed earth at the top of the wall and the outside based on existing protective measures. At the water seepage point in the deterioration area, attention should be paid to the stability of the wall itself and the development of weak structural planes, and the moisture content should be controlled in an appropriate range as a whole.
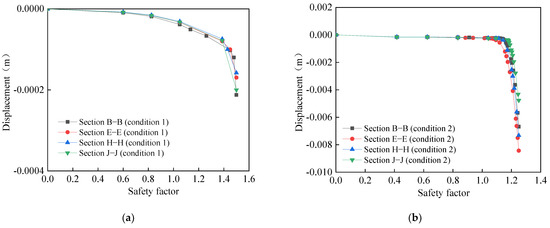
Figure 13.
Relationship between safety factor and displacement of dangerous sections under different conditions. (a) Condition 1; (b) condition 2.
6. Conclusions
This paper analyzes, evaluates and summarizes the factors leading to the degradation of the Liye ancient moat site. Through field investigation, sampling, testing and numerical simulation, the safety and stability of the most dangerous road sections were evaluated by using a combination of macro and micro analysis methods. Our main conclusions are as follows:
- (1)
- The main factors leading to soil degradation include rainfall erosion, freeze–thaw cycle, man-made destruction and salt migration. According to the field evaluation and test results, it was found that the change of water content in the earth site caused by rainfall is an important factor affecting the stability of the site. Under the influence of water migration in the soil, the internal and surface cracks of the site are serious.
- (2)
- The two-dimensional simulation analysis conducted using the ABAQUS software indicates a safety factor of 1.5 when the soil moisture content is 20%. When the moisture content rises to 26%, the wall is in a wet state and the safety factor declines to 1.25. This indicates that rainwater has an impact on the strength of the site wall. Compared with the displacement in condition 1, the overall trench produced a large amount of displacement under condition 2, with the maximum displacement being concentrated on the top of the city wall.
- (3)
- The chemical composition and microstructure of the trench soil samples were analyzed by an X-ray diffractometer and a scanning electron microscope. It was found that there is no difference in the mineral composition between wall soil samples and trench soil samples, but the content of salt and oxide is inconsistent, with the salt content of trench soil being higher than that of wall soil. Wall soil has larger pores and more initial cracks than trench soil, which means it is easy to peel off.
Author Contributions
Methodology, J.Y.; software, X.H.; formal analysis, X.H.; resources, J.Y., Z.W. and L.Z.; data curation, X.H.; writing—original draft preparation, J.Y. and X.H.; writing—review and editing, J.Y. and X.H. All authors have read and agreed to the published version of the manuscript.
Funding
This research was funded by the National Science Foundation of China (the funding number: 51978634) and the Henan Science and Technology research project (the funding number: 212102310287 and 212102310271).
Institutional Review Board Statement
Not applicable.
Informed Consent Statement
Not applicable.
Data Availability Statement
The data presented in this study are openly available within the document.
Conflicts of Interest
The authors declare no conflict of interest.
References
- Pei, Q.Q.; Guo, Q.L.; Wang, X.D.; Zhao, J.Z.; Zhao, G.J.; Luo, J. Evolution and characteristics of traditional building techniques for earthen architectural sites. Sci. Conserv. Archaeol. 2019, 31, 1–13. [Google Scholar] [CrossRef]
- Yue, J.W.; Huang, X.J.; Zhao, L.M.; Kong, Q.M.; Chen, Y.; Wang, Z.F. Finite element method study on stress-strain relationship of site soil. Mech. Eng. 2021, 43, 921–932. [Google Scholar] [CrossRef]
- Brini, I.; Alexakis, D.D.; Kalaitzidis, C. Linking Soil Erosion Modeling to Landscape Patterns and Geomorphometry: An Application in Crete, Greece. Appl. Sci. 2021, 11, 5684. [Google Scholar] [CrossRef]
- Ren, K.B.; Wang, B.; Li, X.M.; Yin, S. Strength properties and pore-size distribution of earthen archaeological site under dry-wet cycles of capillary water. Rock Soil Mech. 2019, 40, 962–970. [Google Scholar] [CrossRef]
- Zhang, H.Y.; Li, M.; Wang, X.D.; Guo, Q.L. Status and Countermeasures of Conservation of Earthen Monuments in Moist Circumstances. Dunhuang Res. 2011, 6, 70–75. [Google Scholar] [CrossRef]
- Tang, J.; Taro, U.; Huang, D.; Xie, J.R.; Tao, S.N. Physical Model Experiments on Water Infiltration and Failure Modes in Multi-Layered Slopes under Heavy Rainfall. Appl. Sci. 2020, 10, 3458. [Google Scholar] [CrossRef]
- Liu, Y.; Deng, Z.Y.; Wang, X.K. The Effects of Rainfall, Soil Type and Slope on the Processes and Mechanisms of Rainfall-Induced Shallow Landslides. Appl. Sci. 2021, 11, 11652. [Google Scholar] [CrossRef]
- Liu, T.; Zhao, X.W.; Liu, J.J.; Wang, K. Plant-induced diseases at an earthen site, using the Epang Palace Site as an example. Sci. Conserv. Archaeol. 2019, 31, 107–112. [Google Scholar] [CrossRef]
- Yang, Q.Y.; Li, C.W. Research on the Impact of Drying and Wetting Cycle of Capillary Water on Weathering of Soil Sites. Chin. J. Undergr. Space Eng. 2012, 8, 517–525. [Google Scholar] [CrossRef]
- Zhao, C.Y.; Li, Z.A.; Wang, Y.Y. Study on the evaluation and protection of the cultural heritage of the historical corridor of Nanjing Ming City Wall. China Anc. City 2019, 07, 59–64. [Google Scholar] [CrossRef]
- Wu, C.Y.; Li, L.; Wang, Z.R.; Liu, W.H.; Chen, G.Q. Classification and Identification of Failure Modes of Ancient City Walls. J. Eng. Geol. 2017, 25, 1132–1140. [Google Scholar] [CrossRef]
- Wang, C.Y.; Shi, Y.C.; Liu, K.; Li, T.L.; Xian, Z.Y. Disease characteristics and the analysis of microseism observation of typical earthen ruins in Qinghai. World Earthq. Eng. 2021, 37, 232–240. [Google Scholar] [CrossRef]
- Hu, Q.G.; Yuan, N.; Liu, D.S.; He, Z.M. Analysis of Rainfall Infiltration Process and Stability of Soil Slope with Multilayer Structure. China J. Highw. Transp. 2018, 31, 67–74. [Google Scholar] [CrossRef]
- Zhou, C.D.; Li, Y.M. Influence of rainfall infiltration on stability of Forbidden City wall. J. Build. Struct. 2020, 41, 286–296. [Google Scholar] [CrossRef]
- Qiu, S.G. Influence of Rainfall Infiltration to the Stability of Unsaturated Soil Slope and Its Countermeasures. Met. Mine 2019, 11, 62–67. [Google Scholar] [CrossRef]
- Zhang, Z.; Liu, F.Y.; Li, R.J.; Chai, J.R.; Zhang, C.S. Evolution of capillary force of liquid bridge between clay particles in process from its formation to rupture. Rock Soil Mech. 2016, 37, 2845–2850. [Google Scholar] [CrossRef]
- Zhang, P.R.; Huang, X.F.; Yang, X.H.; Liu, Z.L.; Zhu, Z.H. Experiment on coupling effect of water and thermal field and salt-expansion deformation of salty soil. Rock Soil Mech. 2018, 39, 1619–1624. [Google Scholar] [CrossRef]
- Zhang, B.; Chen, W.W.; Pei, Q.Q.; Zhao, J.Z.; Shi, Y.C.; Wang, X.D.; Guo, Q.L. Experimental Study on Instability Mechanism of Rammed Earthen Ruins Caused by Basal Sapping under Static Action. China Earthq. Eng. J. 2021, 43, 430–437. [Google Scholar] [CrossRef]
- Zhang, D.F.; Zheng, Q.H.; Dong, Z.Y. Mechanism of Soil Salt-moisture Transfer Under Freeze-thawing Condition. China Bull. Soil Water Conserv. 2005, 6, 14–18. [Google Scholar] [CrossRef]
- Pu, T.B.; Chen, W.W.; Lv, H.M.; Du, L.M. Analysis on function of deterioration of typical earthen ruins under the coupling of salinized and freezing and thawing in Qinghai-Tibet Plateau. J. Cent. South Univ. Sci. Technol. 2016, 47, 1420–1426. [Google Scholar] [CrossRef]
- Zhao, G.T.; Han, Z.; Zou, W.L.; Wang, X.Q. Influences of drying-wetting-freeze-thaw cycles on soil-water and shrinkage characteristics of expansive soil. Chin. J. Geotech. Eng. 2021, 43, 1139–1146. [Google Scholar] [CrossRef]
- Xiao, Y.; Deng, H.F.; Li, J.L.; Zhang, Y.C.; Wang, W.; Fang, J.C. Research on strength reduction method based on double strength reduction factors and considering natural degradation rule of soil mechanics properties. Chin. J. Geotech. Eng. 2017, 47, 127–132. [Google Scholar] [CrossRef]
- Ma, P.F.; Xia, D.; Xu, W.N.; Ding, Y.; Cheng, H.; Deng, Y.S. Analysis on influence of water content and slope gradient on gravitational erosion of collapsing gully wall in red soil hilly region with finite element method (FEM). Water Resour. Hydropower Eng. 2019, 50, 214–227. [Google Scholar] [CrossRef]
Publisher’s Note: MDPI stays neutral with regard to jurisdictional claims in published maps and institutional affiliations. |
© 2022 by the authors. Licensee MDPI, Basel, Switzerland. This article is an open access article distributed under the terms and conditions of the Creative Commons Attribution (CC BY) license (https://creativecommons.org/licenses/by/4.0/).