Article

Investigation of Breakaway Time Delay Phenomenon in Isothermal Test with Zircaloy-4 under Oxygen Atmosphere at 1000 °C

Department of Mechanical and Control Engineering, Handong Global University, 558 Handong-ro, Buk-gu, Pohang 37554, Korea
*
Author to whom correspondence should be addressed.
Appl. Sci. 2022, 12(6), 2871; https://doi.org/10.3390/app12062871
Submission received: 11 November 2021 / Revised: 18 February 2022 / Accepted: 5 March 2022 / Published: 10 March 2022
(This article belongs to the Topic Metallurgical and Materials Engineering)

Abstract

:
Zircaloy-4 isothermal oxidation tests were conducted at 1000 °C under an oxygen atmosphere with flow rates varying from 20 to 200 mL/min. In this research, a breakaway time delay phenomenon was discovered. The temperature of the atmosphere near the cladding was measured in order to estimate the oxidation rate and identify the condition of the phenomenon. A sharp escalation in the cladding temperature was observed in the early stage of oxidation as the flow rate increased. In addition, macroscopic and microscopic observations were performed to identify the effects of initial temperature escalation. The results showed that the thickness of the dense columnar oxide increased in the oxide scale when the initial peak temperature exceeded 1050 °C. Based on these observations, it can be assumed that temperature escalation in the early stage can influence the thickness of dense oxides, and this in turn affects the oxidation behaviors, especially the breakaway time.

1. Introduction

Nuclear power plants (NPPs) prevent the release of radioactive materials to the public through the concept of physical defense in depth. Since the cladding oxidation phenomenon that occurs in severe accidents threatens the integrity of the cladding, the second barrier of physical defense in depth, many studies have been conducted to date. For the safety of NPPs and accident management, it is very important to determine the timing of cladding failure in severe accidents, and the oxidation model established through the TGA (Thermogravimetric Analysis) experiment is used in safety codes, such as the MELCOR. However, these models are a function of time and temperature, and do not reflect the effect of the flow rate of the oxidant, such as steam, air, and oxygen. The oxidant flow rate can have a significant influence on the oxidation behavior, because the flow rate affects the oxidation heat and the initial temperature rise in the cladding. Although researchers have already shown that the reaction heat affects oxidation behaviors [1,2,3], most studies have not investigated this in detail. The relationship between the oxidant flow rate and peak temperature induced by reaction heat was identified from data trends by Duriez et al. [1]. From the results, the peak temperature increased with increasing the air flow rate and oxidation temperature, accompanied by an abrupt increased oxidation rate. Coindreau et al. [2] reported on the effect by comparing IRSN [1] and FZK [4] data and the results of the theoretical models. The predictions of time to breakaway by models were in good agreement with relatively low air flow experiments at 1000 °C; however, the time and reaction kinetics were underestimated. It was assumed that the differences between experimental and theoretical results are caused by sharp increases in temperature generated by the reaction heat and quick growth in the oxide. Recently, Grosse et al. [5] intensively studied the effect of the flow rate on the reaction of zirconium under specific atmosphere conditions, i.e., vapor, vapor–air mixture, etc., at 850 °C and 1100 °C. At 850 °C, the time to the breakaway is shorter with the decreased gas flow in both air and a steam–nitrogen mixture, and the reaction rate also decreases with the increased gas flow rate. These trends differed completely at 1100 °C. This previous research mainly focused on the effect on oxidation behaviors in terms of global and/or local oxygen starvation, which can strongly affect the activity of nitrogen in reactions and their diffusivity; however, the effects of reaction heat on oxidation behaviors have not yet been studied deeply. If the reaction heat can have an impact on the breakaway time, this phenomenon should be considered an important parameter for estimating NPPs’ safety. Therefore, in this study, the effect of reaction heat on the oxidation kinetics and breakaway time was observed by conducting oxidation experiments at 1000 °C, where the breakaway behaviors change dramatically. Additionally, the reason for the change in the breakaway behavior around this temperature was explained in terms of reaction heat and oxidation kinetics.

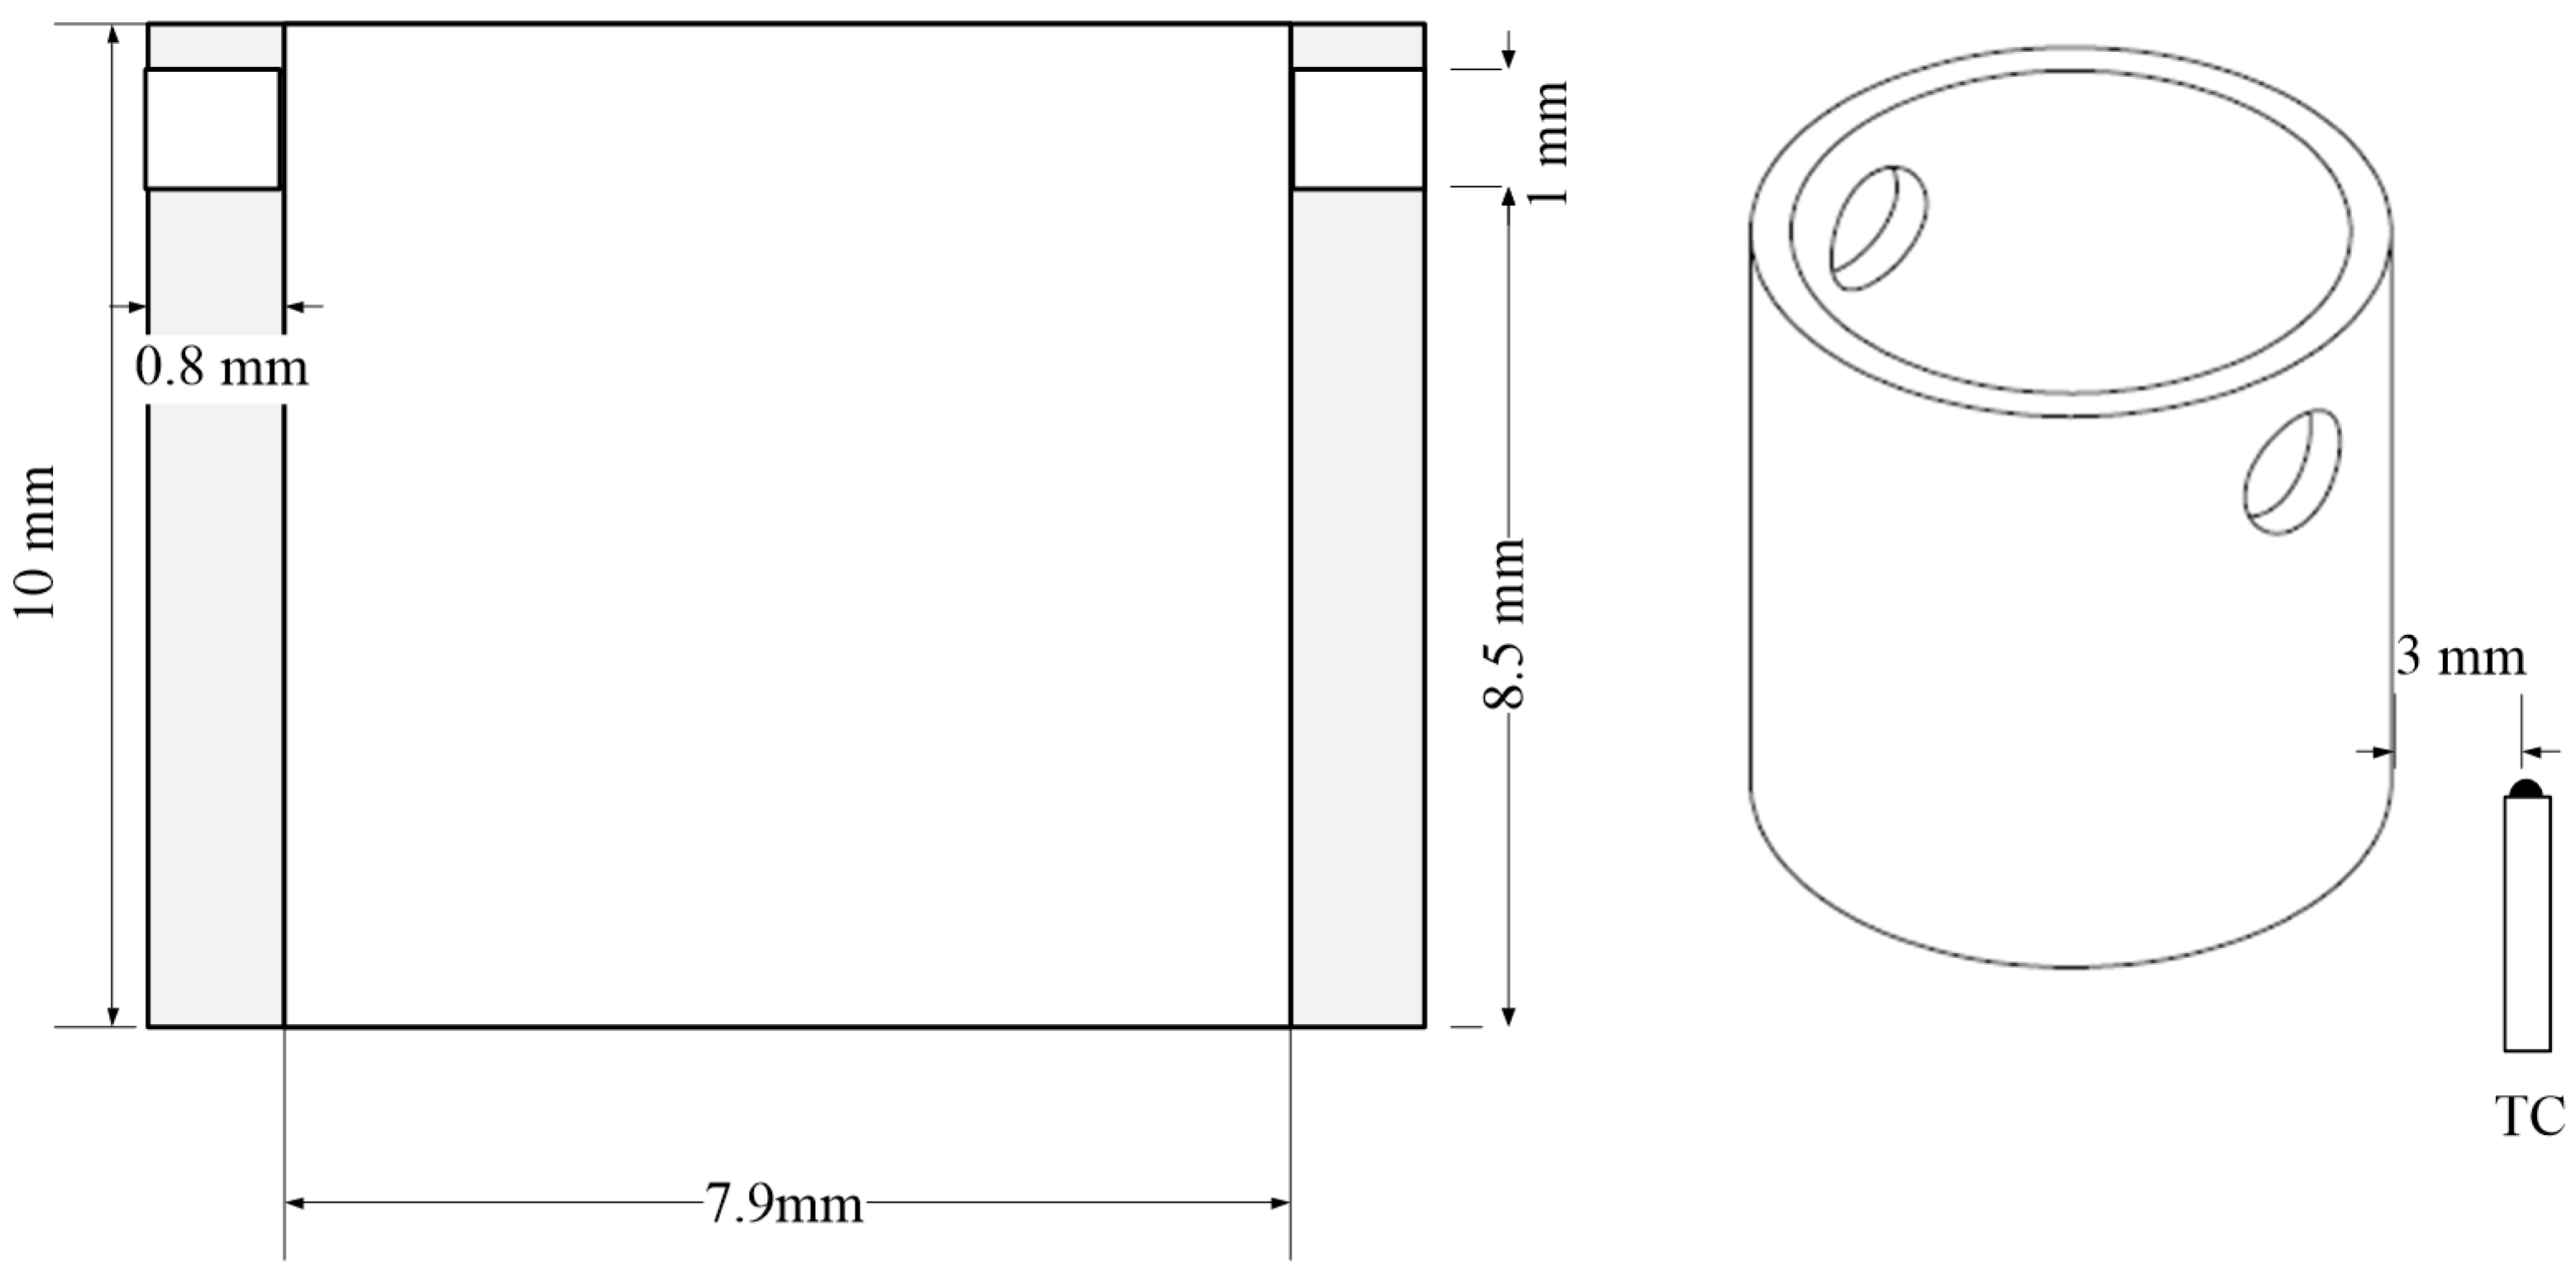
2. Experimental Setup

Isothermal tests at 1000 °C with varying oxygen flow rates from 20 to 200 mL/min were performed with Zircaloy-4 tube segments using a commercial thermogravimetric analysis (TGA). Abrupt temperature escalation, which leads to abrupt increasing mass gain in the beginning of the oxidation reaction, was expected, due to an intense exothermic reaction between oxygen and Zr metal. Mass gain and mass-gain-rate data obtained from TGA were used to describe the oxidation behaviors. In addition, an investigation of macro- and micro-graphs supporting TG analyses was performed. The preparation of samples and experimental procedures was as follows: The test samples were prepared by dissecting a long original Zircaloy-4 tube, and two holes with 1 mm outer diameters were drilled into the upper part of the tube, from which thermobalance was suspended. The dimension of the segment was 10 mm long, with a 9.5 mm outer diameter and a 7.9 mm inner diameter. The fabricated test specimen is represented in Figure 1.
After the samples were prepared, the surfaces of the samples were polished and cleaned in an ultrasonicator using acetone. The commercial SETARAM TGA was used as a thermobalance for the oxidation tests. The inside of the test section temperature of the TGA was controlled by an s-type thermocouple, which was placed close to the bottom of the sample (3 mm distance).
The tube was hung in a TGA using a series of platinum (Pt) wires. All the tests were started after the mass-gain data were stabilized. Argon was injected to remove impurities inside the TGA for 90 min while room temperature was maintained, and the temperature was raised to 1000 °C under an argon atmosphere. After the desired temperature was obtained, the temperature was stabilized for 10 min. Then, oxygen was injected as an oxidant and varied from 20 to 200 mL/min, according to the planned tests. The argon flow rate was adjusted to the corresponding oxygen flow rate to maintain an oxygen-to-argon ratio of 2:1 to protect the TGA. The most frequent oxidation time was 2 h, and several cases were conducted for an additional 4 h. The direction of gas flow was top to bottom, based on the samples (gravity direction). After oxidation, the supply of oxygen was stopped, and the temperature was lowered as far as possible under an argon atmosphere. The post-test samples were photographed and embedded in a mixture of resin and hardener. In addition, the samples were ground and polished for metallography. Macro- and micrographs were taken of samples after 2 and 4 h of oxidation. Some of the micrographs were made by overlapping a series of photos to avoid unclear parts in each picture.
Moreover, a dummy test was performed with an alumina tube, which was manufactured with the same geometry according to a Zircaloy-4 specimen, to distinguish between mass gain from the reaction between oxygen and metal and other effects. Figure 2 shows the results of mass gain from the dummy test. It was observed that there was a small mass gain during the oxygen inflow period. If we assumed that there was no reaction between oxygen and the alumina tube, the mass gain could be considered to only be due to other effects. One of the possible effects which could lead to a low initial mass gain at the initial stage could be from the momentum force induced by the gas flow direction being from top to bottom. After the initial mass gain, a steady state was achieved and d(∆m)/dt converged to zero. The final mass gain was 0.08% after 2 h of oxidation time. This mass-gain value is negligible compared to the average mass gain of Zircaloy-4 oxidation tests (18.98%), so it can be assumed that the other effects on mass gain can be ignored. Consequently, the mass-gain data from Zircaloy-4 tests do not consider the results of the dummy test.

3. Results and Discussions

In this section, the results of isothermal oxidation experiments at 1000 °C are presented. A breakaway time delay phenomenon was discovered in the high-flow-rate region of this test. These results were interpreted from the point of view of reaction heat.

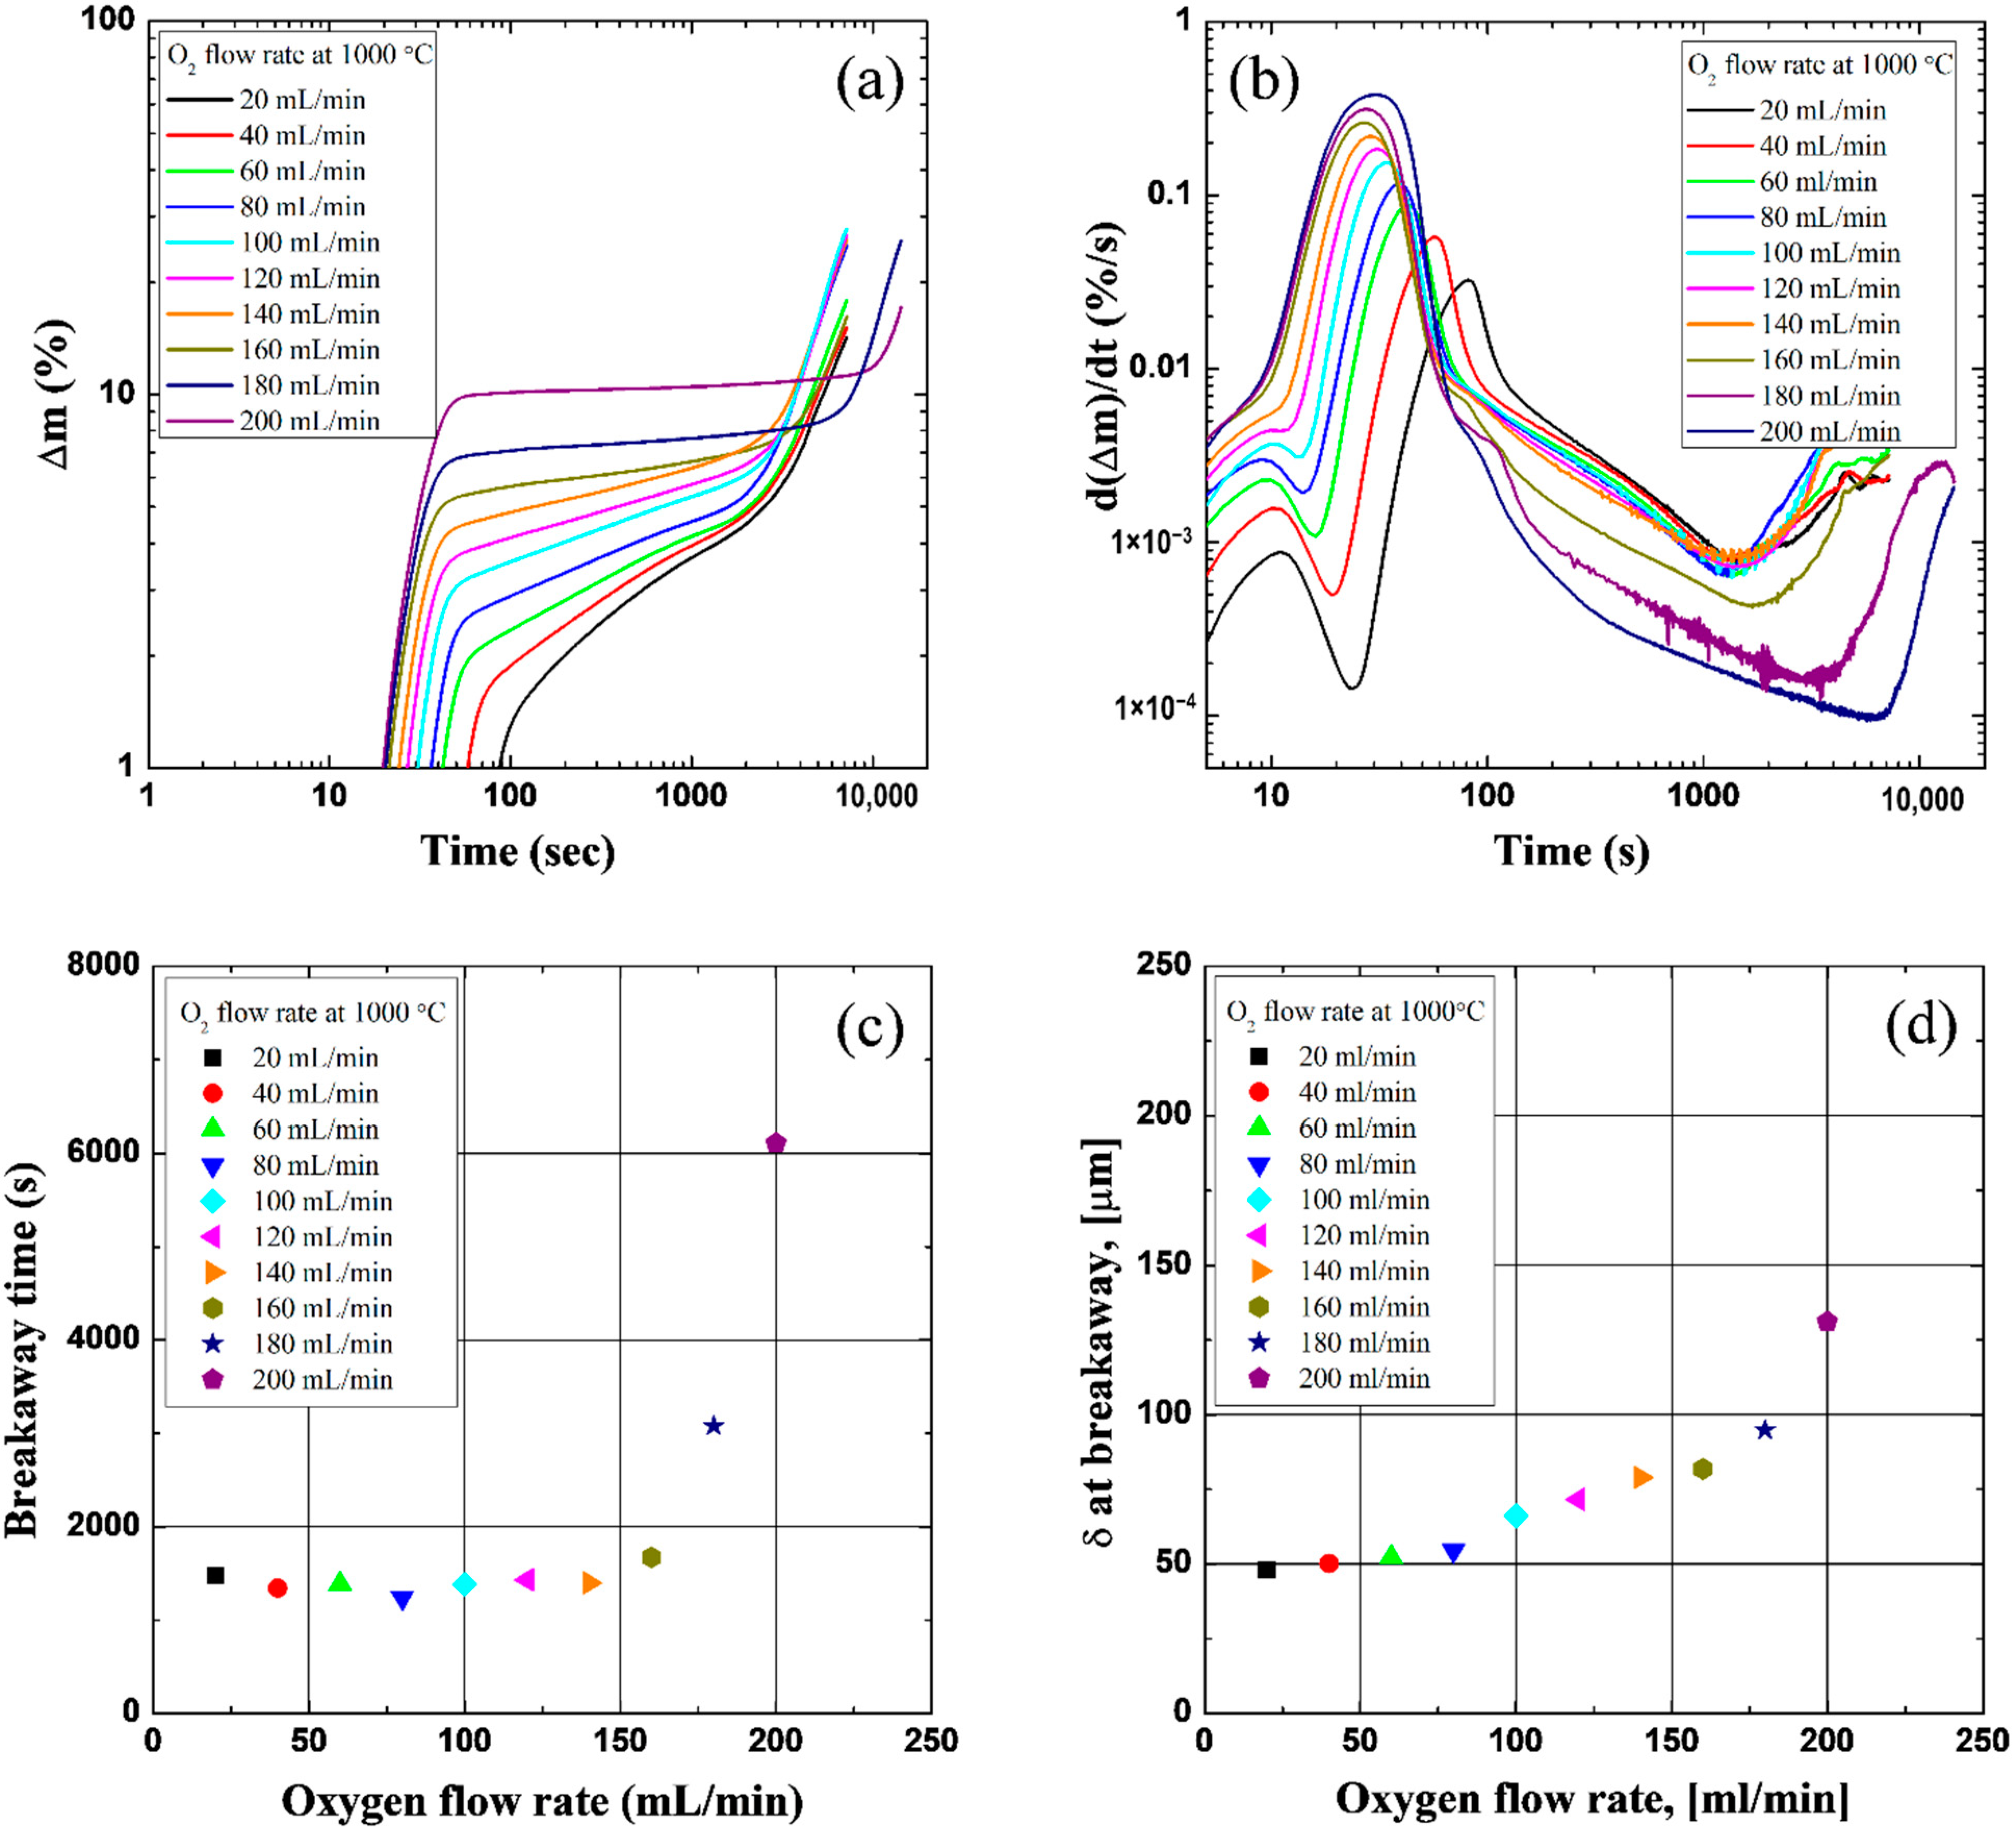
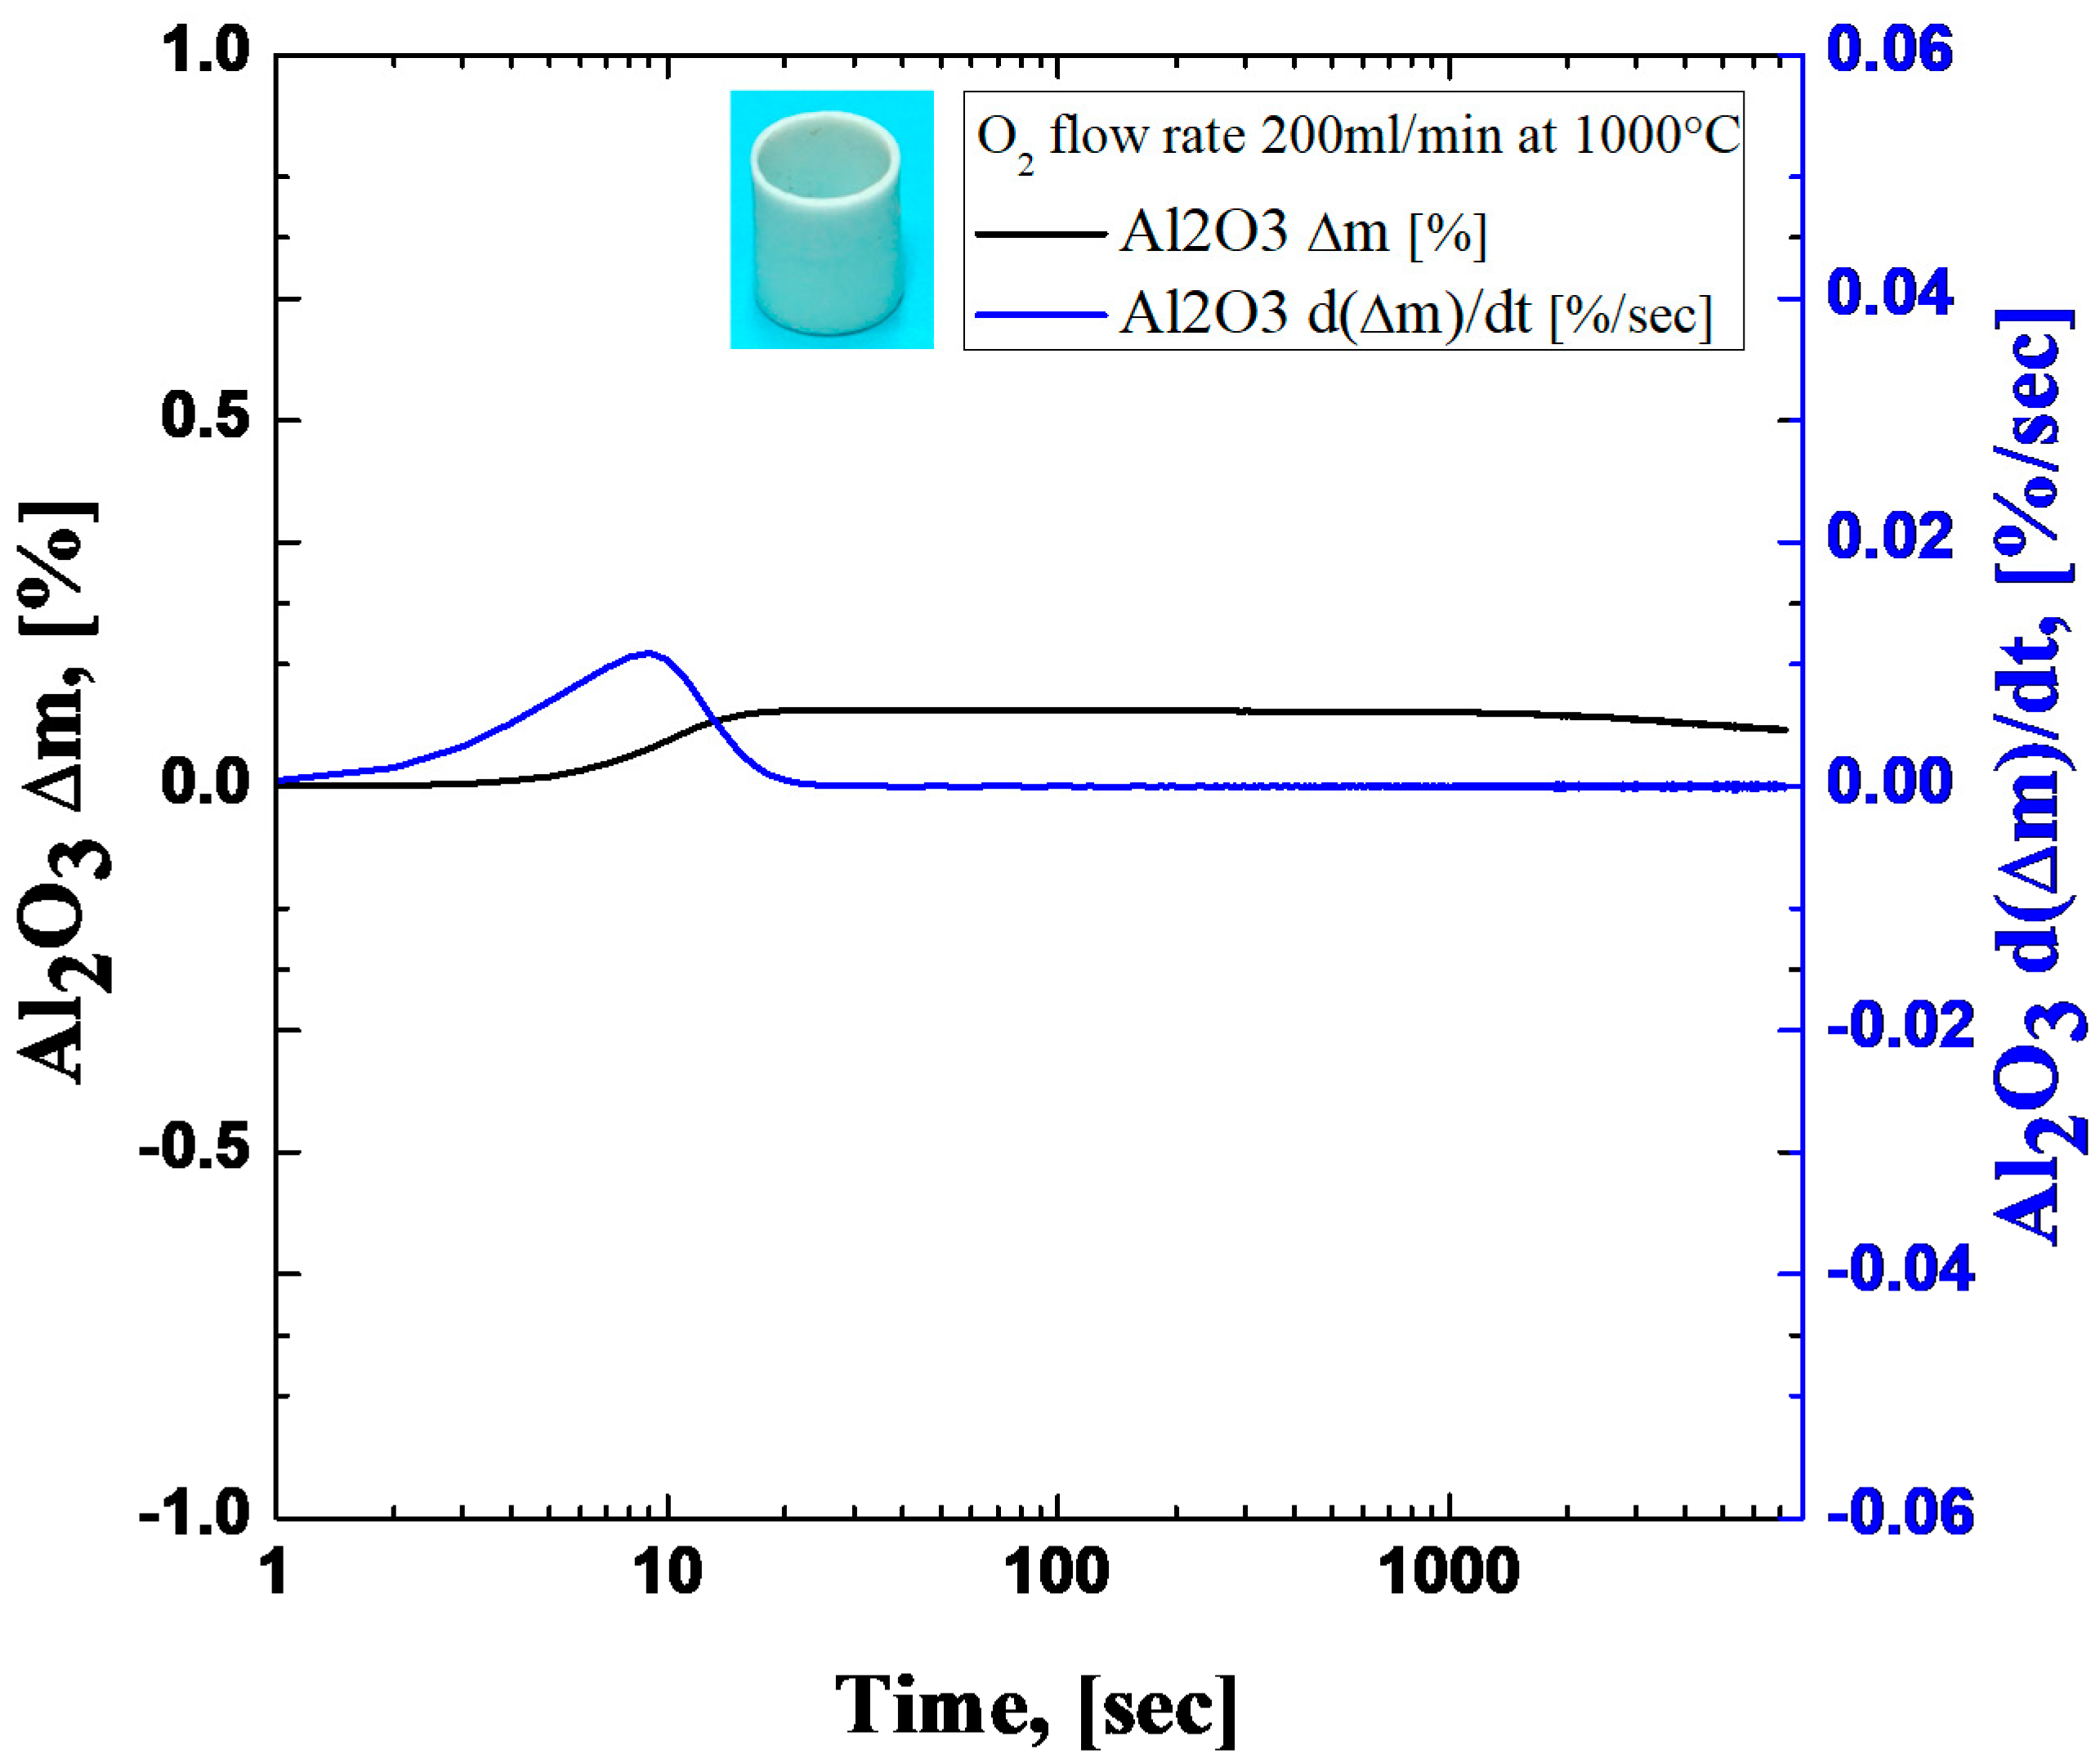
3.1. Results of Isothermal Oxidation Experiments

To investigate the oxidation kinetics, TG mass gain and gain-rate data were employed. Figure 3a,b shows the results of mass gain and the mass-gain rate in terms of oxygen flow rate. It can be identified from Figure 3a that the overall mass-gain trend seemed to follow general oxidation kinetics. The sharp mass gain was measured by the oxygen inflow because oxygen was reacted with pure Zr metal. As an oxide layer grew, the mass gain became slower and followed almost (sub-)parabolic and/or cubic reaction laws. After reaching critical oxide thickness, the reaction rate accelerated and became linear or higher; a phenomenon termed breakaway or reaction transition. However, there are differences between both the extent of the reaction rate at each regime and the breakaway time, as identified in Figure 3b. The reaction rate in the early stages was raised slightly, and then the first minimum point was reached. This might be caused by the early oxygen starvation and this moment. Furthermore, the minimum value was progressively reduced, and this trend almost disappeared at the highest flow rates. The reaction rate increased sharply at the oxygen inflow period, and its degree of escalations became higher as the oxygen flow rate increased. This trend might be influenced by both higher peak temperature [1,4,6] and enhancement of diffusivity [5]. After this abrupt increase in reaction rate, the trend changed adversely, and it decreased. The extent of this decrease increased as the flow rate increased. This might be caused by the formation of a thicker oxide layer, which acted as a diffusion barrier at the early stages. On the other hand, the breakaway is determined by the minimum point after the maximum value in Figure 3b, which was delayed from the 160 mL/min flow rate. The results are presented in Figure 3c, and the actual times are also arranged in Table 1. The average transition time was approximately 1379 s to reach 140 mL/min (Table 1), while the breakaway time was retarded in the higher flow rate region as, shown in Figure 3c. The oxide thickness at the breakaway was calculated from the TG mass-gain data, considering it was dense zirconia, and ignoring the mass gain of the oxygen dissolved in the Zr metal [1]. The thickness increased as the flow rate increased, but it showed an abrupt increase in the 160 to 200 mL/min region (Figure 3d).

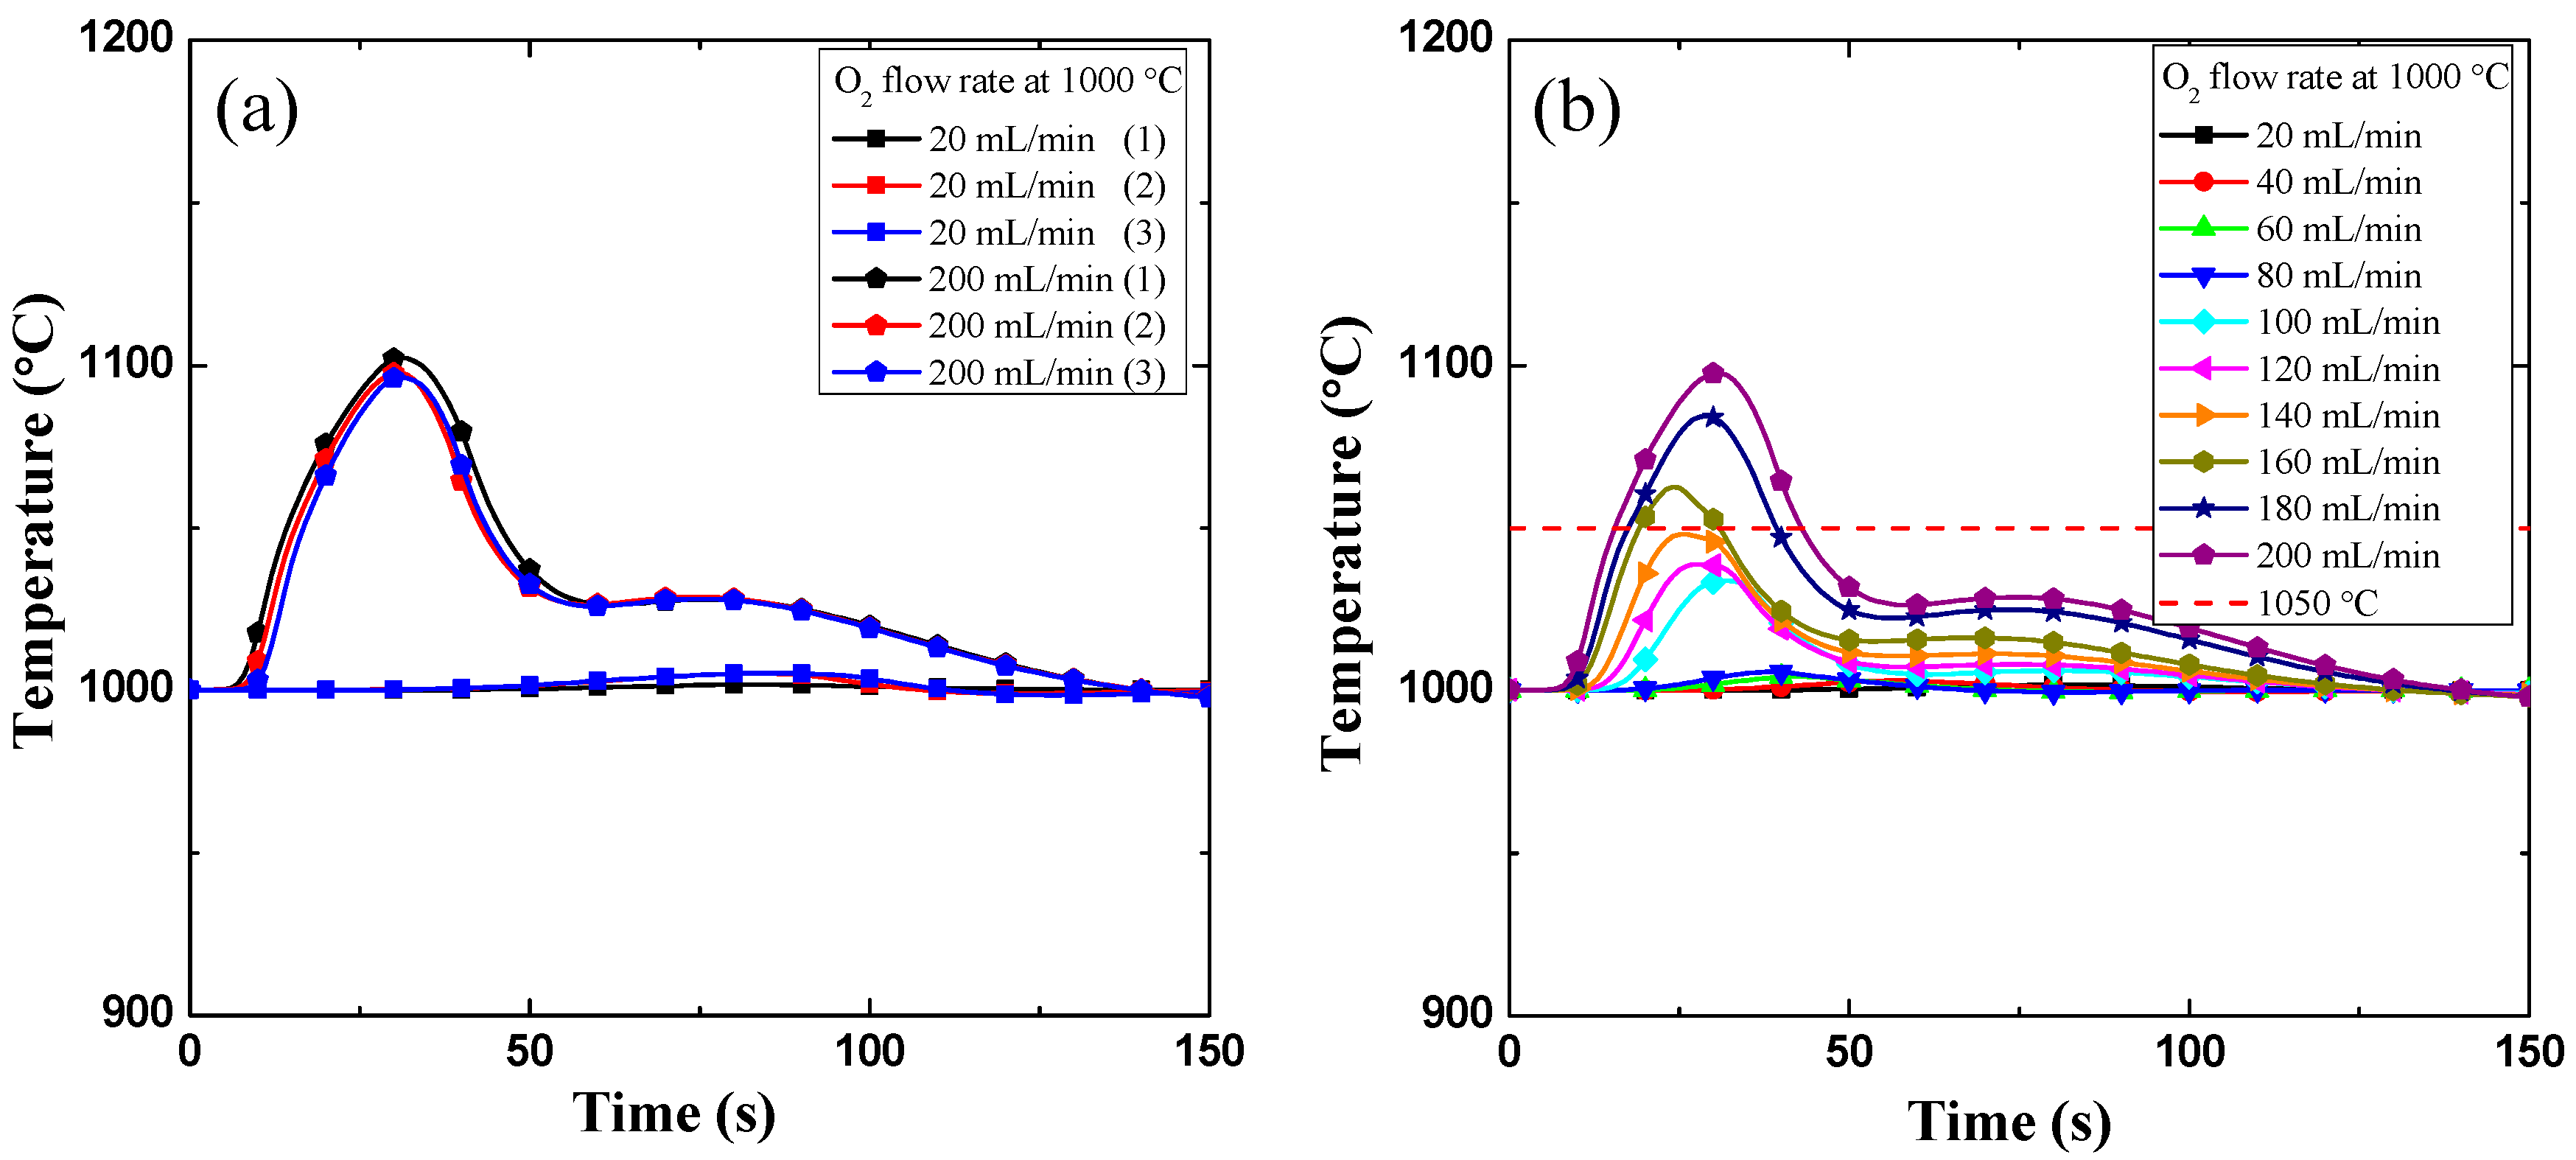
3.2. Reaction Heat Measurement

Measurement of the reaction heat was performed by measuring the temperature around the cladding specimen in order to identify the reason for the breakaway time delay. In Figure 4a,b, the history of the temperature escalations during the early stage of the reaction between oxygen and fresh metal in terms of the increasing flow rate are shown. The reproducibility of temperature measurements is very satisfactory when both the lowest and the highest flow rate cases are considered (Figure 4a). Moreover, the peak temperature increases with the increase in the oxygen flow rate due to rise in the oxygen flow rate per the outer surface of the metal [1], as shown in Figure 4b.
The interesting point is the delay point corresponding to the peak temperature that exceeds 1050 °C. As reported earlier in [1,4,7], at temperatures above 1050 °C, dense columnar oxides are favorably formed. This observation is used as a standard to distinguish the breakaway time delay.

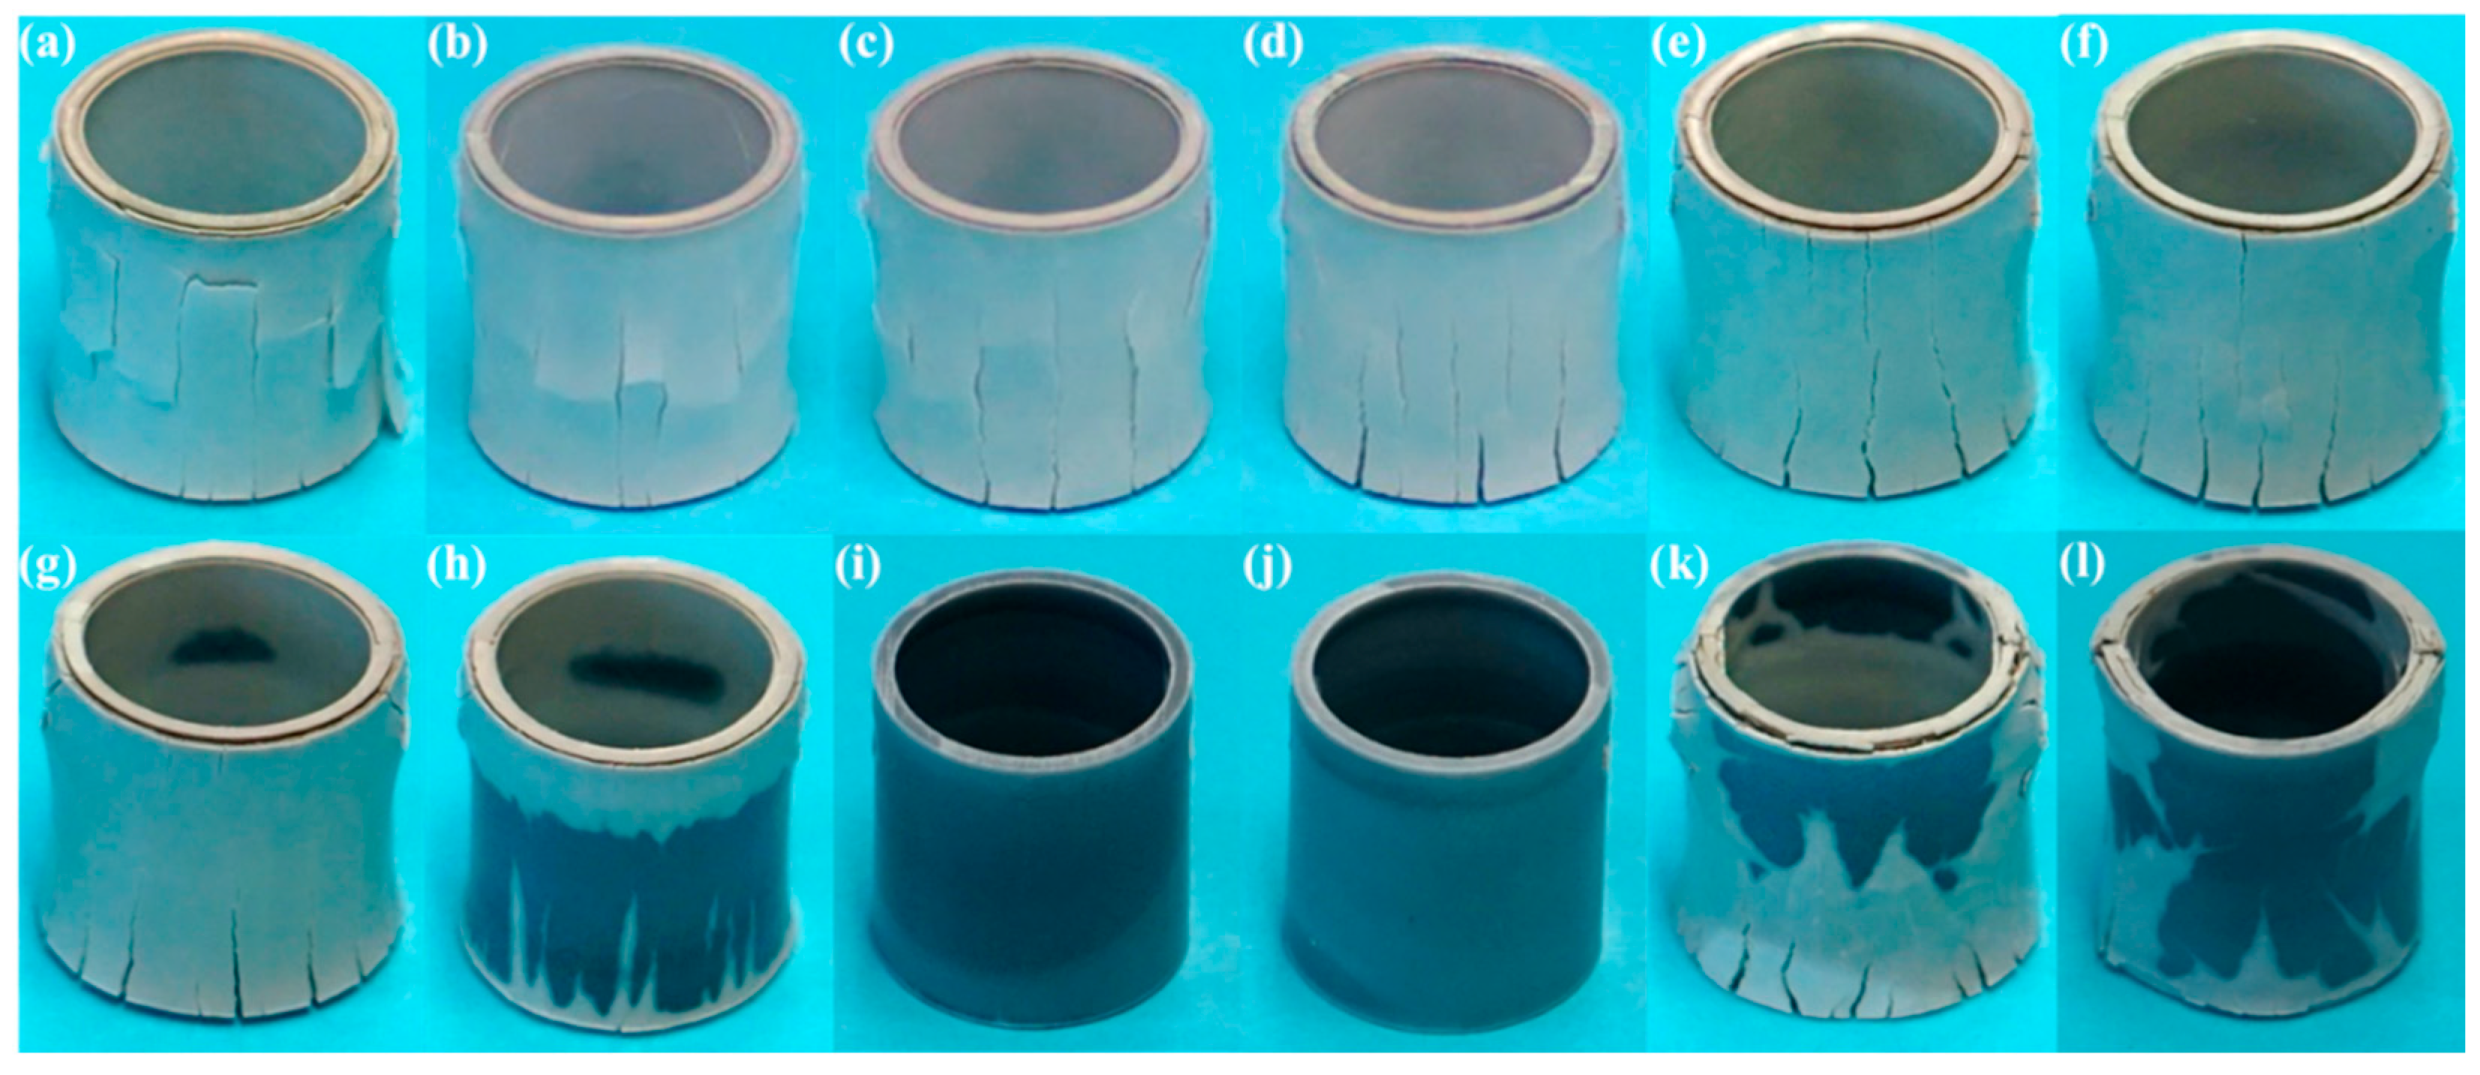
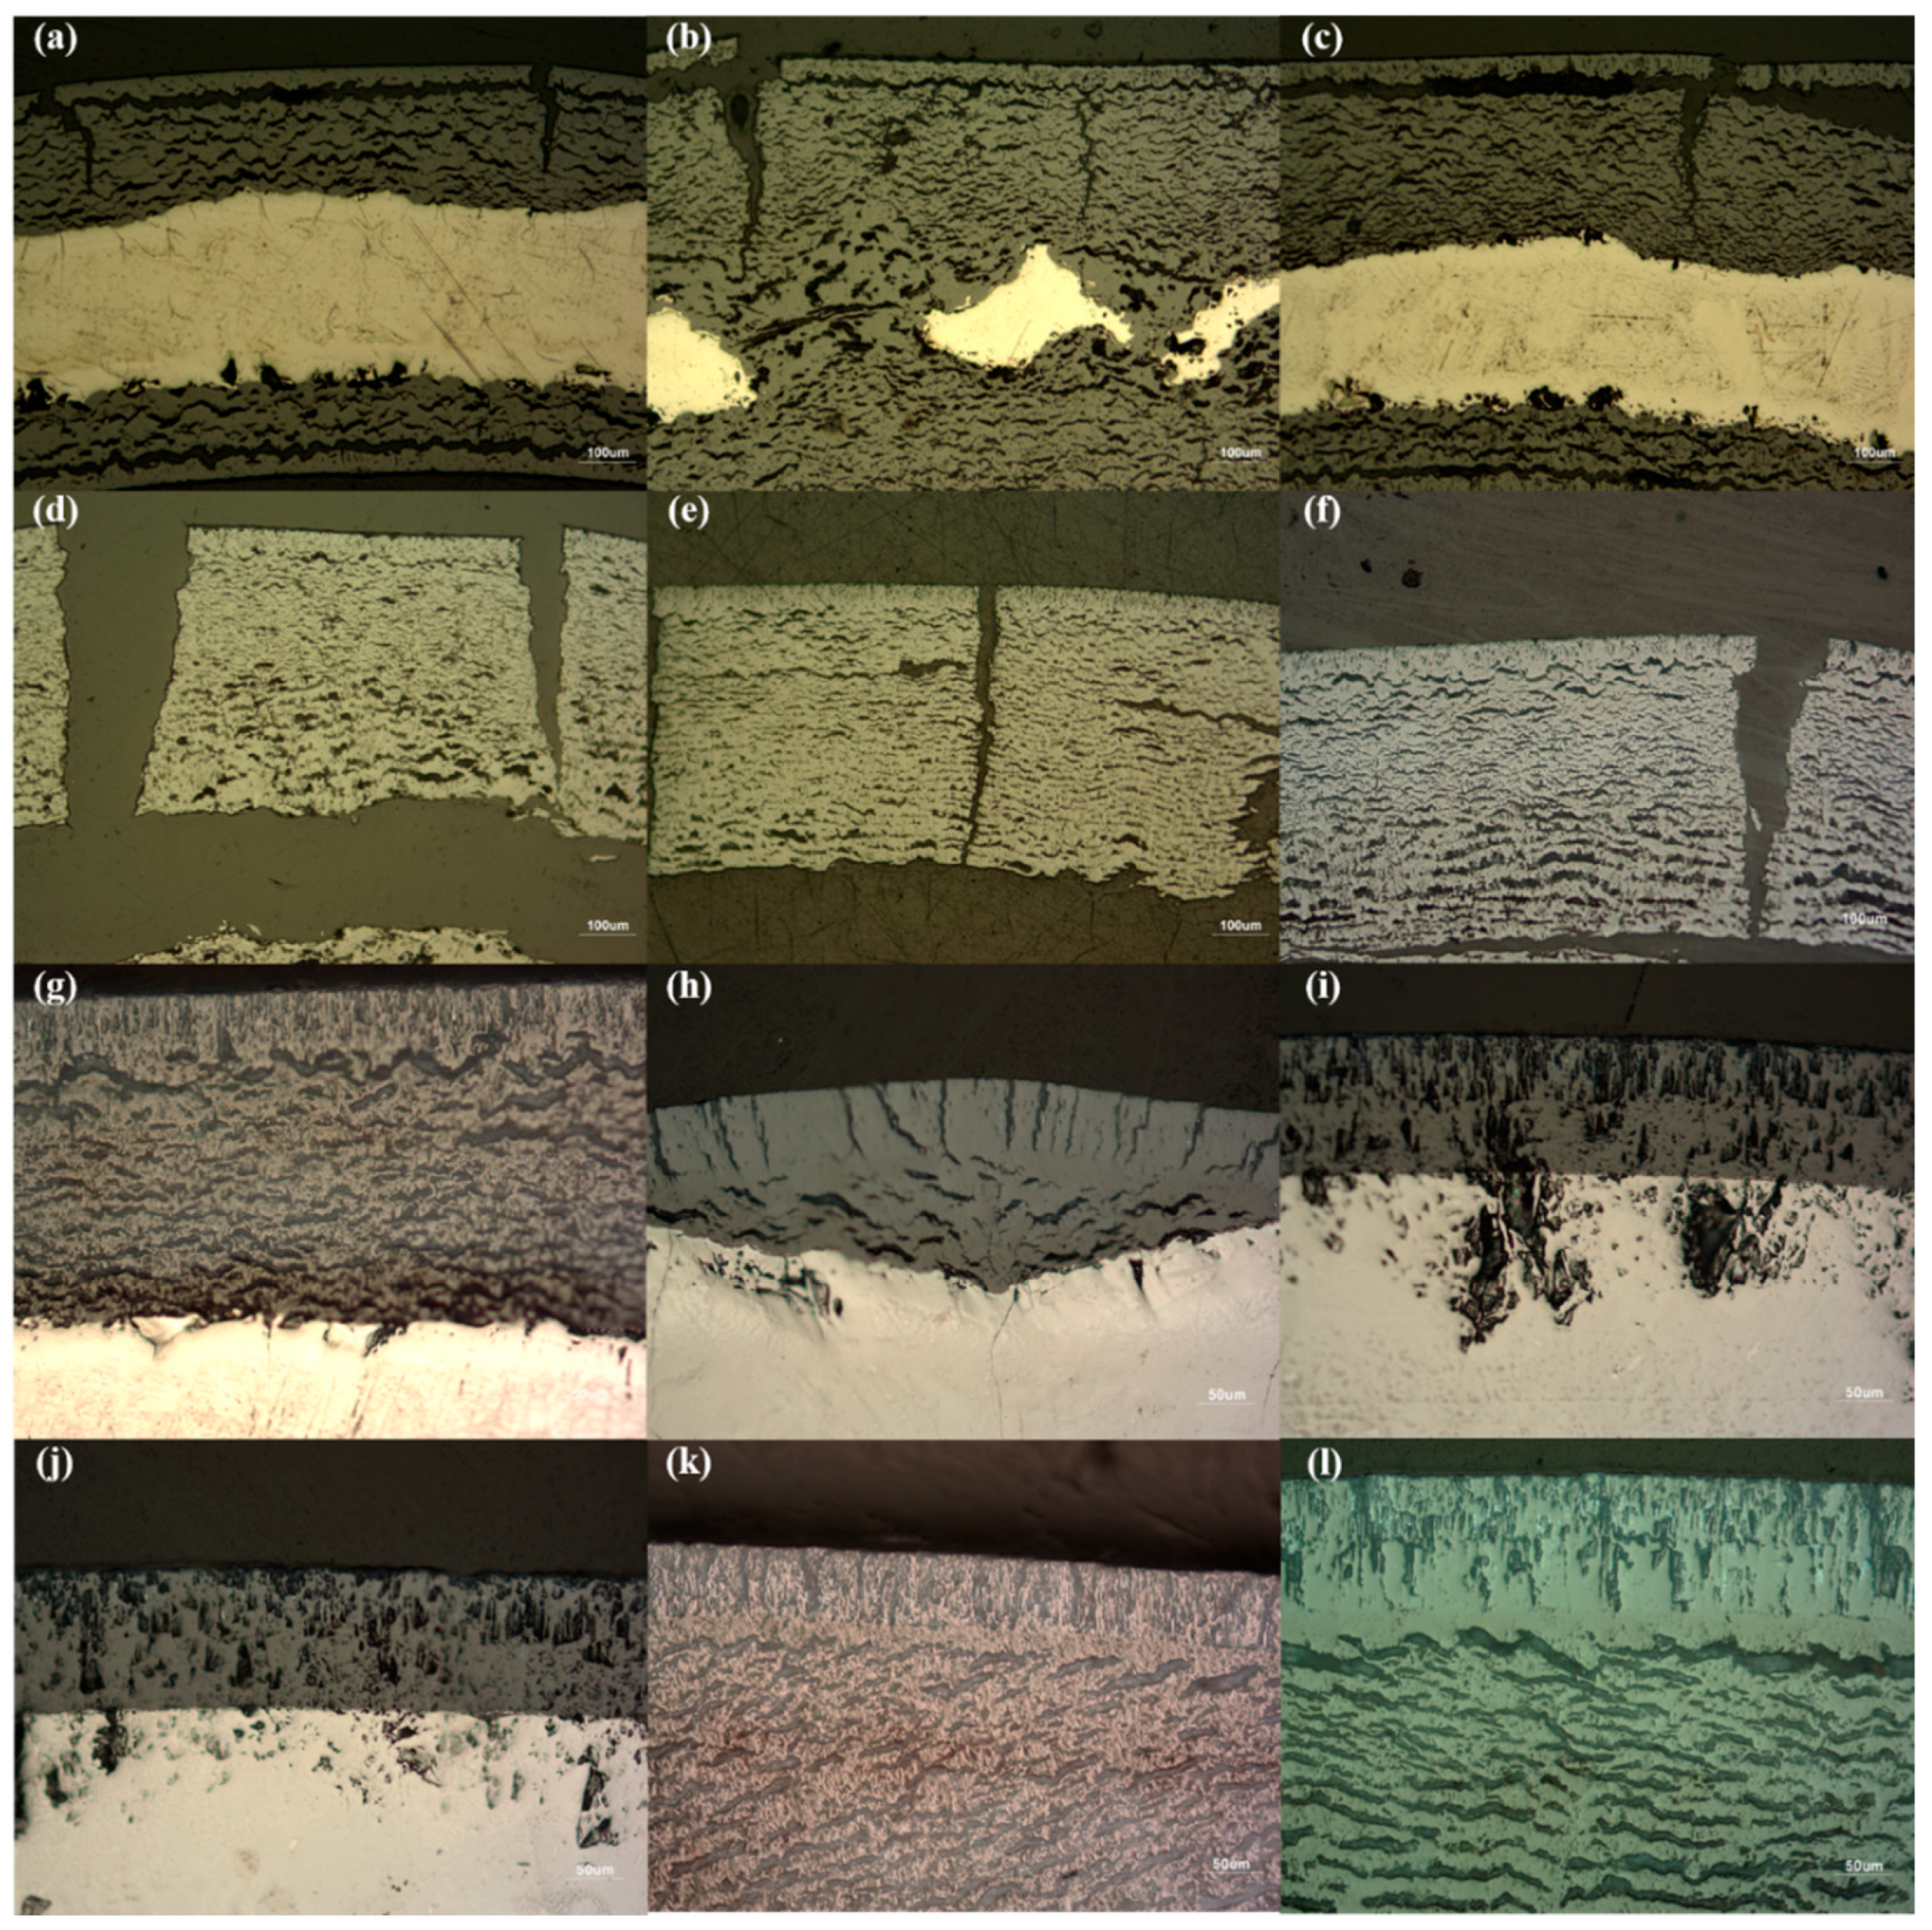
3.3. Macro- and Micrograph Results

To identify the oxide appearance of the post-test samples, investigation of the macro- and micrographs was conducted. Figure 5 shows the macrographs of the post-test samples. Shown in Figure 5a–j, photos were captured after 2 h of isothermal test under 180 mL/min, while those in Figure 5k,l were obtained after 4 h tests under 200 mL/min, respectively. At a first glance, there are numerous cracks on the external surfaces of the samples, and the color of the oxides appears to be light until 140 mL/min (Figure 5a–g). On the other hands, cracks are not observed, and a dark-colored oxide is observed for 180 and 200 mL/min conditions (Figure 5i,j, respectively), while a mixture of light- and dark-colored oxides were observed with no apparent cracks for 160 mL/min. The change in oxide colors from dark to light coincided with the kinetic transition, which was reported in previous studies [8]. Moreover, the cracks are generated when the accumulated stresses in the oxide scale are released progressively during the oxide phase transition from tetragonal to monoclinic [3,7,9]. These descriptions support the change in oxide color from dark to light in both 180 and 200 mL/min cases, as oxygen exposure time is increased from 2 to 4 h, which can be assumed as the occurrence of the breakaway (Figure 5i–l). Additionally, the investigation of the macrographs is in good agreement with the previously reported TG mass gain.
Figure 6 shows microphotography by an optical microscope (OM). For the 2 h photos, the oxidation formation was characterized by the formation of dense columnar oxides at the outermost layer, and porous oxides underneath the dense oxide layer were formed until 140 mL/min (Figure 6a–g). Additionally, large radial cracks in the oxide layer indicate the breakaway. These oxide formations were detected in [1,3,7], where the breakaway temperature range existed (typically ~1050 °C). In contrast, a different oxide formation was identified from 160 mL/min. Small amounts of porous oxides and some cracks in the dense columnar oxide layer at 160 mL/min were observed. This seems to be a transition region and corresponds to previous mass-gain and macrograph results. These differences are more apparent for 180 and 200 mL/min (Figure 6i,j, respectively). Only thick, dense oxides are observed. As expected, the porous oxides were observed in both 180 and 200 mL/min for 4 h post-test samples (Figure 6k,l, respectively); however, there were still the dense oxide layers without the porous oxides in other points. It should be noted that the porous oxides were only detected in light-colored oxides, and the dense oxides were observed in dark-colored oxides. Spotted cracks in the oxides and nearby metal oxide–metal interfaces were observed and were probably generated during the grinding and polishing steps due to the specimen’s embrittlement [8].
In this study, we aimed to identify the effect of initial temperature escalation on oxidation behaviors and oxide characteristics by isothermal oxidation tests at 1000 °C. An initial sharp temperature escalation was observed, and its degree increased with an increase in the oxygen flow rate. The initial increase in the mass-gain rate is also attributed to the sudden increase in temperature [1,4,6]. After the significant increase in the reaction rate, it followed the almost (sub-)parabolic reaction law; however, it was approximately zero for 180 and 200 mL/min. This might be due to the sudden growth of a thick oxide layer, which acts as a strong diffusion barrier. Even though each case showed a different reaction rate and time for each reaction regime, mass gain followed the general oxidation kinetics.
One of the most interesting points in this work is the delay of breakaway when the peak temperature exceeded 1050 °C. This result could be identified by both TG mass-gain data and post-test investigations. Note that the thickness of the dense columnar oxide increased with an increase in the initial peak temperature, as shown in Table 1. The thickness of dense columnar oxide is assumed to be equal to the thickness at the breakaway because these two thickness values showed similar scales reported by C. Duirez et al. [1]. In addition, they already discussed the relationship between the thickness of the oxide at the transition and the dense oxide, and the thickness of dense oxides is strongly dependent on temperature. This also seems to be related to former findings that the formation of dense oxide is observed for the entire oxide layer at the highest temperature range, with the absence of breakaway [1,4]. Moreover, it should be noted that the abrupt delay of the breakaway began when the peak temperature overlapped with the tetragonal stabilization temperature region. The highest tetragonal phase fraction in the oxide scale is probably anticipated to be 200 mL/min, which shows the longest time to breakaway in this work. It was suggested that lower tetragonal phase fractions in oxides might reduce the internal stress by phase transformations, which is one of the most important factors leading to a breakaway. Hence, both an improved corrosion resistance and delay of breakaway can be expected [10], but the reverse tendency is observed for the breakaway in our results. It is hard to understand this consequence because it is possibly interrelated with many factors, i.e., the oxide phase [10,11,12], microstructure and grain boundary characteristics [13,14,15], and so on. To investigate these factors, additional analyses using Raman spectroscopy, X-ray diffraction (XRD), transmission electron microscopy (TEM), and other apparatuses are necessary.
It is worth emphasizing that the initial temperature escalation should be considered with respect to oxidation behaviors and oxide characteristics, specifically the growth of dense columnar oxide, for a better understanding and prediction of the oxide kinetics.

4. Conclusions

Isothermal oxidation tests at 1000 °C were carried out to identify the effect of the oxygen flow rate on oxidation behavior. A breakaway time delay phenomenon was discovered in this study. The breakaway time delay phenomenon seems to depend on the abrupt temperature escalation of the cladding surface in the early stages of the oxidation reaction. It was confirmed that the delay phenomenon starts above peak temperatures exceeding 1050 °C. This result is consistent with a previous study showing that dense columnar oxides were favorably formed at over 1050 °C. Macro- and micrograph observations were also performed to support this result. According to macrographic analysis, there is no oxide color change in cases of high flow rate. This means that there is a breakaway time delay because changes in oxide colors from dark to light coincided with the kinetic transition, which was reported in previous studies. The investigation of the macrographs is in good agreement with the TG mass-gain analyses. Additionally, the porous oxides were only detected in light-colored oxides, and the dense oxides were observed in dark-colored oxides, according to micrographic analysis. Dark-colored oxides are generated by the sudden growth of a thick oxide layer, which acts as a strong diffusion barrier. Therefore, the breakaway time delay phenomenon was detected in the high-oxygen-flow region. Consequently, the breakaway time delay phenomenon seems to be related to an abrupt increase in cladding temperature in the early oxidation stage. It is worth emphasizing that the initial temperature escalation should be considered with respect to oxidation behaviors and oxide characteristics, specifically the growth of dense columnar oxide, for a better understanding and prediction of oxide kinetics.

Author Contributions

Conceptualization, J.L.; methodology, J.L.; validation, S.S., J.L.; formal analysis, G.K.; investigation, G.K.; resources, G.K.; data curation, G.K.; writing—original draft preparation, G.K.; writing—review and editing, S.S.; supervision, J.L.; project administration, J.L.; funding acquisition, J.L. All authors have read and agreed to the published version of the manuscript.

Funding

This work was supported by Korea Hydro & Nuclear Power Co., LTD (No. 2019-TECH-06).

Institutional Review Board Statement

Not applicable.

Informed Consent Statement

Not applicable.

Data Availability Statement

Data available in a publicly accessible repository.

Conflicts of Interest

The authors declare no conflict of interest.

References

  1. Duriez, C.; Dupont, T.; Schmet, B.; Enoch, F. Zircaloy-4 and M5® high temperature oxidation and nitriding in air. J. Nucl. Mater. 2008, 380, 30–45. [Google Scholar] [CrossRef]
  2. Coindreau, O.; Duriez, C.; Ederli, S. Air oxidation of Zircaloy-4 in the 600–1000 °C temperature range: Modeling for ASTEC code application. J. Nucl. Mater. 2010, 405, 207–215. [Google Scholar] [CrossRef]
  3. Steinbrück, M.; Vér, N.; Große, M. Oxidation of Advanced Zirconium Cladding Alloys in Steam at Temperatures in the Range of 600–1200 °C. Oxid. Met. 2011, 76, 215–232. [Google Scholar] [CrossRef]
  4. Steinbrück, M. Prototypical experiments relating to air oxidation of Zircaloy-4 at high temperatures. J. Nucl. Mater. 2009, 392, 531–544. [Google Scholar] [CrossRef]
  5. Grosse, M.; Steinbrueck, M.; Maeng, Y.; Sung, J. Influence of the steam and oxygen flow rate on the reaction of zirconium in steam/nitrogen and oxygen/nitrogen atmospheres. In Proceedings of the International Congress on Advances in Nuclear Power Plants (ICAPP), San Francisco, CA, USA, 17–20 April 2016. [Google Scholar]
  6. Steinbruck, M.; Schaffer, S. High-Temperature Oxidation of Zircaloy-4 in Oxygen–Nitrogen Mixtures. Oxid. Met. 2015, 85, 245–262. [Google Scholar] [CrossRef]
  7. Steinbrück, M. Oxidation of Zirconium Alloys in Oxygen at High Temperatures up to 1600 °C. Oxid. Met. 2008, 70, 317–329. [Google Scholar] [CrossRef]
  8. Negyesi, M.; Amaya, M. The influence of the air fraction in steam on the growth of the columnar oxide and the adjacent α-Zr(O) layer on Zry-4 fuel cladding at 1273 and 1473 K. Ann. Nucl. Energy 2018, 114, 52–65. [Google Scholar] [CrossRef]
  9. Leistikow, S.; Schanz, G. Oxidation kinetics and related phenomena of zircaloy-4 fuel cladding exposed to high temperature steam and hydrogen-steam mixtures under PWR accident conditions. Nucl. Eng. Des. 1987, 103, 65–84. [Google Scholar] [CrossRef]
  10. Qin, W.; Nam, C.; Li, H.; Szpunar, J. Tetragonal phase stability in ZrO2 film formed on zirconium alloys and its effects on corrosion resistance. Acta Mater. 2007, 55, 1695–1701. [Google Scholar] [CrossRef]
  11. Baek, J.H.; Jeong, Y.H. Breakaway phenomenon of Zr-based alloys during a high-temperature oxidation. J. Nucl. Mater. 2008, 372, 152–159. [Google Scholar] [CrossRef]
  12. El Kadiri, H.; Utegulov, Z.; Khafizov, M.; Zaeem, M.A.; Mamivand, M.; Oppedal, A.; Enakoutsa, K.; Cherkaoui, M.; Graham, R.; Arockiasamy, A. Transformations and cracks in zirconia films leading to breakaway oxidation of Zircaloy. Acta Mater. 2013, 61, 3923–3935. [Google Scholar] [CrossRef]
  13. Kim, H.-G.; Kim, I.-H.; Choi, B.-K.; Park, J.-Y. A study of the breakaway oxidation behavior of zirconium cladding materials. J. Nucl. Mater. 2011, 418, 186–197. [Google Scholar] [CrossRef]
  14. Park, D.J.; Park, J.Y.; Jeong, Y.H.; Lee, J.Y. Microstructural characterization of ZrO2 layers formed during the transition to breakaway oxidation. J. Nucl. Mater. 2010, 399, 208–211. [Google Scholar] [CrossRef]
  15. Garner, A.; Gholinia, A.; Frankel, P.; Gass, M.; MacLaren, I.; Preuss, M. The microstructure and microtexture of zirconium oxide films studied by transmission electron backscatter diffraction and automated crystal orientation mapping with transmission electron microscopy. Acta Mater. 2014, 80, 159–171. [Google Scholar] [CrossRef]
Figure 1. Preparation diagram of specimen inside the TGA.
Applsci 12 02871 g001
Figure 2. Mass-gain result of the dummy test with alumina tube under 200 mL/min oxygen flow rate condition at 1000 °C.
Applsci 12 02871 g002
Figure 3. Results of the isothermal oxidation experiments under various oxygen flow rate conditions at 1000 °C: (a) TG mass gain (log–log diagram), (b) TG mass-gain rate (log–log diagram), (c) breakaway time, (d) oxide thickness at the breakaway.
Applsci 12 02871 g003
Figure 4. Results of the temperature escalation in the early stage of the oxidation reaction: 0 to 150 s. (a) Reproducibility check of the temperature: 20 mL/min, and 200 mL/min. (b) History of the temperature escalation; oxygen flow rate from 20 to 200 mL/min.
Applsci 12 02871 g004
Figure 5. Macrographs of selected Zircaloy-4 after 2 and 4 h isothermal tests under various oxygen flow rate conditions at 1000 °C: (a) 20 mL/min, (b) 40 mL/min, (c) 60 mL/min, (d) 80 mL/min, (e) 100 mL/min, (f) 120 mL/min, (g) 140 mL/min, (h) 160 mL/min, (i) 180 mL/min, (j) 200 mL/min, (k) 180 mL/min, (l) 200 mL/min; (aj) 2 h, (k,l): 4 h.
Applsci 12 02871 g005
Figure 6. Micrographs of selected Zircaloy-4 after 2 and 4 h isothermal tests under various oxygen flow rate conditions at 1000 °C: (a) 20 mL/min, (b) 40 mL/min, (c) 60 mL/min, (d) 80 mL/min, (e) 100 mL/min, (f) 120 mL/min, (g) 140 mL/min, (h) 160 mL/min, (i) 180 mL/min, (j) 200 mL/min, (k) 180 mL/min, (l) 200 mL/min; (aj): 2 h, (k,l): 4 h.
Applsci 12 02871 g006
Table 1. Summary of final mass gain, peak temperature, breakaway time, and oxide thickness at breakaway with various oxygen flow rate conditions for 2 h oxidation test at 1000 °C.
Oxygen Flow Rate
(mL/min)
Final Mass Gain (%)Peak Temperature
(°C)
Breakaway Time (s)δ at Breakaway
(µm)
2014.241001.86147347.90
4015.121003.17134150.14
6017.891004.44138752.25
8025.081005.81124254.50
10027.801033.81138666.17
12026.751038.88143071.65
14026.021048.33139578.94
16016.171062.71167281.78
1809.481076.14307994.81
20011.241096.426109131.12
Average (20–140)
Average (20–200)
21.84
18.98
1019.47
1037.16
1379
2051
57.10
72.92
Alumina tube
(Dummy test)
0.08---
Publisher’s Note: MDPI stays neutral with regard to jurisdictional claims in published maps and institutional affiliations.

