
Regional Adaptability Analysis of Solar Roof Utilization Technologies in China


Abstract
:Featured Application
Abstract
1. Introduction
- Solar thermal technology.
- 2.
- Solar PV technology.
2. Methodology
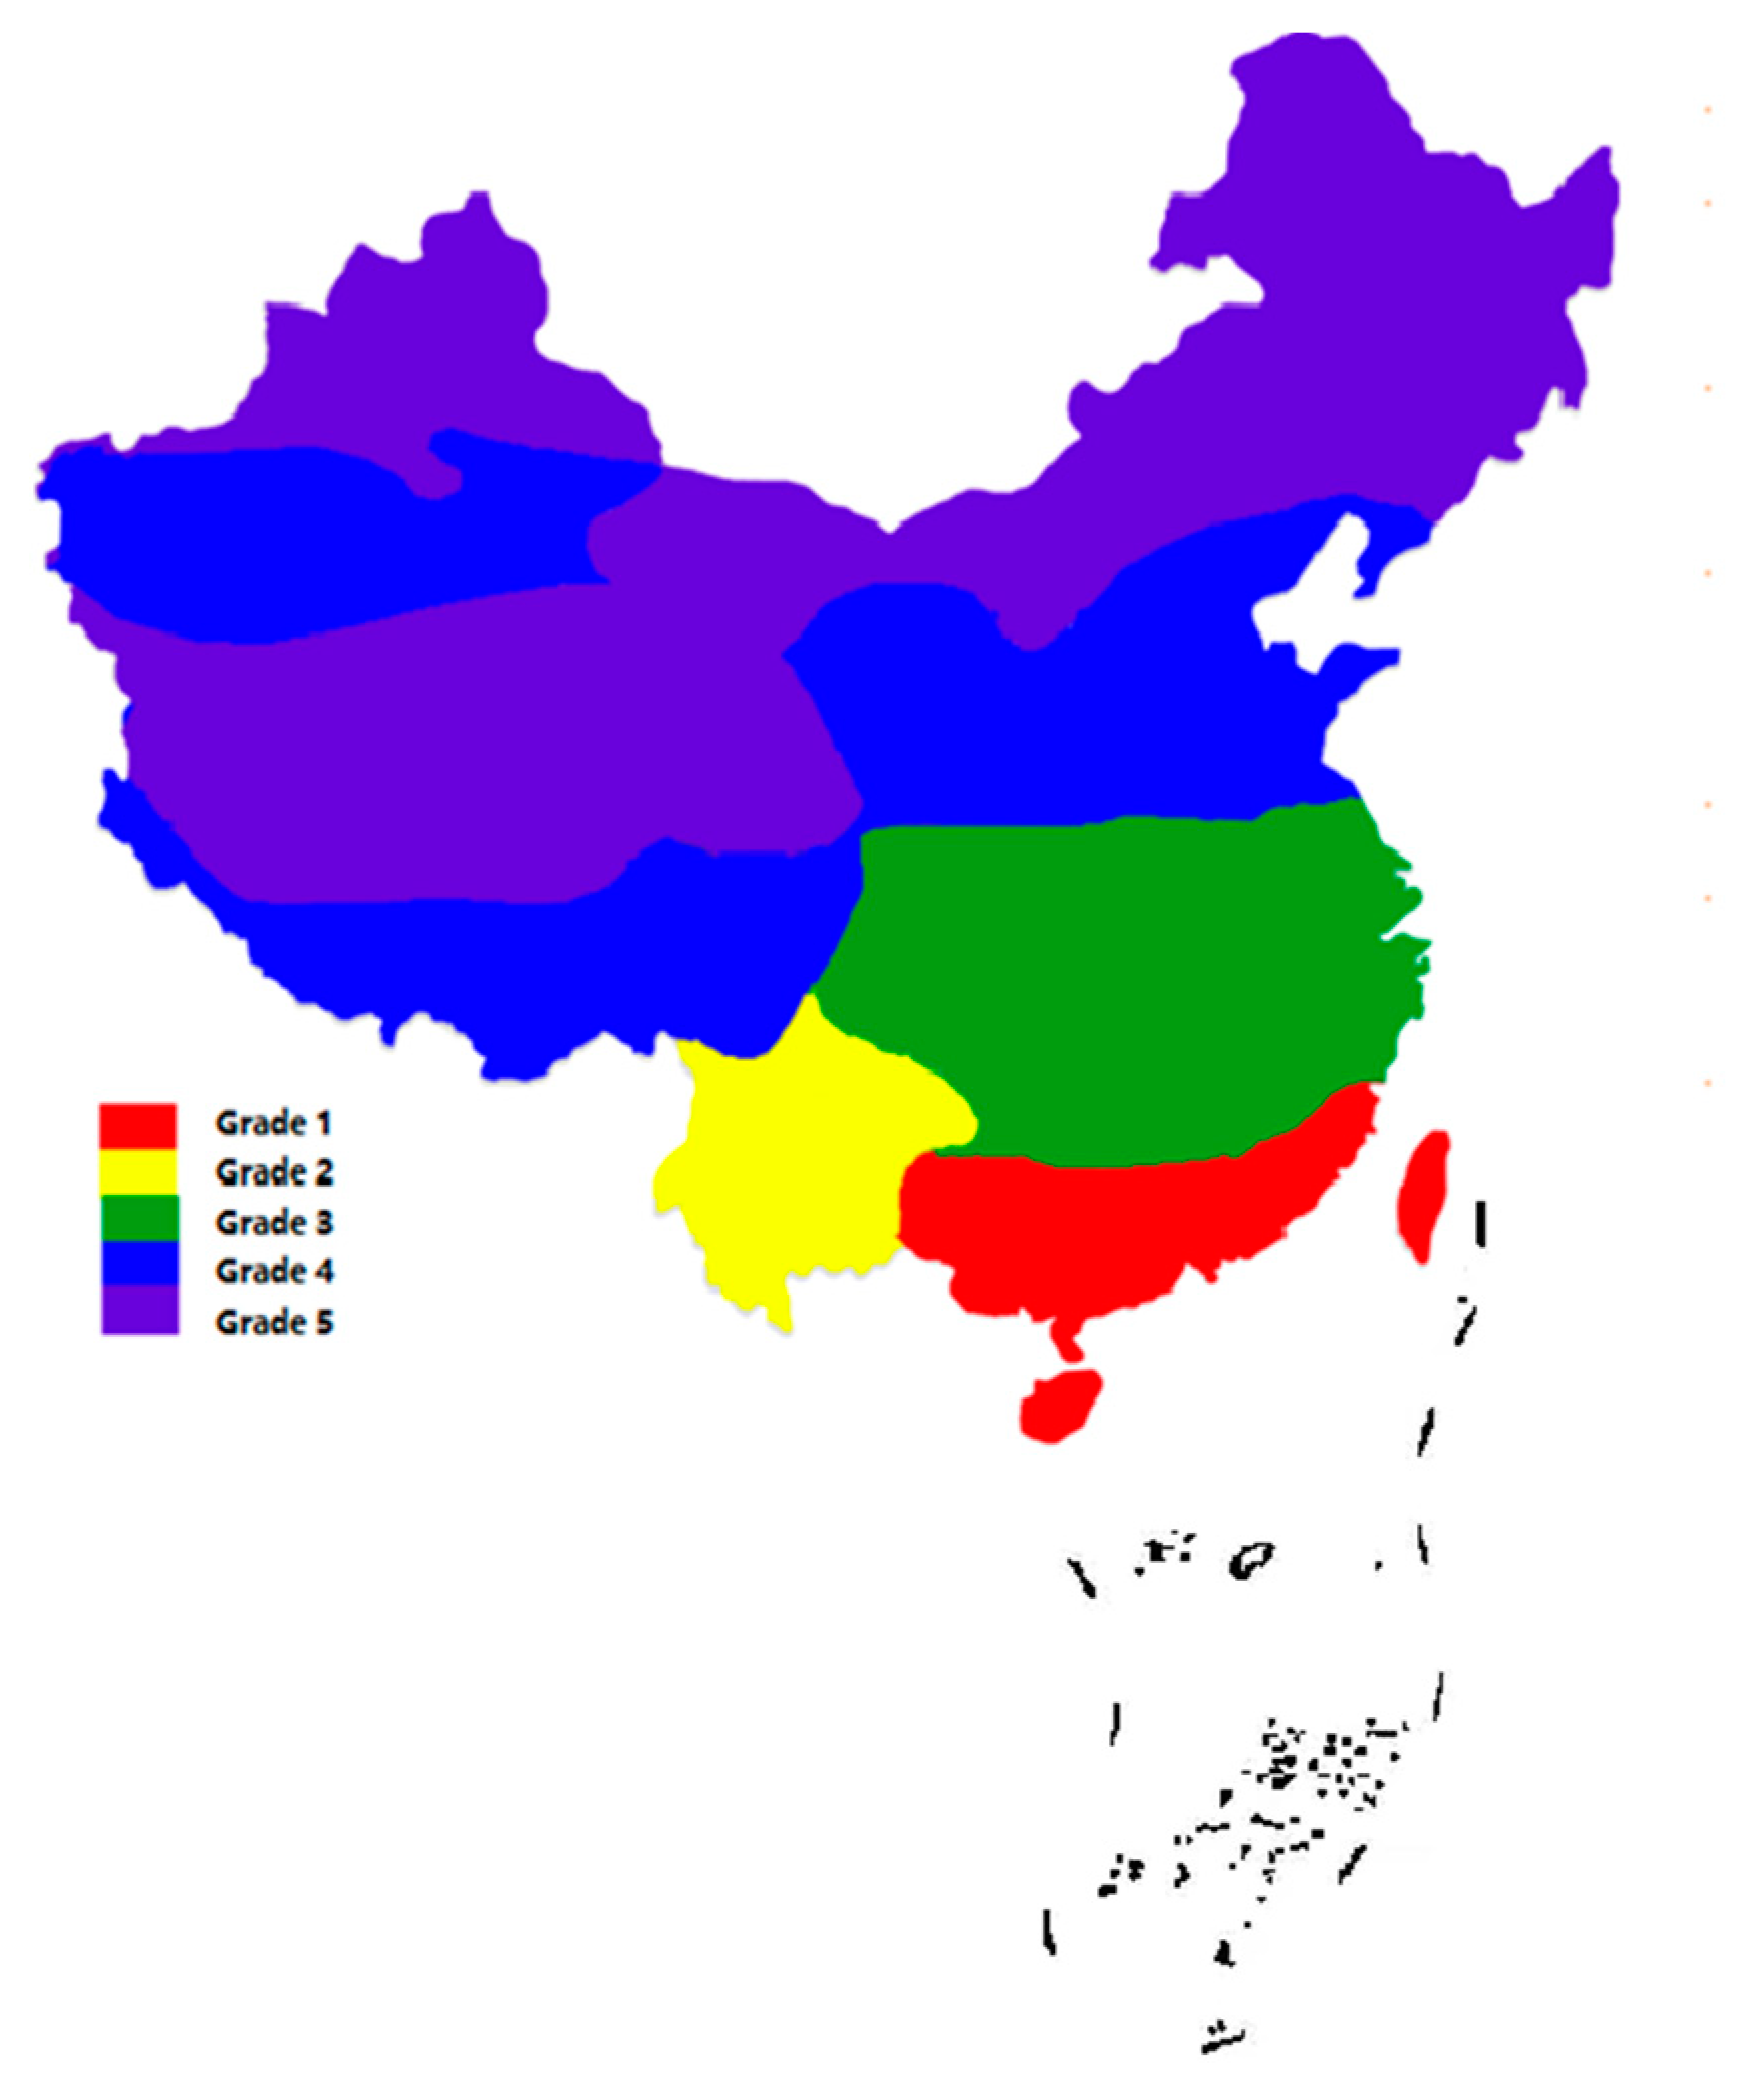
2.1. Selection of Typical Cities
2.2. Selection of Typical Buildings
2.3. Parameters of the Buildings
2.4. The Solar Utilization Systems
2.4.1. The Solar Heating System
2.4.2. The Solar PV System
2.5. Evaluation of the Energy-Saving Benefit
2.5.1. Evaluation of Energy-Saving for the Solar Heating System
2.5.2. Evaluation of Energy-Saving Benefit for the Solar PV System
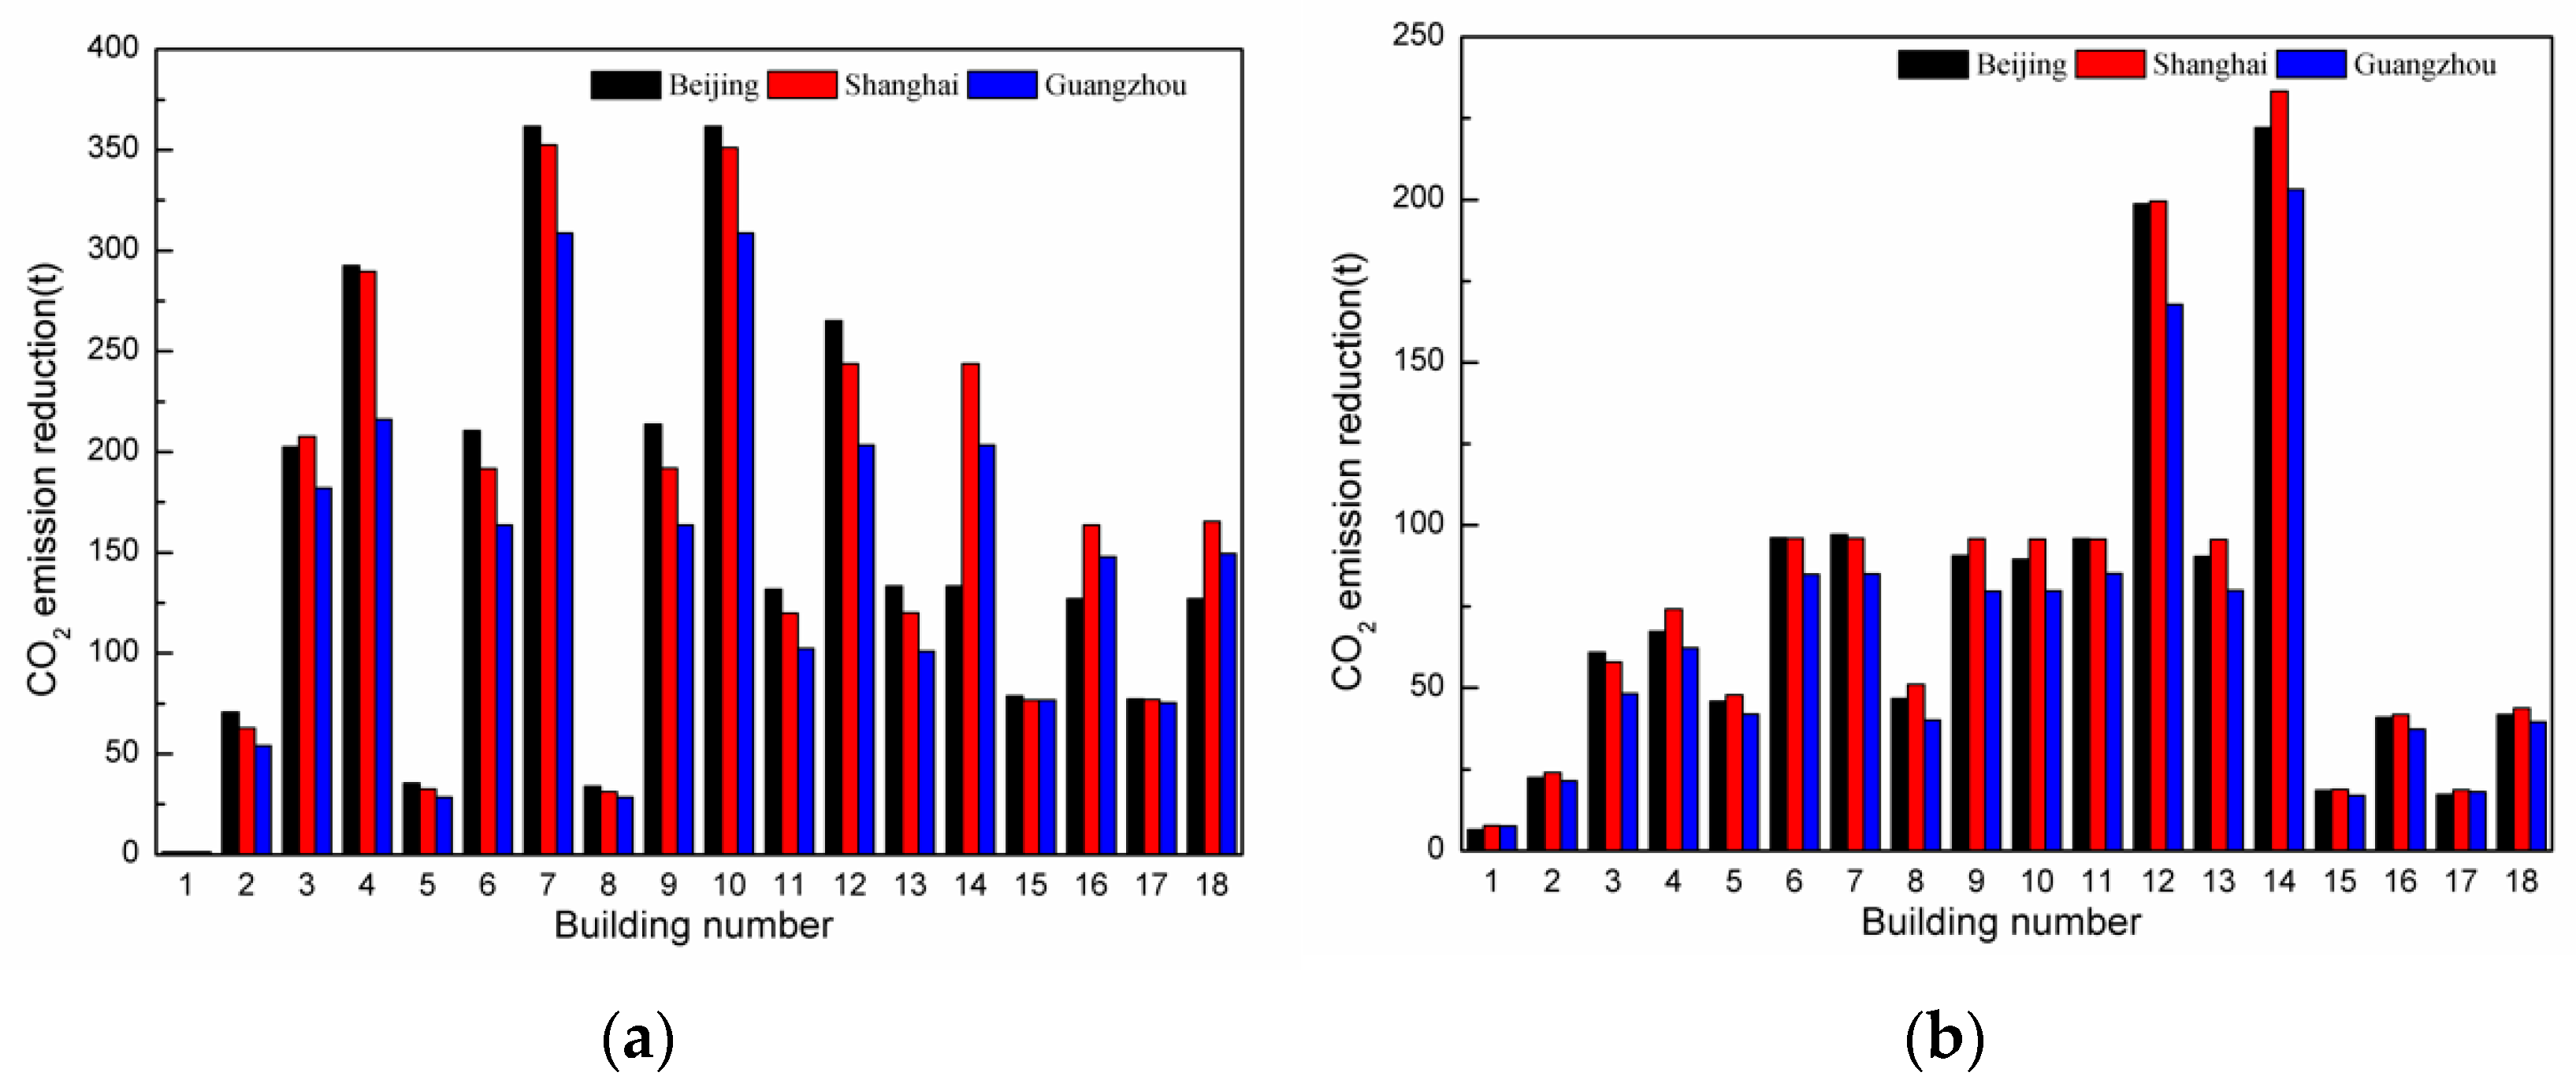
2.6. Evaluation of the Environmental Benefit
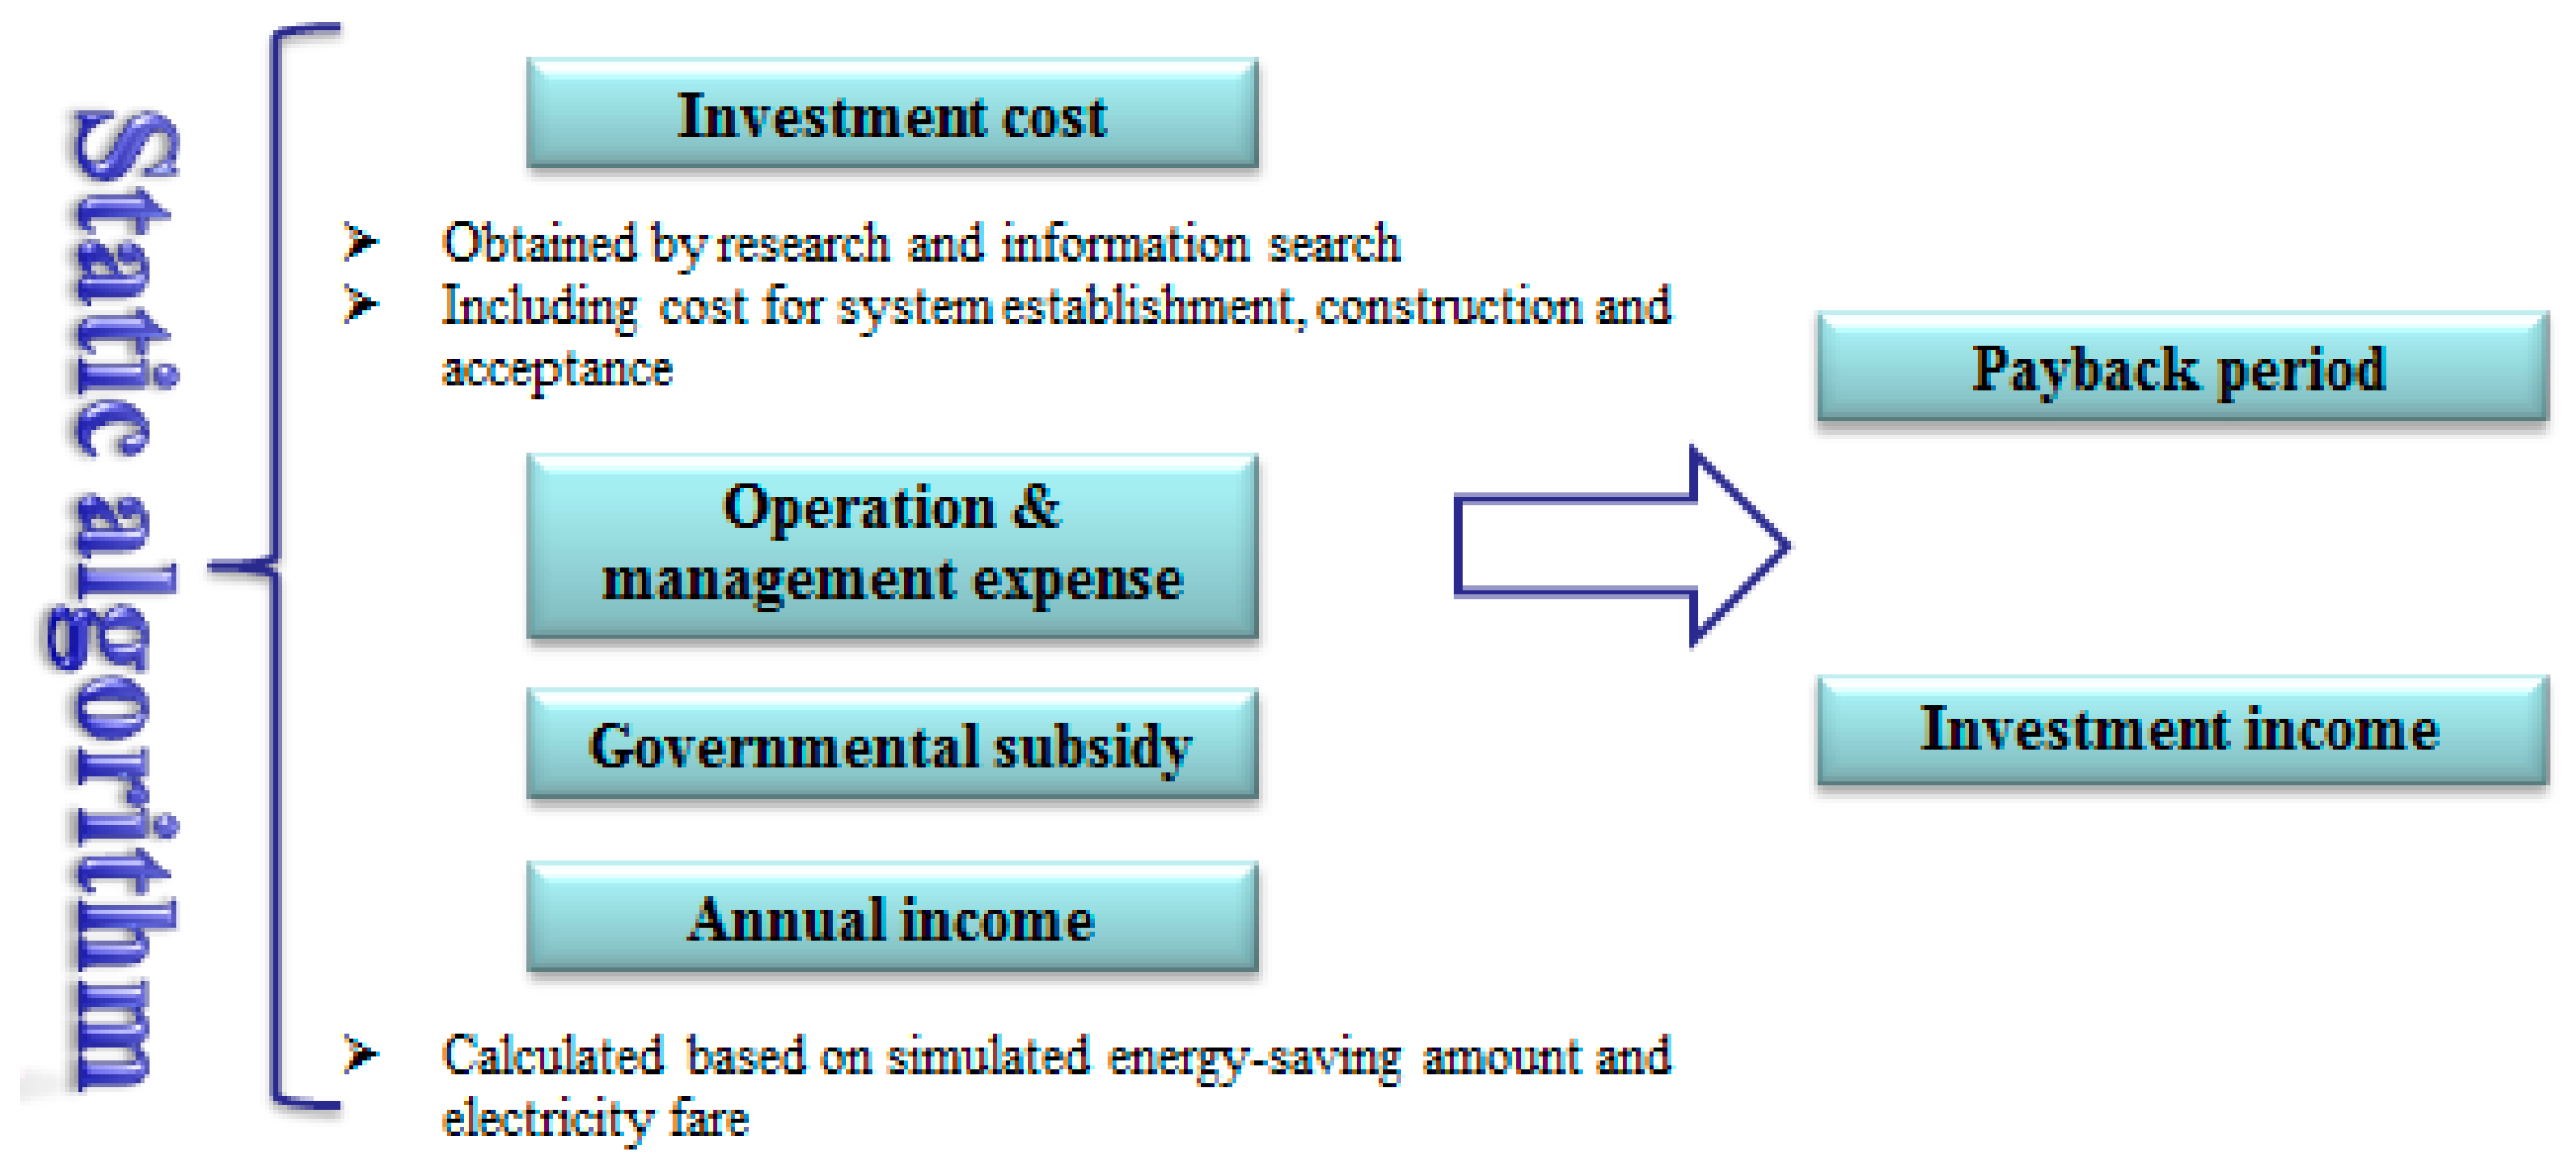
2.7. Evaluation of the Economic Benefit
2.8. Adaptability Index Evaluation
2.8.1. Adaptability Index for the Solar Thermal Technology
2.8.2. The Adaptability Index Evaluation for a Solar PV System
3. Case Analysis
3.1. Basic Information of the Case
3.2. Adaptability Analysis
3.3. Simulation Verification
4. Conclusions
- (1)
- The average adaptability index values for solar thermal technology and solar PV technology are 2.54 and 1.63, respectively. Solar thermal technology has a shorter nominal investment payback period; therefore, it is more preferred in most of the investigated scenarios, especially in residential buildings and hotel buildings with a hot water demand.
- (2)
- The average payback time of a solar PV system for all the investigated buildings is 12 years. The payback time for a PV system could be as low as 5 years and as high as 26. The longer investment payback period is seen for Chongqing and Xingyi city because of poor solar radiation resource.
- (3)
- Technical specifications or application standards regarding roof utilization in China should be launched by relevant national departments to guide and regulate the reasonable use of building roofs. It is considered essential to promote the development of roof utilization technologies. Provincial or municipal governments should develop five-year or ten-year development plans for roof utilizations considering local economic development, climate conditions, solar resources, energy conservation and emission reduction, urban sustainable development, and urban ecological environment, as well as the function of buildings and adaptability of roof utilization technologies.
- (4)
- Since a larger difference may exist between the simulation and the practical application, it is recommended to carry out further detailed investigations in order to develop a sophisticated database of adaptability of roof utilization technologies for references in the future engineering practice.
Author Contributions
Funding
Institutional Review Board Statement
Informed Consent Statement
Data Availability Statement
Conflicts of Interest
References
- China National Bureau of Statistics. China Statistical Yearbook 2019; National Bureau of Statistics of the People′s Republic of China: Beijing, China, 2019. (In Chinese)
- Jeppesen, B. Rooftop solar power: The solar energy potential of commercial building rooftops in the USA. Refocus 2004, 5, 32–34. [Google Scholar] [CrossRef]
- Wong, N.H.; Chen, Y.; Ong, C.L.; Sia, A. Investigation of thermal benefits of rooftop garden in the tropical environment. Build. Environ. 2003, 38, 261–270. [Google Scholar] [CrossRef]
- Huide, F.; Xuxin, Z.; Lei, M.; Tao, Z.; Qixing, W.; Hongyuan, S. A comparative study on three types of solar utilization technologies for buildings: Photovoltaic, solar thermal and hybrid photovoltaic/thermal systems. Energy Convers. Manag. 2017, 140, 1–13. [Google Scholar] [CrossRef]
- Niko, L.; Danijel, Ž.; Sebastijan, S.; Borut, Ž.; Gorazd, Š. Rating of roofs’ surfaces regarding their solar potential and suitability for PV systems, based on LiDAR data. Appl. Energy 2013, 102, 803–812. [Google Scholar]
- Kodysh, J.B.; Omitaomu, O.A.; Bhaduri, B.L.; Neish, B.S. Methodology for estimating solar potential on multiple building rooftops for photovoltaic systems. Sustain. Cities Soc. 2013, 8, 31–41. [Google Scholar] [CrossRef]
- Gergelova, M.B.; Kuzevicova, Z.; Labant, S.; Kuzevic, S.; Mizak, J. Roof’s Potential and Suitability for PV Systems Based on LiDAR: A Case Study of Komárno, Slovakia. Sustainability 2020, 12, 10018. [Google Scholar] [CrossRef]
- Karteris, M.; Slini, T.; Papadopoulos, A.M. Urban solar energy potential in Greece: A statistical calculation model of suitable built roof areas for photovoltaics. Energy Build. 2013, 62, 459–468. [Google Scholar] [CrossRef]
- Redweik, P.; Catita, C.; Brito, M. Solar energy potential on roofs and facades in an urban landscape. Sol. Energy 2013, 97, 332–341. [Google Scholar] [CrossRef]
- Ordóñez, J.; Jadraque, E.; Alegre, J.; Martínez, G. Analysis of the photovoltaic solar energy capacity of residential rooftops in Andalusia (Spain). Renew. Sustain. Energy Rev. 2010, 14, 2122–2130. [Google Scholar] [CrossRef]
- Izquierdo, S.; Montanes, C.; Dopazo, C.; Fueyo, N. Roof-top solar energy potential under performance-based building energy codes: The case of Spain. Sol. Energy 2011, 85, 208–213. [Google Scholar] [CrossRef]
- Jo, J.H.; Otanicar, T.P. A hierarchical methodology for the mesoscale assessment of building integrated roof solar energy systems. Renew. Energy 2011, 36, 2992–3000. [Google Scholar] [CrossRef]
- Kabir, M.H.; Endlicher, W.; Jägermeyr, J. Calculation of bright roof-tops for solar PV applications in Dhaka Megacity, Bangladesh. Renew. Energy 2010, 35, 1760–1764. [Google Scholar] [CrossRef]
- Koo, C.; Hong, T.; Park, H.S.; Yun, G. Framework for the analysis of the potential of the rooftop photovoltaic system to achieve the net-zero energy solar buildings. Prog. Photovolt. Res. Appl. 2014, 22, 462–478. [Google Scholar] [CrossRef]
- Li, Z.H.; Zhang, W.; He, B.; Xie, L.Z.; Chen, M.; Li, J.H.; Zhao, O.F.; Wu, X. A Comprehensive Life Cycle Assessment Study of Innovative Bifacial Photovoltaic Applied on Building. Energy 2022, 245, 123212. [Google Scholar] [CrossRef]
- Shafique, M.; Luo, X.W.; Zuo, J. Photovoltaic-green roofs: A review of benefits, limitations, and trends. Sol. Energy 2020, 202, 485–497. [Google Scholar] [CrossRef]
- Shafique, M.; Xue, X.L.; Luo, X.W. An overview of carbon sequestration of green roofs in urban areas. Urban For. Urban Green. 2020, 47, 126515. [Google Scholar] [CrossRef]
- Pokhrel, S.; Amiri, L.; Poncet, S.; Sasmito, A.P.; Ghoreishi-Madiseh, S.A. Renewable Heating Solutions for Buildings; a Techno-economic Comparative Study of Sewage Heat Recovery and Solar Borehole Thermal Energy Storage System. Energy Build. 2022, 259, 111892. [Google Scholar] [CrossRef]
- Feng, H.; Wang, G.; Li, Q.Y.; Zhang, Y.X.; Li, H.Y. Investigation of a Solar Heating System Assisted by Coupling with Electromagnetic Heating Unit and Phase Change Energy Storage Tank: Towards Sustainable Rural Buildings in Northern China. Sustain. Cities Soc. 2021, 21, 103449. [Google Scholar] [CrossRef]
- Han, X.; Garrison, J.; Hug, G. Techno-economic Analysis of PV-battery Systems in Switzerland. Renew. Sustain. Energy Rev. 2022, 158, 112028. [Google Scholar] [CrossRef]
- Aghamolaei, R.; Shamsi, M.H.; O’Donnell, J. Feasibility Analysis of Community-Based PV systems for Residential Districts: A Comparison of On-site Centralized and Distributed PV Installations. Renew. Energy 2020, 157, 793–808. [Google Scholar] [CrossRef]
- Duman, A.C.; Güler, O. Economic Analysis of Grid-connected Residential Rooftop PV Systems in Turkey. Renew. Energy 2020, 148, 697–711. [Google Scholar] [CrossRef]
- Montan’e MRuiz-Valero, L.; Labra, C.; Faxas-Guzmán, J.G.; Girard, A. Comparative Energy Consumption and PhotoVoltaic Economic Analysis for Residential Buildings in Santiago de chile and Santo domingo of the Dominican Republic. Renew. Sustain. Energy Rev. 2021, 146, 111175. [Google Scholar]
- Qiu, S.; Wang, K.; Lin, B.; Lin, P. Economic Analysis of Residential Solar Photovoltaic Systems in China. J. Clean Prod. 2021, 282, 125297. [Google Scholar] [CrossRef]
- Agathokleous, R.A.; Kalogirou, S.A. PV Roofs as the First Step towards 100% RES Electricity Production for Mediterranean islands: The Case of Cypru. Smart Energy 2021, 4, 100053. [Google Scholar] [CrossRef]
- Sewchurran, S.; Davidson, I.E. Technical and Financial Analysis of Large-scale Solar-PV in eThekwini Municipality: Residential, Business and Bulk Customers. Energy Rep. 2021, 7, 4961–4976. [Google Scholar] [CrossRef]
- Lara, E.G.; García, F.S. Review on Viability and Implementation of Residential PV-battery Systems: Considering the case of Dominican Republic. Energy Rep. 2021, 7, 8868–8899. [Google Scholar] [CrossRef]
- Jin, H.; Yu, J. System Contributions of Residential Battery Systems: New Perspectives on PV Self-consumption. Energy Econ. 2021, 96, 105151. [Google Scholar]
- Lukanov, B.R.; Krieger, E.M. Distributed solar and environmental justice: Exploring the demographic and socio-economic trends of residential PV adoption in California. Energy Policy 2019, 134, 110935. [Google Scholar] [CrossRef]
- Secretariat of China Photovoltaic Industry Association. Report on the Development of Solar Thermal Utilization Industry in China 2018; China Photovoltaic Industry Association: Beijing, China, 2018. (In Chinese) [Google Scholar]
- Secretariat of China Photovoltaic Industry Association. Annual Report of China’s Photovoltaic Industry 2017–2018; China Photovoltaic Industry Association: Beijing, China, 2018. [Google Scholar]
- Liu, Y.F.; Wang, Y.; Wang, D.J.; Jiang, C.; Liu, J.P. Study on comprehensive energy-saving of shading and photovoltaic performance of roof added PV module. Acta Enegiae Sol. Sin. 2019, 40, 1545–1552. (In Chinese) [Google Scholar]
- Zhang, J.T.; Li, C.L.; Yang, L.B.; Guo, S.F. Based on GIS automation, the refined evaluation technology of solar energy and wind energy resources on the roof of regional buildings. Manuf. Autom. 2020, 42, 146–149, 156. (In Chinese) [Google Scholar]
- Wu, P.; Wang, Z.C.; Yang, Y.X.; Xu, Z.W.; Yang, Q.; Liu, F. Application research on air-source heat pump with solar roof in residential buildings in Yangtze River basin. Heat. Vent. Air Cond. 2020, 50, 10–13. (In Chinese) [Google Scholar]
- Ministry of Housing and Urban-Rural Development of the People’s Republic of China (MOHURD). GB 50352-2005 Code for Design of Civil Buildings; China Architecture and Building Press: Beijing, China, 2005. (In Chinese)
- Ministry of Housing and Urban-Rural Development of the People’s Republic of China (MOHURD). GB50189-2015 Design Standard for Energy Efficiency of Public Buildings; Ministry of Housing and Urban-Rural Development of the People’s Republic of China: Beijing, China, 2015. (In Chinese)
- Ministry of Housing and Urban-Rural Development of the People’s Republic of China (MOHURD). JGJ26-2010 Design Standard for Energy Efficiency of Residential Buildings in Frigid Zone and Cold Zone; China Architecture and Building Press: Beijing, China, 2010. (In Chinese)
- Ministry of Housing and Urban-Rural Development of the People’s Republic of China (MOHURD). JGJ134-2010 Design Standard for Energy Efficiency of Residential Buildings in Hot-Summer-and-Cold-Winter Zone; China Architecture and Building Press: Beijing, China, 2010. (In Chinese)
- Ministry of Housing and Urban-Rural Development of the People’s Republic of China (MOHURD). JGJ75-2003 Design Standard for Energy Efficiency of Residential Buildings in Hot-Summer-and-Warm-Winter Zone; China Architecture and Building Press: Beijing, China, 2003. (In Chinese)
- Ministry of Housing and Urban-Rural Development of the People’s Republic of China (MOHURD). GB 50364-2018 Technical Specification of Solar Heat Water System in Civil Buildings; China Architecture and Building Press: Beijing, China, 2018. (In Chinese)
- Ministry of Housing and Urban-Rural Development of the People’s Republic of China (MOHURD). GB 50015-2003 Code for Design of Building Water Supply and Drainage; China Architecture and Building Press: Beijing, China, 2003. (In Chinese)
- He, Z.N.; Zhu, D.Z. Techical Handbook for Solar Heat Supply & Space Heating; Chemical Industry Press: Beijing, China, 2009. (In Chinese) [Google Scholar]
- Ministry of Housing and Urban-Rural Development of the People’s Republic of China (MOHURD). GB 50797-2012 Code for Photovoltaic Power Station; China Planning Press: Beijing, China, 2012. (In Chinese)
- Santos, A.J.L.; Lucena, A.F.P. Climate change impact on the technical-economic potential for solar photovoltaic energy in the residential sector: A case study for Brazil. Energy Clim. Chang. 2021, 2, 100062. [Google Scholar] [CrossRef]


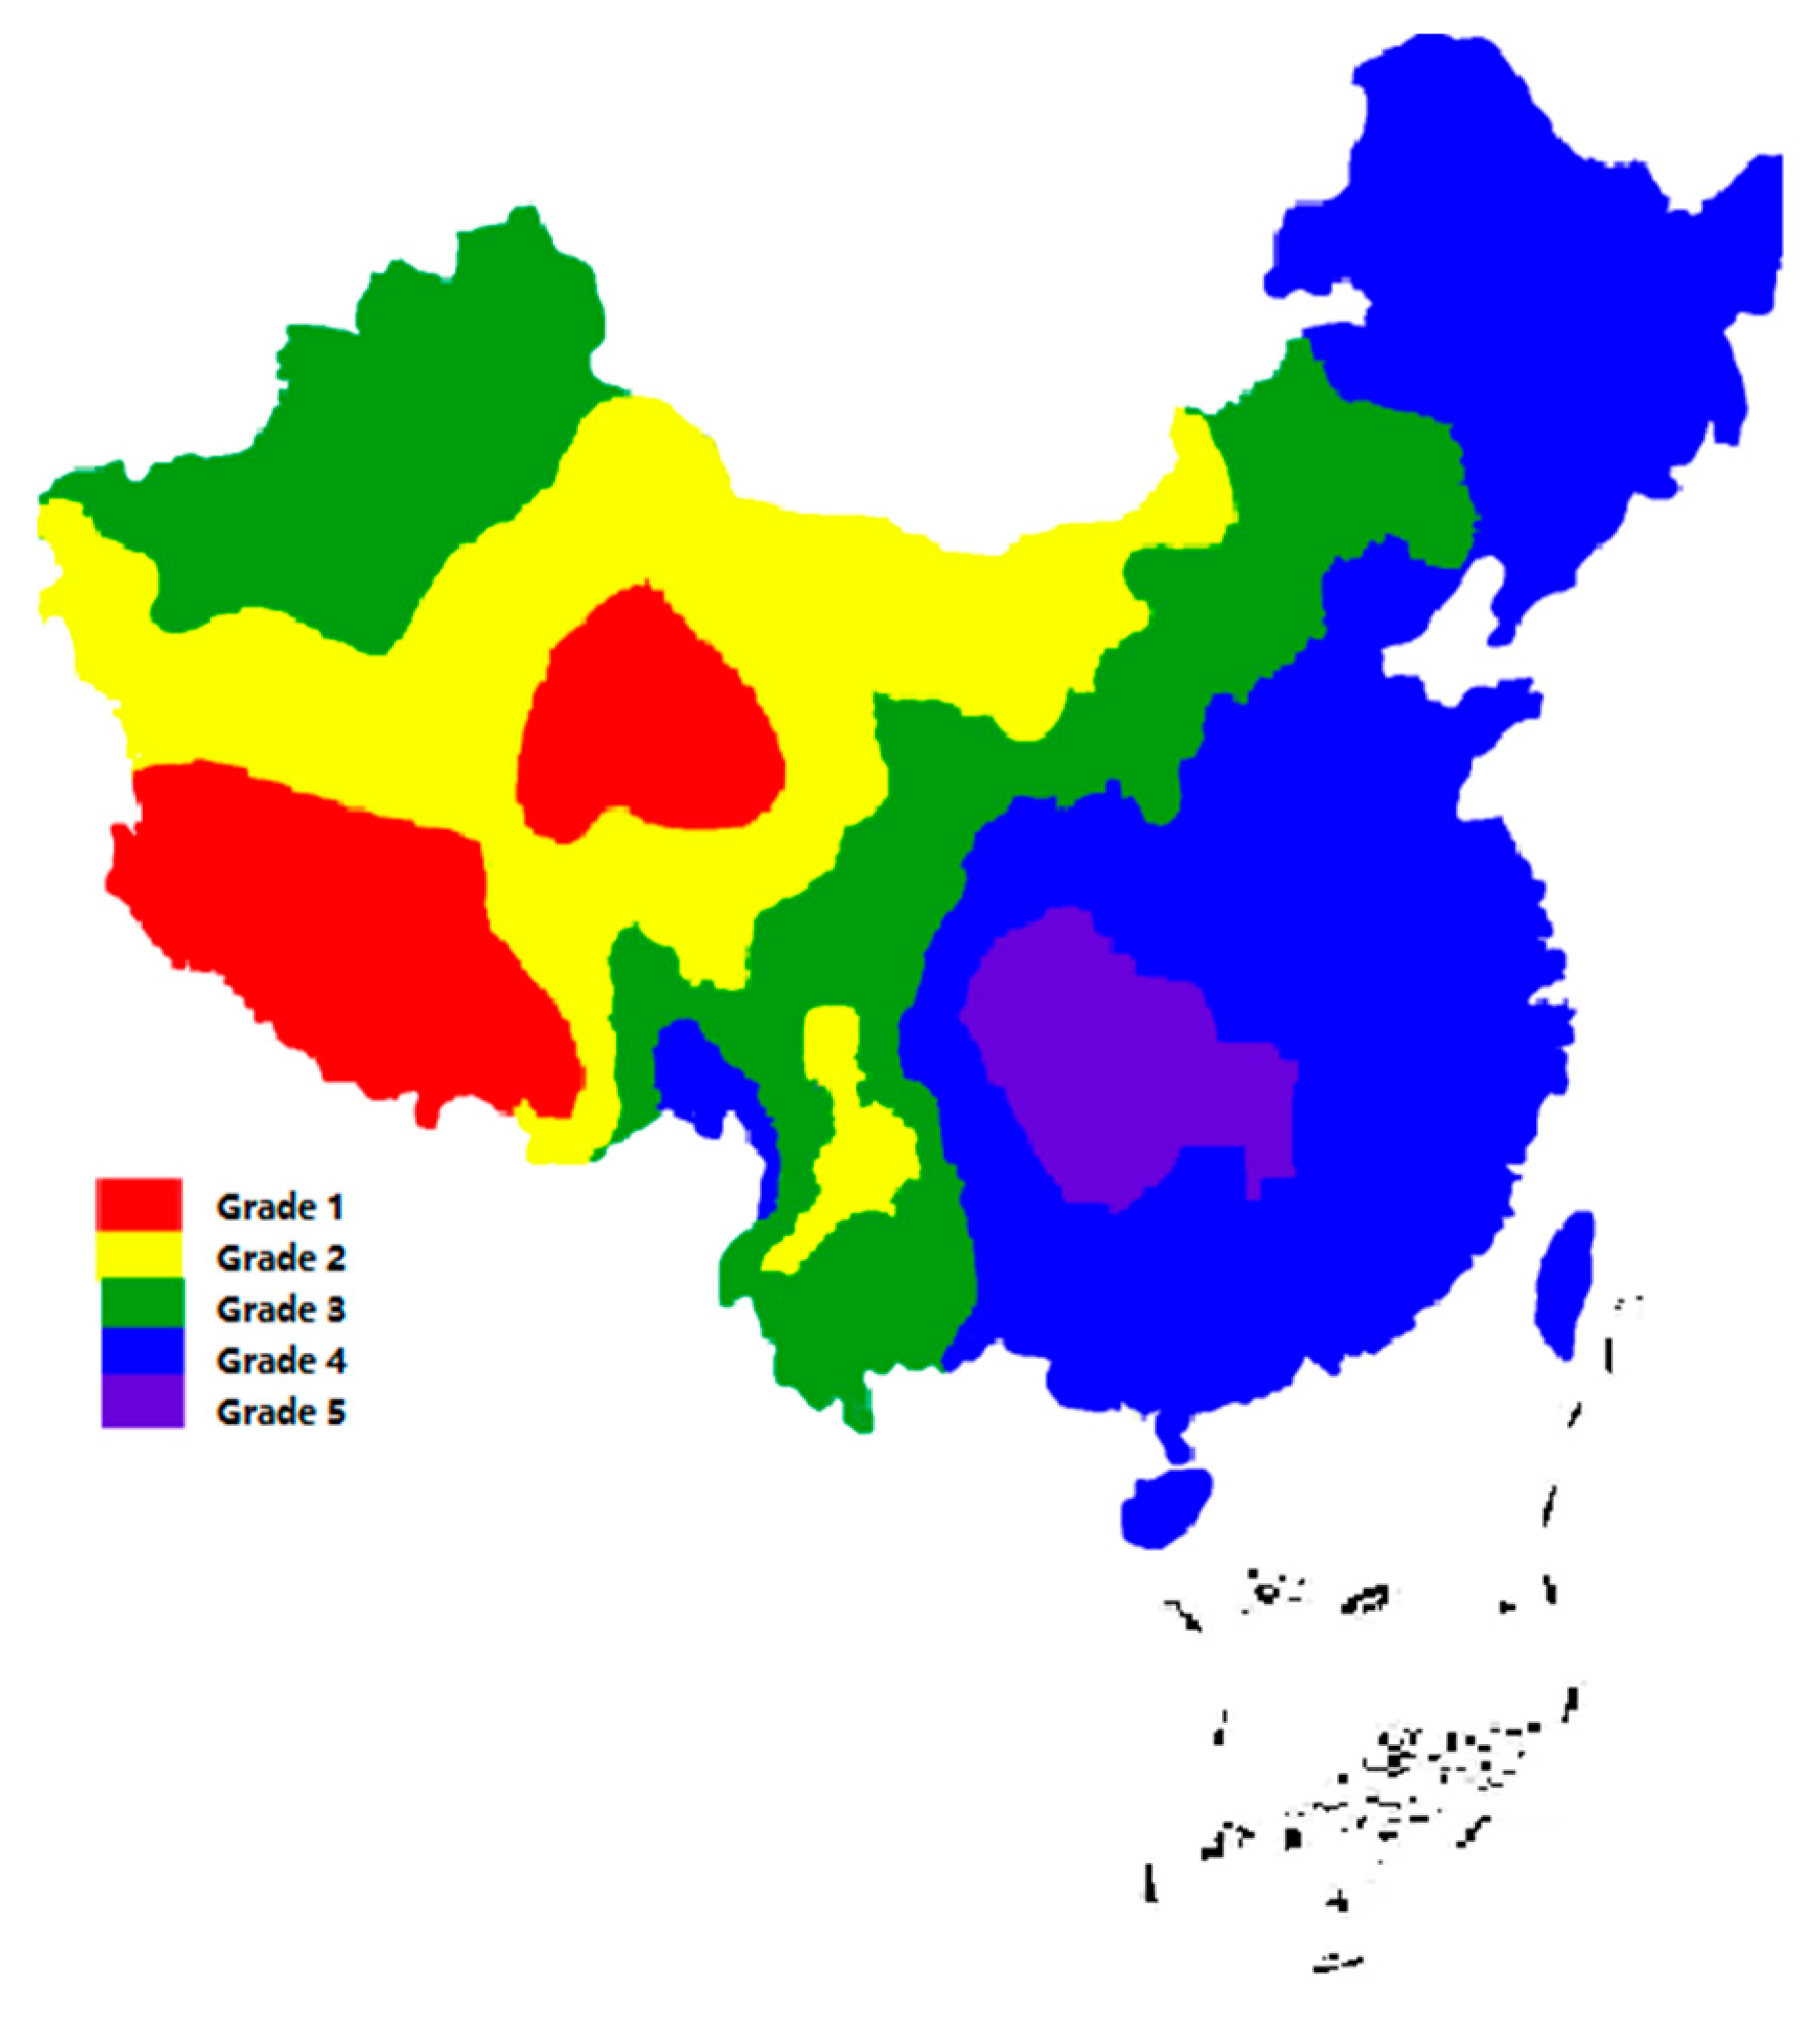
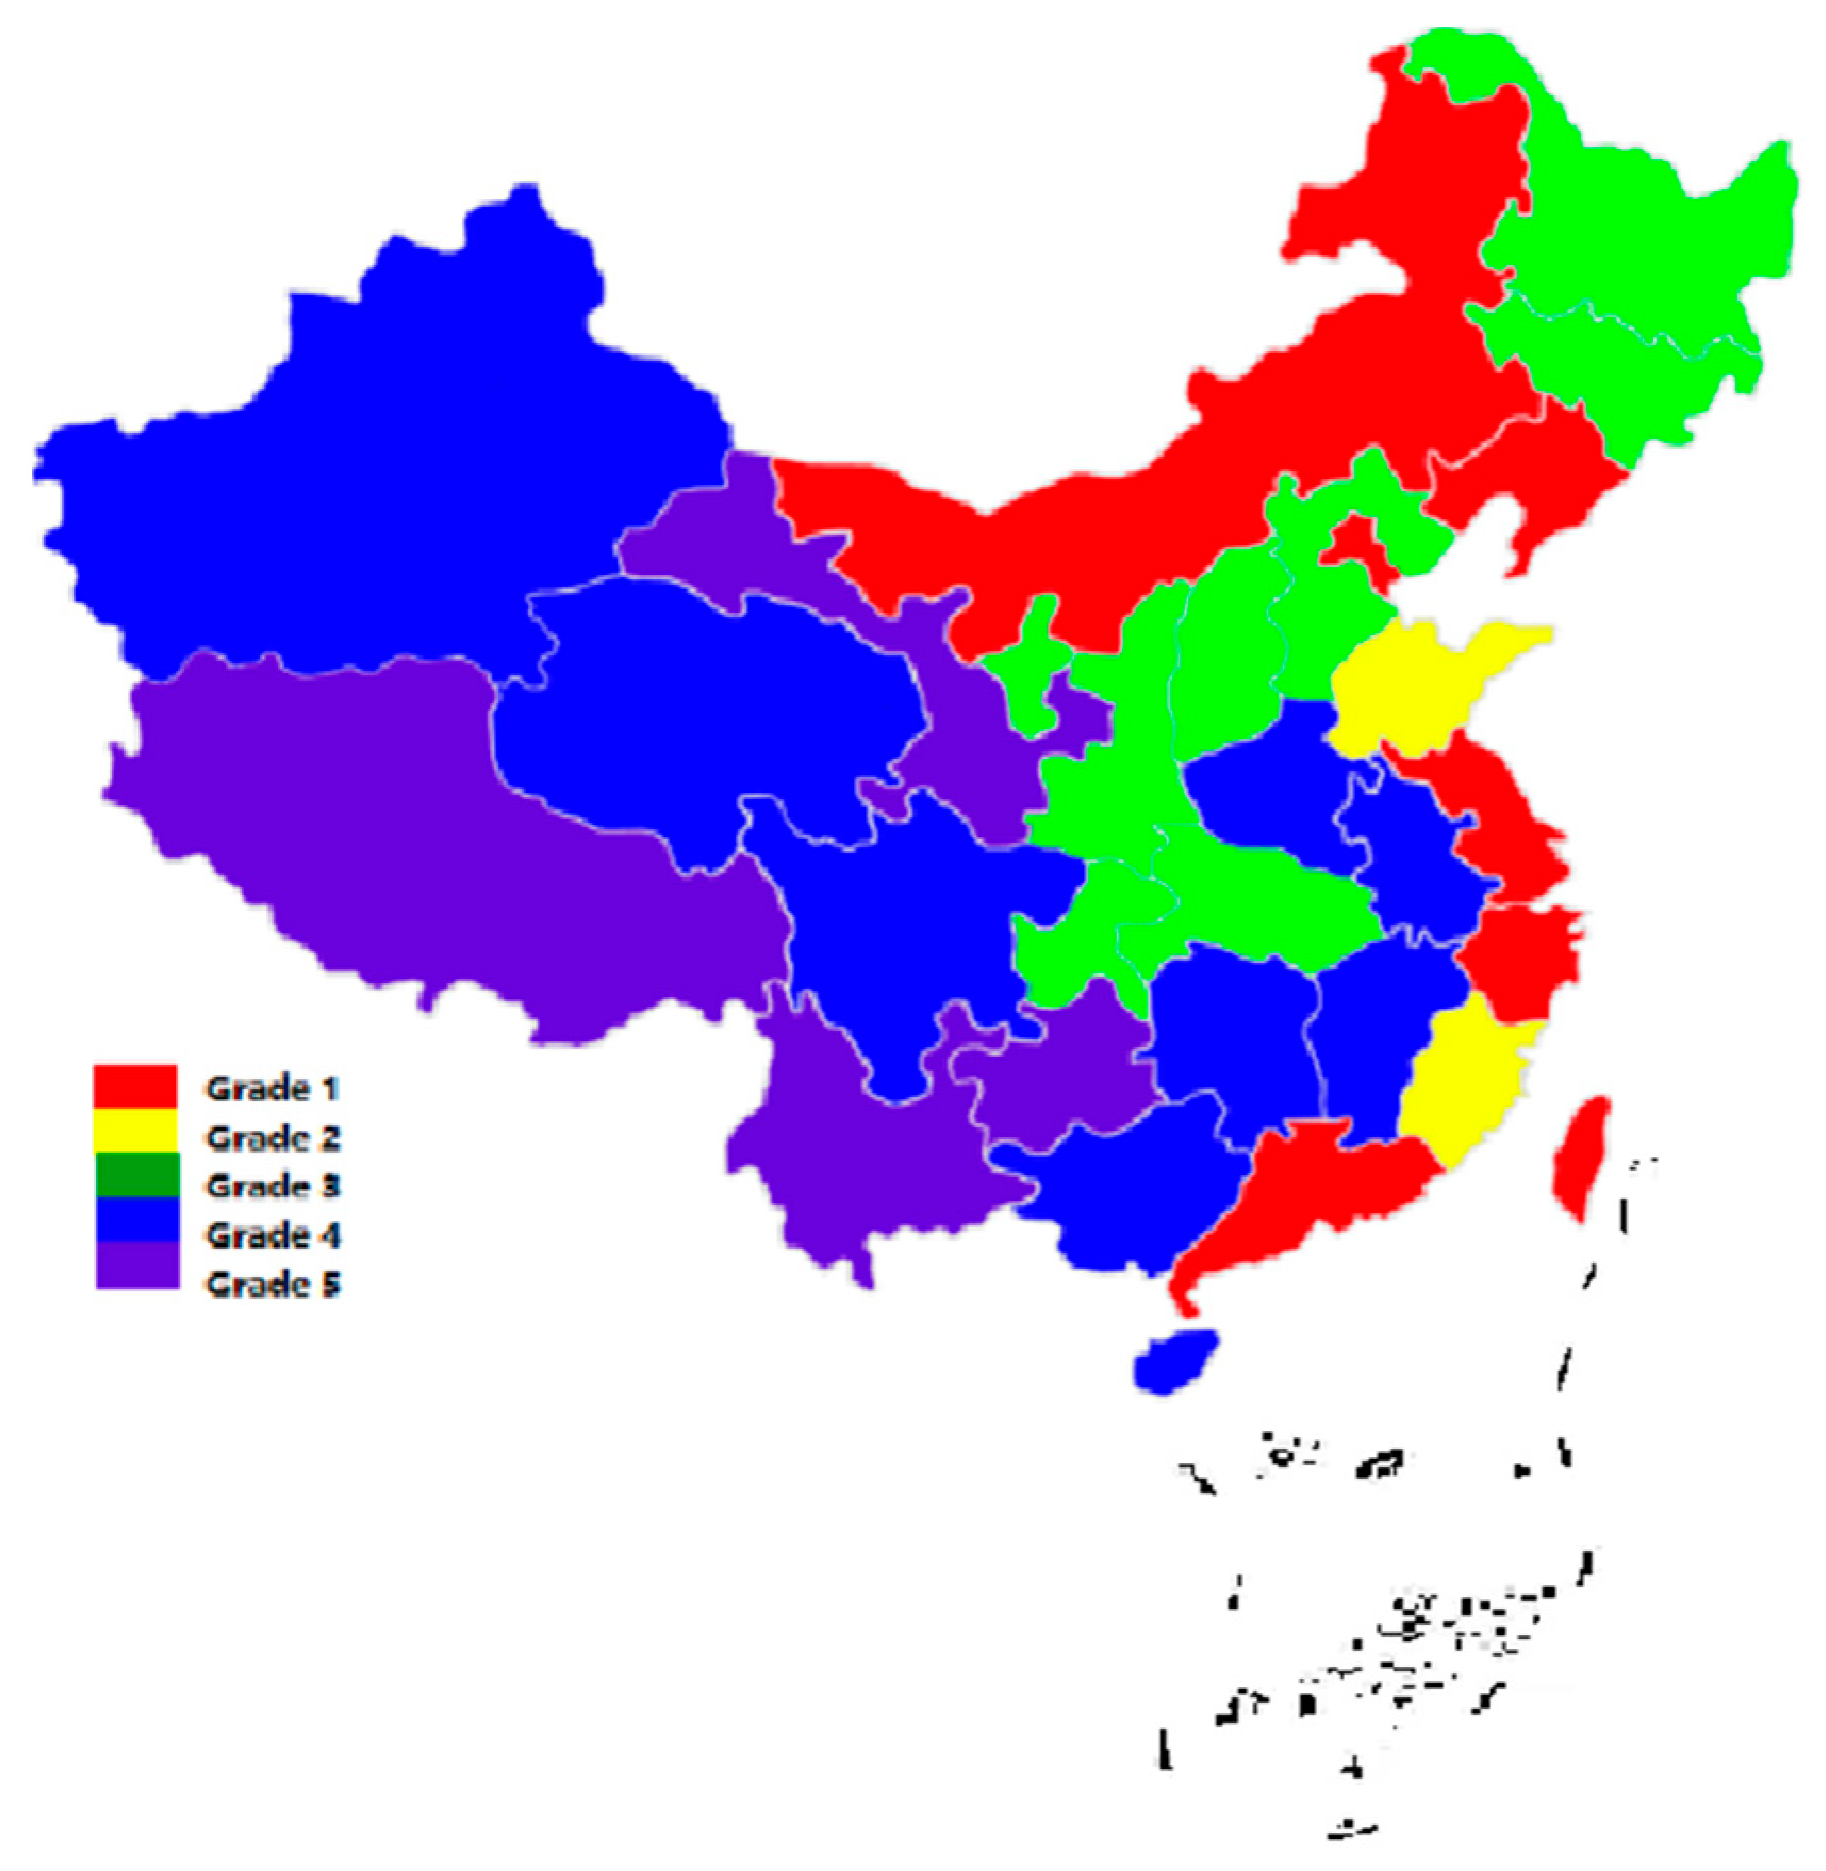
| Type | Annual Duration of Sunshine (h) | Annual Radiation Quantity per m2 (MJ) | GDP per Capita | Climate Zoning Name |
|---|---|---|---|---|
| Grade 1 | 3200–3300 | 6680–8400 | >50,000 | Hot-summer-and-warm-winter zone |
| Grade 2 | 3000–3200 | 5852–6680 | 40,000–50,000 | Temperate zone |
| Grade 3 | 2200–3000 | 5016–5852 | 30,000–40,000 | Hot-summer-and-cold-winter zone |
| Grade 4 | 1400–2200 | 4190–5016 | 20,000–30,000 | Cold zone |
| Grade 5 | 1000–1400 | 3344–4190 | 10,000–20,000 | Frigid zone |
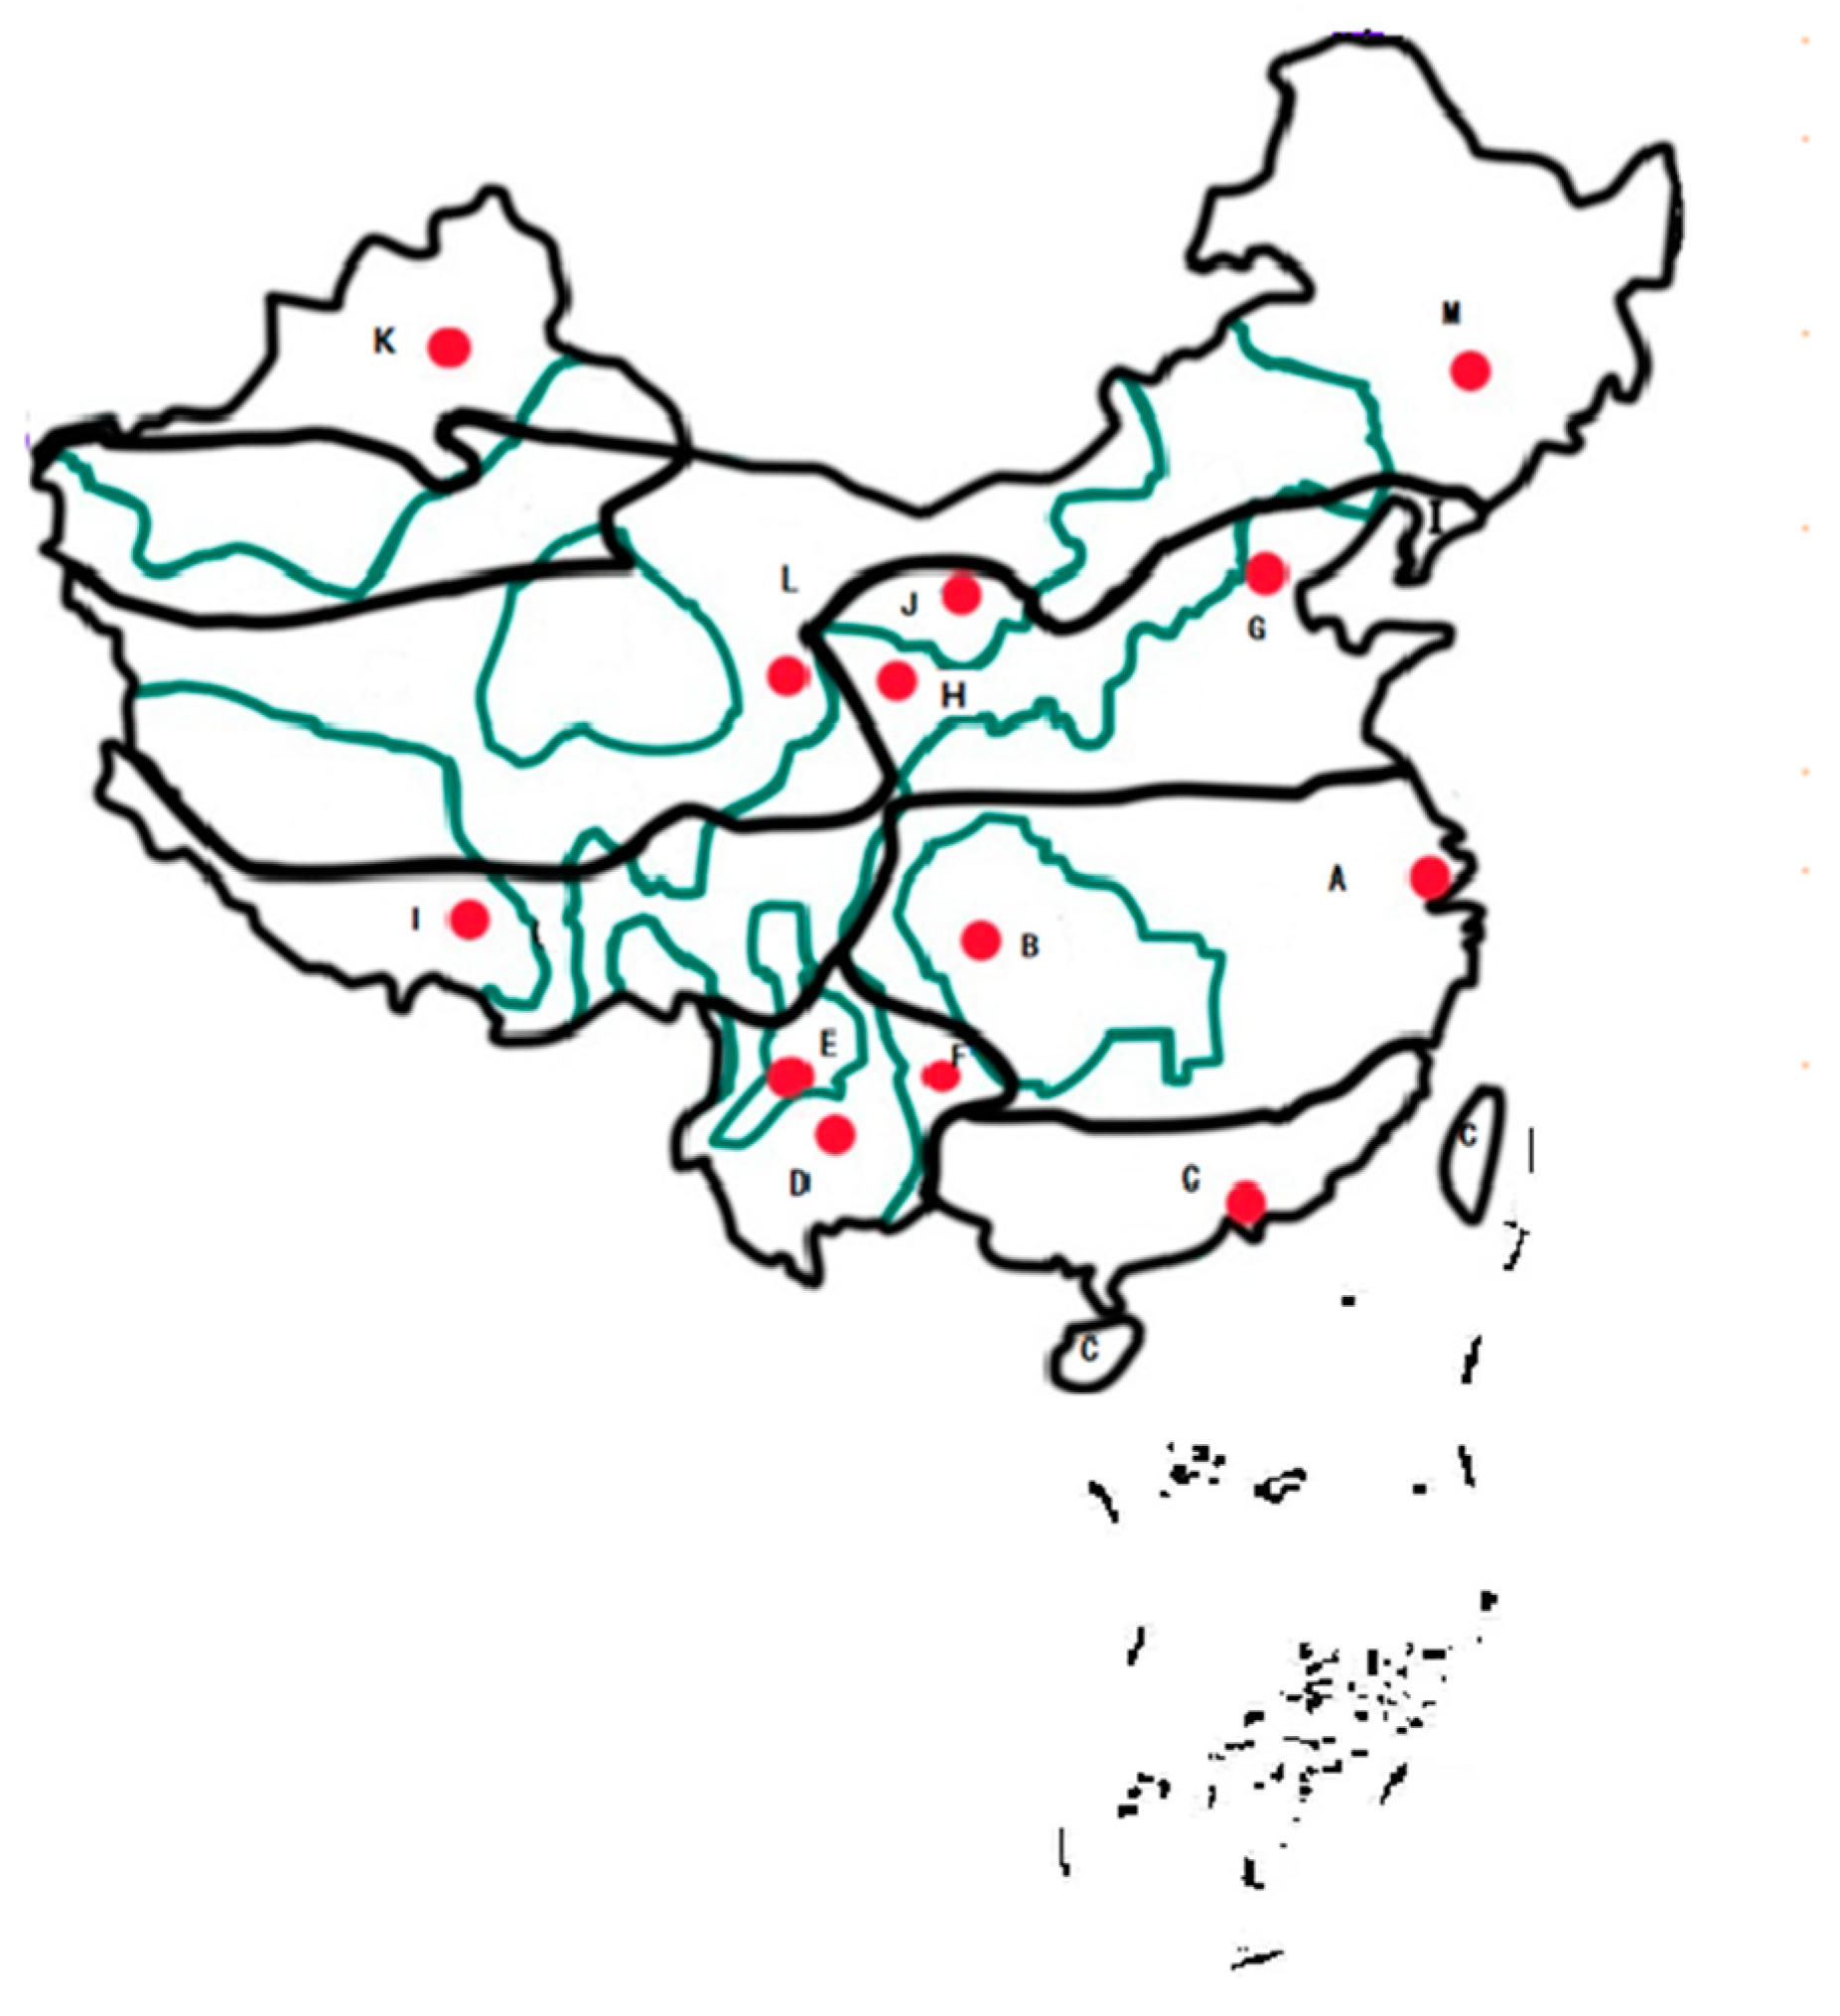
| No. | Zoning | Name of City | Solar Radiation Resources Distribution | Building Climate | Economic Level (Per Capita GDP/RMB) |
|---|---|---|---|---|---|
| 1 | A | Shanghai | IV | Hot-summer-and-cold-winter zone | >50,000 |
| 2 | B | Chongqing | V | Hot-summer-and-cold-winter zone | 30,000–40,000 |
| 3 | C | Guangzhou | IV | Hot-summer-and-warm-winter zone | >50,000 |
| 4 | D | Kunming | III | Temperate zone | 10,000–20,000 |
| 5 | E | Lijiang | II | Temperate zone | 10,000–20,000 |
| 6 | F | Xingyi | IV | Temperate zone | 10,000–20,000 |
| 7 | G | Beijing | IV | Cold zone | >50,000 |
| 8 | H | Lanzhou | III | Cold zone | 10,000–20,000 |
| 9 | I | Lhasa | I | Cold zone | 10,000–20,000 |
| 10 | J | Yinchuan | II | Cold zone | 30,000–40,000 |
| 11 | K | Urumqi | III | Frigid zone | 20,000–30,000 |
| 12 | L | Xining | II | Frigid zone | 20,000–30,000 |
| 13 | M | Changchun | IV | Frigid zone | 30,000–40,000 |
| Category | Residential Buildings | Remarks | Public Buildings | Remarks |
|---|---|---|---|---|
| I | Low rise | 1–3 story | Single-story and multi-story building | Height ≤ 24 m |
| II | Multi-story building/mid-rise/high rise | 4–9 story | High-rise | 24 m ≤ Height ≤ 100 m |
| III | High-rise | 10 and above | Super high-rise | Height > 100 m |
| Building Type | No. | Length–Width Ratio | Ground Floor/Rooftop Area (m2) | Stories | Remarks |
|---|---|---|---|---|---|
| Residential building | 1 | 1:1 | 200 | 2 | Single-family villa |
| 2 | 3:1 | 600 | 6 | Multi-story, one-elevator-two-apartments, 100 m2, 3 units | |
| 3 | 3:1 | 1200 | 12 | High-rise, one-elevator-three-apartments, 100 m2, 4 units | |
| 4 | 4:1 | 1440 | 24 | High-rise, one-elevator-three-apartments, 120 m2, 4 units | |
| Office building | 5 | 1:1 | 1000 | 4 | Multi-story |
| 6 | 1:1 | 2000 | 12 | High-rise | |
| 7 | 1:1 | 2000 | 28 | Super high-rise | |
| 8 | 4:1 | 1000 | 4 | Multi-story | |
| 9 | 4:1 | 2000 | 12 | High-rise | |
| 10 | 4:1 | 2000 | 28 | Super high-rise | |
| Commercial building | 11 | 1:1 | 2000 | 4 | Multi-story |
| 12 | 1:1 | 4000 | 10 | High-rise | |
| 13 | 4:1 | 2000 | 4 | Multi-story | |
| 14 | 4:1 | 4000 | 10 | High-rise | |
| Hotel building | 15 | 1:1 | 400 | 6 | Multi-story |
| 16 | 1:1 | 900 | 18 | High-rise | |
| 17 | 4:1 | 400 | 6 | Multi-story | |
| 18 | 4:1 | 900 | 18 | High-rise |
| Climate Zone of Building | Heat Loss Coefficient of Building Envelope (W/m2K) | |||
|---|---|---|---|---|
| External Walls | Roof | Ground | External Windows | |
| Frigid zone | 0.3 | 0.238 | 0.497 | 1.772 |
| Cold zone | 0.403 | 0.321 | 0.461 | 1.973 |
| Hot-summer-and-cold-winter zone | 0.66 | 0.518 | 0.644 | 2.72 |
| Hot-summer-and-warm-winter zone | 1.051 | 0.853 | 0.721 | 2.72 |
| Temperate zone | 1.19 | 0.712 | 0.699 | 2.72 |
| Frigid zone | 0.3 | 0.238 | 0.497 | 1.772 |
| Types | Lighting Load (W/m2) | Occupant Density (m2/Person) | Activity Intensity (W/Person) | Equipment Load (W/m2) | Fresh Air Volume (m3/p·h) |
|---|---|---|---|---|---|
| Residential building | 7 | 20 | 72 | 7 | 30 |
| Office building | 11 | 20 | 120 | 13 | 30 |
| Commercial building | 19 | 4 | 88 | 13 | 30 |
| Hotel building | 15 | 20 | 72 | 20 | 30 |
| Building Type | Time | 1 | 2 | 3 | 4 | 5 | 6 | 7 | 8 | 9 | 10 | 11 | 12 | |
|---|---|---|---|---|---|---|---|---|---|---|---|---|---|---|
| Office buildings | Workdays in summer | Cold supply | - | - | - | - | - | - | 28 | 26 | 26 | 26 | 26 | 26 |
| Workdays in winter | Heat supply | - | - | - | - | - | - | 18 | 20 | 20 | 20 | 20 | 20 | |
| Holidays | Cold supply | - | - | - | - | - | - | - | - | - | - | - | - | |
| Heat supply | - | - | - | - | - | - | - | - | - | - | - | - | ||
| Commercial buildings | Summer | Cold supply | - | - | - | - | - | - | - | - | 28 | 25 | 25 | 25 |
| Winter | Heat supply | - | - | - | - | - | - | - | - | 16 | 18 | 18 | 18 | |
| Time | 13 | 14 | 15 | 16 | 17 | 18 | 19 | 20 | 21 | 22 | 23 | |||
| Office buildings | Workdays in summer | Cold supply | 26 | 26 | 26 | 26 | 26 | 26 | - | - | - | - | - | |
| Workdays in winter | Heat supply | 20 | 20 | 20 | 20 | 20 | 20 | - | - | - | - | - | ||
| Holidays | Cold supply | - | - | - | - | - | - | - | - | - | - | - | ||
| Heat supply | - | - | - | - | - | - | - | - | - | - | - | |||
| Commercial buildings | Summer | Cold supply | 25 | 25 | 25 | 25 | 25 | 25 | 25 | 25 | 25 | - | - | |
| Winter | Heat supply | 18 | 18 | 18 | 18 | 18 | 18 | 18 | 18 | 18 | ||||
| Roof Utilization Technologies | Investment Cost | Operation and Management Expense | Governmental Subsidy |
|---|---|---|---|
| Solar PV | 3.5–4.0 CNY/W | 0.05 CNY/W | About 0.06 CNY/W |
| Solar thermal | 1250–1400 CNY/m2 (Flat collector) | 1% | Subsidy available in some zones (solar panel, 60–200 yuan/m2) |
| Roof Utilization Technologies | Average Payback Period, Years | Shortest Payback Period, Years | Longest Payback Period, Years |
|---|---|---|---|
| Solar PV | 12 | 5 | 26 |
| Solar thermal | 4.5 | 2 | 14 |
| Zones | Name of City | Solar Thermal | Solar PV |
|---|---|---|---|
| A | Shanghai | 2.45 | 2.0 |
| B | Chongqing | 1.88 | 0.83 |
| C | Guangzhou | 2.29 | 1.79 |
| D | Kunming | 2.64 | 1.76 |
| E | Lijiang | 2.79 | 1.78 |
| F | Xingyi | 2.17 | 0.84 |
| G | Beijing | 2.50 | 1.70 |
| H | Lanzhou | 2.65 | 1.72 |
| I | Lhasa | 3.06 | 2.2 |
| J | Yinchuan | 2.8 | 1.76 |
| K | Urumqi | 2.45 | 1.51 |
| L | Xining | 2.80 | 1.79 |
| M | Changchun | 2.53 | 1.54 |
| Roof Resource Utilization Technologies | Building No. 8 | Building No. 9 | Average |
|---|---|---|---|
| Solar thermal technology | 1.93 | 2.96 | 2.45 |
| Solar PV technology | 1.35 | 2.05 | 1.7 |
| Benefits | Solar Thermal | Solar PV |
|---|---|---|
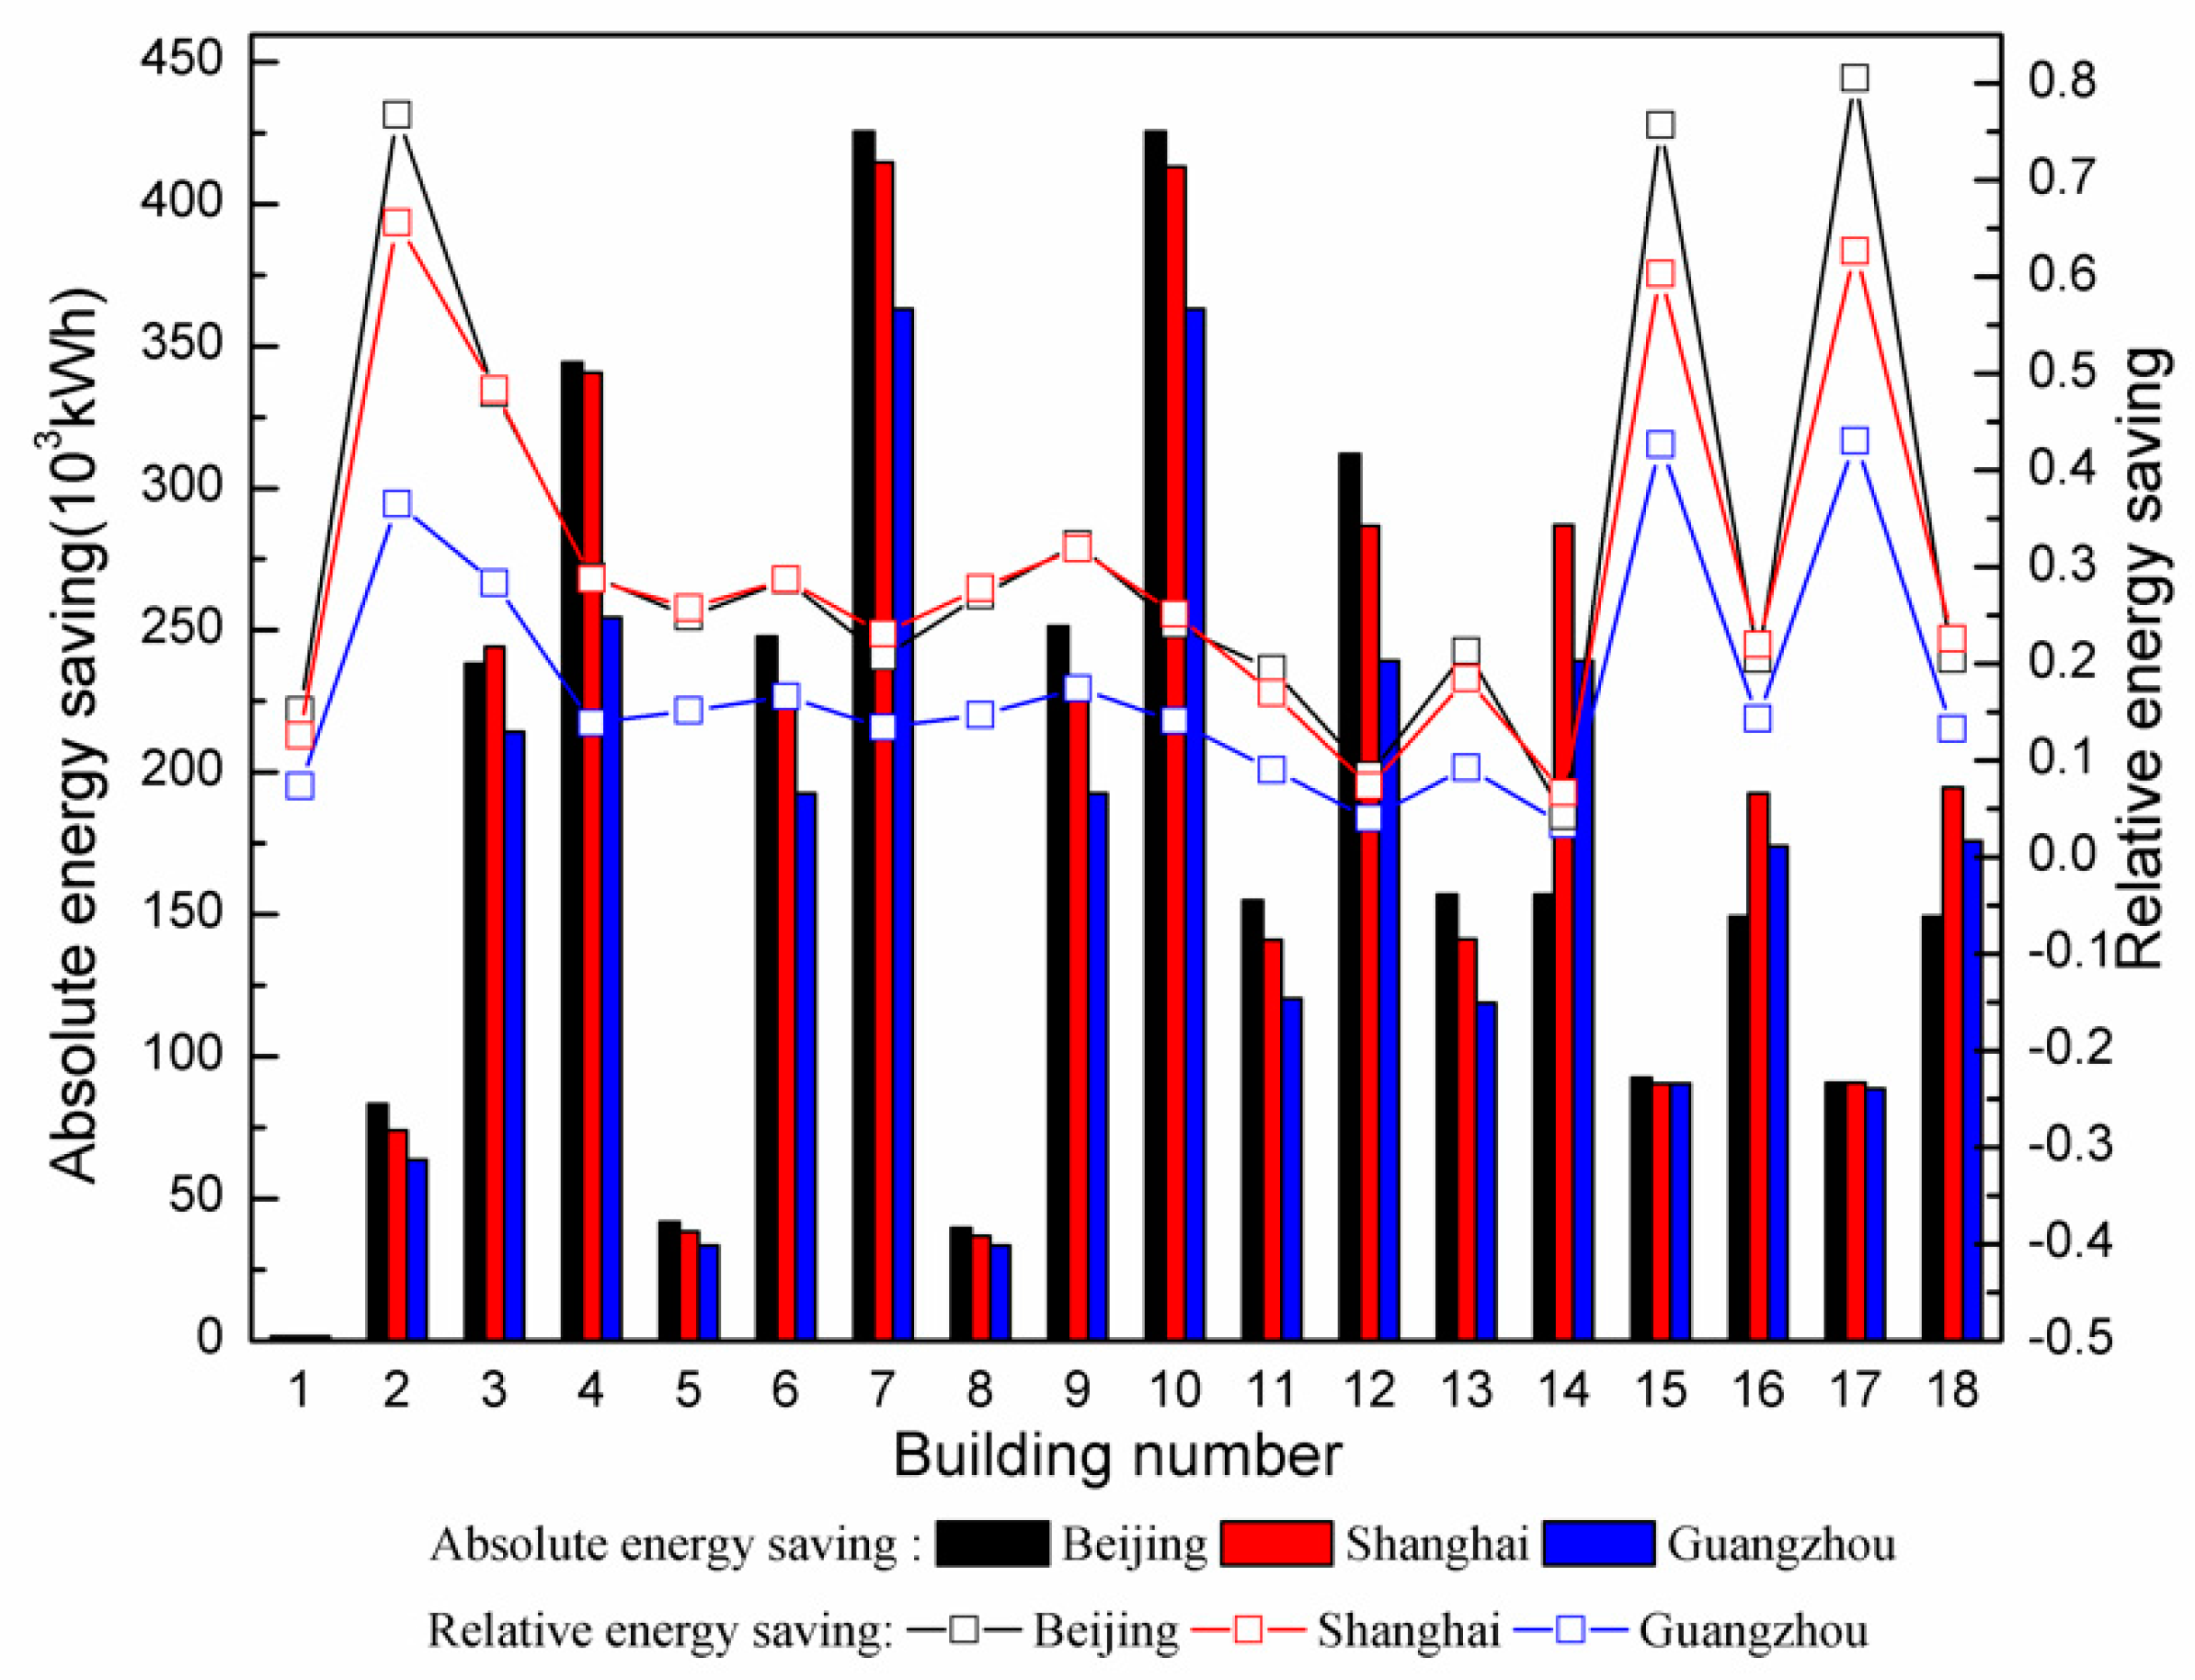
| Absolute amount of energy saving (103 kWh) | 141.30 | 107.69 |
| Relative amount of energy saving (%) | 24.33% | 18.92% |
| Emission reduction (kg) | 120,105 | 91,536.5 |
Publisher’s Note: MDPI stays neutral with regard to jurisdictional claims in published maps and institutional affiliations. |
© 2022 by the authors. Licensee MDPI, Basel, Switzerland. This article is an open access article distributed under the terms and conditions of the Creative Commons Attribution (CC BY) license (https://creativecommons.org/licenses/by/4.0/).
Share and Cite
Li, Q.; Fan, J.; Huang, J. Regional Adaptability Analysis of Solar Roof Utilization Technologies in China. Appl. Sci. 2022, 12, 2792. https://doi.org/10.3390/app12062792
Li Q, Fan J, Huang J. Regional Adaptability Analysis of Solar Roof Utilization Technologies in China. Applied Sciences. 2022; 12(6):2792. https://doi.org/10.3390/app12062792
Chicago/Turabian StyleLi, Qingqing, Jianhua Fan, and Junpeng Huang. 2022. "Regional Adaptability Analysis of Solar Roof Utilization Technologies in China" Applied Sciences 12, no. 6: 2792. https://doi.org/10.3390/app12062792
APA StyleLi, Q., Fan, J., & Huang, J. (2022). Regional Adaptability Analysis of Solar Roof Utilization Technologies in China. Applied Sciences, 12(6), 2792. https://doi.org/10.3390/app12062792