Article

Meta-Analysis of a New Georeferenced Database on Polycyclic Aromatic Hydrocarbons in Western and Central Mediterranean Seafood

1
Department of Cultural Heritage, University of Bologna, Via degli Ariani 1, 48121 Ravenna, Italy
2
Fano Marine Center, The Inter-Institute Center for Research on Marine Biodiversity, Resources and Biotechnologies (FMC), Viale Adriatico 1/N, 61032 Fano, Italy
3
Laboratory of Molecular Anthropology, Department of Biological, Geological and Environmental Sciences, Centre for Genome Biology, University of Bologna, Via Selmi 3, 40126 Bologna, Italy
4
Institute for Biological Resources and Marine Biotechnologies, National Research Council (IRBIM, CNR), Largo Fiera della Pesca 2, 60125 Ancona, Italy
*
Author to whom correspondence should be addressed.
Appl. Sci. 2022, 12(6), 2776; https://doi.org/10.3390/app12062776
Submission received: 17 February 2022 / Revised: 28 February 2022 / Accepted: 3 March 2022 / Published: 8 March 2022
(This article belongs to the Special Issue Transport, Persistence and Toxicity of Pollutants in the Sea)

Abstract

:

Featured Application

The database featured in the present work aims to support researchers and decisionmakers in planning future investigations and in evaluating current knowledge on polycyclic aromatic hydrocarbons when it comes to fixing the limits to PAH levels in fishery products.

Abstract

The aim of this work was to collect and harmonize the results of several studies achieved over the years, in order to obtain a database of georeferenced observations on polycyclic aromatic hydrocarbons (PAHs) in Western and Central Mediterranean seafood. For each observation, some information on the taxonomy and the ecology of the sampled species are reported, as well as details on the investigated hydrocarbon, and spatial and temporal information on sampling. Moreover, two health risk indexes were calculated for each record and included in the database. Through several statistical methods, we conducted a meta-analysis of the data on some of the species in this database, identifying trends that could be related to the biology of the investigated organisms, as well as to the physico-chemical properties of each hydrocarbon and to the oceanographic characteristic of this part of the Mediterranean. The analysis of the data showed that, at a consumption rate like the one typical of the Italian population, seafood caught from the area considered in the present work seems to pose a minimal risk to health. However, we also found evidence of an increasing trend of PAH concentrations in Mediterranean mussels, pointing to the need for constant monitoring.

1. Introduction

Polycyclic aromatic hydrocarbons (PAHs) are a large group of toxic [1,2] organic compounds, made up of a variable number of fused aromatic rings of carbon and hydrogen [3,4].
Depending on their origin, PAHs can be classified as petrogenic and pyrolytic (or pyrogenic). Pyrolytic PAHs result from the incomplete combustion of organic matter, such as the combustion of wood, oil, vehicular and industrial emissions and forest fires; petrogenic PAHs, instead, derive from fossil fuels, and can occur as a result of oil spills and petroleum production [5,6].
As regards chemical structure, low molecular weight (LMW) PAHs comprise two to three aromatic rings, while PAHs comprising four aromatic rings are defined as middle molecular weight (MMW) PAHs, and those made of five or more rings are referred to as high molecular weight (HMW) PAHs [3]. In the marine environment, MMW- and HMW PAHs are mostly pyrolytic in their origin, while LMW PAHs are from petrogenic sources [7,8].
From a chemical point of view, LMW- and HMW PAHs behave differently, with MMW PAHs showing intermediate behavior. In particular, HMW PAHs are much less insoluble in water, and so they tend to bind organic particulate matter, being less bioavailable for their uptake from the water. Despite this, they can still be absorbed by aquatic organisms from sediments and particulate matter present in the water column [3,9].
For non-smokers, the major source of exposure to PAHs is diet; seafood, along with cereals, is a major contributor to the dietary intake of these compounds in Europe [10]. In 2011, the EU set the maximum allowable levels of benzo(a)pyrene (BaP) and of the sum of four HMW PAHs (PAH4; i.e., benzo(a)anthracene BaA, chrysene Chr, benzo(b)fluoranthene BbF, and BaP) in several fishery products (Table 1) [11].
Several factors could affect PAHs concentrations in seafood. As already mentioned, physico-chemical properties of PAHs influence their bioavailability, HMW PAHs being less available for uptake from the water, compared to LMW and MMW PAHs. Moreover, in fish, HMW PAHs are readily excreted, thanks to their fast metabolism, whose rate is higher compared to that of lighter PAHs [9,12]. PAHs levels in seafood also depend on the nutritional condition of the organism [13] and on the season [14], likely as an effect of changes in the pollutant environmental inputs [12], seasonal variation of the pollutant elimination rate [15], hydrodynamic processes [16], and/or because of factors pertaining to the reproductive cycle of the species [17]. Even the age of the fish is related to PAH accumulation, with earlier stages of life being more prone to accumulating higher amounts of contaminants because of the immaturity of detoxification pathways [15]. Finally, the level of PAHs varies with the species taken into account, and this is also because of differences in the PAH-metabolizing capability [18]. Most notably, filter feeding organisms show the slowest PAHs elimination rates [14]. Accordingly, metabolic efficiency is greater in fish, intermediate in crustaceans and lowest in mollusks [19].
Over the years, several studies have investigated the levels of PAHs in seafood caught in the Adriatic [12,20,21,22,23,24,25,26,27,28,29,30,31,32,33,34,35], Ionian [9,20,34,36,37,38,39], and Tyrrhenian Seas [7,14,16,17,19,30,40,41,42,43,44,45,46,47,48,49,50], with the aims of monitoring the environmental status of particularly impacted areas [39,48], improving the knowledge of factors influencing PAHs levels in marine species [12,35], and, ultimately, informing decisionmakers when it comes to fixing the limits to PAH levels in fishery products [9].
The aim of this work was to collect and harmonize the results of those studies, in order to obtain a database of georeferenced observations on PAHs in seafood caught in the Western and Central Mediterranean Sea. For each observation, information on the taxonomy and the ecology of the investigated species are reported, as well as any details on the hydrocarbon, temporal and spatial information on sampling. Additionally, two health risk indexes were calculated for each record and included in the database. Finally, we conducted a meta-analysis of the data on Mediterranean mussel, Manila clam, red mullet and common sole, identifying trends that could be related to the biology of the investigated organisms, as well as to the physico-chemical properties of each hydrocarbon and to the water circulation in this part of the Mediterranean.

2. Materials and Methods

The literature search was carried out using Scopus and PubMed, aiming for the retrieval of publications reporting PAHs levels in seafood, i.e., in marine species included in D.M. 19105, 22 September 2017, Annex 1, which details commercially relevant fish species in Italy, or having “commercial”, “minor commercial”, “subsistence fisheries”, or “of potential interest” in the “Human uses” section on FishBase (https://www.fishbase.se/search.php, accessed on 15 January 2022), or whose specimens were recovered from the fish market. Moreover, publications had to report PAH concentrations measured in marine species caught in the Adriatic (FAO geographical subareas 17 and 18), Ionian (FAO geographical subareas 13–16, 19–21) or Tyrrhenian Seas (FAO geographical subareas 8–10, 11.2, 12).
From each publication, we extrapolated several data, including the sample location and date, species and biological tissue investigated, sample length (cm) and weight (g), sample size, and PAH concentrations detected (mg/kg) (Table S1 for the full list and description of variables included in the database). Moreover, the database comprises a column specifying whether the record comes from wild, farmed or transplanted animals.
Each record was georeferenced, providing latitude and longitude in decimal degrees of the sampling location. Following [51], a geographic precision code was assigned to each record (Table S2), based on whether the study provided the exact coordinates or a more or less precise description of the sample location, from which geographical coordinates were inferred.
The trophic level of each species was obtained from online resources (Table S3) and included in the database.
Abbreviations for the biological tissue where PAHs concentration was measured, as well as for each PAH and molecular weight class (i.e., LMW, MMW or HMW PAHs), are reported in the Supplementary Materials (Tables S4–S6, respectively).
A column specifying if the reported PAH concentration is expressed in fresh (FW), wet (WW) or dry weight (DW) was added to the database (Table S7). Moreover, whenever a study provided concentration in DW, we converted that measure in WW, reporting both the original and the inferred value in separate columns. In the analyses, FW measurements were considered WW. For statistical analyses, when the measured concentration was below the limit of quantification (LOQ) or limit of detection (LOD), and the authors specified those limits, we assigned to that record a value equal to half the LOQ or LOD.
For conversion from DW to WW, we used the following formula:
C (mg/kg w.w.) = ((100 − % of water) ÷ 100) × C (mg/kg d.w.)
where C is the PAH concentration, and % of water is the percentage of water in the analyzed tissue. The percentage of water in Mediterranean mussel (Mytilus galloprovincialis) and Manila clam (Ruditapes philippinarum) was assumed to be equal to 85%, based on personal data not shown. The percentage of water in common sole (Solea solea) liver, gills and muscle was assumed to be equal to 72.75%, 70% and 74.4%, respectively, based on [33]. Finally, the percentage of water in red mullet (Mullus barbatus) fillet was assumed to be equal to 80%, following [51].
Two health risk indexes (Table S8), excess lifetime cancer risk (ELCR) and target hazard quotient (THQ), were calculated for each record and included in the database. Specifically, ELCR was calculated according to the following equation:
ELCR = EF (day/yr) × ED (yr) × IR (kg/day) × CSF (mg kg−1 day) ÷ BW (kg) × AT
where EF is the exposure frequency (365 days/year); ED is the exposure duration, which was assumed to be equal to the Italian mean life expectancy (83,226 yr) (ISTAT, 2019); IR is the ingestion rate, which is equal to the PAH concentration times the mean ingestion rate of the species (FAOSTAT, 2018); CSF is the cancer slope factor for each of the analyzed PAH (OEHHA, 2009); BW is the body weight, which was assumed to be equal to the mean body weight of the Italian population (67 Kg) (ANSA, 2013); and AT is the averaging time, which is equal to EF×ED. An ELCR above 10−5, which is the acceptable lifetime risk (ALR) [52], indicates a probability greater than 1 chance over 100,000 of developing cancer [46].
THQ, which indicates the ratio between exposure and the reference dose, was calculated according to the following equation:
THQ = EF (day/yr) × ED (yr) × IR (kg/day) × C (mg/kg) ÷ RFD (mg kg−1 day) × BW (kg) × AT
where C is the PAH concentration, and RFD the oral reference dose for PAH. When THQ risk is above 1, it means that THQ is higher than the reference dose, and systemic effects may occur [46].
Graphs and statistics were produced using RStudio version3.6.1. All the analyses were carried out after grouping records according to PAHs molecular weight, i.e., analyses were conducted separately on LMW, MMW and HMW PAHs in each selected species.
After checking the assumption of normality of residual distributions through the Shapiro–Wilk test (R function: shapiro_test), we used the Wilcoxon rank sum test (R function: wilcox.test) with data on Mediterranean mussel, Manila clam, red mullet and common sole to calculate the statistical significance of differences between the mean concentrations of LMW, MMW and HMW PAHs in those species.
To look for seasonal trends, we used the Wilcoxon rank sum test to calculate the statistical significance of differences between the mean concentrations of each class of PAHs in cold (October–March) and warm (April–September) months. Additionally, to control for potential confounding factors, we repeated the above analysis using non-parametric ANCOVA (R function: ancova.np), with a sampling depth and sampling year as covariates. In the present work, we used the same month clustering as in [12,53], which is based on sea water temperature: January–March (winter), April–June (spring), July–September (summer) and October–December (autumn).
Finally, to see if there is a relationship between the latitude, sampling depth and sampling year and the PAH concentrations in Mediterranean mussel caught along the Italian coast of the Adriatic and the Tyrrhenian Seas, we used Kendall’s rank correlation (R function: pcor; method = “kendall”).

3. Results

3.1. Database Description

Of the 10,704 records included in the database, 5790 were extracted from a database on contaminants in Mediterranean biota available at https://www.emodnet-chemistry.eu/data (accessed on 1 December 2021), while the other 4914 are from 38 scientific publications in peer-reviewed journals. The database was compiled along the lines of the work of Cinnirella and colleagues (https://doi.org/10.1594/PANGAEA.899723) on mercury concentration in Mediterranean biota [51].
The geographical distribution of sampling sites is shown in Figure 1.
In total, 1025 records are from the Ionian Sea, 4469 from the Adriatic Sea, and 5210 from the Tyrrhenian Sea (Figure 2).
Mediterranean mussel (Mytilus galloprovincialis, code: Mytgal) is the most studied species, with 7710 records from 22 sources, followed by Manila clam (Ruditapes philippinarum, code: Rudphi), with 982 records from two sources, and common sole (Solea solea, code: Solsol), with 344 records from four sources. All the other species are present in this database with fewer than 250 observations (Figure 3).
Year of publication goes from 1990 to 2021, while sampling year goes from 1981 to 2019.

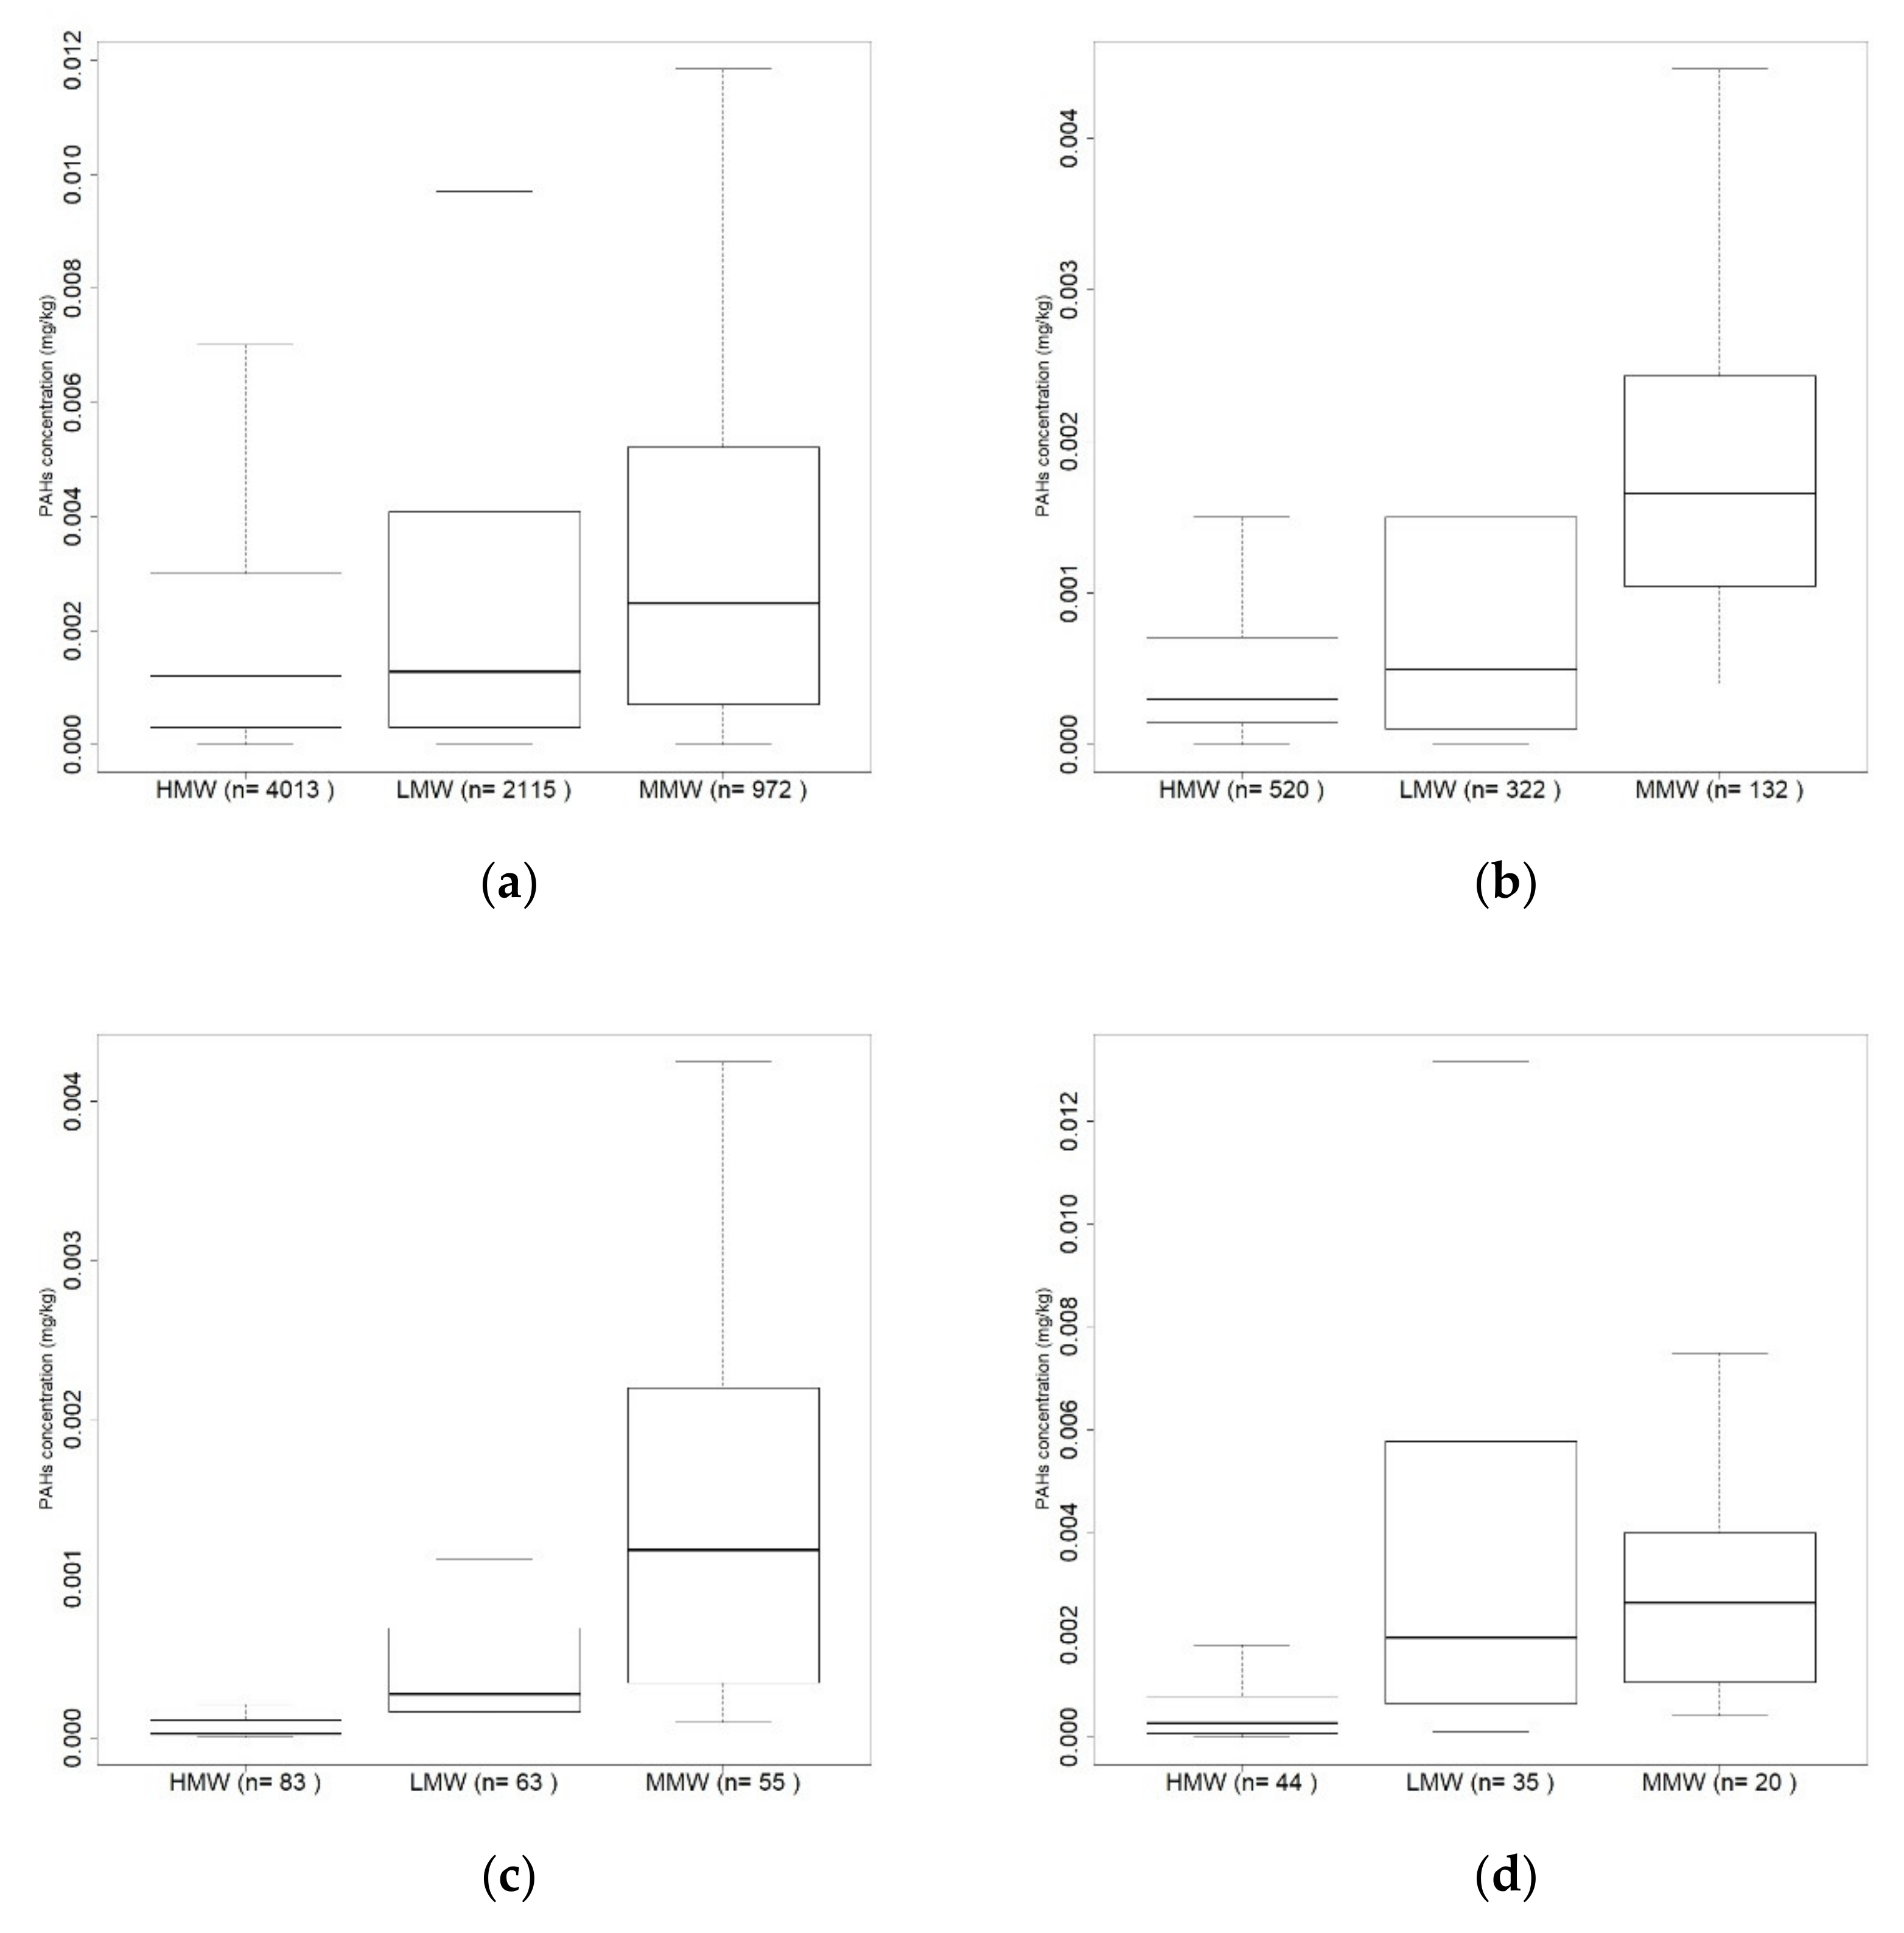
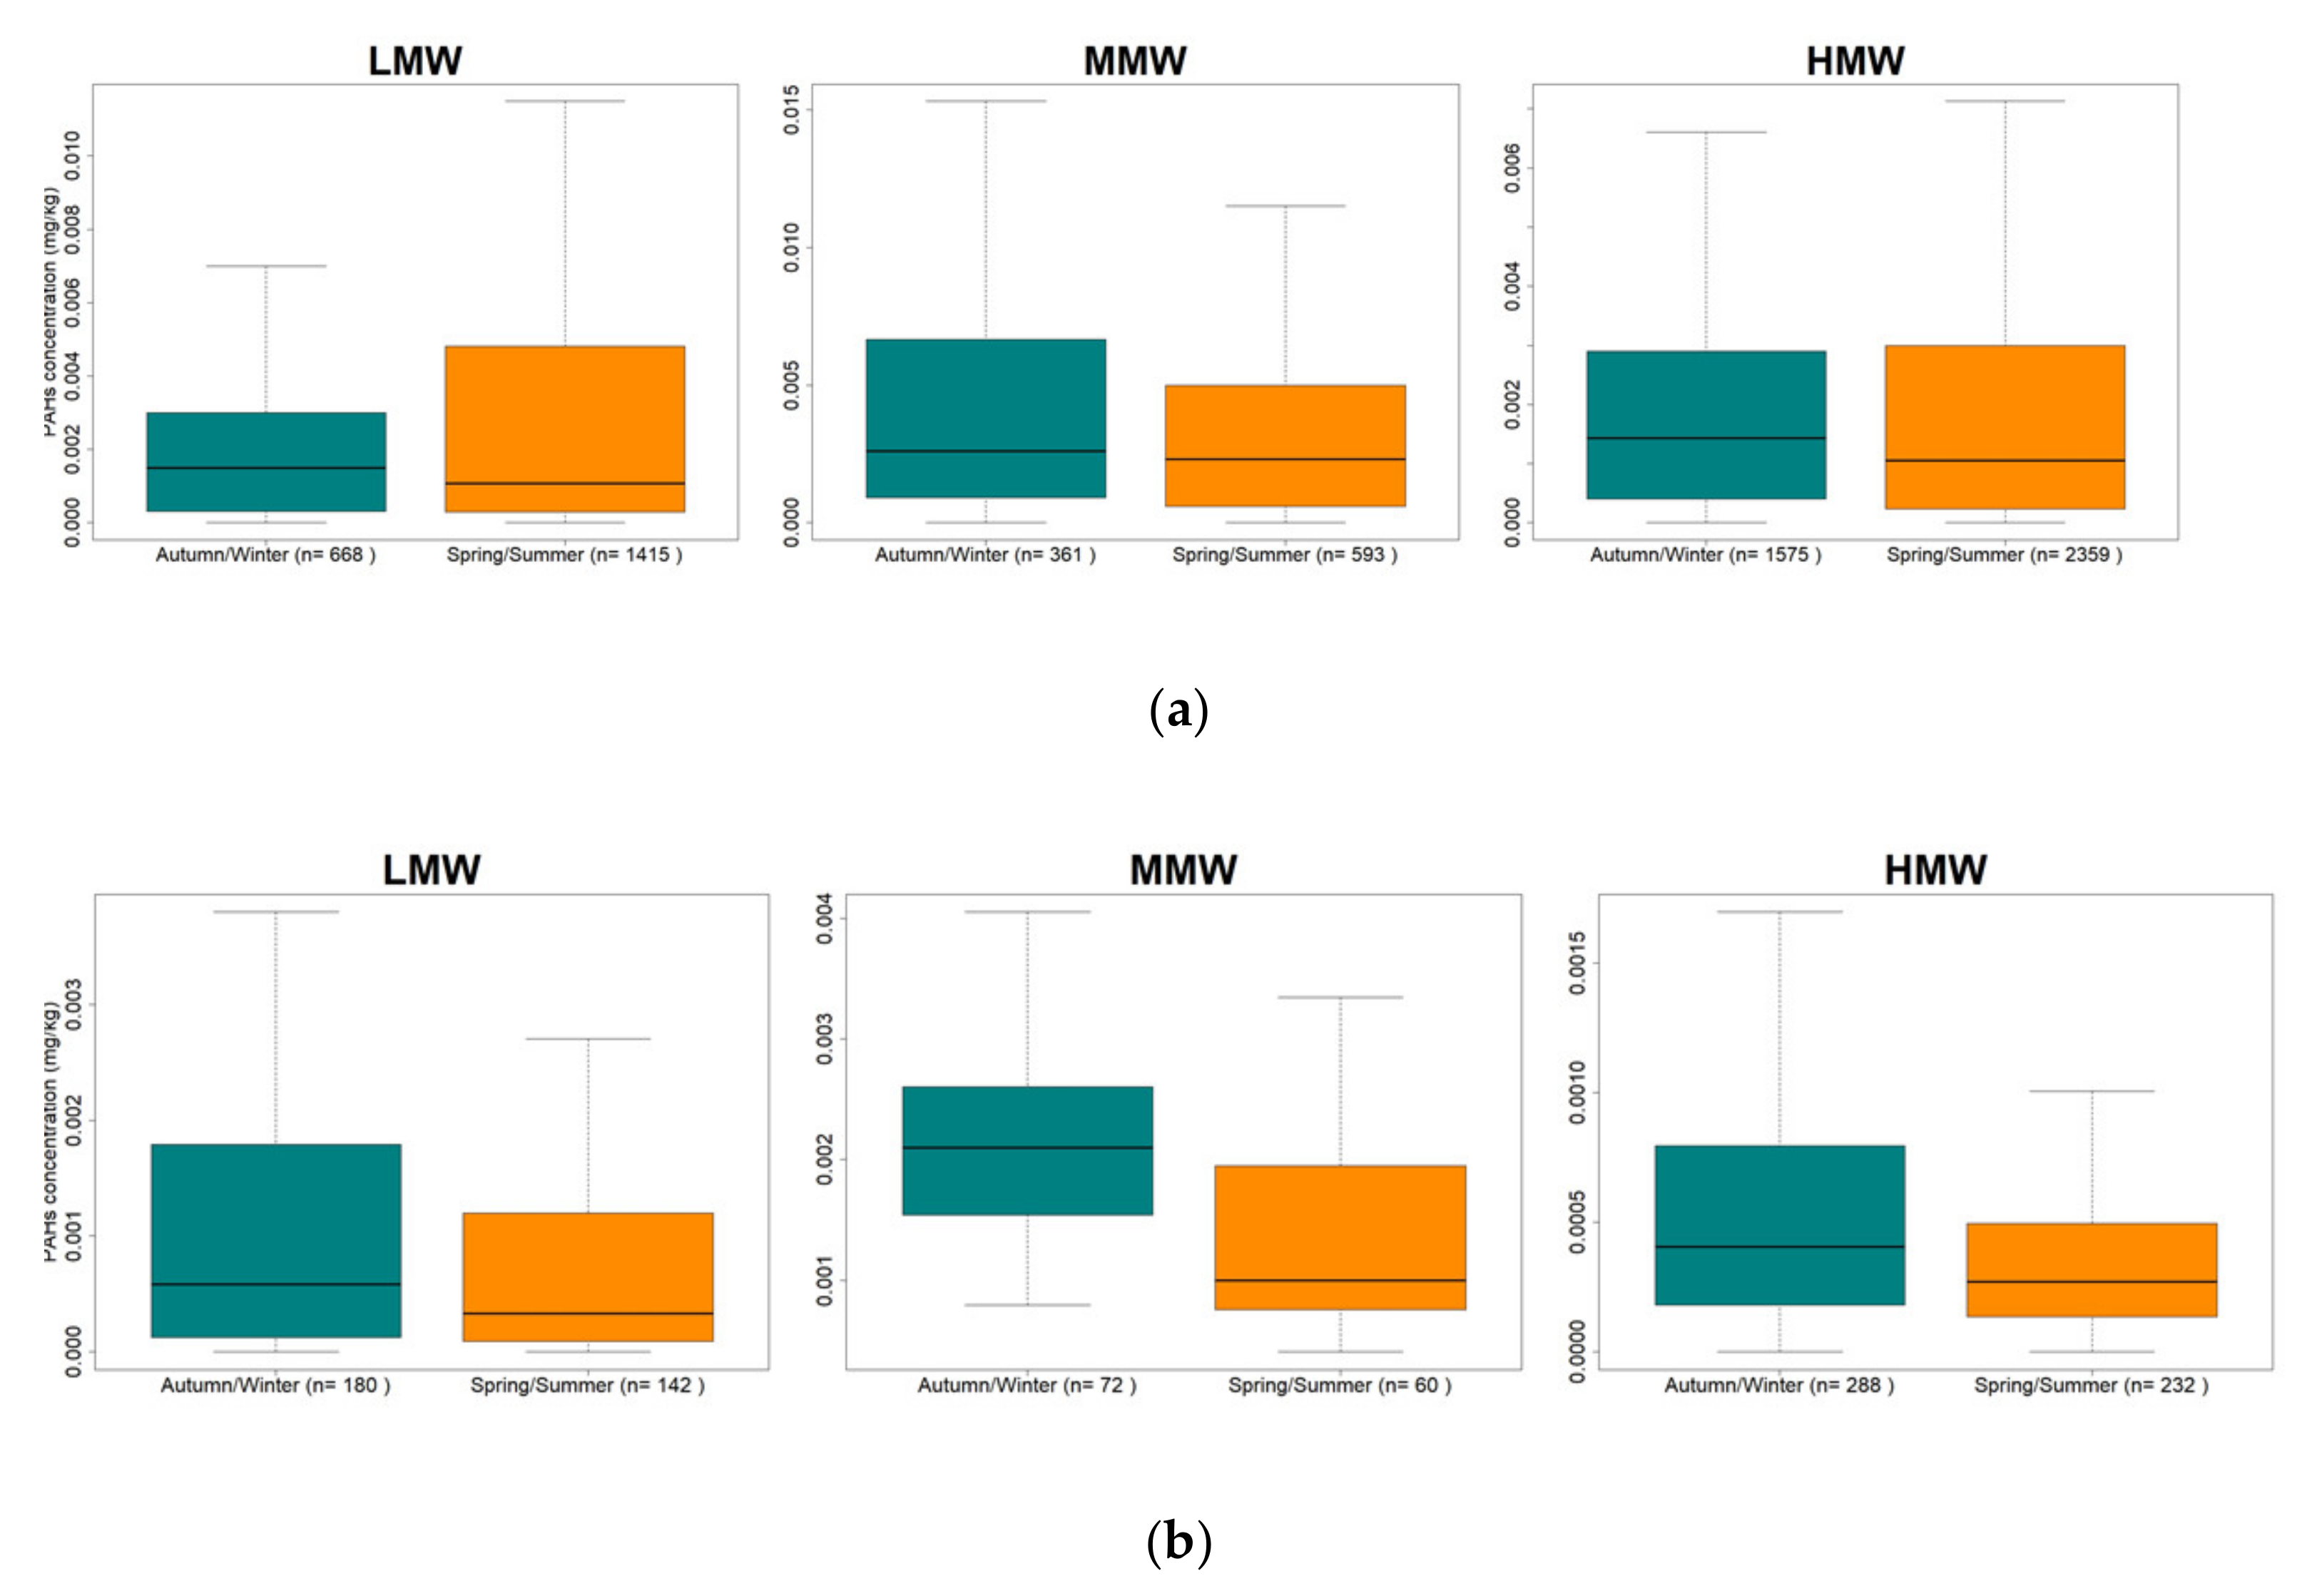
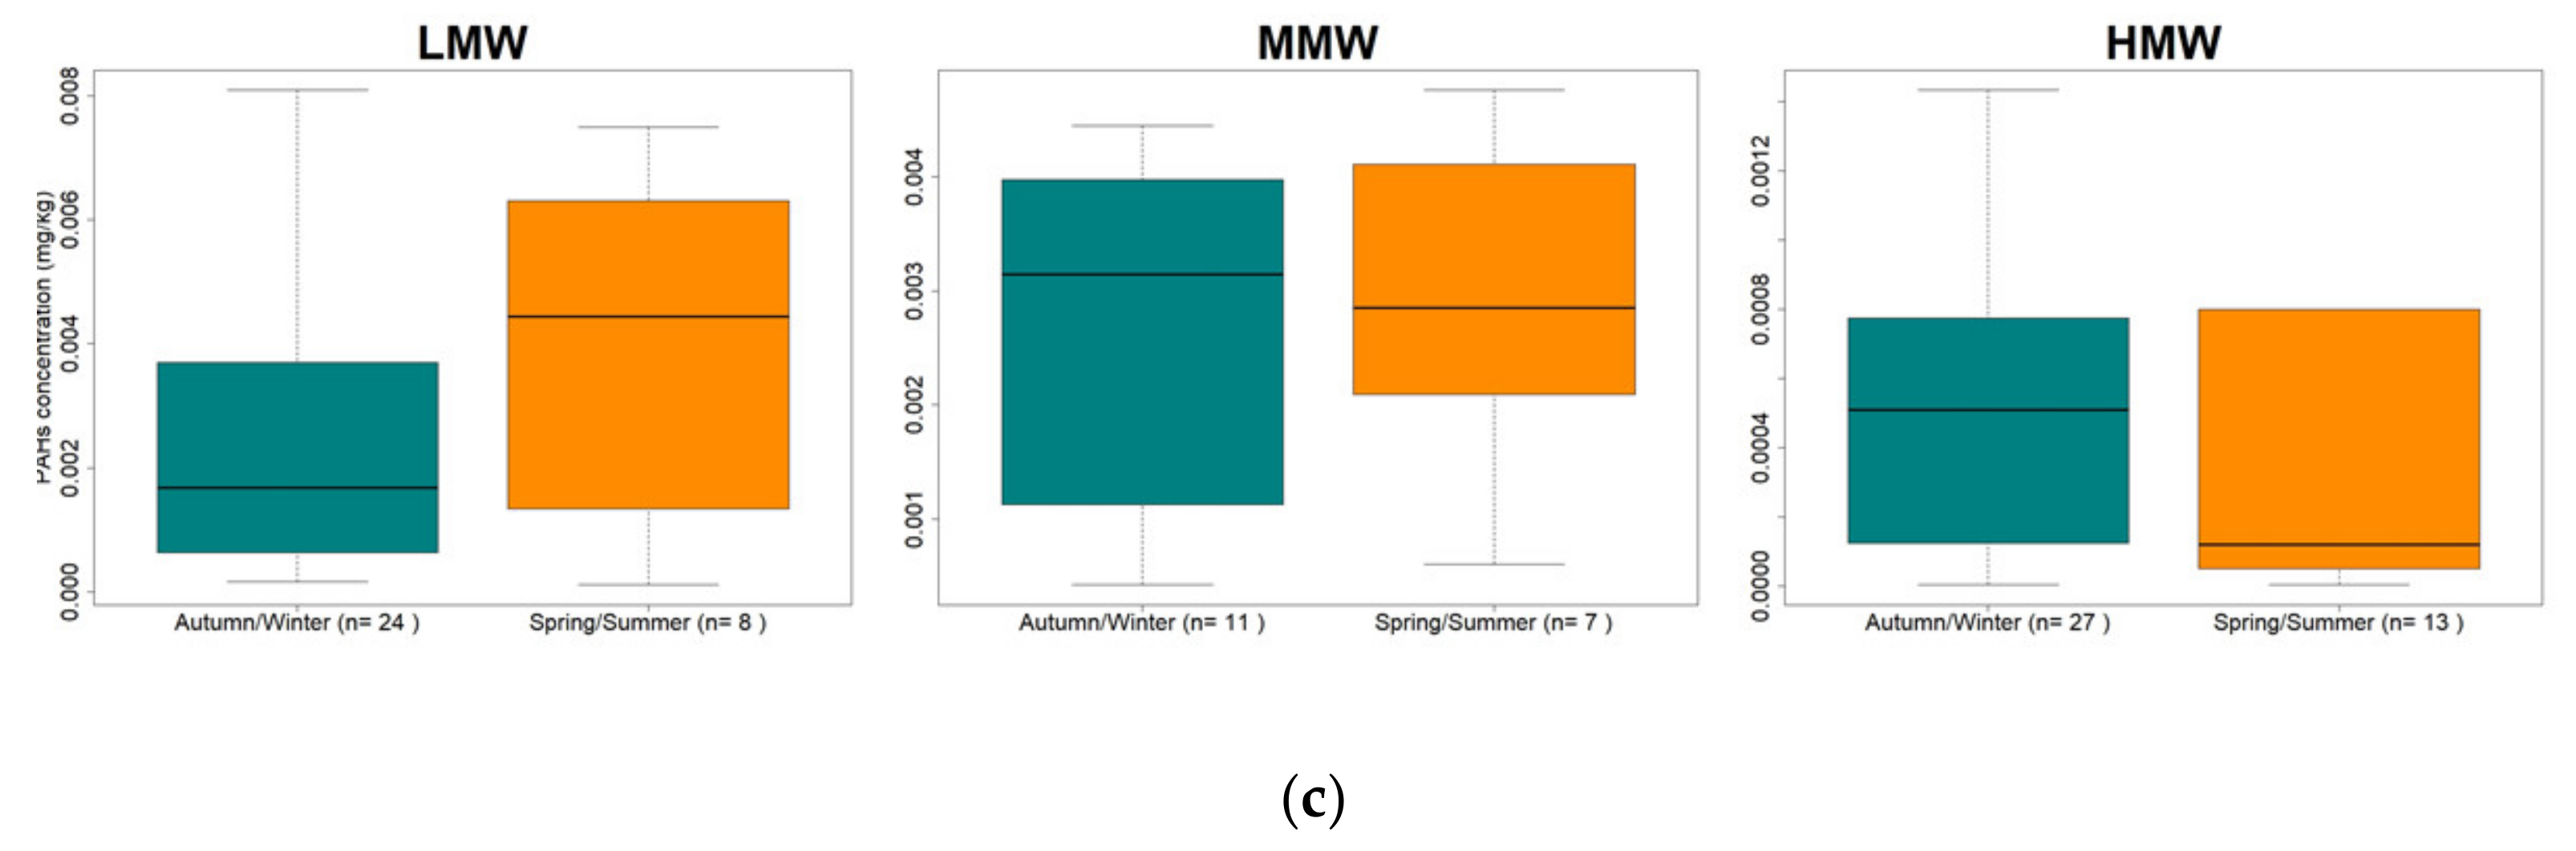
3.2. PAHs Concentration by Molecular Weight and by Season

We compared the concentrations of LMW, MMW and HMW PAHs in Mediterranean mussel, Manila clam, common sole and red mullet, being that these species are the ones on which more records are available in this database. Summary statistics for each class of PAHs in each species are reported in Table 2. Statistics and p-values for each test are reported in Supplementary Materials (Tables S9–S12).
In all four species, MMW PAHs show the highest mean concentration, followed by LMW PAHs and, finally, HMW PAHs, which show the lowest mean concentration (Figure 4). In all cases, the difference between the mean concentration of each PAHs class was statistically significant (p < 0.05), except for the difference between MMW and LMW PAHs in red mullet.
For each class of PAHs, we compared mean concentrations measured in cold and warm months in Mediterranean mussel, Manila clam, and red mullet, controlling for the effect of sampling depth and sampling year (Figure 5). We excluded common sole from the analysis because all samples for which sampling date was specified in the original sources were collected in autumn (October–December). Summary statistics on each variable included in the present analysis are reported in Table 3.
In Mediterranean mussel, the Wilcoxon rank sum test reveals that both MMW- and HMW PAHs are present at significantly (p < 0.05) higher concentrations in cold months (Table S13). Moreover, ANCOVA shows that the same trend is statistically significant, even after controlling for the sampling depth and sampling year (Table S14).
In Manila clam, the Wilcoxon rank sum test reveals that all PAHs classes (i.e., LMW-, MMW- and HMW PAHs) are present at significantly higher concentrations in cold months (Table S15). However, as shown by ANCOVA, the above trend remains statistically significant after controlling for sampling year only in LMW- and MMW PAHs (Table S16). Data on sampling depth for Manila clam were not sufficient to use this variable as covariate in ANCOVA.
Finally, in red mullet, both the Wilcoxon rank sum test and ANCOVA show that for any of the PAH classes, concentrations in warm months are not significantly different from those in cold months (Tables S17 and S18). Additionally, in the case of red mullet, ANCOVA was carried out with only sampling year as a covariate, as data on sampling depth were not sufficient.

3.3. Latitude, Depth and Sampling Year Effect in Mediterranean Mussel

We tested the presence of a relationship between the latitude, sampling depth and sampling year and the PAH concentrations in Mediterranean mussel caught along the Italian coast of the Adriatic and the Tyrrhenian Seas. Kendall’s rank correlation coefficients (τb) and p-values are reported in the Supplementary Materials (Tables S19–S30), along with maps showing the geographical distributions of sampling sites from where data used in each analysis derive (Figures S1–S4).

3.3.1. Adriatic

Summary statistics on each variable included in the correlation analysis on data from the Adriatic Sea are reported in Table 4.
As Kendall’s rank correlation revealed, after removing the effect of the sampling depth and sampling year, concentrations of LMW-, MMW- and HMW PAHs in Mediterranean mussel caught along the Italian coast of the Adriatic Sea turned out to be negatively correlated with latitude in warm months, while the correlation becomes positive in cold months. Results are all statistically significant (p < 0.05), except for MMW PAHs in both periods of the year.
In Mediterranean mussel caught along the Italian coast of the Adriatic Sea, after removing the effect of the latitude and sampling year, concentrations of LMW-, MMW- and HMW PAHs are always negatively correlated with the sampling depth. Results are all statistically significant (p < 0.05), except in the case of MMW PAHs in warm months.
Finally, concentrations of all three classes of PAHs in warm months increase over the years, while concentrations of all three classes of PAHs in cold months decrease over the years, after removing the effect of latitude and sampling depth. Results are all statistically significant (p < 0.05), except for those on MMW PAHs in cold months.

3.3.2. Tyrrhenian

Summary statistics on each variable included in the correlation analysis on data from the Tyrrhenian Sea are reported in Table 5.
As Kendall’s rank correlation revealed, after removing the effect of the sampling depth and sampling year, concentrations of LMW-, MMW- and HMW PAHs in Mediterranean mussel caught in the Tyrrhenian Sea increase with latitude in both cold and warm periods, and this increase is statistically significant (p < 0.05) for every PAH class and period of the year, excluding MMW PAHs.
In Mediterranean mussel caught in the Tyrrhenian Sea, after removing the effect of the latitude and sampling year, concentrations of LMW in warm months and of MMW in both periods of the year are negatively correlated with the sampling depth. These results are always statistically significant (p < 0.05), apart from those on MMW in cold months. On the contrary, in all other cases (i.e., LMW PAHs in cold months, and HMW PAHs in both periods of the year), the PAH concentrations and sampling depth turned out to be positively correlated, always reaching statistical significance, except for HMW PAHs in warm months.
Finally, concentrations of LMW-, MMW- and HMW PAHs in Mediterranean mussels caught in the Tyrrhenian Sea, in both cold and warm months, increase over the years, and this trend is statistically significant (p < 0.05) for LMW- and MMW PAHs in warm months, and for HMW PAHs in both periods of the year.

3.4. Human Health Risks Assessment

In total, 92 out of 651 (~14%) records of BaP in bivalves exceed the limit of 0.005 mg/kg set by the EU [11] (Table 1), with most of these records (57) being on Mediterranean mussels caught in the Tyrrhenian Sea. Conversely, none of the 26 records of PAH4 in bivalves exceed the limit of 0.03 mg/kg set by the EU [11] (Table 1).
In this database, assuming a consumption rate equal to the average per capita consumption in Italy (FAOSTAT, 2018), ELCR values range from a minimum of 1.36 × 10¹⁰ to a maximum of 4.52 × 10⁴, which is reached by a record of dibenzo(a,i)pyrene (DaiP) in Mediterranean mussel. A total of 324 out of 5275 records (~6%) exceeds the threshold value of 10−5 for ELCR. Records exceeding ELCR threshold value are mostly on Mediterranean mussel (225), while dibenzo(a,h)anthracene (DahA) is the compound most frequently associated with such high ELCR values.
THQ values range from a minimum of 2.2 × 10⁻⁹ to a maximum of ~0.13, which is reached by a record of BaP in Mediterranean mussel. Therefore, none of the records in this database exceeds the threshold value of 1 for THQ. THQ distributions for some of the most consumed species in Italy [55] are reported in Figure 6. As can be seen, among those included in the graph, European anchovy (Engraulis encrasicolus), blue mussel (Mytilus edulis) and European hake (Merluccius merluccius) are the first three species showing the highest median THQ.

4. Discussion

The development of this database on PAHs in seafood caught in the Western and Central Mediterranean Sea showed that most of the studies carried out from 1990 to 2021 focused on the Tyrrhenian and Adriatic Seas, with fewer records coming from the Ionian Sea. Moreover, Mediterranean mussel was by far the most studied species, accounting for more than half of records in the database. This is not surprising, given that, along with red mullet, Mediterranean mussel is considered one of the most suitable organisms to be used in biomonitoring studies, because of the widespread distribution, the ability to accumulate contaminants to a degree proportional to their bioavailability, as well as the ease of sampling [41,56].
In this database, MMW PAHs and LMW PAHs showed higher concentrations than HMW PAHs in Mediterranean mussel, Manila clam, common sole and red mullet. This is in line with the expectations, given the greater solubility and bioavailability of lighter PAHs and the faster metabolism of the heavier ones [12].
In a recent investigation carried out using large-scale monitoring data on PAHs in sediments of the Mediterranean Sea [57], the authors found that the two most prevalent PAHs in the Western Mediterranean basin were fluoranthene (Flu) and phenanthrene (Phe), with the former being the most abundant also in the Adriatic Sea and in the Central Mediterranean basin. In view of this, it is interesting to note that, in our meta-analysis, Flu and Phe are also the most abundant PAHs in both Mediterranean mussel and Manila clam (Figures S5 and S6), which are benthic filter-feeding bivalves, and so may be particularly prone to absorbing PAHs accumulated in bottom sediments, after their remobilization.
The analysis on seasonality shows that PAH concentrations tend to be higher in specimens sampled in cold months (October–March), and this trend is statistically significant in both Mediterranean mussel and Manila clam, confirming what several studies, including those in this database, found independently [8,16,19,29,32,41].
As suggested by previous investigators, the reason for such a seasonal pattern may lie both in the biology of these species and in changes in the emission and mobilization of PAHs in the environment. PAHs are lipophilic compounds [49], and as such, they accumulate preferentially in lipid-rich tissues [50]. Given that the lipid content of tissues of marine species can vary under the effect of, for example, nutritional [13] and reproductive status [35,58], one might speculate that seasonal fluctuations in such parameters may be reflected in PAH concentration changes. However, this should not be the case with Mediterranean mussel, since several investigations carried out in the Mediterranean Sea found higher lipid content in mussel sampled during summer [59,60], and this is likely due to the depletion of lipids that takes place after spawning [58,60]. Another possibility is that higher PAHs concentrations in winter are the result of increased PAH emission through, for example, domestic heat [12,17,61,62] and industrial activities [63]. Moreover, in summer, the degradation of PAHs, especially of the lighter ones (i.e., LMW PAHs) [63,64], is enhanced by UV radiation, high temperatures, and ozone [65]. On the other hand, low seawater temperature in winter can inhibit the microbial degradation of PAHs [66,67]. Additionally, the resuspension of particulate matter that takes place during winter via sea storms [19] and water mixing [12] could foster PAHs availability and accumulation in filter feeding organisms, such as mussels, and this is particularly true for heavier and more recalcitrant PAHs [12,68].
In red mullet, lighter (i.e., LMW) and heavier (i.e., MMW and HMW) PAHs show opposite trends, with the former being present at greater concentrations during warm months, and the latter during cold months. Frapiccini and colleagues [35] suggested that higher LMW PAHs in summer months might be related to an increase in maritime traffic during this period of the year, while the increase in heavier PAHs concentrations observed in winter might be caused by a reduced expression in detoxification enzymes in red mullet [69], along with the environmental factors that are hypothesized to determine the same pattern in Mediterranean mussel. Nevertheless, in our meta-analysis, the difference between PAHs concentrations in warm and cold months was not statistically significant. Moreover, it is important to note that, analyzing the liver of red mullets caught in the Northern Adriatic Sea, Guerranti and colleagues [30] found higher levels of PAHs in autumn than in spring, but they found the opposite trend in the liver of red mullets caught in the Southern Adriatic and Tyrrhenian Seas.
In this database, concentrations of PAHs in Mediterranean mussel caught along the Italian coast of the Adriatic Sea are negatively correlated with latitude in warm months, (average τb ≅ − 0.2). On the contrary, concentrations of PAHs and latitude show a positive correlation (average τb ≅ 0.2) in cold months. We tentatively attribute the above results to the water masses circulation that characterizes the Adriatic Sea, and/or to the seasonal changes in the river discharge from the Italian coast. The major riverine freshwater input in the Adriatic Sea [70], the Po River, flows into the northern part of the basin, with greater discharge in spring and autumn, and lower discharge in summer [53]. In winter, the Po plume flows mostly southward [53] along the Italian coast, forming the Western Adriatic Current, a buoyant fresher water layer more than 50 m deep [71]. Moreover, in this period of the year, the cold Bora wind that affects the region causes the cooling of the sea surface layer, resulting in the complete vertical mixing of the sea water. This in turn leads to the resuspension of the bottom sediments and, therefore, to the remobilization of contaminants accumulated therein [53]. On the other hand, during spring and summer, the strong thermal stratification of the water results in the offshore propagation of the Po plume, which reaches the center of the basin [53].
Considering all the above, we hypothesize that the positive correlation between the PAH concentration and latitude observed in cold months may be due to, or at least favored by, the increased input of pollutants from the Po River, coupled with the resuspension of contaminants determined by the cooling action of the Bora wind in the northern Adriatic Sea. This latitudinal trend may be disrupted in warm months because of a greater contribution of pollutants from local rivers in the middle Adriatic, given the weaker influence of the Po plume on the regions south of the Po delta.
Our results seem to agree with a previous study analyzing nutrients transport along the Western Adriatic coast [70]. Indeed, what that study found is that, in winter, nutrient concentrations in water decreased southward from the Po River, while in spring, concentrations off Pescara were higher than concentrations in the Po area.
Although above explanation might sound plausible, our results should be interpreted with caution, considering the high data heterogeneity and the different geographical distribution of observations during warm and cold months, the latter being more discontinuous (Figure S2).
The negative correlation (average τb ≅ − 0.2) observed between the sampling depth and PAH concentrations in Mediterranean mussel caught along the Italian coast of the Adriatic Sea is in accordance with several past investigations. A study carried out in the Western Mediterranean Sea revealed a higher PAH content in suspended particulate matter collected near the sea surface compared to that sampled from deep water [72], while another study found similar results in water samples collected in the Baltic Sea [66]. Moreover, in [7], concentrations of PAHs in Mediterranean mussels collected in the Gulf of Naples were negatively correlated with sampling depth. We hypothesize that the observed bathymetric gradient may be due, at least in the Adriatic Sea, to a greater impact of river discharge at a low depth.
Concerning the discrepancy between results of the correlation analyses on the PAH concentration and sampling year, with concentrations increasing over the years in warm months and decreasing over the years in cold months, we were not able to find a likely explanation based on information retrieved from the literature. Overall, we cannot exclude that our results are an artefact stemming from the high degree of heterogeneity of the data collected in the database. Moreover, it is notable that data on PAH concentrations in Mediterranean mussel caught along the Western Adriatic coast in cold months are from the periods 2006–2009 and 2005–2009, for LMW PAHs and for MMW- and HMW PAHs, respectively, while data on mussels caught in warm months cover a longer period of time (2006–2011 and 2005–2017 for LMW PAHs and for MMW- and HMW PAHs, respectively) (Table 4); therefore, we cannot rule out the possibility of an actual declining trend in PAH concentrations in the period covered by data on cold months, whose signal is lost in the broader period that the data on warm months span. In this regard, it is interesting to note that an oscillating temporal trend of PAHs concentrations was observed in Adriatic sediments by Rizzi and colleagues [57], with several PAHs showing a decrease in concentrations until the years between 2005 and 2010, when a new increase took place (Figure S2 of [57]).
Turning to mussels from the Tyrrhenian Sea, we observed a latitudinal trend, consistent across the three PAHs classes, in both periods of the year, that is, an increase in PAH concentrations from the southern to the northern part of the basin (average τb ≅ 0.1). Interpreting the above results is challenging, given the low number of sampling sites, especially in cold months, and their uneven geographical distribution along the Italian coast. Therefore, we limit ourselves to observe that, in the Tyrrhenian Sea, the salinity of the shallower water mass (0–150 m) follows the same latitudinal trend that we observed for the PAH concentration in mussels, passing from 36.2 psu in the southern region to 38.4 in the northern [73]; salinity superior or equal to 37 psu has been shown to slow down the degradation of PAH molecules [64]. Moreover, water circulation in the Tyrrhenian Sea is dominated by a wide cyclonic path that enters the basin through the Sardinia Channel and flows along the Sicilian and Italian coasts [73]. Thereby, it could be that mussels at more northerly latitudes are affected not only by local input of contaminants, but also by the substances that currents catch along their path. Finally, it is worth noting that, as can be seen from the marine traffic density map [74] of the European Atlas of the Seas [75], the Tyrrhenian coast of Calabria, in the southern part of the basin, is the least affected by vessel traffic.
The inconsistency between the results of the correlation analysis on PAH concentrations and sampling depth in the Tyrrhenian Sea is not easy to interpret, and again, it may represent a simple artefact of data heterogeneity. The statistically significant negative correlation between sampling depth and LMW- and MMW PAHs concentrations in warm months is in line with the results on LMW- and HMW PAHs in the Adriatic Sea and may be attributable to a greater impact of river discharge at low depth. On the contrary, we found that LMW- and HMW PAHs measured in the Tyrrhenian Sea in cold months significantly increase with sampling depth. Although we cannot find a convincing explanation to such a pattern, it is noteworthy that the Tyrrhenian Sea is rich in volcanic submarine structures [76,77], which can be important contributors of pyrolytic PAHs in the environment [78,79]. As such, we hypothesize that Tyrrhenian mussels that inhabit greater depths may be more susceptible to contamination driven by submarine volcanism, being at the same time less affected by river discharge.
The increasing trend of PAH concentrations in Mediterranean mussels from Tyrrhenian Sea is in line with recent findings suggesting that, in recent years, concentrations of these compounds in Mediterranean Sea sediments have increased, especially in the western part of the basin, probably as an effect of a parallel rise in PAH emissions from forest fires [57].
Both human and animal studies point to PAH exposure as being detrimental for the health, due to, for example, their carcinogenicity, teratogenicity and endocrine-disrupting effects [2]. Accordingly, the EU set a maximum level of several PAHs in fresh and smoked seafood to be sold [11] (Table 1). None of the records included in this database exceed those limits. Moreover, based on FAOSTAT data on per capita seafood consumption in Italy (FAOSTAT, 2018), none of the records in this database exceed the threshold value of 1 for THQ, pointing to a minimum risk of running into systemic effects at a consumption rate like the one typical of the Italian population. Conversely, in around 6% of cases, samples exceed the threshold value of 10−5 for ELCR, pointing to a probability of greater than 1 chance over 100,000 of developing cancer [46]. Ultimately, at a consumption rate like the one typical of the Italian population, seafood caught from the area considered in the present work seems to pose a minimal risk to health. However, it should be considered that the seafood ingestion rate is variable among the population [80], and that an individual is simultaneously exposed to several PAH sources, from both ingestion and other routes. Furthermore, it is vital to note the emerging role of genetics in shaping individual susceptibility to PAHs [81].

5. Conclusions

Gathering the results of several investigations, we produced a database on PAHs in seafood from the Western and Central Mediterranean Sea. A clear imbalance in favor of studies addressing PAHs in bivalve mollusks emerged.
The meta-analysis carried out on the database led us to obtain potential hints on factors (e.g., reproductive status, water masses circulation, and river discharge seasonal variability) that could determine differences in the PAH contamination of marine species.
The assessment of human health risks posed by PAH seafood contamination showed that, at a consumption rate like the one typical of the Italian population, seafood caught from the study areas seems to pose a minimal risk to health. Despite this, concerns may arise considering the individual susceptibility to PAHs exposure as well as the apparent increasing trend of PAHs levels observed in both environmental matrices and sea animals.

Supplementary Materials

The following are available online at https://www.mdpi.com/article/10.3390/app12062776/s1. Table S1: Columns of the database Table S2: Geographic precision code used in the database. Table S3: Sources of the trophic levels of the organisms included in the database. Table S4: Tissues codes used in the database. Table S5: PAHs included in the database. Table S6: PAHs molecular weight abbreviations used in the database. Table S7: Water content abbreviations used in the database. Table S8: Indices and formulas included in the database. Table S9: Pairwise comparisons between the three PAH classes in Mediterranean mussel, using Wilcoxon rank sum test. P-value adjustment method: Benjamini–Hochberg. Table S10: Pairwise comparisons between the three PAHs classes in Manila clam, using Wilcoxon rank sum test. P-value adjustment method: Benjamini–Hochberg. Table S11: pairwise comparisons between the three PAHs classes in common sole, using Wilcoxon rank sum test. P-value adjustment method: Benjamini–Hochberg. Table S12: Pairwise comparisons between the three PAHs classes in red mullet, using Wilcoxon rank sum test. P-value adjustment method: Benjamini–Hochberg. Table S13: Comparison between mean concentrations measured in cold and warm months in Mediterranean mussel, using Wilcoxon rank sum test with continuity correction. Table S14: Comparison between mean concentrations measured in cold and warm months in Mediterranean mussel, controlling for the effect of sampling depth and sampling year with ANCOVA. Table S15: Comparison between mean concentrations measured in cold and warm months in Manila clam, using Wilcoxon rank sum test with continuity correction. Table S16: Comparison between mean concentrations measured in cold and warm months in Manila clam, controlling for the effect of sampling year with ANCOVA. Table S17: Comparison between mean concentrations measured in cold and warm months in red mullet, using Wilcoxon rank sum test with continuity correction. Table S18: Comparison between mean concentrations measured in cold and warm months in red mullet, controlling for the effect of sampling year with ANCOVA. Table S19: Pairwise correlation coefficients with p-values (among brackets) between latitude, sampling depth and sampling year and LMW PAHs concentrations in Mediterranean mussel caught along the Italian coast of the Adriatic Sea in warm months, Table S20: Pairwise correlation coefficients with p-values (among brackets) between latitude, sampling depth and sampling year and LMW PAHs concentrations in Mediterranean mussel caught along the Italian coast of the Adriatic Sea in cold months. Table S21: Pairwise correlation coefficients with p-values (among brackets) between latitude, sampling depth and sampling year and MMW PAHs concentrations in Mediterranean mussel caught along the Italian coast of the Adriatic Sea in warm months. Table S22: Pairwise correlation coefficients with p-values (among brackets) between latitude, sampling depth and sampling year and MMW PAHs concentrations in Mediterranean mussel caught along the Italian coast of the Adriatic Sea in cold months. Table S23: Pairwise correlation coefficients with p-values (among brackets) between latitude, sampling depth and sampling year and HMW PAHs concentrations in Mediterranean mussel caught along the Italian coast of the Adriatic Sea in warm months. Table S24: Pairwise correlation coefficients with p-values (among brackets) between latitude, sampling depth and sampling year and HMW PAHs concentrations in Mediterranean mussel caught along the Italian coast of the Adriatic Sea in cold months. Table S25: Pairwise correlation coefficients with p-values (among brackets) between latitude, sampling depth and sampling year and LMW PAHs concentrations in Mediterranean mussel caught in the Tyrrhenian Sea in warm months. Table S26: Pairwise correlation coefficients with p-values (among brackets) between latitude, sampling depth and sampling year and LMW PAHs concentrations in Mediterranean mussel caught in the Tyrrhenian Sea in cold months. Table S27: Pairwise correlation coefficients with p-values (among brackets) between latitude, sampling depth and sampling year and MMW PAHs concentrations in Mediterranean mussel caught in the Tyrrhenian Sea in warm months. Table S28: Pairwise correlation coefficients with p-values (among brackets) between latitude, sampling depth and sampling year and MMW PAHs concentrations in Mediterranean mussel caught in the Tyrrhenian Sea in cold months. Table S29: Pairwise correlation coefficients with p-values (among brackets) between latitude, sampling depth and sampling year and HMW PAHs concentrations in Mediterranean mussel caught in the Tyrrhenian Sea in warm months. Table S30: Pairwise correlation coefficients with p-values (among brackets) between latitude, sampling depth and sampling year and HMW PAHs concentrations in Mediterranean mussel caught in the Tyrrhenian Sea in cold months. Figure S1: Geographical distributions of sampling sites of Mediterranean mussel caught along the Italian coast of the Adriatic Sea in warm months. Figure S2: Geographical distributions of sampling sites of Mediterranean mussel caught along the Italian coast of the Adriatic Sea in cold months. Figure S3: Geographical distributions of sampling sites of Mediterranean mussel caught in the Tyrrhenian Sea in warm months. Figure S4: Geographical distributions of sampling sites of Mediterranean mussels caught in the Tyrrhenian Sea in cold months. Figure S5: Boxplots of the concentration of single PAHs in Mediterranean mussel. The color of the boxes indicates the molecular weight of the given PAH. Boxplots are arranged in ascending order by median. Figure S6: Boxplots of the concentration of single PAHs in Manila clam. The color of the boxes indicates the molecular weight of the given PAH. Boxplots are arranged in ascending order by median.

Author Contributions

Conceptualization, A.D.G. and M.M.; methodology, A.D.G. and M.M.; formal analysis, A.D.G., P.A.; data curation, A.D.G.; writing—original draft preparation, A.D.G.; writing—review and editing, P.A., E.F., D.L., M.M.; supervision, E.F., D.L., M.M.; project administration, D.L., M.M. All authors have read and agreed to the published version of the manuscript.

Funding

This research received no external funding.

Institutional Review Board Statement

Not applicable.

Informed Consent Statement

Not applicable.

Data Availability Statement

The comma-separated values file of the database presented in this study is in the Supplementary Materials.

Acknowledgments

The research leading to these results was conceived under the collaboration between the University of Bologna and the National Research Council for the implementation of the International PhD Program “Innovative Technologies and Sustainable Use of Mediterranean Sea Fishery and Biological Resources” (www.FishMed-PhD.org accessed on 15 January 2022).

Conflicts of Interest

The authors declare no conflict of interest.

References

  1. Pavanello, S.; Campisi, M.; Mastrangelo, G.; Hoxha, M.; Bollati, V. The effects of everyday-life exposure to polycyclic aromatic hydrocarbons on biological age indicators. Environ. Health 2020, 19, 128. [Google Scholar] [CrossRef] [PubMed]
  2. Sun, K.; Song, Y.; He, F.; Jing, M.; Tang, J.; Liu, R. A review of human and animals exposure to polycyclic aromatic hydrocarbons: Health risk and adverse effects, photo-induced toxicity and regulating effect of microplastics. Sci. Total Environ. 2021, 773, 145403. [Google Scholar] [CrossRef] [PubMed]
  3. Capuano, E.; van Ruth, S.M. Infrared Spectroscopy: Applications. In Encyclopedia of Food and Health, 1st ed.; Caballero, B., Finglas, P.M., Toldrá, F., Eds.; Academic Press: Oxford, UK, 2016; pp. 424–431. ISBN 978-0-12-384953-3. [Google Scholar]
  4. Sakshi; Haritash, A.K. A comprehensive review of metabolic and genomic aspects of PAH-degradation. Arch. Microbiol. 2020, 202, 2033–2058. [Google Scholar] [CrossRef] [PubMed]
  5. Ifegwu, O.C.; Anyakora, C. Polycyclic Aromatic Hydrocarbons. In Advances in Clinical Chemistry; Elsevier: Amsterdam, The Netherlands, 2015; Volume 72, pp. 277–304. [Google Scholar] [CrossRef]
  6. Lucas, J.; Percelay, I.; Larcher, T.; Lefrançois, C. Effects of pyrolytic and petrogenic polycyclic aromatic hydrocarbons on swimming and metabolic performance of zebrafish contaminated by ingestion. Ecotoxicol. Environ. Saf. 2016, 132, 145–152. [Google Scholar] [CrossRef]
  7. Mercogliano, R.; Santonicola, S.; De Felice, A.; Anastasio, A.; Murru, N.; Ferrante, M.C.; Cortesi, M.L. Occurrence and distribution of polycyclic aromatic hydrocarbons in mussels from the gulf of Naples, Tyrrhenian Sea, Italy. Mar. Pollut. Bull. 2016, 104, 386–390. [Google Scholar] [CrossRef]
  8. Grigoriou, C.; Costopoulou, D.; Vassiliadou, I.; Chrysafidis, D.; Tzamtzis, V.; Bakeas, E.; Leondiadis, L. Monitoring of Polycyclic Aromatic Hydrocarbon Levels in Mussels (Mytilus galloprovincialis) from Aquaculture Farms in Central Macedonia Region, Greece, Using Gas Chromatography—Tandem Mass Spectrometry Method. Molecules 2021, 26, 5953. [Google Scholar] [CrossRef]
  9. Bua, R.O.; Contino, A.; Giuffrida, A. Polycyclic aromatic hydrocarbons in Mullus surmuletus from the Catania Gulf (Sicily, Italy): Distribution and potential health risks. Environ. Sci. Pollut. Res. 2020, 28, 7756–7765. [Google Scholar] [CrossRef]
  10. SCF. Opinion of the Scientific Committee on Food on the risks to human health of Polycyclic Aromatic Hydrocarbons in food. EFSA J. 2008, 724, 1–114. [Google Scholar] [CrossRef]
  11. Commission Regulation (EU) No 835/2011 of 19 August 2011 Amending Regulation (EC) No 1881/2006 as Regards Maxi-mum Levels for Polycyclic Aromatic Hydrocarbons in FoodstuffsText with EEA Relevance. 5. Available online: https://eur-lex.europa.eu/LexUriServ/LexUriServ.do?uri=OJ:L:2011:215:0004:0008:En:PDF (accessed on 15 January 2022).
  12. Frapiccini, E.; Cocci, P.; Annibaldi, A.; Panfili, M.; Santojanni, A.; Grilli, F.; Marini, M.; Palermo, F.A. Assessment of seasonal relationship between polycyclic aromatic hydrocarbon accumulation and expression patterns of oxidative stress-related genes in muscle tissues of red mullet (M. barbatus) from the Northern Adriatic Sea. Environ. Toxicol. Pharmacol. 2021, 88, 103752. [Google Scholar] [CrossRef]
  13. González-Fernández, C.; Albentosa, M.; Campillo, J.A.; Viñas, L.; Romero, D.; Franco, A.; Bellas, J. Effect of nutritive status on Mytilus galloprovincialis pollution biomarkers: Implications for large-scale monitoring programs. Aquat. Toxicol. 2015, 167, 90–105. [Google Scholar] [CrossRef]
  14. Conte, F.; Copat, C.; Longo, S.; Conti, G.O.; Grasso, A.; Arena, G.; Dimartino, A.; Brundo, M.V.; Ferrante, M. Polycyclic aromatic hydrocarbons in Haliotis tuberculata (Linnaeus, 1758) (Mollusca, Gastropoda): Considerations on food safety and source investigation. Food Chem. Toxicol. 2016, 94, 57–63. [Google Scholar] [CrossRef] [PubMed]
  15. Recabarren-Villalón, T.; Ronda, A.C.; Oliva, A.L.; Cazorla, A.L.; Marcovecchio, J.E.; Arias, A.H. Seasonal distribution pattern and bioaccumulation of Polycyclic aromatic hydrocarbons (PAHs) in four bioindicator coastal fishes of Argentina. Environ. Pollut. 2021, 291, 118125. [Google Scholar] [CrossRef] [PubMed]
  16. Esposito, M.; Canzanella, S.; Lambiase, S.; Scaramuzzo, A.; La Nucara, R.; Bruno, T.; Picazio, G.; Colarusso, G.; Brunetti, R.; Gallo, P. Organic pollutants (PCBs, PCDD/Fs, PAHs) and toxic metals in farmed mussels from the Gulf of Naples (Italy): Monitoring and human exposure. Reg. Stud. Mar. Sci. 2020, 40, 101497. [Google Scholar] [CrossRef]
  17. Fiorito, F.; Amoroso, M.G.; Lambiase, S.; Serpe, F.P.; Bruno, T.; Scaramuzzo, A.; Maglio, P.; Fusco, G.; Esposito, M. A relationship between environmental pollutants and enteric viruses in mussels (Mytilus galloprovincialis). Environ. Res. 2018, 169, 156–162. [Google Scholar] [CrossRef] [PubMed]
  18. Baali, A.; Yahyaoui, A. Polycyclic Aromatic Hydrocarbons (PAHs) and Their Influence to Some Aquatic Species. In Biochemical Toxicology-Heavy Metals and Nanomaterials; Ince, M., Kaplan Ince, O., Ondrasek, G., Eds.; IntechOpen: London, UK, 2020; ISBN 978-1-78984-696-6. [Google Scholar]
  19. Perugini, M.; Visciano, P.; Manera, M.; Turno, G.; Lucisano, A.A.; Amorena, M. Polycyclic Aromatic Hydrocarbons in Marine Organisms from the Gulf of Naples, Tyrrhenian Sea. J. Agric. Food Chem. 2007, 55, 2049–2054. [Google Scholar] [CrossRef]
  20. Corsi, I.; Mariottini, M.; Menchi, V.; Sensini, C.; Balocchi, C.; Focardi, S. Monitoring a Marine Coastal Area: Use of Mytilus galloprovincialis and Mullus barbatus as Bioindicators. Mar. Ecol. 2002, 23, 138–153. [Google Scholar] [CrossRef]
  21. Vassura, I.; Foschini, F.; Baravelli, V.; Fabbri, D. Distribution of alternant and non-alternant polycyclic aromatic hydrocarbons in sediments and clams of the Pialassa Baiona Lagoon (Ravenna, Italy). Chem. Ecol. 2005, 21, 415–424. [Google Scholar] [CrossRef]
  22. Fabbri, D.; Baravelli, V.; Giannotti, K.; Donnini, F.; Fabbri, E. Bioaccumulation of cyclopenta[cd]pyrene and benzo[ghi]fluoranthene by mussels transplanted in a coastal lagoon. Chemosphere 2006, 64, 1083–1092. [Google Scholar] [CrossRef]
  23. Perugini, M.; Visciano, P.; Giammarino, A.; Manera, M.; Di Nardo, W.; Amorena, M. Polycyclic aromatic hydrocarbons in marine organisms from the Adriatic Sea, Italy. Chemosphere 2007, 66, 1904–1910. [Google Scholar] [CrossRef]
  24. Bihari, N.; Fafanđel, M.; Piškur, V. Polycyclic Aromatic Hydrocarbons and Ecotoxicological Characterization of Seawater, Sediment, and Mussel Mytilus galloprovincialis from the Gulf of Rijeka, the Adriatic Sea, Croatia. Arch. Environ. Contam. Toxicol. 2007, 52, 379–387. [Google Scholar] [CrossRef]
  25. Della Torre, C.; Corsi, I.; Nardi, F.; Perra, G.; Tomasino, M.P.; Focardi, S. Transcriptional and post-transcriptional response of drug-metabolizing enzymes to PAHs contamination in red mullet (Mullus barbatus, Linnaeus, 1758): A field study. Mar. Environ. Res. 2010, 70, 95–101. [Google Scholar] [CrossRef] [PubMed] [Green Version]
  26. Corsi, I.; Tabaku, A.; Nuro, A.; Beqiraj, S.; Marku, E.; Perra, G.; Tafaj, L.; Baroni, D.; Bocari, D.; Guerranti, C.; et al. Ecotoxicological Assessment of Vlora Bay (Albania) by a Biomonitoring Study Using an Integrated Approach of Sublethal Toxicological Effects and Contaminant Levels in Bioindicator Species. J. Coast. Res. 2011, 270, 116–120. [Google Scholar] [CrossRef]
  27. Trisciani, A.; Corsi, I.; Della Torre, C.; Perra, G.; Focardi, S. Hepatic biotransformation genes and enzymes and PAH metabolites in bile of common sole (Solea solea, Linnaeus, 1758) from an oil-contaminated site in the Mediterranean Sea: A field study. Mar. Pollut. Bull. 2011, 62, 806–814. [Google Scholar] [CrossRef] [PubMed]
  28. Storelli, M.M.; Barone, G.; Perrone, V.G.; Storelli, A. Risk characterization for polycyclic aromatic hydrocarbons and toxic metals associated with fish consumption. J. Food Compos. Anal. 2013, 31, 115–119. [Google Scholar] [CrossRef]
  29. Gomiero, A.; Volpato, E.; Nasci, C.; Perra, G.; Viarengo, A.; Dagnino, A.; Spagnolo, A.; Fabi, G. Use of multiple cell and tissue-level biomarkers in mussels collected along two gas fields in the northern Adriatic Sea as a tool for long term environmental monitoring. Mar. Pollut. Bull. 2015, 93, 228–244. [Google Scholar] [CrossRef] [PubMed]
  30. Guerranti, C.; Grazioli, E.; Focardi, S.; Renzi, M.; Perra, G. Levels of chemicals in two fish species from four Italian fishing areas. Mar. Pollut. Bull. 2016, 111, 449–452. [Google Scholar] [CrossRef]
  31. Glad, M.; Bihari, N.; Jaksic, Z.; Fafanđel, M. Comparison between resident and caged mussels: Polycyclic aromatic hydrocarbon accumulation and biological response. Mar. Environ. Res. 2017, 129, 195–206. [Google Scholar] [CrossRef]
  32. Cacciatore, F.; Bernarello, V.; Brusà, R.B.; Sesta, G.; Franceschini, G.; Maggi, C.; Gabellini, M.; Lamberti, C.V. PAH (Polycyclic Aromatic Hydrocarbon) bioaccumulation and PAHs/shell weight index in Ruditapes philippinarum (Adams & Reeve, 1850) from the Vallona lagoon (northern Adriatic Sea, NE Italy). Ecotoxicol. Environ. Saf. 2018, 148, 787–798. [Google Scholar] [CrossRef]
  33. Frapiccini, E.; Annibaldi, A.; Betti, M.; Polidori, P.; Truzzi, C.; Marini, M. Polycyclic aromatic hydrocarbon (PAH) accumulation in different common sole (Solea solea) tissues from the North Adriatic Sea peculiar impacted area. Mar. Pollut. Bull. 2018, 137, 61–68. [Google Scholar] [CrossRef]
  34. Bajt, O.; Ramšak, A.; Milun, V.; Andral, B.; Romanelli, G.; Scarpato, A.; Mitrić, M.; Kupusović, T.; Kljajić, Z.; Angelidis, M.; et al. Assessing chemical contamination in the coastal waters of the Adriatic Sea using active mussel biomonitoring with Mytilus galloprovincialis. Mar. Pollut. Bull. 2019, 141, 283–298. [Google Scholar] [CrossRef]
  35. Frapiccini, E.; Panfili, M.; Guicciardi, S.; Santojanni, A.; Marini, M.; Truzzi, C.; Annibaldi, A. Effects of biological factors and seasonality on the level of polycyclic aromatic hydrocarbons in red mullet (Mullus barbatus). Environ. Pollut. 2019, 258, 113742. [Google Scholar] [CrossRef] [PubMed]
  36. Storelli, M.M.; Marcotrigiano, G.O. Polycyclic Aromatic Hydrocarbons in Mussels (Mytilus galloprovincialis) from the Ionian Sea, Italy. J. Food Prot. 2001, 64, 405–409. [Google Scholar] [CrossRef] [PubMed]
  37. Conti, G.O.; Copat, C.; Ledda, C.; Fiore, M.; Fallico, R.; Sciacca, S.; Ferrante, M. Evaluation of Heavy Metals and Polycyclic Aromatic Hydrocarbons (PAHs) in Mullus barbatus from Sicily Channel and Risk-Based Consumption Limits. Bull. Environ. Contam. Toxicol. 2012, 88, 946–950. [Google Scholar] [CrossRef]
  38. Marrone, R.; Smaldone, G.; Pepe, T.; Mercogliano, R.; De Felice, A.; Anastasio, A. Polycyclic Aromatic Hydrocarbons (Pahs) in Seafoods Caught in Corigliano Calabro Gulf (Cs, Italy). Ital. J. Food Saf. 2012, 1, 41–46. [Google Scholar] [CrossRef]
  39. Traina, A.; Ausili, A.; Bonsignore, M.; Fattorini, D.; Gherardi, S.; Gorbi, S.; Quinci, E.; Romano, E.; Manta, D.S.; Tranchida, G.; et al. Organochlorines and Polycyclic Aromatic Hydrocarbons as fingerprint of exposure pathways from marine sediments to biota. Mar. Pollut. Bull. 2021, 170, 112676. [Google Scholar] [CrossRef] [PubMed]
  40. Cocchieri, R.A.; Arnese, A.; Minicucci, A.M. Polycyclic aromatic hydrocarbons in marine organisms from Italian central Mediterranean coasts. Mar. Pollut. Bull. 1990, 21, 15–18. [Google Scholar] [CrossRef]
  41. Piccardo, M.; Coradeghini, R.; Valerio, F. Polycyclic Aromatic Hydrocarbon Pollution in Native and Caged Mussels. Mar. Pollut. Bull. 2001, 42, 951–956. [Google Scholar] [CrossRef]
  42. Amoroso, S.; Arnese, A.; Cirillo, T.; Montuori, P.; Triassi, M.; Amodio-Cocchieri, R. Pollution by Mercury, Arsenic, Lead, Chromium, Cadmium, and Polycyclic Aromatic Hydrocarbons of Fish and Mussels from the Gulf of Naples, Italy. Bull. Environ. Contam. Toxicol. 2003, 71, 551–560. [Google Scholar] [CrossRef] [Green Version]
  43. Serpe, F.P.; Esposito, M.; Gallo, P.; Salini, M.; Maglio, P.; Hauber, T.; Serpe, L. Determination of heavy metals, polycyclic aromatic hydrocarbons and polychlorinated biphenyls in Mytilus galloprovincialis from Campania coasts, Italy. Fresenius Environ. Bull. 2010, 19, 2292–2296. [Google Scholar]
  44. Serpe, F.P.; Esposito, M.; Gallo, P.; Serpe, L. Optimisation and validation of an HPLC method for determination of polycyclic aromatic hydrocarbons (PAHs) in mussels. Food Chem. 2010, 122, 920–925. [Google Scholar] [CrossRef]
  45. Marrone, R.; Mercogliano, R.; Palma, G.; Chirollo, C.; Smaldone, G.; Anastasio, A. Polycyclic aromatic hydrocarbons (PAHS) in seafood caught off in napoli gulf (Italy). Ital. J. Food Saf. 2011, 1, 61–65. [Google Scholar] [CrossRef]
  46. Ferrante, M.; Zanghì, G.; Cristaldi, A.; Copat, C.; Grasso, A.; Fiore, M.; Signorelli, S.S.; Zuccarello, P.; Conti, G.O. PAHs in seafood from the Mediterranean Sea: An exposure risk assessment. Food Chem. Toxicol. 2018, 115, 385–390. [Google Scholar] [CrossRef] [PubMed]
  47. Fasano, E.; Arnese, A.; Esposito, F.; Albano, L.; Masucci, A.; Capelli, C.; Cirillo, T.; Nardone, A. Evaluation of the impact of anthropogenic activities on arsenic, cadmium, chromium, mercury, lead, and polycyclic aromatic hydrocarbon levels in seafood from the Gulf of Naples, Italy. J. Environ. Sci. Health Part A 2018, 53, 786–792. [Google Scholar] [CrossRef] [PubMed]
  48. Arienzo, M.; Toscanesi, M.; Trifuoggi, M.; Ferrara, L.; Stanislao, C.; Donadio, C.; Grazia, V.; Gionata, D.V.; Carella, F. Contaminants bioaccumulation and pathological assessment in Mytilus galloprovincialis in coastal waters facing the brownfield site of Bagnoli, Italy. Mar. Pollut. Bull. 2019, 140, 341–352. [Google Scholar] [CrossRef] [PubMed]
  49. Lambiase, S.; Ariano, A.; Serpe, F.P.; Scivicco, M.; Velotto, S.; Esposito, M.; Severino, L. Polycyclic aromatic hydrocarbons (PAHs), arsenic, chromium and lead in warty crab (Eriphia verrucosa): Occurrence and risk assessment. Environ. Sci. Pollut. Res. 2021, 28, 35305–35315. [Google Scholar] [CrossRef]
  50. Baumard, P.; Budzinski, H.; Garrigues, P. Polycyclic aromatic hydrocarbons in sediments and mussels of the western Mediterranean sea. Environ. Toxicol. Chem. 1998, 17, 765–776. [Google Scholar] [CrossRef]
  51. Cinnirella, S.; Bruno, D.E.; Pirrone, N.; Horvat, M.; Živković, I.; Evers, D.C.; Johnson, S.; Sunderland, E.M. Mercury concentrations in biota in the Mediterranean Sea, a compilation of 40 years of surveys. Sci. Data 2019, 6, 205–211. [Google Scholar] [CrossRef] [Green Version]
  52. US-EPA. Guidance for Assessing Chemical Contamination Data for Use in Fish Advisories, Volume 2. Risk Assessment and Fish Consumption Limits; EPA/823-B94-004; Office of Science and Technology Office of Water U.S. Environmental Protection Agency: Washington, DC, USA, 2000. [Google Scholar]
  53. Grilli, F.; Accoroni, S.; Acri, F.; Aubry, F.B.; Bergami, C.; Cabrini, M.; Campanelli, A.; Giani, M.; Guicciardi, S.; Marini, M.; et al. Seasonal and Interannual Trends of Oceanographic Parameters over 40 Years in the Northern Adriatic Sea in Relation to Nutrient Loadings Using the EMODnet Chemistry Data Portal. Water 2020, 12, 2280. [Google Scholar] [CrossRef]
  54. Xu, S.; Chen, M.; Feng, T.; Zhan, L.; Zhou, L.; Yu, G. Use ggbreak to Effectively Utilize Plotting Space to Deal With Large Datasets and Outliers. Front. Genet. 2021, 12, 774846. [Google Scholar] [CrossRef]
  55. Navarra, S.; Carbonari, F.; Bambi, C. Ismea il Pesce a Tavola: Percezioni e Stili di Consumo degli Italiani, 2011. Ismea Mercati web site. Available online: https://www.ismea.it/flex/cm/pages/ServeAttachment.php/L/IT/D/f%252Fb%252F5%252FD.914a4f340b52602fcc38/P/BLOB%3AID%3D6191/E/pdf (accessed on 15 January 2022).
  56. Galgani, F.; Martínez-Gómez, C.; Giovanardi, F.; Romanelli, G.; Caixach, J.; Cento, A.; Scarpato, A.; Benbrahim, S.; Messaoudi, S.; Deudero, S.; et al. Assessment of polycyclic aromatic hydrocarbon concentrations in mussels (Mytilus galloprovincialis) from the Western basin of the Mediterranean Sea. Environ. Monit. Assess. 2010, 172, 301–317. [Google Scholar] [CrossRef] [Green Version]
  57. Rizzi, C.; Villa, S.; Chimera, C.; Finizio, A.; Monti, G. Spatial and temporal trends in the ecological risk posed by polycyclic aromatic hydrocarbons in Mediterranean Sea sediments using large-scale monitoring data. Ecol. Indic. 2021, 129, 107923. [Google Scholar] [CrossRef]
  58. Çelik, M.Y.; Karayücel, S.; Karayücel, I.; Öztürk, R.; Eyüboğlu, B. Meat Yield, Condition Index, and Biochemical Composition of Mussels (Mytilus galloprovincialis Lamarck, 1819) in Sinop, South of the Black Sea. J. Aquat. Food Prod. Technol. 2012, 21, 198–205. [Google Scholar] [CrossRef]
  59. Prato, E.; Danieli, A.; Maffia, M.; Biandolino, F. Lipid and Fatty Acid Compositions of Mytilus galloprovincialis Cultured in the Mar Grande of Taranto (Southern Italy): Feeding Strategies and Trophic Relationships. Zool. Stud. 2010, 49, 211–219. [Google Scholar]
  60. Bongiorno, T.; Iacumin, L.; Tubaro, F.; Marcuzzo, E.; Sensidoni, A.; Tulli, F. Seasonal changes in technological and nutritional quality of Mytilus galloprovincialis from suspended culture in the Gulf of Trieste (North Adriatic Sea). Food Chem. 2015, 173, 355–362. [Google Scholar] [CrossRef] [PubMed]
  61. Miura, K.; Shimada, K.; Sugiyama, T.; Sato, K.; Takami, A.; Chan, C.K.; Kim, I.S.; Kim, Y.P.; Lin, N.-H.; Hatakeyama, S. Seasonal and annual changes in PAH concentrations in a remote site in the Pacific Ocean. Sci. Rep. 2019, 9, 12591. [Google Scholar] [CrossRef] [PubMed] [Green Version]
  62. Yu, Q.; Ding, X.; He, Q.; Yang, W.; Zhu, M.; Li, S.; Zhang, R.; Shen, R.; Zhang, Y.; Bi, X.; et al. Nationwide increase of polycyclic aromatic hydrocarbons in ultrafine particles during winter over China revealed by size-segregated measurements. Atmos. Chem. Phys. 2020, 20, 14581–14595. [Google Scholar] [CrossRef]
  63. Guigue, C.; Tedetti, M.; Ferretto, N.; Garcia, N.; Méjanelle, L.; Goutx, M. Spatial and seasonal variabilities of dissolved hydrocarbons in surface waters from the Northwestern Mediterranean Sea: Results from one year intensive sampling. Sci. Total Environ. 2014, 466-467, 650–662. [Google Scholar] [CrossRef]
  64. Marini, M.; Frapiccini, E. Persistence of polycyclic aromatic hydrocarbons in sediments in the deeper area of the Northern Adriatic Sea (Mediterranean Sea). Chemosphere 2012, 90, 1839–1846. [Google Scholar] [CrossRef]
  65. Kodnik, D.; Carniel, F.C.; Licen, S.; Tolloi, A.; Barbieri, P.; Tretiach, M. Seasonal variations of PAHs content and distribution patterns in a mixed land use area: A case study in NE Italy with the transplanted lichen Pseudevernia furfuracea. Atmos. Environ. 2015, 113, 255–263. [Google Scholar] [CrossRef]
  66. Witt, G. Polycyclic aromatic hydrocarbons in water and sediment of the Baltic Sea. Mar. Pollut. Bull. 1995, 31, 237–248. [Google Scholar] [CrossRef]
  67. Frapiccini, E.; Marini, M. Polycyclic Aromatic Hydrocarbon Degradation and Sorption Parameters in Coastal and Open-Sea Sediment. Water Air Soil Pollut. 2015, 226, 246. [Google Scholar] [CrossRef]
  68. Guigue, C.; Tedetti, M.; Dang, D.H.; Mullot, J.-U.; Garnier, C.; Goutx, M. Remobilization of polycyclic aromatic hydrocarbons and organic matter in seawater during sediment resuspension experiments from a polluted coastal environment: Insights from Toulon Bay (France). Environ. Pollut. 2017, 229, 627–638. [Google Scholar] [CrossRef]
  69. Mathieu, A.; Lemaire, P.; Carriere, S.; Drai, P.; Giudicelli, J.; Lafaurie, M. Seasonal and Sex-Linked Variations in Hepatic and Extrahepatic Biotransformation Activities in Striped Mullet (Mullus barbatus). Ecotoxicol. Environ. Saf. 1991, 22, 45–57. [Google Scholar] [CrossRef]
  70. Marini, M.; Jones, B.H.; Campanelli, A.; Grilli, F.; Lee, C.M. Seasonal variability and Po River plume influence on biochemical properties along western Adriatic coast. J. Geophys. Res. Earth Surf. 2008, 113, C05S90. [Google Scholar] [CrossRef]
  71. Marini, M.; Campanelli, A.; Sanxhaku, M.; Kljajić, Z.; Betti, M.; Grilli, F. Late Spring Characterization of Different Coastal Areas of the Adriatic Sea. Acta Adriat. 2015, 56, 27–46. [Google Scholar]
  72. Dachs, J.; Bayona, J.M.; Raoux, C.; Albaigés, J. Spatial, Vertical Distribution and Budget of Polycyclic Aromatic Hydrocarbons in the Western Mediterranean Seawater. Environ. Sci. Technol. 1997, 31, 682–688. [Google Scholar] [CrossRef]
  73. Iacono, R.; Napolitano, E.; Palma, M.; Sannino, G. The Tyrrhenian Sea Circulation: A Review of Recent Work. Sustainability 2021, 13, 6371. [Google Scholar] [CrossRef]
  74. Marine Traffic Density Map. Available online: https://ec.europa.eu/maritimeaffairs/atlas/maritime_atlas/#lang=EN;p=w;bkgd=1;theme=2:0.75,5007:0.75;c=1417747.2062308616,4941995.124365145;z=6;e=t (accessed on 10 February 2022).
  75. Barale, V.; Dusart, J.; Assouline, M.; Niceta, F. European Atlas of the Seas: “A picture is worth a thousand words”. J. Coast. Conserv. 2017, 22, 105–113. [Google Scholar] [CrossRef] [Green Version]
  76. Pensa, A.; Pinton, A.; Vita, L.; Bonamico, A.; De Benedetti, A.A.; Giordano, G. Atlas of Italian Submarine Volcanic Structures. In Memorie Descrittive della Carta Geologica d’Italia; ISPRA—Servizio Geologico d’Italia: Rome, Italy, 2019; Volume 104. [Google Scholar]
  77. Saroni, A.; Sciarra, A.; Grassa, F.; Eich, A.; Weber, M.; Lott, C.; Ferretti, G.; Ivaldi, R.; Coltorti, M. Shallow submarine mud volcano in the northern Tyrrhenian sea, Italy. Appl. Geochem. 2020, 122, 104722. [Google Scholar] [CrossRef]
  78. Kozak, K.; Ruman, M.; Kosek, K.; Karasiński, G.; Stachnik, Ł.; Polkowska, Ż. Impact of Volcanic Eruptions on the Occurrence of PAHs Compounds in the Aquatic Ecosystem of the Southern Part of West Spitsbergen (Hornsund Fjord, Svalbard). Water 2017, 9, 42. [Google Scholar] [CrossRef] [Green Version]
  79. Remizovschi, A.; Carpa, R.; Forray, F.L.; Chiriac, C.; Roba, C.-A.; Beldean-Galea, S.; Andrei, A.-S.; Szekeres, E.; Baricz, A.; Lupan, I.; et al. Mud volcanoes and the presence of PAHs. Sci. Rep. 2020, 10, 1253. [Google Scholar] [CrossRef] [PubMed] [Green Version]
  80. Domingo, J.L. Nutrients and Chemical Pollutants in Fish and Shellfish. Balancing Health Benefits and Risks of Regular Fish Consumption. Crit. Rev. Food Sci. Nutr. 2014, 56, 979–988. [Google Scholar] [CrossRef] [PubMed]
  81. De Giovanni, A.; Giuliani, C.; Marini, M.; Luiselli, D. Methylmercury and Polycyclic Aromatic Hydrocarbons in Mediterranean Seafood: A Molecular Anthropological Perspective. Appl. Sci. 2021, 11, 11179. [Google Scholar] [CrossRef]
Figure 1. Geographical distribution of sampling sites (red dots). FAO geographical subareas are reported and colored based whether they belong to Adriatic (cadet blue), Ionian (royal blue) or Tyrrhenian Seas (turquoise).
Applsci 12 02776 g001
Figure 2. Bar plot showing the number of observations (x axis) by sea (i.e., Ionian, Adriatic, and Tyrrhenian Seas) in this database (y axis), with colors indicating the season in which sampling took place.
Applsci 12 02776 g002
Figure 3. Bar plot showing the number of observations (x axis) for each marine species present in this database (y axis). The bars are arranged in ascending order of number of observations, by taxonomic class. On top of each bar, in brackets, is the number of sources from which the above observations were obtained. Each color corresponds to the taxonomic class of the species. Species codes are on the X-axis and are made of the first three letter of genus and species. The graph was realized using ggbreak library (version 0.0.7) in R [54].
Applsci 12 02776 g003
Figure 4. PAHs concentration (mg/kg wet weight) by molecular weight in (a) Mediterranean mussel, (b) Manila clam, (c) common sole, and (d) red mullet. Sample sizes are in brackets; outliers not shown.
Applsci 12 02776 g004
Figure 5. Comparison of PAHs concentrations (mg/kg wet weight) in cold and warm months in (a) Mediterranean mussel, (b) Manila clam, and (c) red mullet; sample sizes are in brackets; outliers not shown.
Applsci 12 02776 g005aApplsci 12 02776 g005b
Figure 6. Boxplots showing the THQs distribution in several marine species included in this database. Species codes are on the X-axis and are made of the first three letter of genus and species. Boxplots are in ascending order from left to right, based on median values; outliers not shown.
Applsci 12 02776 g006
Table 1. Maximum levels for PAHs in seafood, set by EU in 2011 [11]. Concentrations are expressed in mg/kg.
FoodstuffsMaximum Levels for BaP (mg/kg)Maximum Levels for PAH4 1 (mg/kg)
Muscle meat of smoked fish and smoked fishery products0.0020.012
Bivalve mollusks (fresh, chilled or frozen)0.0050.030
Bivalve mollusks (smoked)0.0060.035
1PAH4 sum of BaA, Chr, BbF and BaP.
Table 2. Summary statistics on LMW (low molecular weight), MMW (middle molecular weight) and HMW (high molecular weight) PAHs in Mediterranean mussel, Manila clam, common sole and red mullet caught in the Adriatic, Ionian and Tyrrhenian Seas. Concentrations are in mg/kg wet weight.
SpeciesPAHs Class 1Cmean 2Cmin 3Cmax 4
Mytilus galloprovincialisLMW0.009420.000003.96000
MMW0.010680.000001.05960
HMW0.005700.000000.34500
Ruditapes philippinarumLMW0.001370.000000.03770
MMW0.001970.000410.00810
HMW0.000580.000000.00690
Solea soleaLMW0.000790.000060.01000
MMW0.001890.000090.01037
HMW0.009140.000000.73500
Mullus barbatusLMW0.010300.000110.09385
MMW0.002990.000420.01050
HMW0.000900.000000.00539
1PAHs class—class of PAHs based on molecular weight, 2Cmean—mean concentration, 3Cmin—minimum concentration, 4Cmax—maximum concentration.
Table 3. Summary statistics on LMW (low molecular weight), MMW (middle molecular weight) and HMW (high molecular weight) PAHs in Mediterranean mussel, Manila clam and red mullet caught in different seasons in Adriatic, Ionian and Tyrrhenian Seas. Concentrations are in mg/kg wet weight; sampling depth is in meters.
SpeciesPeriodPAHs Class 1Cmean 2Cmin 3Cmax 4Depthmin 5Deptmax 6Yearmin 7Yearmax 8
Mytilus galloprovincialisAutumn/WinterLMW0.004340.000000.180900.0077.6019952018
MMW0.012920.000000.960000.00118.8019952018
HMW0.005120.000000.345000.00118.8019952018
Spring/SummerLMW0.011550.000003.960000.00108.0019812017
MMW0.009080.000001.059600.00108.0019812017
HMW0.006010.000000.180400.00108.0019812017
Ruditapes philippinarumAutumn/WinterLMW0.001770.000000.03770--20052013
MMW0.002280.000800.00770--20052013
HMW0.000660.000000.00690--20052013
Spring/SummerLMW0.000870.000000.00890--20012014
MMW0.001600.000410.00810--20012014
HMW0.000470.000000.00600--20012014
Mullus barbatusAutumn/WinterLMW0.006490.000160.09265707020042019
MMW0.003150.000420.01050707020042019
HMW0.000880.000000.00539707020042019
Spring/SummerLMW0.014770.000110.09385707020042019
MMW0.003340.000600.00749707020042019
HMW0.001180.000000.00536707020042019
1PAHs class—class of PAHs based on molecular weight, 2Cmean—mean concentration, 3Cmin—minimum concentration, 4Cmax—maximum concentration, 5Depthmin—minimum sampling depth, 6Depthmax—maximum sampling depth, 7Yearmin—year of the first sampling campaign, 8Yearmax—year of the last sampling campaign.
Table 4. Summary statistics on LMW (low molecular weight), MMW (middle molecular weight) and HMW (high molecular weight) PAHs in Mediterranean mussels caught in different seasons along the Italian coast of the Adriatic Sea. Concentrations are in mg/kg wet weight; sampling depth is in meters; latitude are in decimal degrees. Reported statistics were calculated after missing-data removal from concentration, sampling depth, sampling year and latitude columns.
PeriodPAHs Class 1Cmean 2Cmin 3Cmax 4Depthmin 5Depthmax 6Yearmin 7Yearmax 8Latmin 9Latmax 10
Autumn/WinterLMW0.004630.000020.180901.2024.802006200941.6045.76
MMW0.005910.000150.110101.2024.802005200941.6045.76
HMW0.003820.000020.345001.2024.802005200941.6045.76
Spring/SummerLMW0.010930.000001.155000.0135.002006201140.2045.77
MMW0.003960.000030.037800.0130.602005201740.2045.77
HMW0.002090.000000.031500.0130.602005201740.2045.77
1PAHs class—class of PAHs based on molecular weight, 2Cmean—mean concentration, 3Cmin—minimum concentration, 4Cmax—maximum concentration, 5Depthmin—minimum sampling depth, 6Depthmax—maximum sampling depth, 7Yearmin—year of the first sampling campaign, 8Yearmax—year of the last sampling campaign, 9Latmin—minimum latitude of sampling sites, 10Latmax—maximum of sampling sites.
Table 5. Summary statistics on LMW (low molecular weight), MMW (middle molecular weight) and HMW (high molecular weight) PAHs in Mediterranean mussels caught in different seasons in the Tyrrhenian Sea. Concentrations are in mg/kg wet weight; sampling depth is in meters; latitude are in decimal degrees. Reported statistics were calculated after missing data removal from concentration, sampling depth, sampling year and latitude columns.
PeriodPAHs Class 1Cmean 2Cmin 3Cmax 4Depthmin 5Depthmax 6Yearmin 7Yearmax 8Latmin 9Latmax 10
Autumn/WinterLMW0.004340.000000.120000.1049.021999201738.5443.50
MMW0.026490.000000.960000.1049.021999201738.5443.50
HMW0.009530.000000.202370.1049.021999201738.5443.50
Spring/SummerLMW0.006850.000000.200000.19108.001981201738.5444.42
MMW0.012340.000001.059600.19108.001981201738.9744.42
HMW0.007660.000000.180400.19108.001981201738.5444.42
1PAHs class—class of PAHs based on molecular weight, 2Cmean—mean concentration, 3Cmin—minimum concentration, 4Cmax—maximum concentration, 5Depthmin—minimum sampling depth, 6Depthmax—maximum sampling depth, 7Yearmin—year of the first sampling campaign, 8Yearmax—year of the last sampling campaign, 9Latmin—minimum latitude of sampling sites, 10 Latmax—maximum of sampling sites.
Publisher’s Note: MDPI stays neutral with regard to jurisdictional claims in published maps and institutional affiliations.

