1. Introduction
The Pannonian basin and its peripheral basins are an integral part of the Alpine orogenic system and were formed during the Miocene. Convergence between the Eurasian and Nubian plates generated a back-arc extensional environment, where orogenic terranes were disintegrated [
1,
2]. During the deformational processes, the formation of extensional half-grabens and pull-apart basins has been diachronously accelerated in the western and eastern parts [
3,
4,
5]. The heat flow together with the asthenospheric dome was elevated as high as 50–60 km beneath the central part of the Pannonian basin [
2,
6,
7,
8,
9]. The tectonic inversion changed the surface relief, and thus controlled the gravity-driven flow systems in the basin fill. The Pannonian basin’s heat flow value ranges from 50 to 130 mW·m
−2, and its mean value is about 100 mW·m
−2 [
6,
10]. The temperature gradient varies between 40 and 50 K/km in the upper 5 km [
11].
Geothermal exploration requires several controlling parameters like flow rate, fluid temperature, and water flow system. The third parameter is related to gravity-driven flows in porous Neogene sediments with a thickness of about 2 km [
6] and overpressure-driven flow in the pre-Cenozoic basement or Early/Middle Miocene sediments [
12]. This basin is the most promising geothermal prospect in Central Europe.
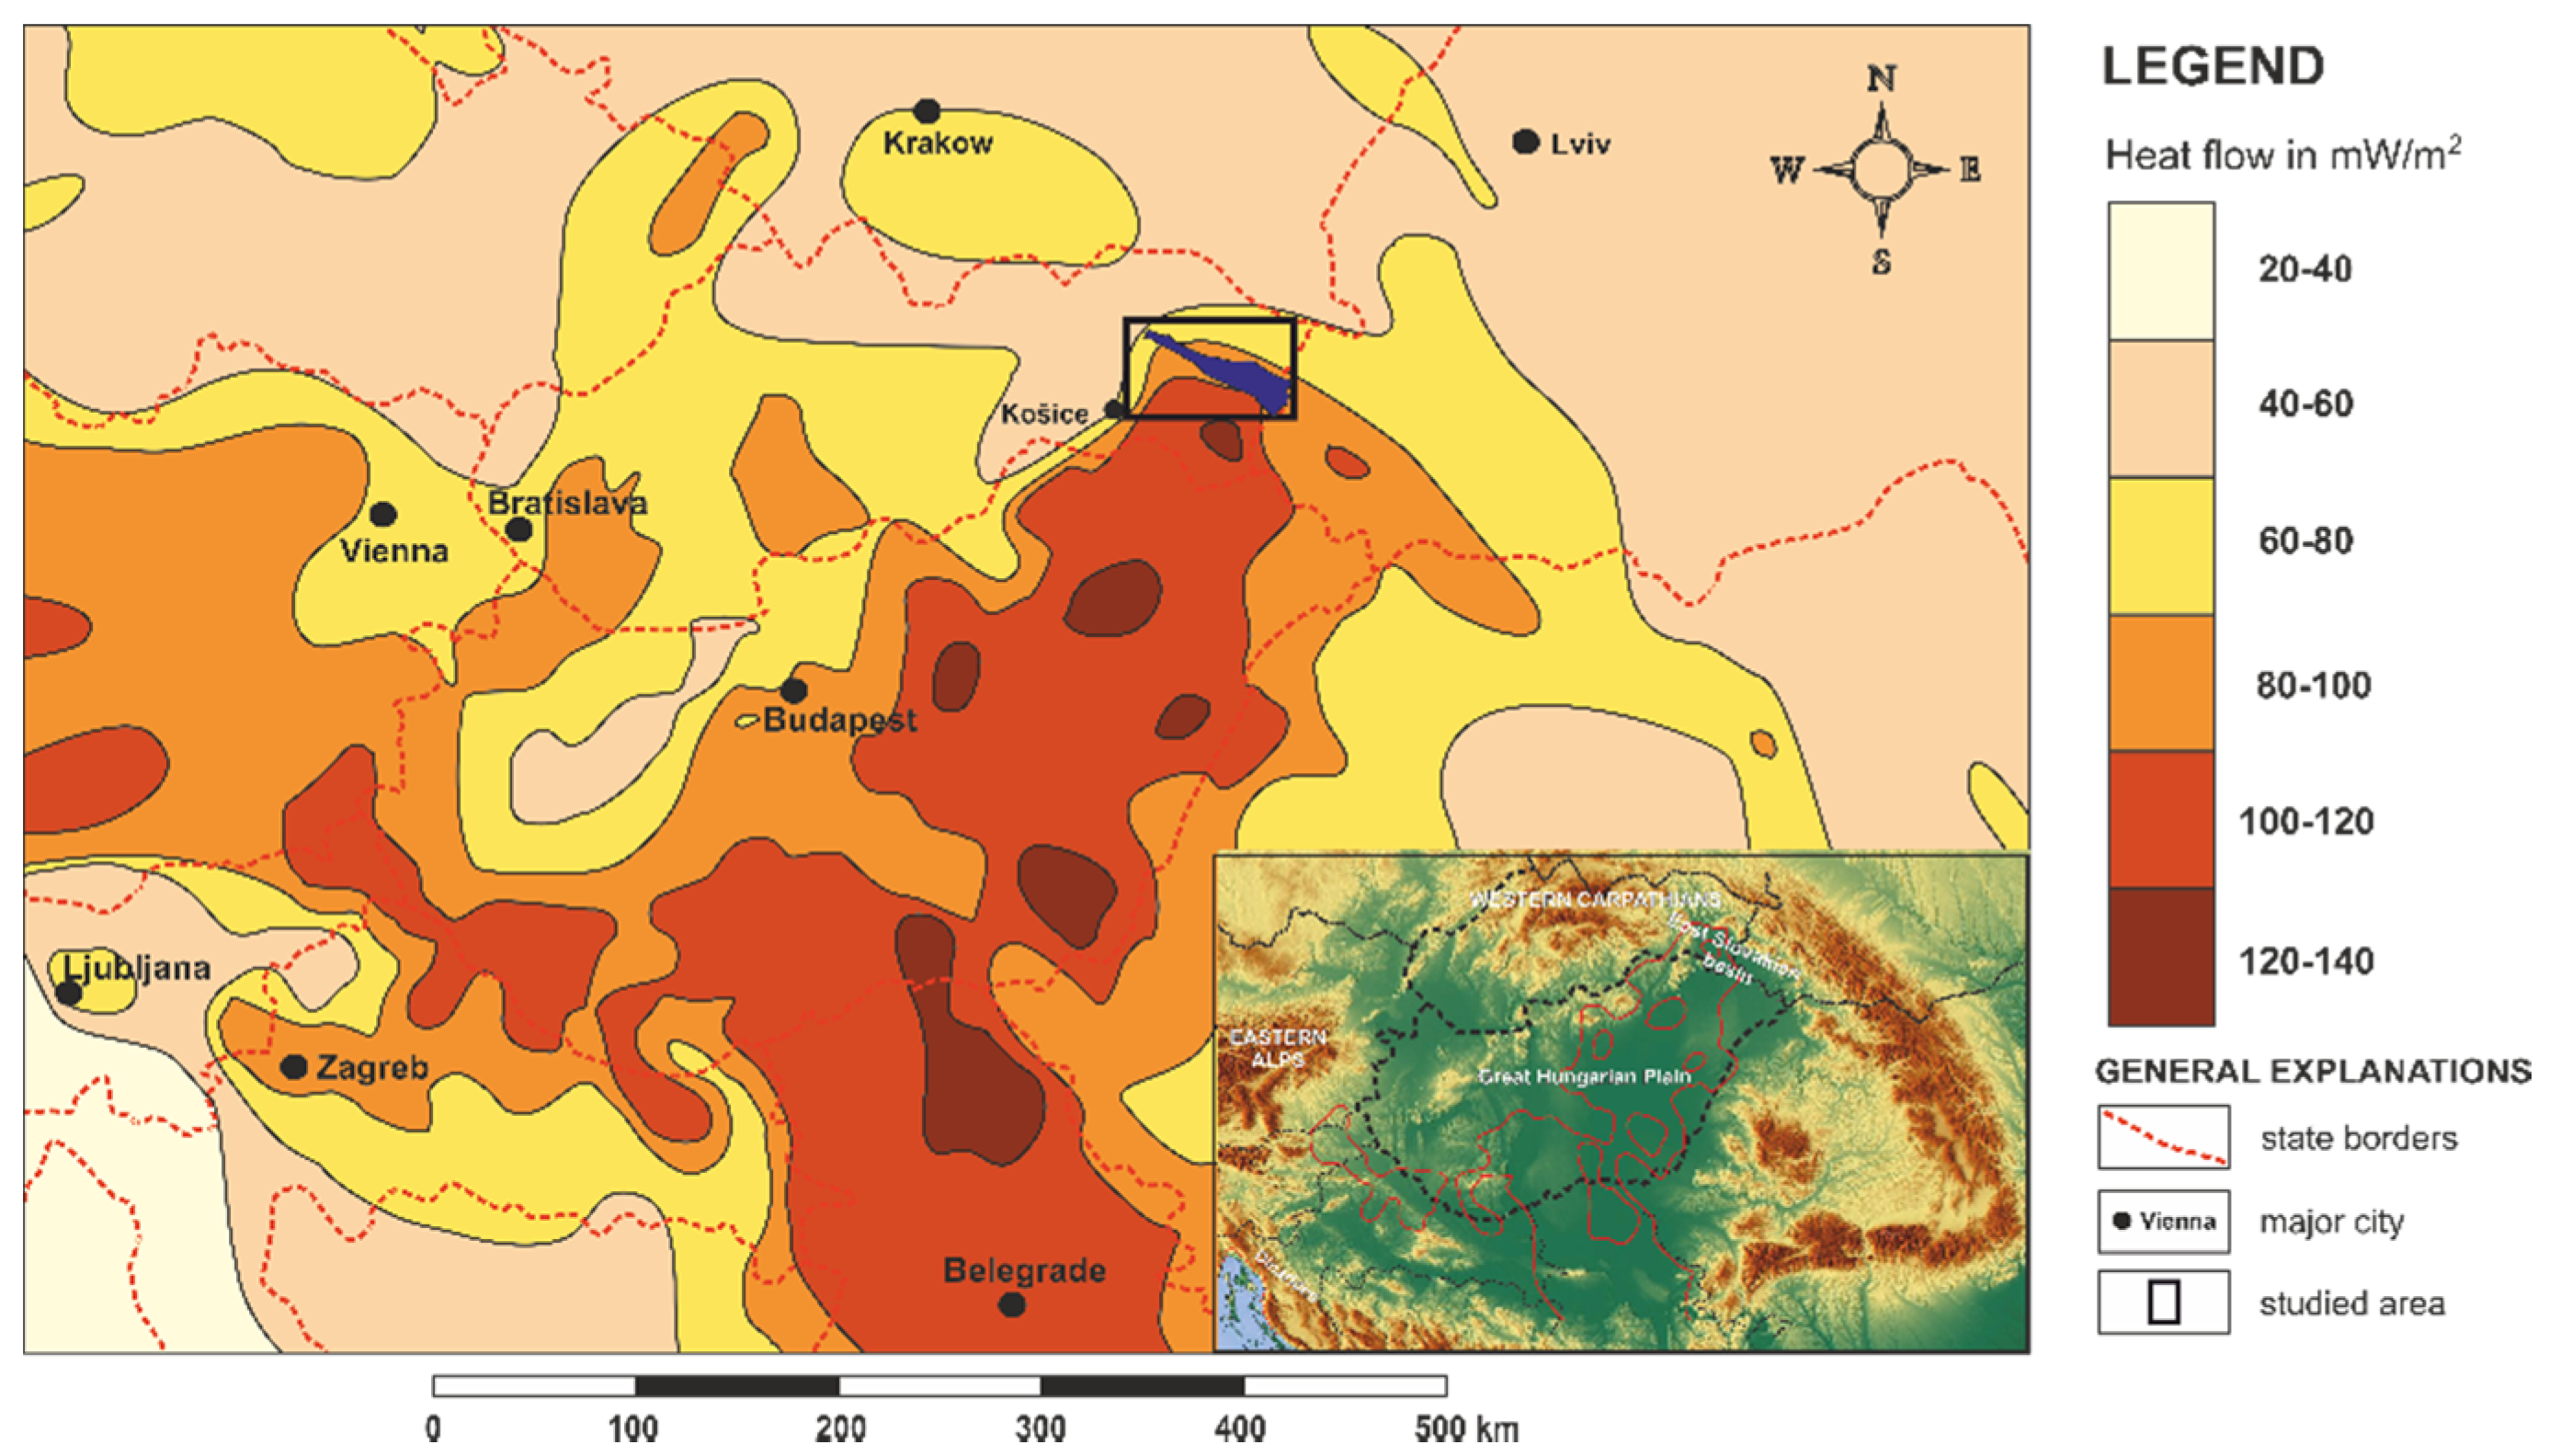
The basin’s evolution is related to peripheral basins that have developed surrounding it. On the northern edge, at the contact of an accretionary zone between the Outer Western Carpathians and the Inner Western Carpathians, the Eastern Slovak Basin (ESB) was opened. The ESB is an asymmetric basin with a depth of 9 km in the southeast. During the Miocene, the basin covered a relatively small area, which was characterized by dynamic subsidence of the basin. The sedimentation was accompanied by intensive volcanic activity around the basin. The heat flow value ranges from 100 to 125 mW·m
−2 [
13,
14,
15,
16] and temperature gradient varies between 40 and 52 K/km in the upper 3 km [
17] (
Figure 1). The water flow system is different compared to the Pannonian basin. The porous Neogene sedimentary layers of the ESB are less dominant. There are two pre-Cenozoic basement units (the Iňačovo–Kričevo unit and the Humenné unit) which are hydraulically different potential aquifers. Their spatial position was confirmed by hydrocarbon trap exploration. The Iňačovo–Kričevo basement unit was not a part of this study.
Only a localized section of the Humenné Mesozoic Unit, 9.5% of the unit, occurs on the surface at the horst of the Humenné Mountains. A large part (978 km2) is located below the surface.
The Humenné Mesozoic Unit is formed by carbonates of the Middle Triassic to the Middle Cretaceous. It represents a Paleoalpine unit, that has gone through several deformation stages and its structure is significantly different within the Western Carpathians. The difference lies in that in this region, the unit dips in the opposite direction and has a different geological composition compared to other areas [
19]. The geological survey of the Humenné Mesozoic unit is based on several drilling and geophysical works.
When exploring the geothermal energy of Slovakia, the horst of the HumennéMountains was defined as a prospective hydro-geothermal structure. The first use of hot springs in this area was in Sobrance Spa, the first record of which is from 1336. The geothermal water springs in the area of the spa were discovered by shallow boreholes with a depth of 120–400 m and verified by one 823 m deep borehole. The water temperature from the wells is in the range of 19.5–29.5 °C with the yield value of 1.2 L·s
−1 [
20]. The waters are related to the Triassic carbonates.
The heat flow of the Humenné Unit ranges from 75 to 85 mW·m
−2 in the northwestern part of the territory and reaches up to 95 mW·m
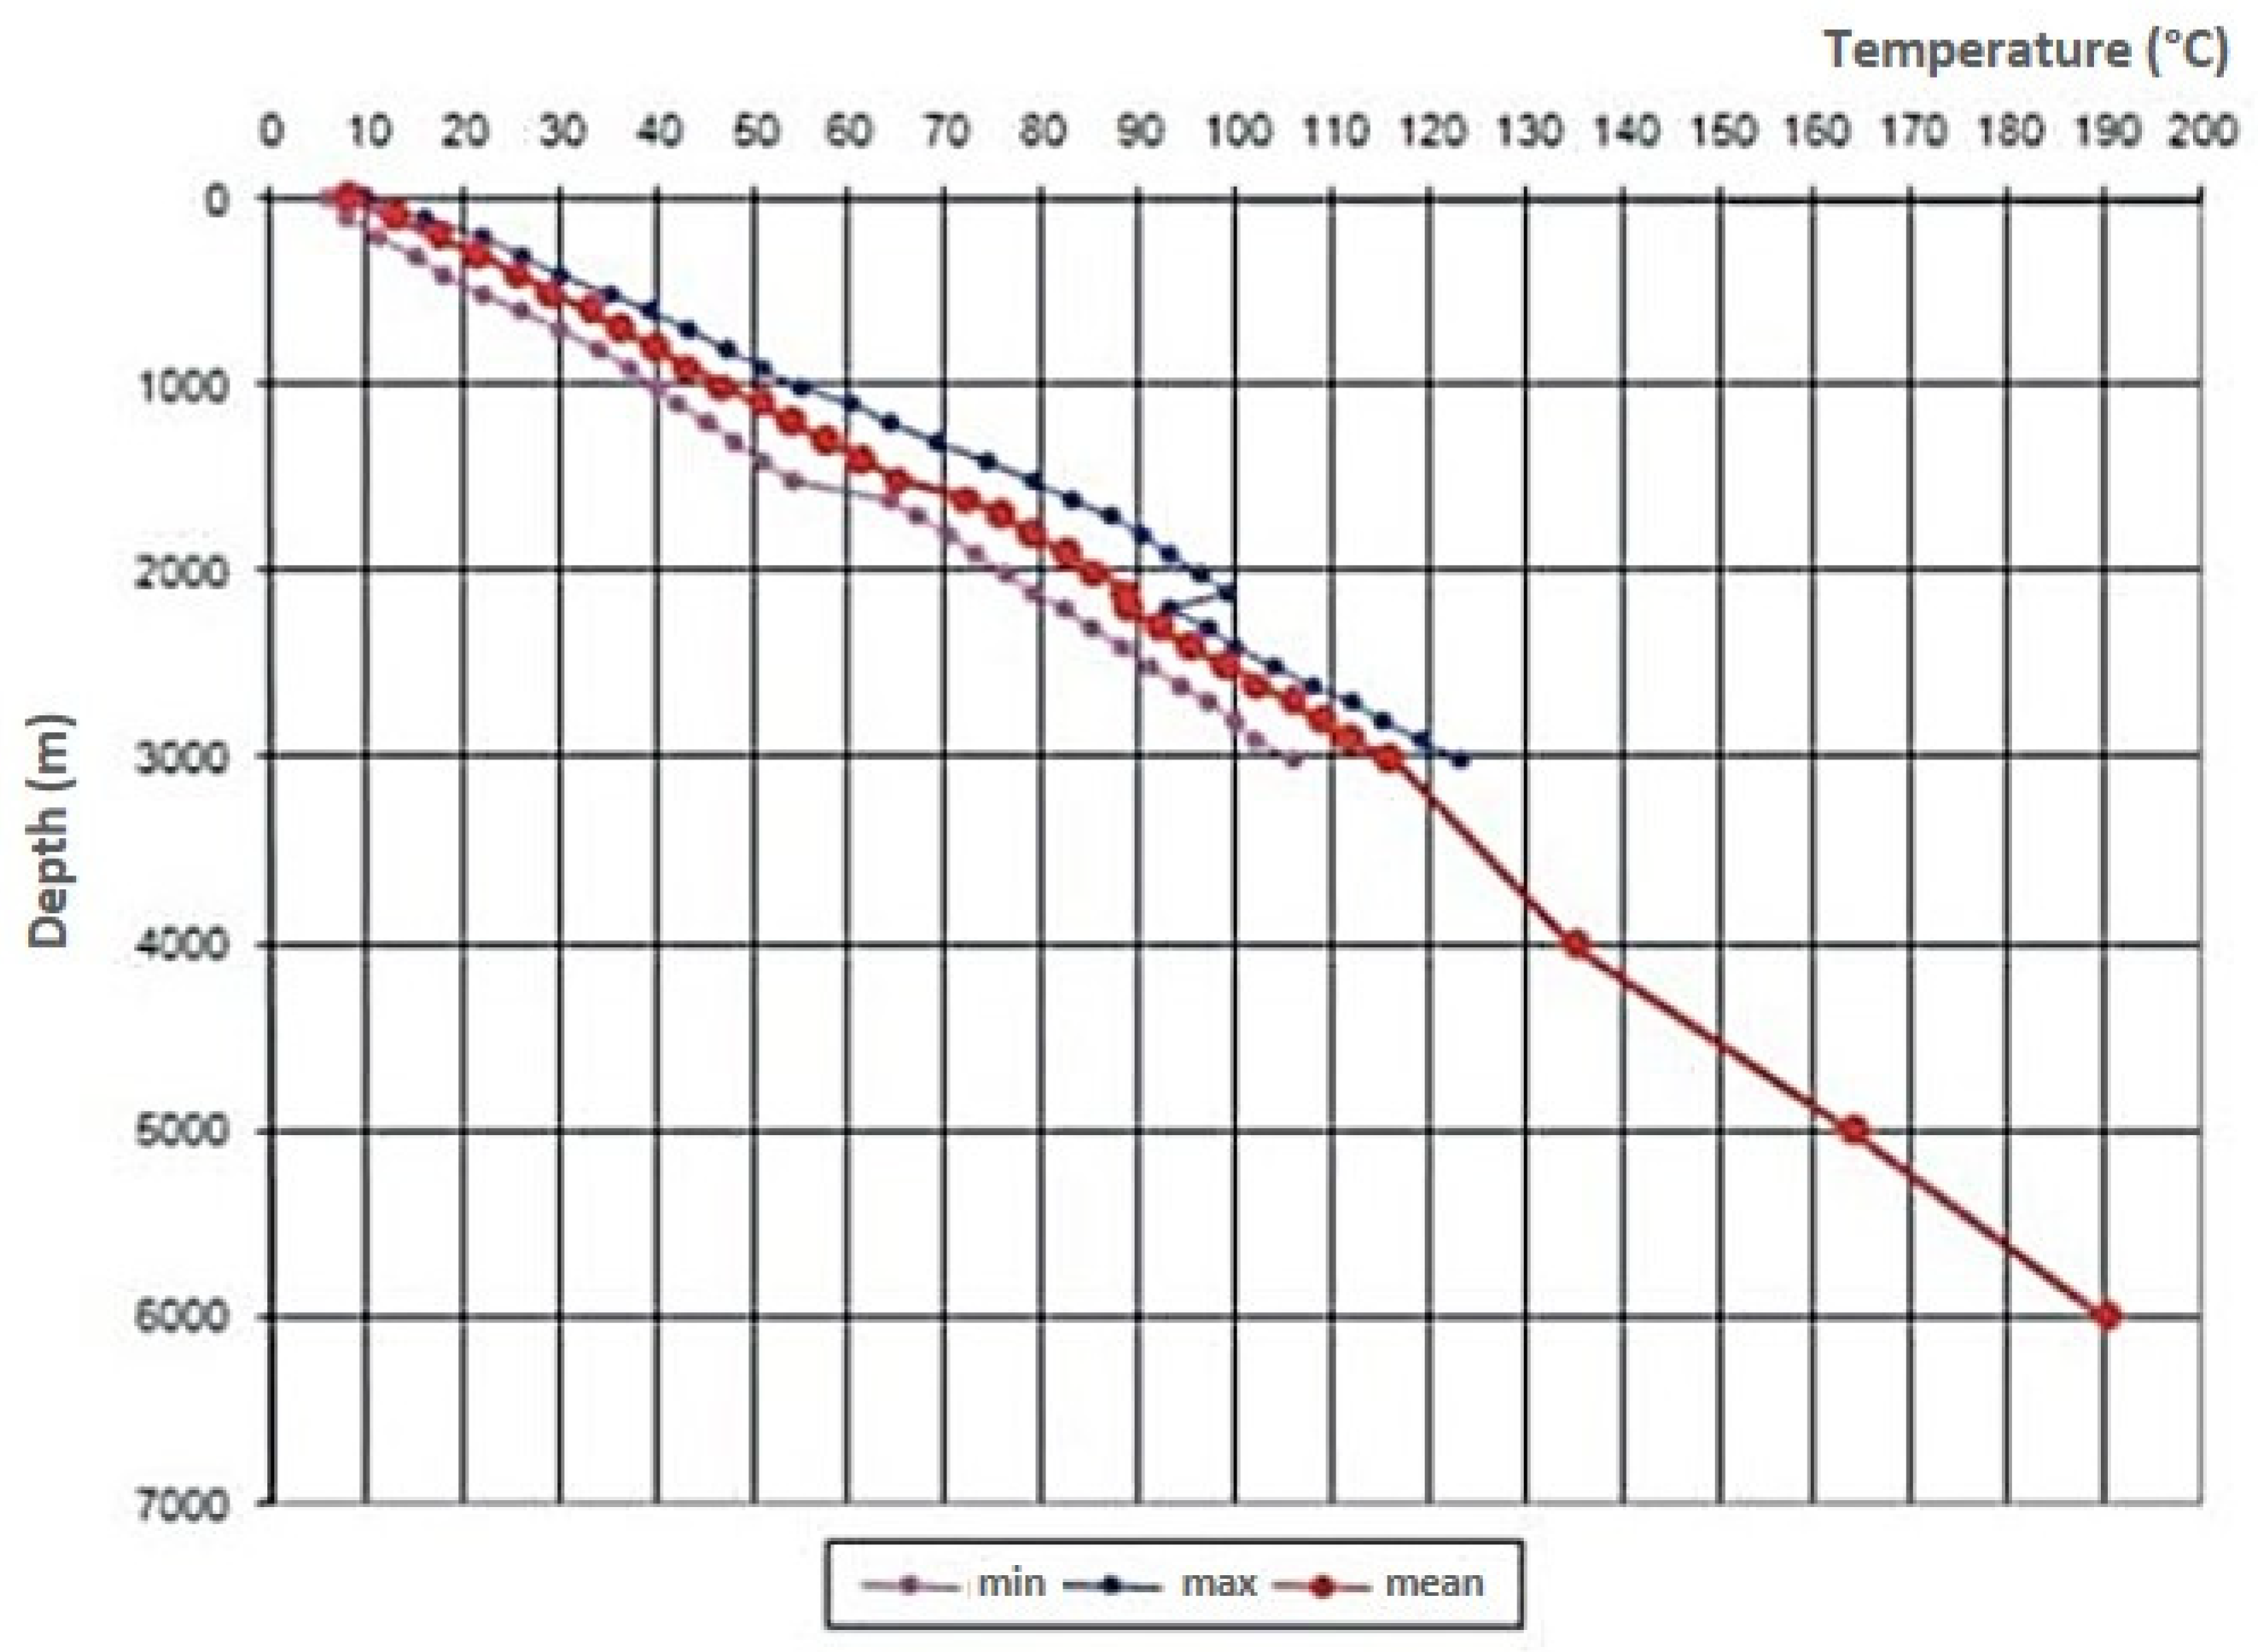
−2 in the southeastern part. The temperature field reflects the cooling effect of the elevation of the Humenské Mountains. At a depth of 1000 m, the Humenské Mountains are surrounded by a 40 °C isotherm. With the decreasing influence of the mountain uplift, the temperature rises on all sides up to 45 °C, and up to 50–55 °C toward the southeast. At a depth of 2000 m, temperatures range from 70 to 95 °C [
21]. The average temperature gradient in the interval of 0 to 1000 m is about 39 K/km. For a depth interval of 1000–2000 m, it is about 36 K/km. For a depth of 2000–3000 m, the average temperature gradient is 33.8 K/km with an average temperature at a depth of 3000 m of approximately 117 °C [
22].
The hydro-geothermal exploration of the area of interest is low in comparison with other prospective areas of Slovakia. When considering the variability of geological structures as well as geophysical and hydrogeological rock properties, a universal approach on how to identify deep geothermal structures does not exist. In practice, deep geothermal structures [
17] are most commonly identified by using seismic methods (such as hydrocarbon prospection). In this article, we summarize the first results of a multigeophysical exploration of the Humenné Unit, where seismic, gravimetric, and geoelectric measurements were taken and compared. Geophysical results were compared with deep borehole data supplemented by detailed geological mapping and the results of hydrocarbon exploration. The goal of this article is also to determine the viability of the employed methods for the exploration of geothermal aquifers.
Carbonate environments are the most common geothermal aquifers in the world. Their geophysical properties are the most variable and depend on structural inhomogeneity, karstification, density, rheological contrast with surrounding, fluid contamination, etc. The multi-geophysical method approach could be used for geothermal exploration when more data sources are needed. It would reduce exploration failure rate.
2. Geological Settings
The geodynamic development of the Western Carpathians significantly influenced the structure and tectonic development of the Humenné Unit. The position of the Humenné Unit as the easternmost segment of the Inner Western Carpathians is the result of the Alpine orogenic cycle [
23]. The unit was deformed and modified several times, which has been reflected in its tectonic as well as lithological structure. Like all the Paleoalpine units of the Western Carpathians, the Humenné Unit was thrust northward during the Upper Cretaceous. However, no fragments of this Upper Cretaceous deformation stage are preserved in the current structure. Based on the lithological composition, the unit as a whole was detached from the base of the Middle Triassic Gutenstein limestones. The older members of the unit (Lower Triassic) remained in the dorsal part of the nappe. It is indisputable that the most significant tectonic impact in the Humenné Unit occurred during the Neogene development, when the unit was repeatedly (southwardly) overthrusted and broken up into blocks [
24].
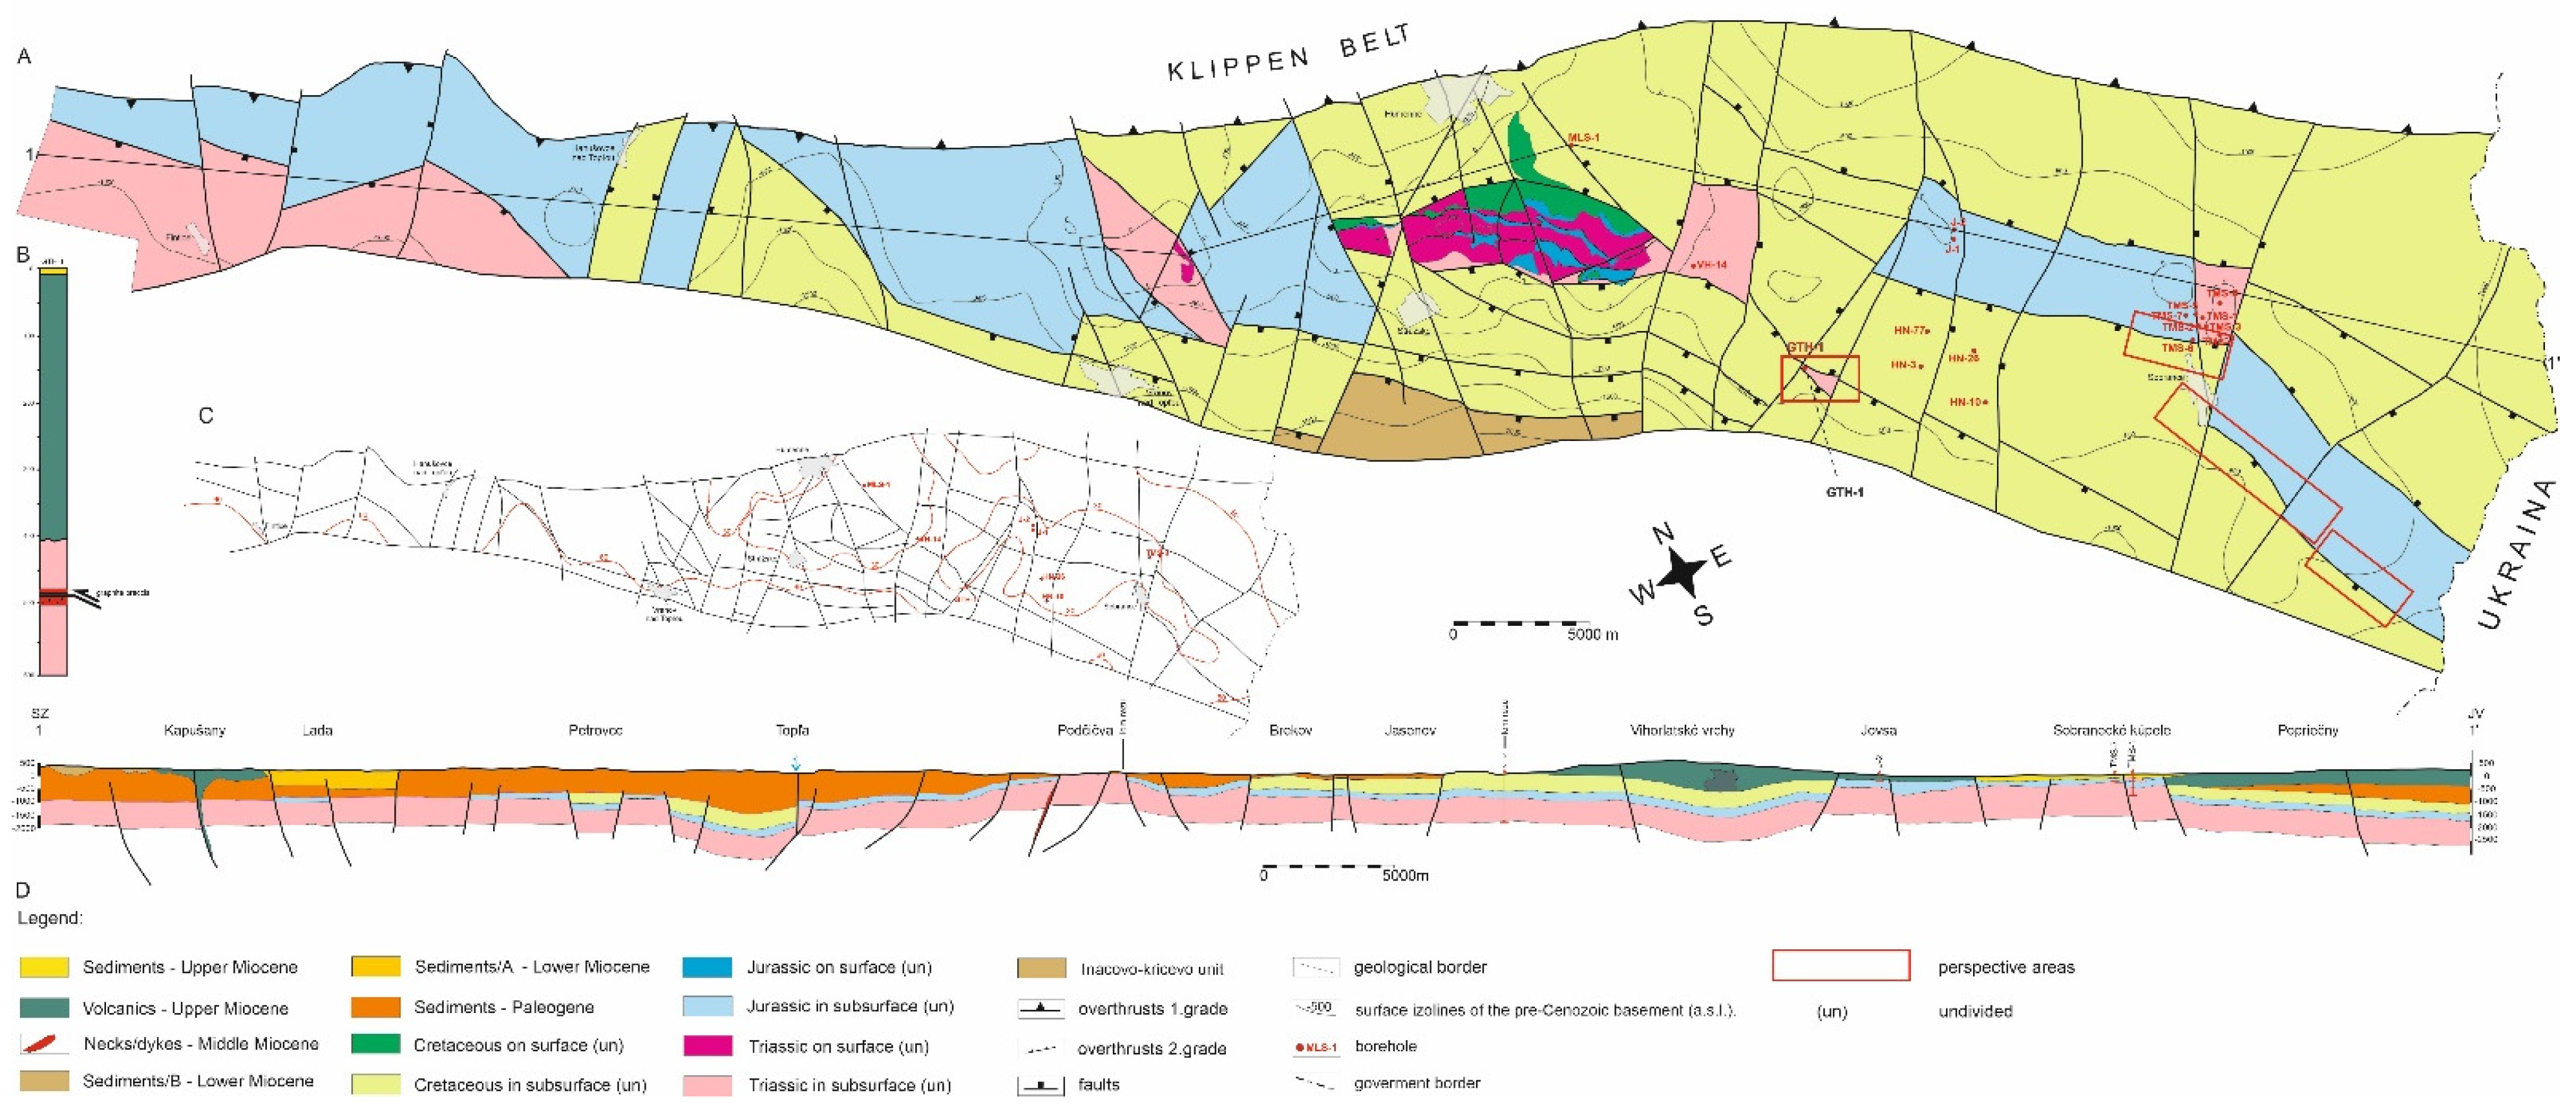
In the present, the unit is situated over the buried Iňačovo–Kričevo Unit and overlaid by Paleogene/Neogene sedimentary sequences and Neogene volcanics. The internal structure consists of Mesozoic sediments (Middle Triassic–Middle Cretaceous) which are represented as an eastward continuation of the Western Carpathians (
Figure 2). Lithologically, the Middle Triassic limestones are characterized by intensive shallow-water carbonate sedimentation (Gutenstein limestones, Ramsau dolomites, and pale limestones) with thickness up to 250 m. The overlying Jurassic marly-sandy shales, shallow-water crinoidal limestones, and marly limestones are only partially represented. The Jurassic formations are conformably overlain by the Lower–Middle Cretaceous limestones with chert stone nodules and dark grey sandy limestones. The estimated thickness of the Cretaceous sediments is about 300 to 400 m. The Humenné Unit is overlain by transgressive Paleogene sedimentary sequences such as conglomerates and breccias as well as Neogene volcanic sedimentary complexes (where andesites and marls dominate).
The Humenné Unit’s deformation had an impact on layer thickness and geophysical rock properties [
24,
25]. Strong rock failure and an imbricate structure with alternating carbonates and pelitic rocks are also reflected in the hydrogeological conditions of the area. The flow and accumulation of groundwater in the Humenské Mountains are affected by their imbricate structure. They are also affected by a fault system that divides the Mesozoic blocks into partial structures which are either elevated or depressed. These depressed or elevated depositions of Triassic carbonates are collectors of thermal waters. The infiltration area of the geothermal waters of the Humenné Unit is represented by the Humenské Mountains and neovolcanics of the Vihorlatské Mountains. Much of the groundwater crosses into the Quaternary and Neogene sediments. Part of the intermediate and regional groundwater flow, which occurs in lava flows and tectonic faults, contributes to the formation of geothermal waters. Likewise, part of the groundwater from Neogene sediments can transfer to the Mesozoic collector under favorable geological–tectonic conditions [
26].
The geothermal aquifer in the Humenné Unit has a fracture and a fracture-karstic permeability and contains two chemical groundwater types. The first type is hydrogen carbonate groundwater with TDS 0.83–0.84 g·L
−1, which is tied to the southeastern edge of the unit. The aquifer is made up of Triassic carbonates with carbonate to carbonate–sulfatogenic mineralization, with a limited marinogenic mineralization effect. Carbonate coefficient values rHCO
3/rCl = 6.90r confirm an open hydrogeological structure. The second type is groundwater containing chlorides and sulfates with TDS 10–13 g·L
−1. This type shows significant impact from marinogenic mineralization. According to the coefficient values Cl/Br (2570) and a Na–Cl predominance, the groundwaters have a prevailing halite mineralization. Halite mineralization is related to the Eastern Slovak basin’s evolution. Carbonate coefficient values rHCO
3/rCl = 0.12 a 0.17 indicate a slightly permeable hydrogeological structure [
22].
3. Methods and Material
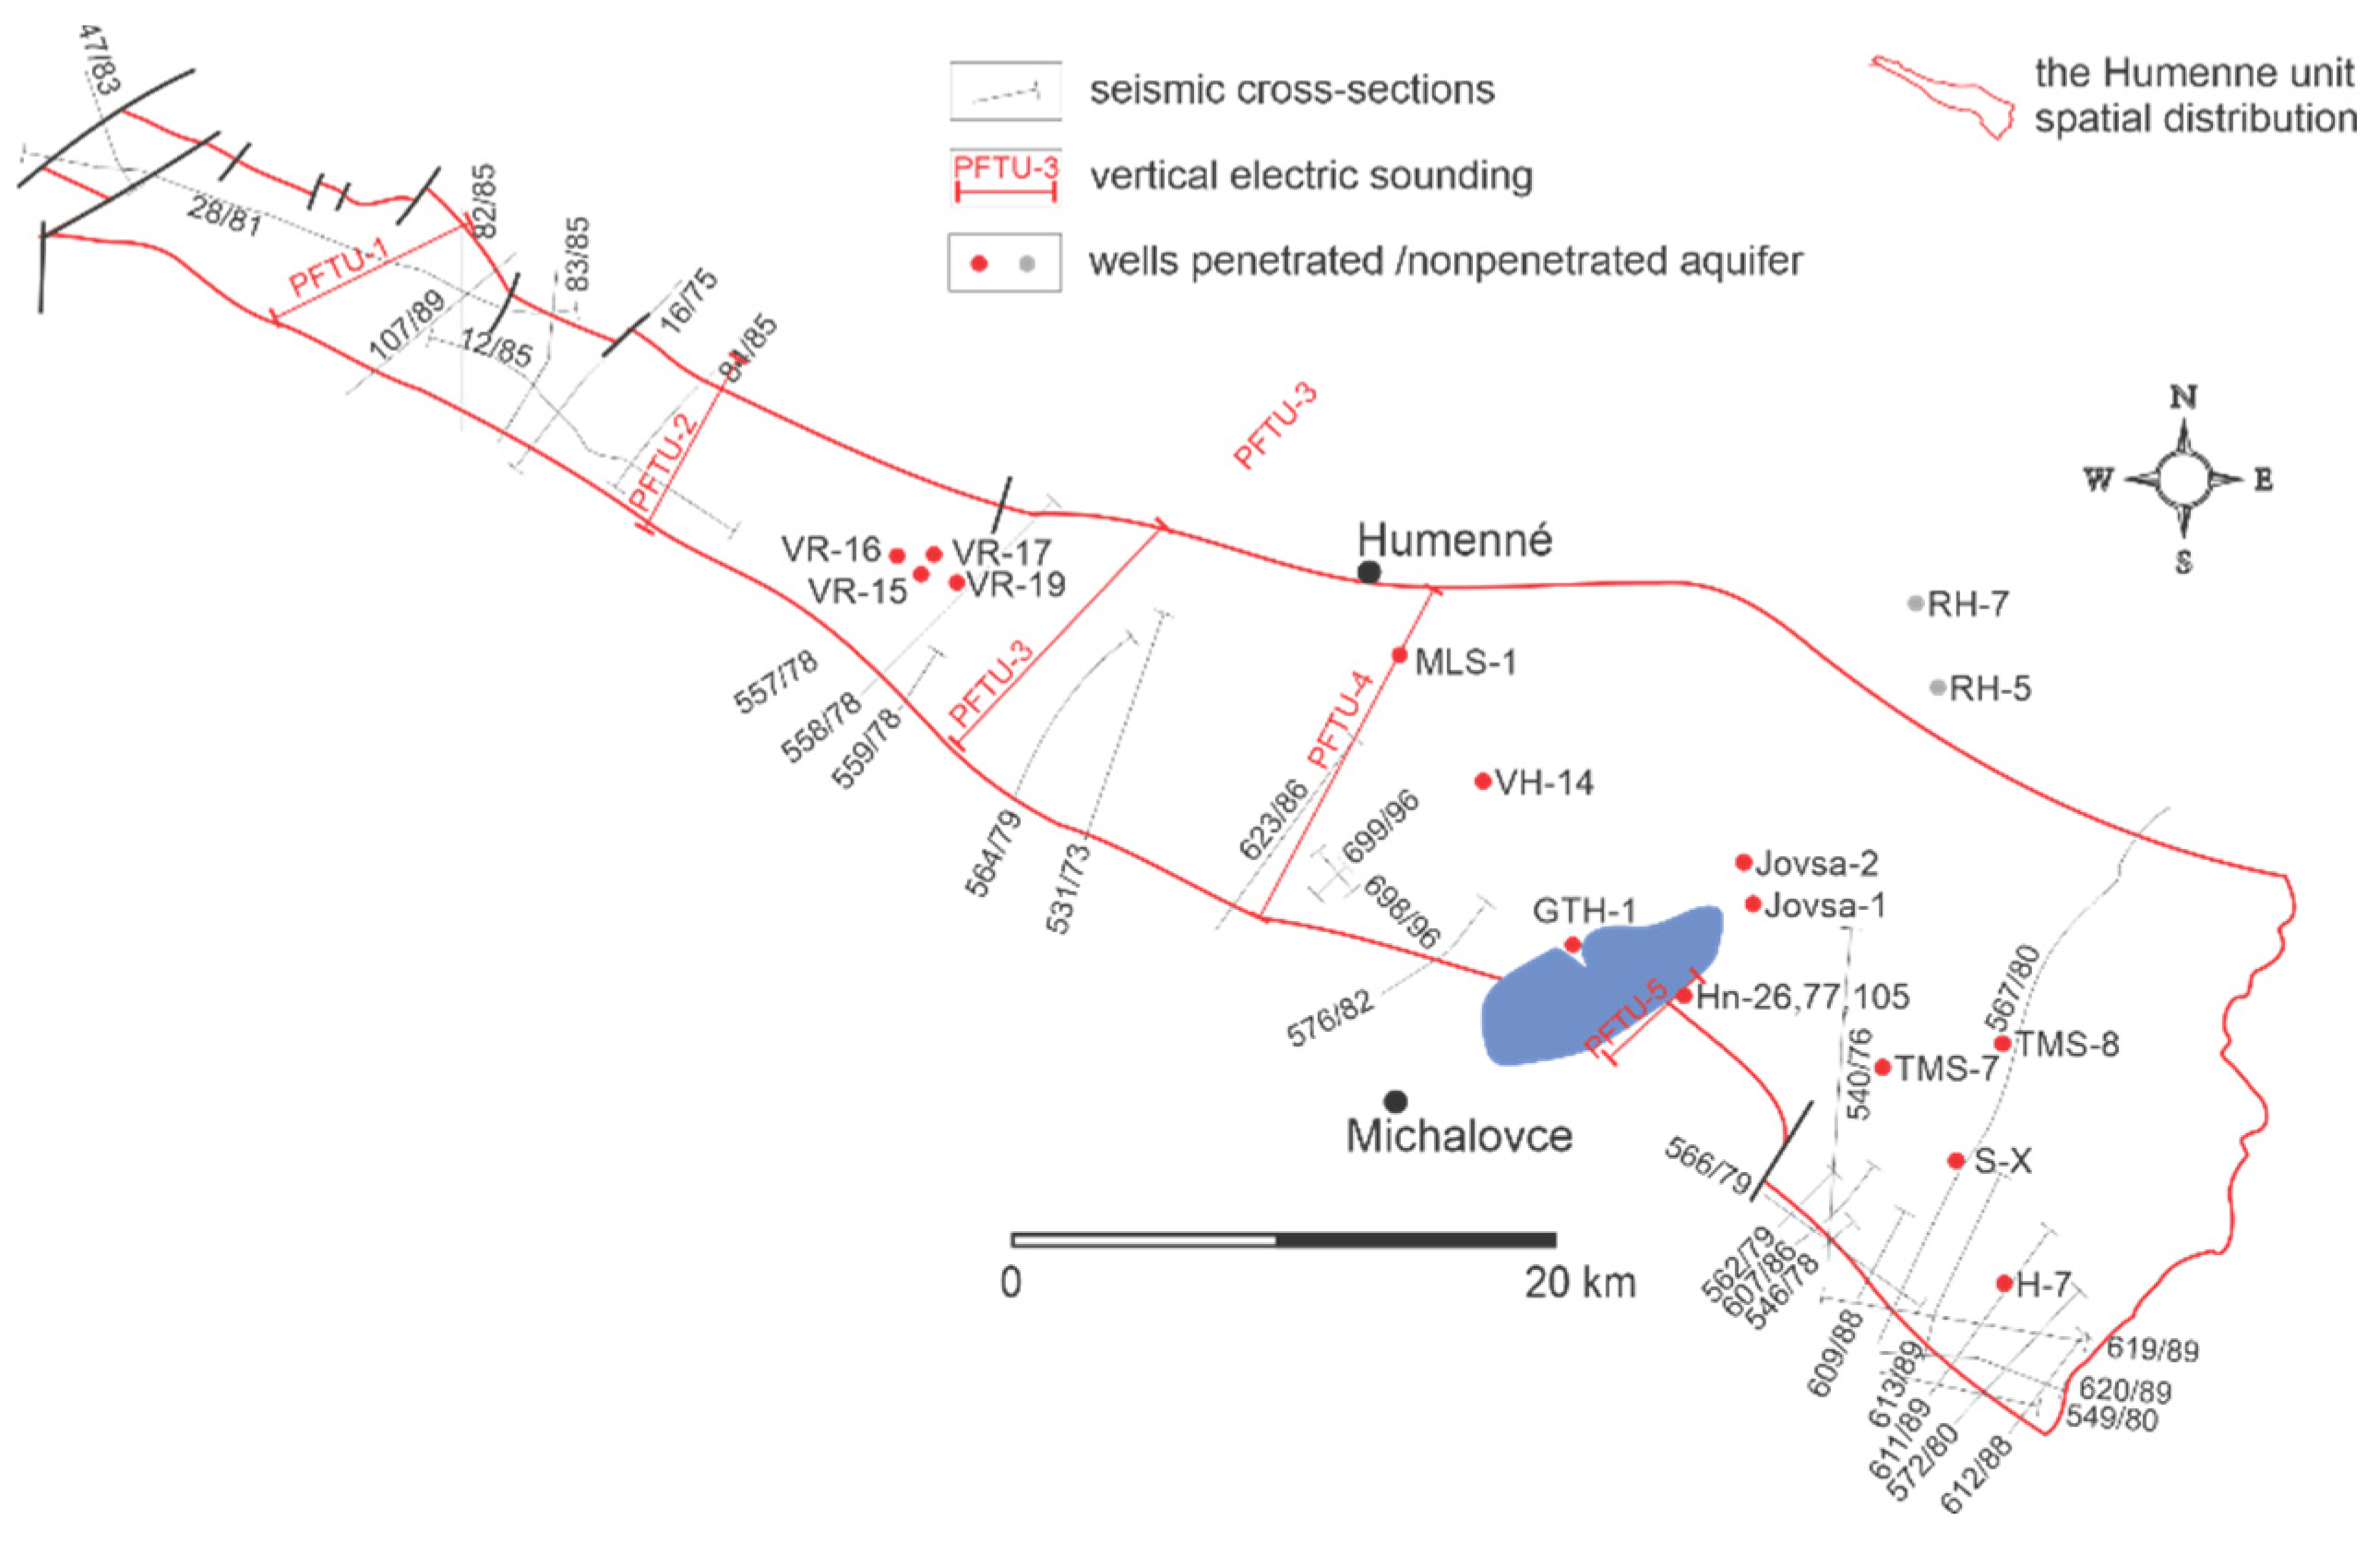
Research on potential geothermal areas is often based on the results of geophysical surveys. The choice of a suitable geophysical method must be based on the assumed geological–hydrogeological data. However, a significant factor in method selection is the cost of geophysical method services. For this purpose, a comprehensive approach was chosen, which made it possible to compare several methods of geophysical survey (
Figure 3). A wide range of data based on geological mapping, boreholes data, and xenolith investigation was used in the study of the Humenné Unit.
3.1. Geological Mapping
Geological mapping conducted at a scale of 1:10,000 within the horst of the Humenské Mountains confirmed its complex tectonic pattern. It is characterized by a significant shortening of Mesozoic sedimentary sequences, which caused the formation of the scaly structure of the Humenné Unit. This confirms the assumption that Middle Triassic and Middle Cretaceous sequences in the southern peripheral parts of the Humenné Unit were tectonically thickened. The process of shortening itself significantly affected the physical parameters of the Mesozoic sequences.
3.2. Xenoliths
The investigation of xenoliths in the andesites of the Vihorlatské Mountains (which overlap the Mesozoic Humenné Unit) confirmed the presence of sedimentary, volcanic-sedimentary, but also metamorphic rocks in the basement. The investigated xenoliths belong to the underlying sedimentary sequences of the Neogene and Paleogene ages. This was concluded on the basis of the results of petrographic and mineralogical studies, as well as the evaluation of chemical analyses. The mineral association Pl, Kfs, Bt, Spl, Opx, Crd, and +/− Qtz in some xenoliths is typical for rocks with contact metamorphism, which indicates the possible presence of the underlying Humenné Unit.
3.3. Boreholes
The Humenné Unit’s location was verified by several boreholes (
Table 1), that documented its geological structure [
21,
27]. The exploratory geothermal well GTH-1 was situated on the elevation of the pre-Tertiary basement and drilled at the Kaluža site. GTH-1 well found the roof of Mesozoic rocks, which was located at the depth of 400.7 m. Mesozoic rocks in the study area were also verified by coal and oil exploration wells. [
21] The boreholes confirmed a significant asymmetric uplift as well as an erosion of the unit down to the Middle to Upper Triassic level.
Hydrogeological Data
The hydraulic properties of Mesozoic rocks were evaluated on the basis of the results of the surveyed hydro-geothermal well GTH-1 and older hydrogeological, oil, and deposit wells. The hydraulic properties of the collectors were expressed by means of the specific yield (q), the indices of transmissivity (Y) and permeability (Z
L) (open section), and the coefficients of transmissivity (T) and hydraulic conductivity (k) which were derived from them. From the evaluated 12 data sets, the average value Y = 4.48; Z
L = 2.59 was calculated and the geometric averages of the transmissivity coefficient G(T) = 3.0 × 10
−5 m
2·s
−1 and hydraulic conductivity coefficient G(k) = 3.9 × 10
−7 m·s
−1 were derived from them. These values of hydraulic parameters classify the Triassic carbonates as a collector with low transmissivity and low permeability [
22]. The lower permeability is a consequence of compression tectonics. It is also a consequence of an imbricate structure which has alternating carbonate collectors as well as layers of marly limestones and shales. Geothermal data from the chosen boreholes in the Humenské Mountains are shown in
Table 2. The temperature values from several of the boreholes of the Humenské Mountains and their surrounding areas were recorded in the geothermogram (
Figure 4).
3.4. Geophysical Survey
3.4.1. Deep Seismic Exploration
The geological structure and distribution of the Humenné Unit were analyzed on the basis of the interpretation of the reprocessed seismic profiles 107/89, 83/85, 84/85, 16/75, 625/87, and 567/80. These were made for a hydrocarbon survey of the Eastern Slovak Basin in the 1980s. Although they were not primarily made for the purpose of researching the Humenné Unit, they clarify its position in relation to the surrounding, underlying, and overlying units. At the same time, they indicate the internal structure of the Humenné Unit’s carbonates.
3.4.2. Gravimetry
Gravimetric measurements provide an informative picture of the gravity field and the geology of the area. The detailed mapping resulted in maps of the complete Bouguer and residual anomalies. The qualitative interpretation was focused on determining the exact location of depression and elevation areas and distinct tectonic lines. Determining the density of the basic petrographic rock types made it possible to interpret the gravimetric profiles. The density values were used to determine the distribution and the depth of the Humenné Unit [
28,
29,
30].
There is a relatively wide range of density parameters (
Table 3). Volcanic complexes or volcanoclastics show low densities, while intrusive igneous bodies such as diorite and granodiorite porphyries have increased density values. The sedimentary complex of Cretaceous sediments of the Humenné Unit shows the highest values.
Field gravimetric measurements were taken by conducting detailed profile mapping. The positions of the measured gravimetric points were recorded using GPS and marked in topographic maps at a scale of 1:10,000. The gravity values were measured at all points with the specified altitude. Gravity measurements were performed with a CG-3 gravimeter.
A total of 206 points and 22 checkpoints were measured. The accuracy of the measurements was calculated from the independently determined gravity values at the control points:
Somigliana’s equation [
31] was used to calculate the normal field. Fay’s reduction was calculated using Taylor’s second-stage expansion. The classical Bouguer plate was replaced by a spherical plate up to 166.7 km, so the Boulard term is not used. The final phase is the calculation of topographic corrections up to a distance of 166.7 km around each measuring point. The actual shape of the relief found during field measurements was also taken into account. The result is a curve of complete Bouguer anomalies for a reduction density of 2.67 g·cm
−3 calculated according to the equation:
where:
g(φ,λ,h)—gravitational acceleration at the measuring point
gn(φ)—normal field calculated according to Somigliana’s formula
R
F(φ,h)—Fay correction (reduction) for the calculation point at the height h above the ellipsoid when considering the Taylor expansion to the second stage with the consideration of geometric flattening [
31]
σgsf(h)—the gravity of a spherical plate with an outer radius of 166.7 km
T(φ,λ,h)—topographic corrections calculated up to 166.7 km from the point calculation
3.4.3. Geoelectric Measurements
The reason for using resistivity methods was the assumption that the underlying Mesozoic aquifer (that had a carbonate evolution) would have higher values of specific resistance than its Neogene overburden. This assumption was also confirmed by parametric measurements performed at the site of the borehole drilled close to the projected well GTH-1.
Geoelectric measurements were processed qualitatively in the form of vertical iso-ohmic sections. Additional geoelectric measurements were performed using a GEVY-100 geophysical transmitter and a MIMI-II geophysical receiver.
3.5. Modeling
The results of the geological and geophysical survey were processed into 2D and 3D models of the Humenné Unit’s distribution on the surface and in the basement. Tectonic and structural relationships, boreholes, and the results of geothermal measurements were taken into account. The modeling was done using Petrel software.
4. Results from the Used Geophysical Methods
The geophysical methods used during exploration are limited by different conditions based on their technical possibilities, geological structures, lithology, depth, groundwater contents, and tectonic structure. In this chapter we will summarize the basic results and their geothermal application. A 3D model of the spatial structural–geological distribution of Humenné Unit carbonates was prepared for the interpretation of geophysical research. The results were used to calculate the heat–energy potential of geothermal energy sources in the Humenné Unit.
4.1. Deep Seismic Cross-Sections
Seismic profiles were made to determine the structural and internal relationships of the Humenné Unit. The seismic sections were created with an overlap of 24 m, leveling 250 m = 0 ms and in perpendicular direction NE–SW.
4.1.1. Seismic Profile No. 83/85
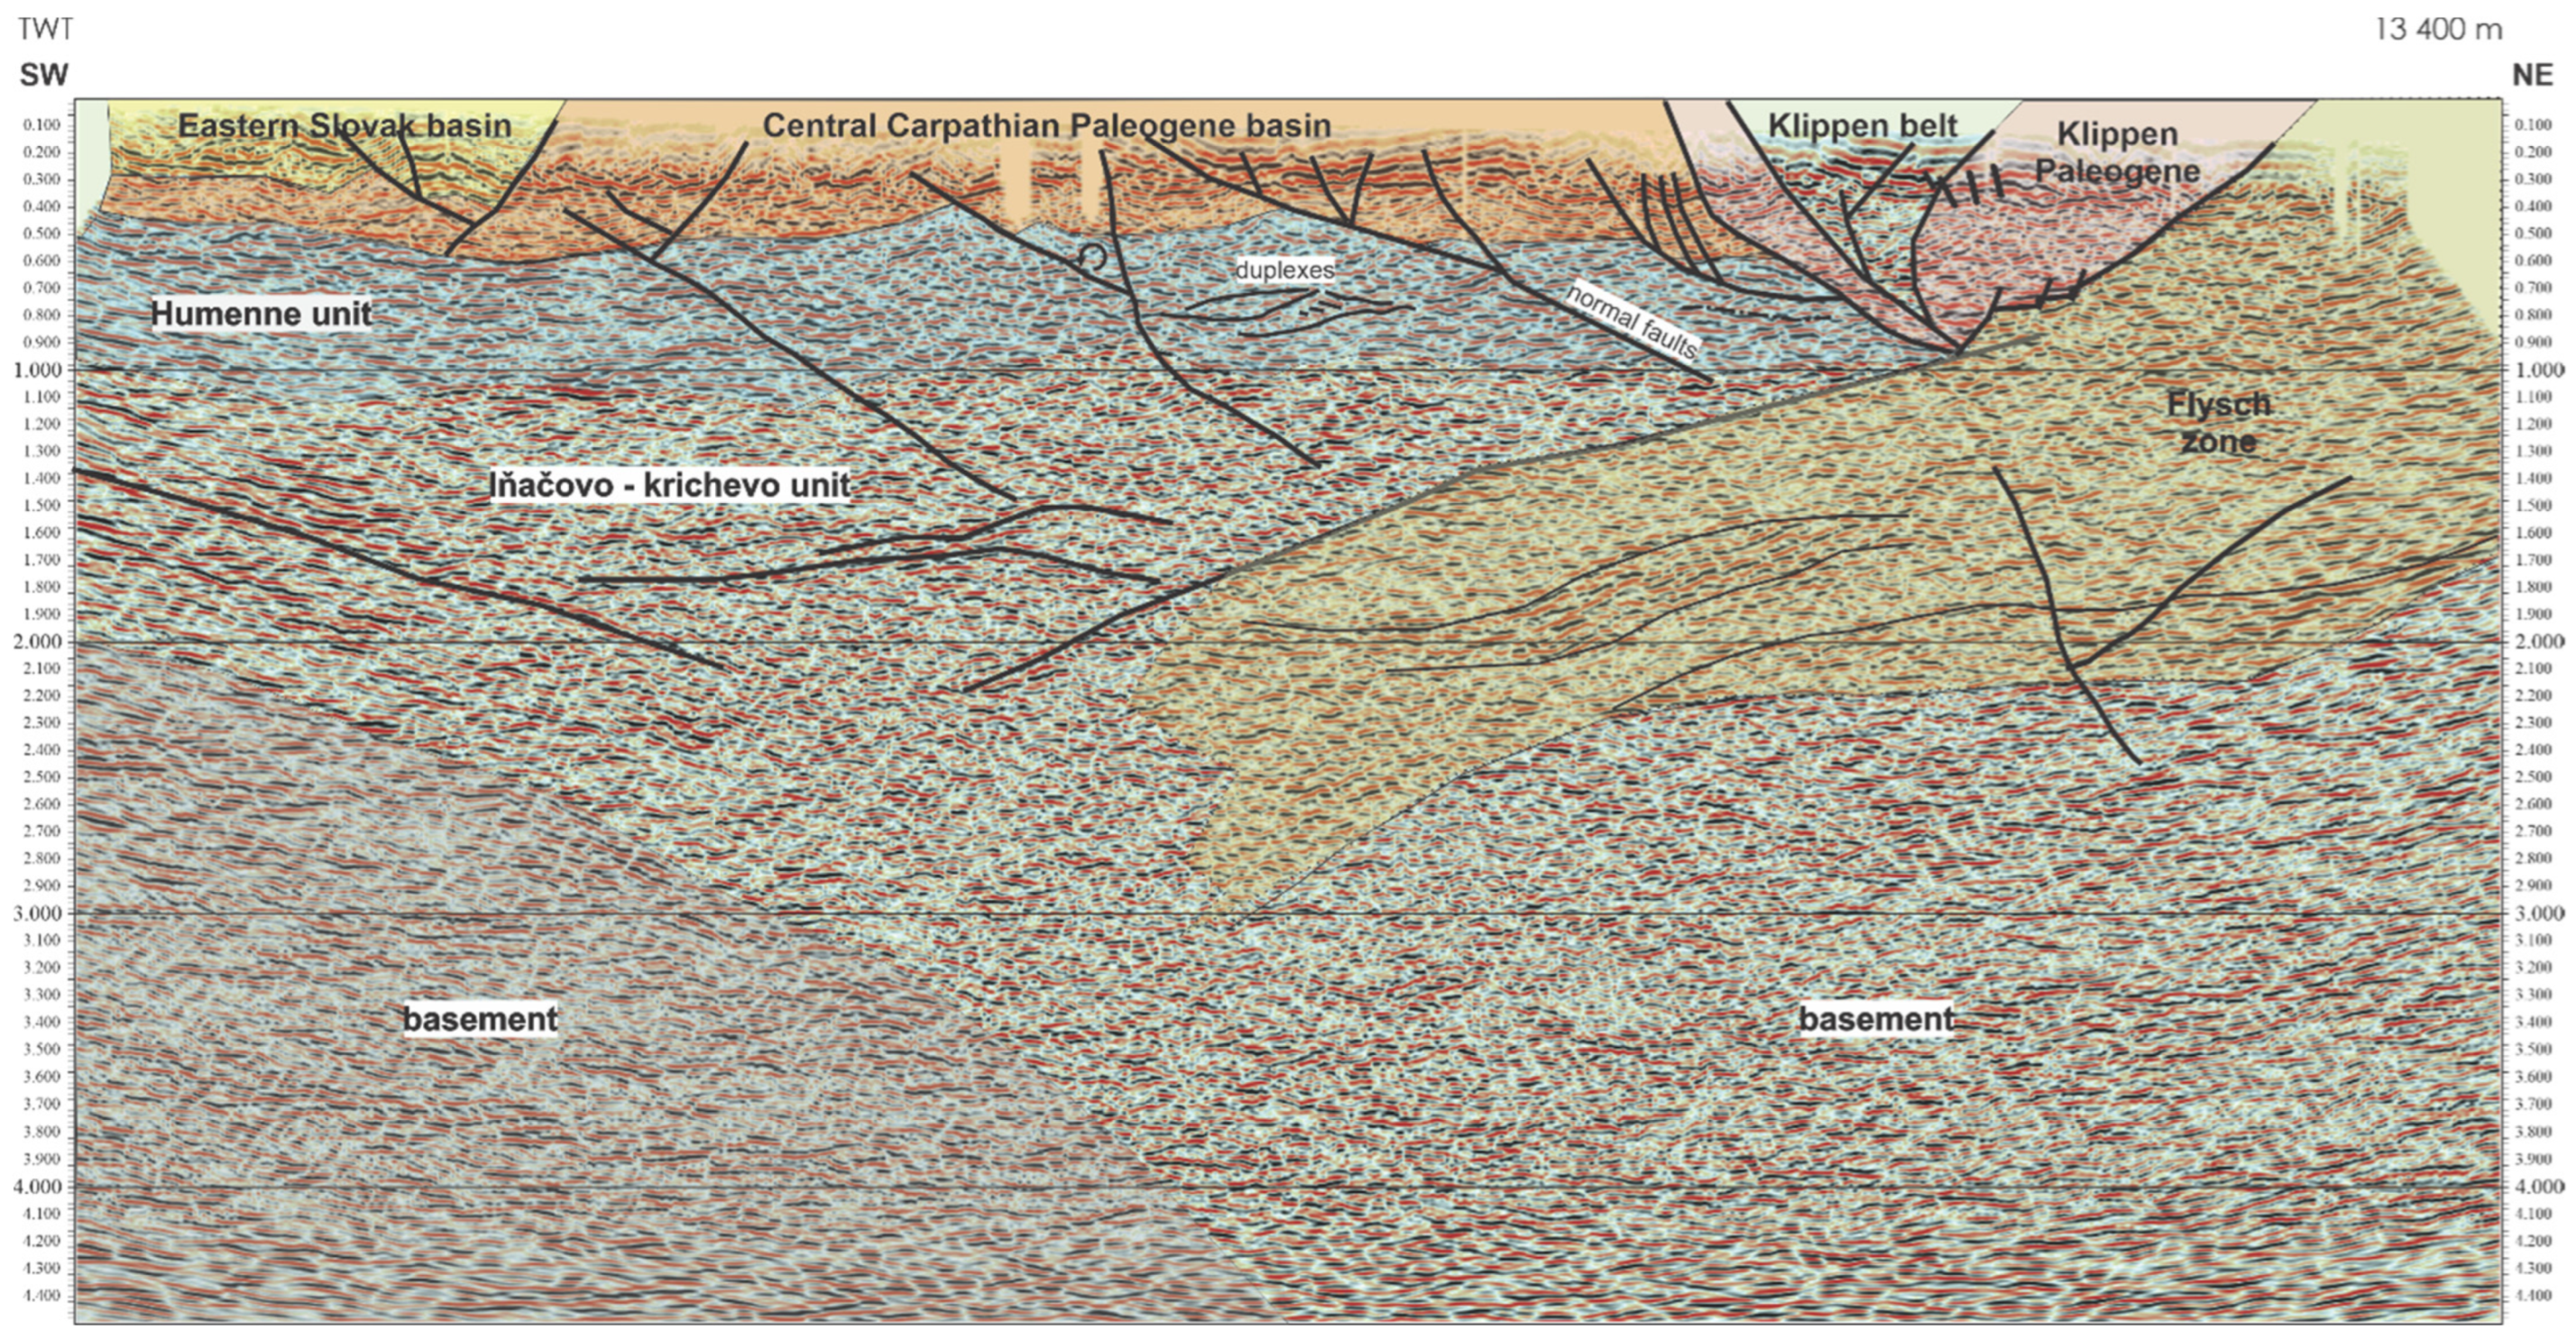
This seismic profile shows the deep geological structure of the northern edge of the ESB. The Humenné Unit (the main aquifer), as visible on the cross-section (
Figure 5), is covered by sediments of the Central Carpathian Paleogene, while its lateral limitation is tectonic.
The overburden boundary is highlighted by its lithology, where seismic reflexes show considerable angular discordance. This discordance is related to the hiatus which occurred during the Paleocene as well as the partial emergence of the Humenné Unit during this period. Rough positions of claystones in the lower parts of the Central Carpathian Paleogene and positions of sandstones in the upper parts indicate a monotonic development. This is marked in the cross-section by continuous well-defined lateral reflexes. An interesting visible feature of the cross-section is the lateral transition (from left to right) from a reflective zone into a non-reflective zone. These changes are related to strong tectonic faulting close to the Pieniny Klippen belt (PKB).
The same faults influenced the Humenné Unit in the basement. In this part, the sediments have chaotic reflexes. Sometimes the reflexes are steeply inclined. The antithetical orientation of these faults is related to the subduction of the Outer Western Carpathians (flysch zone) beneath the Inner Western Carpathians. The antithetical faults are normal, and they behave like half-grabens that contain rotating blocks. As these blocks rotated, they also moved vertically. The Klippen belt forms the northeastern tectonic border of the CCP and the Humenné Mesozoic Unit. The internal structure of the Klippen belt was formed by multi-deformational tectonic phases which mainly occurred during the Cretaceous to Miocene periods. The Humenné Unit located in the basement has distinct reflexes and is geometrically arranged into multiple duplex structures. The shape of these reflexes is not linear, they are significantly bent depending on their proximity to the Klippen belt. Often-occurring reflex bending indicates a significant deformation of the carbonates and the presence of overthrust structures.
The lower boundary between the Humenné Unit and the Inačovo–Kričevo Unit basement is not clear. The Humenné Unit is overthrusted over the Inačovo–Kričevo Unit (borehole MLS-1). Due to lithological similarities, it is difficult to distinguish between the two units. The lowest unit (Inačovo–Kričevo Unit) is characterized by alternating parallel reflexes with low lateral endurance and low-reflex areas [
32,
33]. The deepest unit is an unspecific basement marked by inclined reflexes.
4.1.2. Seismic Profile No. 16/75
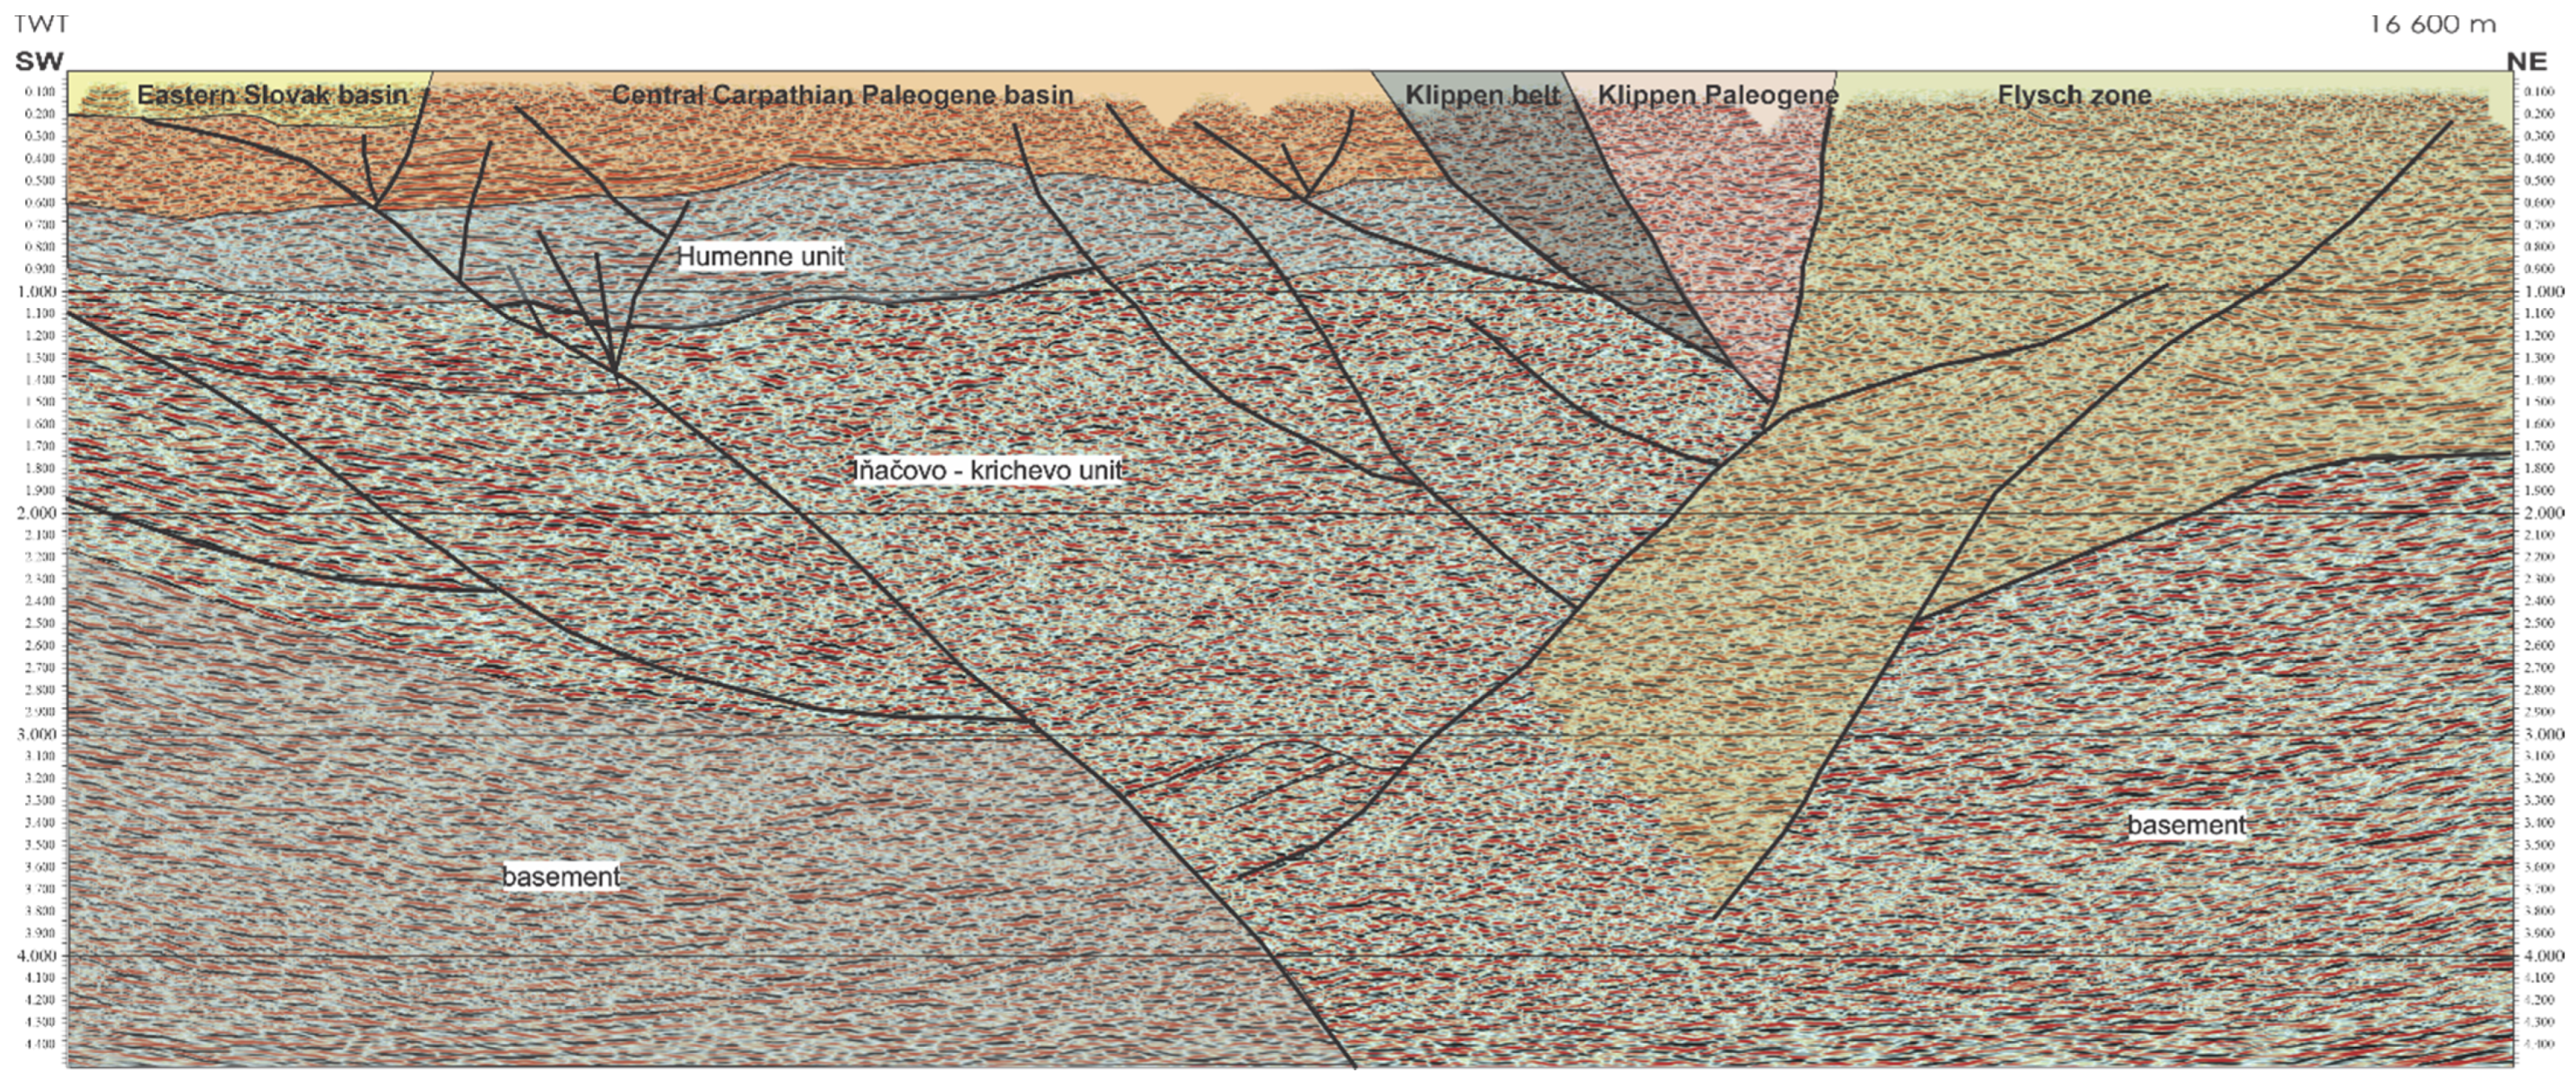
This seismic cross-section is located towards the southeast of section No.83/85. A tectonic collision between the IWC and the OWC can be observed in the form of the flower structure of the PKB (
Figure 6).
The post-sedimentary evolution of the PKB changed from a process of tectonic shortening to a horizontal transgressive movement which created numerous structures. In the cross-section this is marked by chaotic reflexes. The impact of the PKB on the surrounding units is significant. Within the immediate area surrounding the units depicted in the cross-section, a tectonic thickening of the bedding has occurred. Based on this we assume that the geometry of the geothermal aquifer is composed of several tectonic sheets (in the Humenné Mountains, there are 4 sheets).
The overall deformation gradually decreases from the PKB to the Eastern Slovak Basin. This deformation affects the vertical delamination of the “individual hydrogeological bodies”. Towards the Eastern Slovak Basin, the aquifer’s thickness decreases, but the thickness of the overlying sediments increases. This phenomenon affects the thermal conditions of the main aquifer. The basement, just like in section No. 83/85, is formed by the Iňačovo–Kričevo unit and other undefined units.
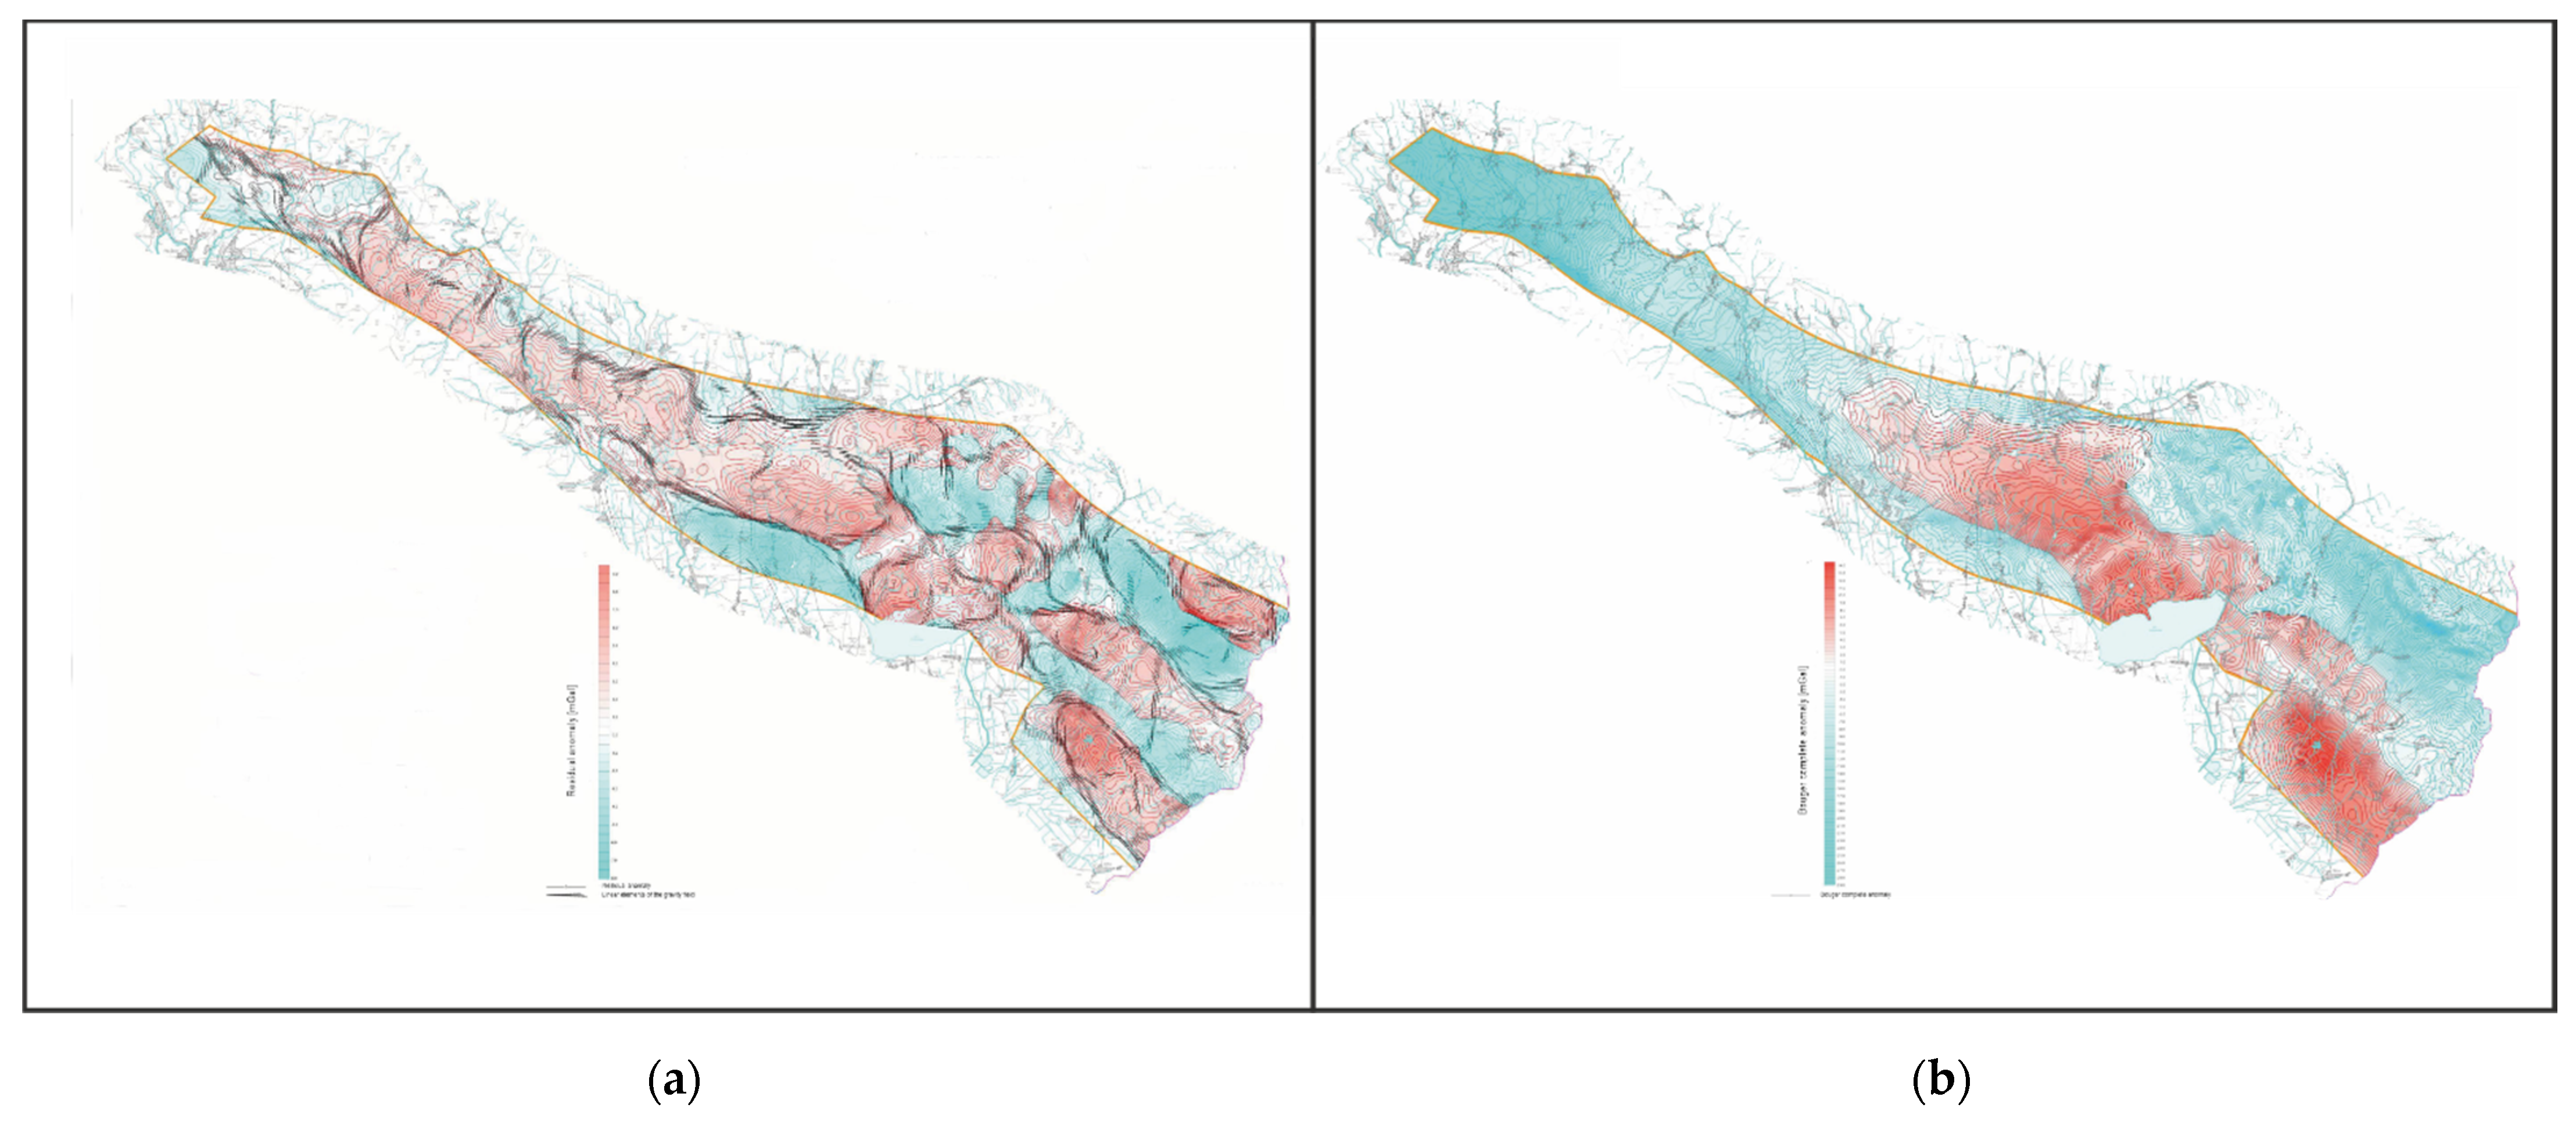
4.2. Gravimetric Measurements
The gravimetric interpretation took place in two stages. In the first stage, a map of complete Bouguer anomalies was compiled, which was the basis for qualitative and quantitative gravimetric interpretation. Maps were compiled for two reduction densities of 2.20 g·cm
−3 and 2.67 g·cm
−3 [
34]. A map for a density of 2.67 g·cm
−3 was used for the interpretation shown later in this article (
Figure 7b).
The unified map of complete Bouguer anomalies reflects the gravitational effects of all lithospheric inhomogeneities. It summarizes the gravitational effect of near-surface and deep inhomogeneities. Regional and residual anomalies can be identified. In general, regional anomalies are the response of large inhomogeneities at great depths. Residual anomalies, however, reflect the gravitational effect of inhomogeneities closer to the surface and over a smaller surface area. It is important to take into account the reduction density, according to which the map was calculated, because the source of the anomalies may affect the terrain.
One example of when the anomaly source may affect the terrain is when extreme relief can be observed as well as a large difference in surface densities (more than our used value of 2.67 g·cm
−3). This can occur in the studied area in parts where neovolcanics are present and the neovolcanics have a difference of relief of more than 500 m. A second example is Paleogene sediments where the relief is lower than 500 m, but the difference in density is larger than 0.12 g·cm
−3. Derived gravimetric maps were also calculated, i.e., maps of residual anomalies for a radius of 4 km, as well as a map of linear elements of the gravity field [
36]. The map of residual anomalies (
Figure 7a) highlights relatively shallow anomaly sources within the map of complete Bouguer anomalies. This allows the possibility of creating a more accurate geological–geophysical interpretation. The map of linear elements of the gravity field is suitable for the interpretation of fault tectonics.
The results of the map of complete Bouguer anomalies (CBA) confirm the presence of a very segmented gravity field structure. These segments represent elevations and depressions of varying degrees, which are separated from each other by density borders. These borders are visible on the map as dense accumulations of isolines.
The largest anomalous zone in the CBA map is the positive anomaly oriented in the NW-SE direction, reaching values from +10 mGal to −15 mGal. This anomaly mainly corresponds to the Humenné Unit, which is overlain by Neogene sediments in its central parts. Towards the northeast, the Humenne Unit immerses under the Central Carpathian Paleogene.
4.3. Geoelectric Profiling
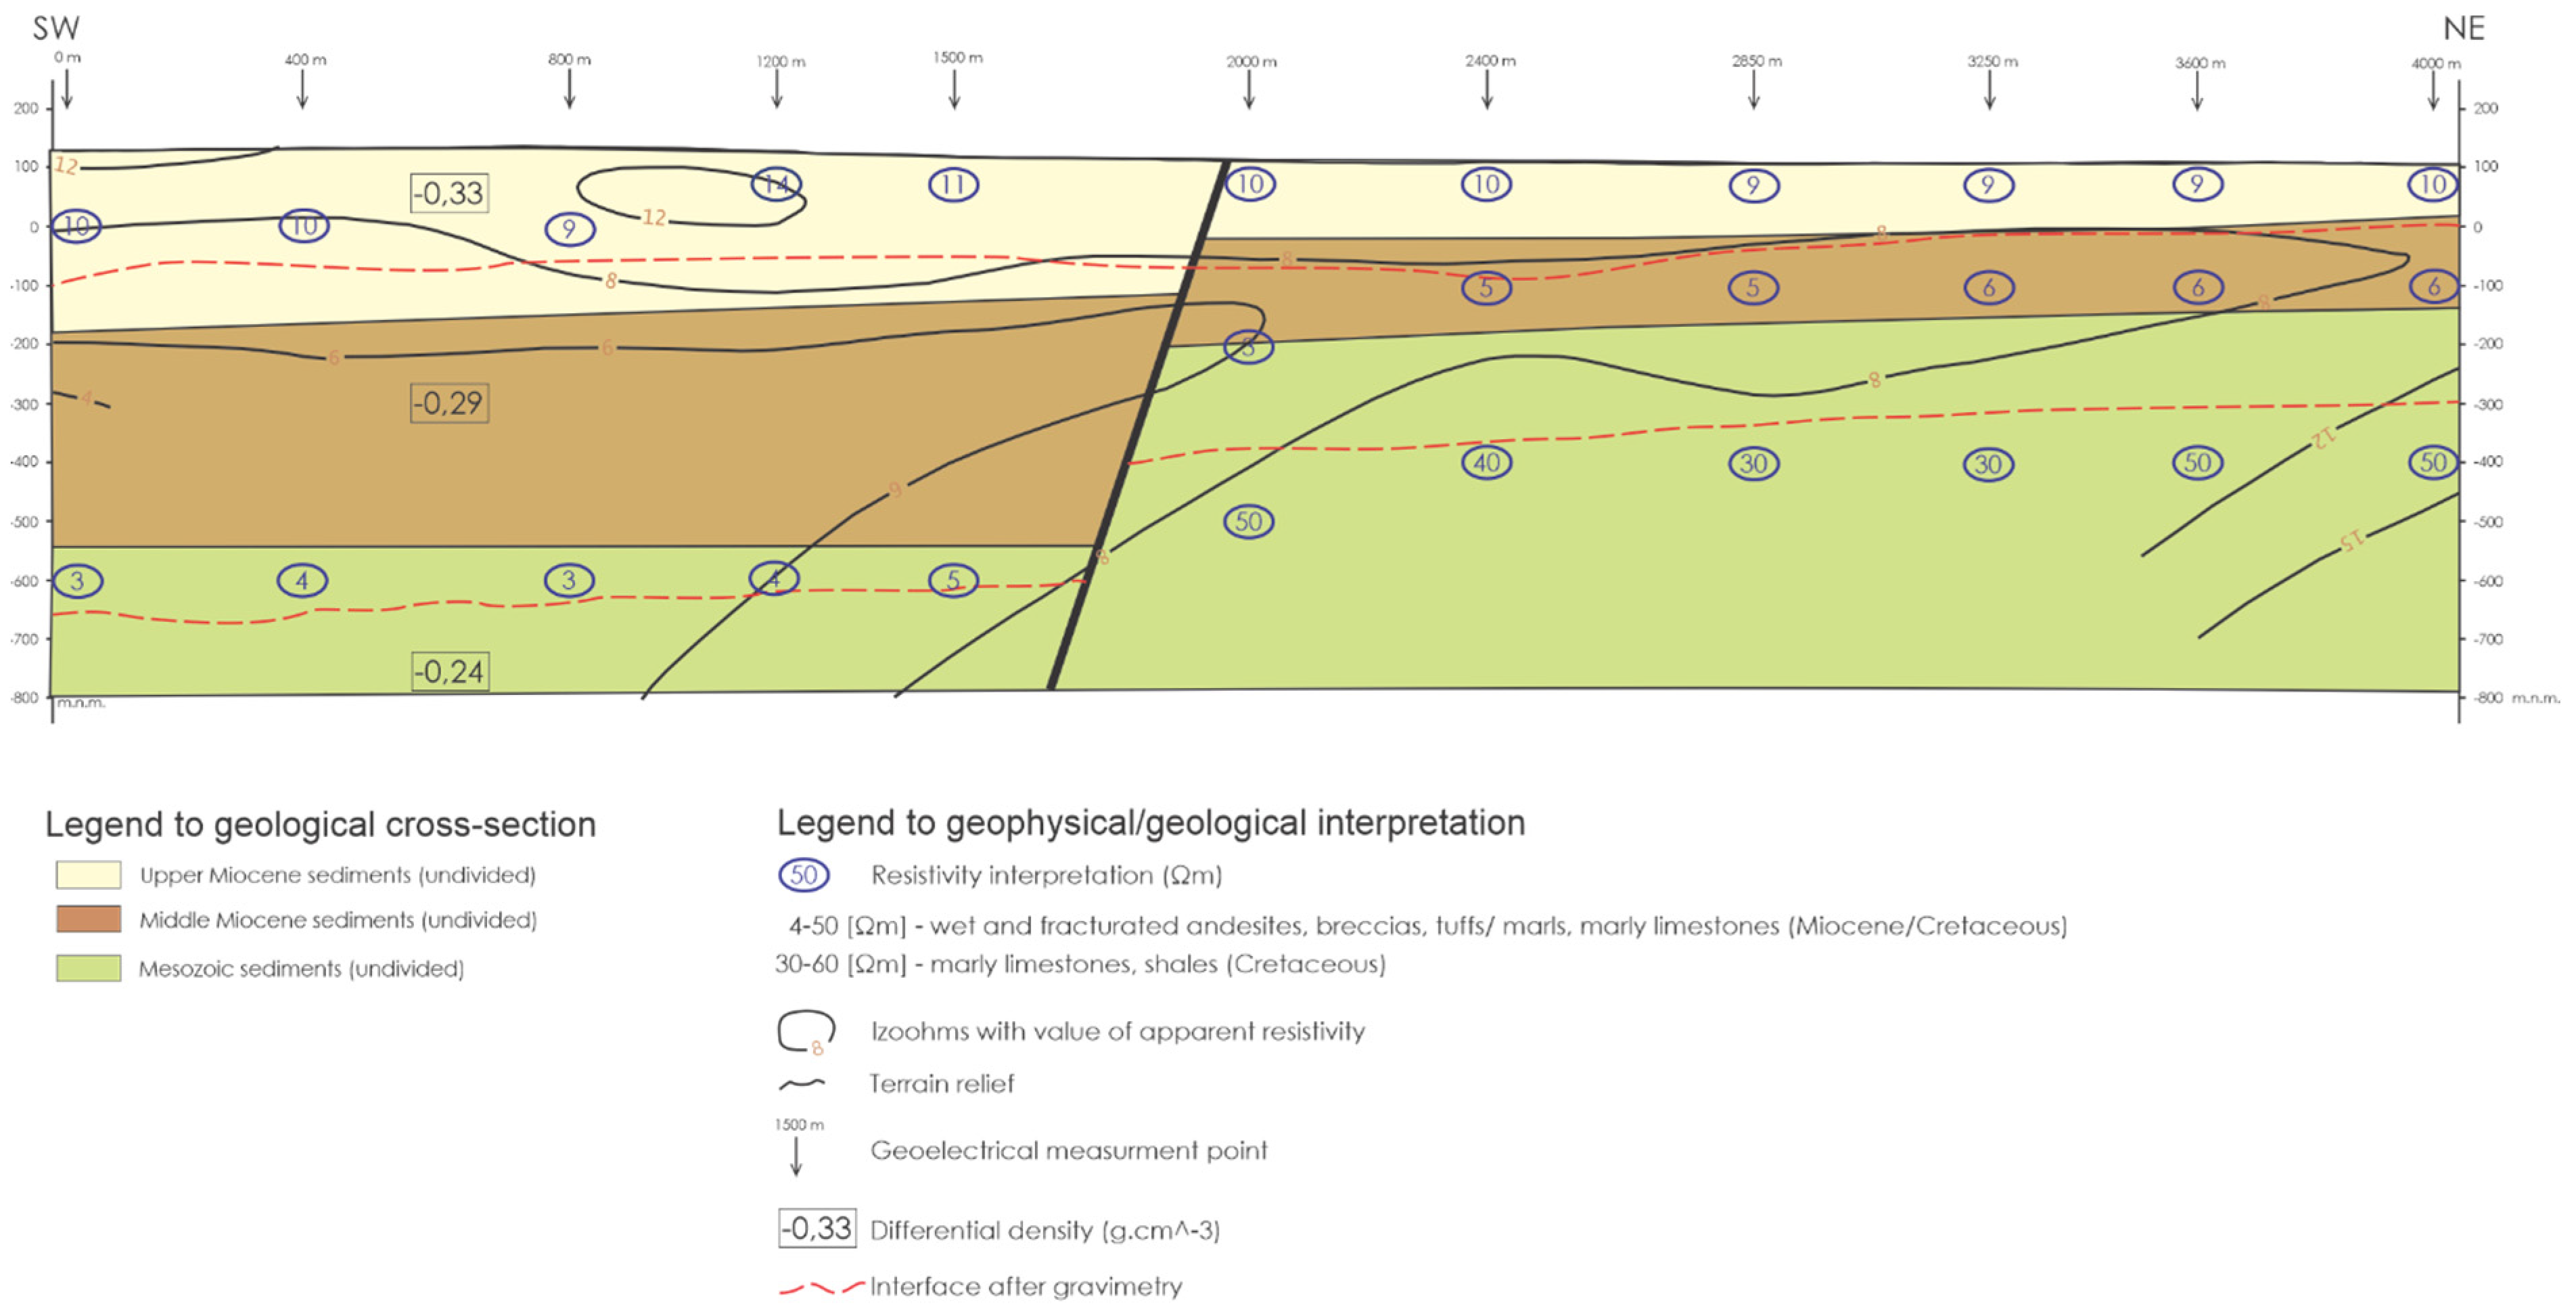
The geoelectric resistivity profile of PFTU-5 (
Figure 8) is situated at the northern edge of the Eastern Slovak basin. The profile was made in order to determine the location to drill geothermal borehole GTH-1. The purpose of this profile was to confirm the presence of a buried elevation of the Humenné Unit under Miocene sediments and volcanics.
The results of the geophysical research displayed the presence of a significant tectonic zone, which had dropped 300 m. Based on the extent of the gravity field, we can deduce the extent of the pre-Cenozoic basement. The whole profile is situated on the surface of Neogene sediments. The curve of residual anomalies rises significantly from −12 mGal at the beginning of the profile to −4 mGal at the end. The rising trend of the curve is a reflection of the pre-Cenozoic basement relief. At the beginning of the profile, the pre-Cenozoic basement is located at a depth of about 1150 m. At about 1200 m, the basement starts to rise more steeply, which corresponds to the interpretation of the electric resistivity sounding. Based on their density, three layers can be observed, that have decreasing differential densities with increasing depths (−0.33; −0.29; −0.24). Sandy sediments predominate in the upper layer, but clay components increase as we descend to greater depths. From approximately 2400 m, the curve gradually starts to rise. This section of the profile is related to a positive anomaly, which corresponds to the elevation of the pre-Cenozoic basement.
5. Discussion
The interpretation of the geothermal aquifer of the Humenné Unit is derived from the large surface occurrence which was confirmed by the borehole datasets. Some essential features of the unit are: an increasing tectonic thickness towards the Pieniny Klippen Belt, a south-vergent duplex structure, and a Middle Triassic–Middle Cretaceous carbonate fill.
The permeability of the aquifer is variable. Its joint and joint-karstic permeability is weak (T = 1.3 × 10
−5 m
2, k = 1.3 × 10
−7 m·s
−1). However, in tectonically fractured zones it is much better (T = 0.05 × 10
−7 m
2, k = 0.47 × 10
−8 m·s
−1) with a yield ranging from 0.7 to 5.3 l·s
−1. The data shows a low interdependence between karstification, porosity, or permeability. No direct data are available on the values of the effective porosity of Triassic carbonate complexes in the Humenné Mesozoic area. The results of interpretations of logging measurements of nearby deep wells were used for this data, where the average effective porosity is 6.0 ± 3.7% with the values in the range of 1–18%. The carbonates of the Humenné Unit (aquifer) broke their epigenic processes after the Miocene and accelerated the development of systems of fractures. Water circulation is driven by the topography gradient [
38]. Based on the results from borehole GTH-1 (
Figure 9B), the main hydraulic driving force [
39] for geothermal water is related to the marginal faults of the buried ridge (i.e., thermal lift). The neotectonic deep faults separate, but do not isolate the carbonate aquifer from the Neogene/Paleogene volcano sediments. These sediments are resaturated by precipitation [
40,
41]. The relationships between tectonic elevations and permeability play a key role in the prediction of the geothermal potential of the Humenné Unit.
The interpretation of the seismic cross-sections identified deep margins between each unit. From the results, it is known that the surface and the thickness of the Humenné Unit are irregular. In the northwest, the upper boundary of the Humenné Unit is at a depth of approx. 500 m (b.s.l.) and drops to approximately 1000 m (b.s.l.) in the southeast (
Figure 9A). The subsurface morphology affects the heat flow density distribution. The isolines of heat flow density are significantly twisted toward this direction, which is parallel to the elevation structures. Old thermal boreholes confirm the presence of open transverse faults which are parallel to the elevations and many of them have been seismically active during the Quaternary. These relationships are especially evident in the southeastern part of the Humenné Unit [
33]. The seismic cross-sections confirmed evidence of imbrication structures, which significantly changed the lithological composition together with erosion. The largest thicknesses, which are approximately 1700 m to 2000 m thick, are assumed to be located under the Neogene volcanics. In contrast, the lowest thicknesses are at most 1300 m thick and are connected to tectonic elevations. The average carbonate thickness of the unit is 1600–1900 m (
Figure 9D).
Gravimetric measurements confirm the existence of sets of density anomalies corresponding to the morphological elevations and depressions of the pre-Cenozoic basement. They may also confirm other geological structures, which has an anomalous geophysical expression.
The sedimentary–volcanic complex is most evident in the gravity field of the area built by Neogene volcanic rocks. This is due to the fact that volcanic rocks are commonly heterogeneous. Sedimentary rocks (Neogene and Paleogene) are relatively homogeneous in density and non-magnetic, and therefore their role in density anomalies is less evident. The volcanic rocks extend into the area of interest from the north, which is reflected in the CBA map by a group of smaller, relatively fragmented anomalies. Their intensity is directly proportional to the represented amount of solid volcanic bodies in the volcanic complex as well as the thickness of this complex. Pyroclastic breccias and deposits of pyroclastic lava flows, as well as effusive cones [
42], cause a positive anomaly. A positive anomaly in the vicinity of Vinne (castle) is composed of pyroxenic-amphibolite andesites, which form mostly extrusive domes that often pass into thick lava flows [
24]. Extrusive bodies of andesites outcropping in the SW part of the neovolcanics are also significantly reflected in the gravity field. According to the field map of the CBA, it can be assumed that volcanic rocks are also located in the area of Zemplínska Šírava where borehole GTH-1 was drilled.
During this research, volcano–sedimentary sequences were compared [
43,
44,
45] to geoelectric and gravimetric profiles. In the case of profile PF 5, there was no visible difference between them. The differences in the different basement depths are no more than 50 m. As already mentioned, the problem in the interpretation of geoelectrics is that the resistance intervals of the individual layers are overlapping. For this reason, only one geoelectric horizon was allocated to representing a Cenozoic fill (4–50 Ωm). With increasing depths, the resistance increases less significantly, which may correspond to non-carbonate Mesozoic rocks. But, in other cases, where volcanic rocks contain groundwater, the volume of electrical resistivity rate is 350–500 Ωm.
The assessment of the geothermal activity of the area is best interpreted based on the earth’s heat flow data. Data from wells available in the evaluated area showed a heat flow density in the range of 73.3 to 94.8 mW/m2.
The input parameters for the calculation of the perspective specific heat–energy potential represent values of porosity, rock bulk density, specific heat of rocks, specific density and heat of geothermal water (
Figure 9C), reservoir temperature on the collector’s surface, neutral zone temperature, collector thickness of geothermal water, and the reduction coefficient. Based on the mentioned data, the values of the perspective specific heat–energy potential of geothermal energy reserves for the Triassic carbonate formation were calculated. The results of the calculations were values with a wide range of 0.337–19.533 GJ/m
2. The wide range is related to the unit’s occurrence on the surface in the central area up to a depth of −2250 m. The thickness of the collectors does not significantly affect the changes in the values of the specific thermal energy potential, as it is around 1000 m throughout the whole structure and shows only a small variability (850–1120 m) [
22].
6. Conclusions
The geothermal aquifer of the Humenné Unit is linked to the distribution of the Middle Triassic carbonates, which are distributed irregularly throughout the unit. Differences in the thickness of the aquifer are the result of Miocene deformation along the Klippen Belt. The deformation level changes depend on the distance from the accretionary edge (Klippen Belt) and have a direct effect on permeability and porosity. The overall low permeability forces us to use the most optimal structures (like tectonic elevations in the subsurface) so that we may increase the temperature and the yield rate. Their exploration is possible via multiple geophysical methods, of which seismic cross-sections and gravimetry dominate. Using the individual geophysical methods, the following conclusions were reached:
Deep seismic cross-sections are the most precise sources of information from the subsurface. Based on their interpretation it was possible to distinguish the basic sedimentary boundaries, the relationship between volcanic complexes and sediments, tectonic structures, and individual geological forms. They are also the starting point for other already mentioned geophysical methods. The biggest disadvantage is the cost of making deep seismic profiles.
The calculation of the Complete Bouguer anomaly determined the numerical values of the density anomalies that correspond to the morphological elevations and depressions of the pre-Cenozoic basement. The study area, represented by volcanic (Miocene) and sedimentary rocks (Mesozoic–Cenozoic), had a reduction density of 2.67 g·cm−3.
Geoelectric resistivity profiling has some limits. Geoelectric resistivity layers are possible to interpret to a maximum depth of 500 m. There are 4 layers with specific resistivity values in the study area:
ρ: 4–50 Ωm—intensely aquiferous andesites, breccias, tuffs/clays, marly limestones
ρ: 30–60 Ωm—marly limestones, shales, clays
ρ: 50–200 Ωm—andesite lava flows, breccias
ρ: 80–360 Ωm—mainly carbonates, compact andesites
The specific heat–energy potential has a wide range of 0.337–19.533 GJ/m2. The highest values above 15 GJ/m2 are reached in areas where the temperature on the surface of Triassic carbonates exceeds 90 °C.
The aquifer of the Humenné Unit has significant geothermal, hydrological, and geological limitations. However, low-temperature sources have future potential. Similar low-permeability structures are quite common worldwide, as opposed to huge geothermal areas. Their exploration combined with other green power sources could be an opportunity for the region’s development.


 ,
, 


