
Predicting Children with ADHD Using Behavioral Activity: A Machine Learning Analysis


Abstract
:1. Introduction
2. Materials and Methods
2.1. Dataset
2.2. Predictor Variable
2.3. Outcome Variable
2.4. Statistical Analysis
2.5. Imbalanced Management Method
2.6. Feature Selection Method
2.7. Machine Learning Techniques
2.8. Performance Evaluation Criteria
- Accuracy
- Sensitivity
- Specificity
3. Results
3.1. Baseline and Demographic Characteristics of Children with ADHD
3.2. Balanced Dataset Formation
3.3. Prominent Risk Factors of Children with ADHD Using LR
3.4. Comparisons of Performances of Machine Learning Techniques
4. Discussion
5. Conclusions
Author Contributions
Funding
Institutional Review Board Statement
Informed Consent Statement
Data Availability Statement
Acknowledgments
Conflicts of Interest
References
- Edition, F. Diagnostic and statistical manual of mental disorders. Am. Psychiatric Assoc. 2013, 21, 591–643. [Google Scholar]
- Danielson, M.L.; Bitsko, R.H.; Ghandour, R.M.; Holbrook, J.R.; Kogan, M.D.; Blumberg, S.J. Prevalence of parent-reported ADHD diagnosis and associated treatment among US children and adolescents, 2016. J. Clin. Child. Adolesc. Psychol. 2018, 47, 199–212. [Google Scholar] [CrossRef] [PubMed]
- Mowlem, F.D.; Rosenqvist, M.A.; Martin, J.; Lichtenstein, P.; Asherson, P.; Larsson, H. Sex differences in predicting ADHD clinical diagnosis and pharmacological treatment. Eur. Child Adolesc. Psychiatry 2019, 28, 481–489. [Google Scholar] [CrossRef] [PubMed] [Green Version]
- Fayyad, J.; Sampson, N.A.; Hwang, I.; Adamowski, T.; Aguilar-Gaxiola, S.; Al-Hamzawi, A.; Andrade, L.H.; Borges, G.; de Girolamo, G.; Florescu, S.; et al. The descriptive epidemiology of DSM-IV adult ADHD in the world health organization world mental health surveys. Atten. Defic. Hyperact. Disord. 2017, 9, 47–65. [Google Scholar] [CrossRef] [PubMed] [Green Version]
- Visser, S.N.; Lesesne, C.A.; Perou, R. National estimates and factors associated with medication treatment for childhood attention-deficit/hyperactivity disorder. Pediatrics 2007, 119, S99–S106. [Google Scholar] [CrossRef] [Green Version]
- Faraone, S.V.; Banaschewski, T.; Coghill, D.; Zheng, Y.; Biederman, J.; Bellgrove, M.A.; Newcorn, J.H.; Gignac, M.; Al Saud, N.M.; Manor, I.; et al. The world federation of ADHD international consensus statement: 208 evidence-based conclusions about the disorder. Neurosci. Biobehav. Rev. 2021, 128, 789–818. [Google Scholar] [CrossRef]
- Brikell, I.; Kuja-Halkola, R.; Larsson, H. Heritability of attention-deficit hyperactivity disorder in adults. Am. J. Med. Genet. B Neuropsychiatr. Genet. 2015, 168, 406–413. [Google Scholar] [CrossRef]
- Freeman-Fobbs, P. Feeding our children to death: The tragedy of childhood obesity in America. J. Natl. Med. Assoc. 2003, 95, 119. [Google Scholar]
- Stevens, J.; Harman, J.S.; Kelleher, K.J. Race/ethnicity and insurance status as factors associated with ADHD treatment patterns. J. Child Adolesc. Psychopharmacol. 2005, 15, 88–96. [Google Scholar] [CrossRef]
- Bazar, K.A.; Yun, A.J.; Lee, P.Y.; Daniel, S.M.; Doux, J.D. Obesity and ADHD may represent different manifestations of a common environmental oversampling syndrome: A model for revealing mechanistic overlap among cognitive, metabolic, and inflammatory disorders. Med. Hypotheses 2006, 66, 263–269. [Google Scholar] [CrossRef]
- Agranat-Meged, A.N.; Deitcher, C.; Goldzweig, G.; Leibenson, L.; Stein, M.; Galili-Weisstub, E. Childhood obesity and attention deficit/hyperactivity disorder: A newly described comorbidity in obese hospitalized children. Int. J. Eat. Disord. 2005, 37, 357–359. [Google Scholar] [CrossRef] [PubMed]
- Cortese, S.; Angriman, M.; Maffeis, C.; Isnard, P.; Konofal, E.; Lecendreux, M.; Purper-Ouakil, D.; Vincenzi, B.; Bernardina, B.D.; Mouren, M.C. Attention-deficit/hyperactivity disorder (ADHD) and obesity: A systematic review of the literature. Crit. Rev. Food Sci. Nutr. 2008, 48, 524–537. [Google Scholar] [CrossRef] [PubMed]
- Waring, M.E.; Lapane, K.L. Overweight in children and adolescents in relation to attention-deficit/hyperactivity disorder: Results from a national sample. Pediatrics 2008, 122, e1–e6. [Google Scholar] [CrossRef] [PubMed] [Green Version]
- Bramlett, M.D.; Blumberg, S.J. Family structure and children’s physical and mental health. Health Aff. 2007, 26, 549–558. [Google Scholar] [CrossRef] [PubMed]
- Kollins, S.H.; McClernon, F.J.; Fuemmeler, B.F. Association between smoking and attention-deficit/hyperactivity disorder symptoms in a population-based sample of young adults. Arch. Gen. Psychiatry 2005, 62, 1142–1147. [Google Scholar] [CrossRef] [PubMed] [Green Version]
- Choy, G.; Khalilzadeh, O.; Michalski, M.; Do, S.; Samir, A.E.; Pianykh, O.S.; Geis, J.R.; Pandharipande, P.V.; Brink, J.A.; Dreyer, K.J. Current applications and future impact of machine learning in radiology. Radiology 2018, 288, 318–328. [Google Scholar] [CrossRef]
- Zhou, L.Q.; Wang, J.Y.; Yu, S.Y.; Wu, G.G.; Wei, Q.; Deng, Y.B.; Wu, X.L.; Cui, X.W.; Dietrich, C.F. Artificial intelligence in medical imaging of the liver. World J. Gastroenterol. 2019, 25, 672. [Google Scholar] [CrossRef]
- Ghaderzadeh, M.; Asadi, F.; Hosseini, A.; Bashash, D.; Abolghasemi, H.; Roshanpour, A. Machine learning in detection and classification of leukemia using smear blood images: A systematic review. Scient. Program. 2021, 2021, 1–14. [Google Scholar] [CrossRef]
- Alanazi, H.O.; Abdullah, A.H.; Qureshi, K.N. A critical review for developing accurate and dynamic predictive models using machine learning methods in medicine and health care. J. Med. Syst. 2017, 41, 1–10. [Google Scholar] [CrossRef]
- Zea-Vera, R.; Ryan, C.T.; Havelka, J.; Corr, S.J.; Nguyen, T.C.; Chatterjee, S.; Wall, M.J., Jr.; Coselli, J.S.; Rosengart, T.K.; Ghanta, R.K. Machine Learning to Predict Outcomes and Cost by Phase of Care after Coronary Artery Bypass Grafting. Ann. Thorac. Surg. 2021, 112, S0003–4975. [Google Scholar] [CrossRef]
- Battineni, G.; Sagaro, G.G.; Chinatalapudi, N.; Amenta, F. Applications of machine learning predictive models in the chronic disease diagnosis. J. Pers. Med. 2020, 10, 21. [Google Scholar] [CrossRef] [PubMed] [Green Version]
- Kessler, R.C.; Bernecker, S.L.; Bossarte, R.M.; Luedtke, A.R.; McCarthy, J.F.; Nock, M.K.; Pigeon, W.R.; Petukhova, M.V.; Sadikova, E.; VanderWeele, T.J.; et al. The role of big data analytics in predicting suicide. In Person. Psychiatry-Big Data Analytics in Mental Health; Springer Nature: New York, NY, USA, 2019. [Google Scholar]
- Burke, T.A.; Ammerman, B.A.; Jacobucci, R. The use of machine learning in the study of suicidal and non-suicidal self-injurious thoughts and behaviors: A systematic review. J. Affect. Disord. 2019, 245, 869–884. [Google Scholar] [CrossRef] [PubMed]
- Kim, J.W.; Sharma, V.; Ryan, N.D. Predicting methylphenidate response in ADHD using machine learning approaches. Int. J. Neuropsychopharmacol. 2015, 18, 1–7. [Google Scholar] [CrossRef] [PubMed] [Green Version]
- Kim, S.; Lee, H.; Lee, K. Can the MMPI Predict Adult ADHD? An Approach Using Machine Learning Methods. Diagnostics 2021, 11, 976. [Google Scholar] [CrossRef]
- Zhang-James, Y.; Helminen, E.C.; Liu, J.; Franke, B.; Hoogman, M.; Faraone, S.V. Evidence for similar structural brain anomalies in youth and adult attention-deficit/hyperactivity disorder: A machine learning analysis. Transl. Psychiatry 2021, 11, 1–9. [Google Scholar] [CrossRef]
- Yasumura, A.; Omori, M.; Fukuda, A.; Takahashi, J.; Yasumura, Y.; Nakagawa, E.; Koike, T.; Yamashita, Y.; Miyajima, T.; Koeda, T.; et al. Applied machine learning method to predict children with ADHD using prefrontal cortex activity: A multicenter study in Japan. J. Atten. Disord. 2020, 24, 2012–2020. [Google Scholar] [CrossRef]
- Duda, M.; Ma, R.; Haber, N.; Wall, D. Use of machine learning for behavioral distinction of autism and ADHD. Transl. Psychiatry 2016, 6, e732. [Google Scholar] [CrossRef] [Green Version]
- Duda, M.; Haber, N.; Daniels, J.; Wall, D. Crowdsourced validation of a machine-learning classification system for autism and ADHD. Transl. Psychiatry. 2017, 7, e1133. [Google Scholar] [CrossRef]
- Uluyagmur-Ozturk, M.; Arman, A.R.; Yilmaz, S.S.; Findik, O.T.P.; Genc, H.A.; Carkaxhiu-Bulut, G.; Yazgan, M.Y.; Teker, U.; Cataltepe, Z. ADHD and ASD classification based on emotion recognition data. In Proceedings of the 2016 15th IEEE International Conference on Machine Learning and Applications (ICMLA), Anaheim, CA, USA, 18–20 December 2016; pp. 810–813. [Google Scholar]
- Slobodin, O.; Yahav, I.; Berger, I. A Machine-Based Prediction Model of ADHD Using CPT Data. Front. Hum. Neurosci. 2020, 14, 383. [Google Scholar] [CrossRef]
- Morrow, A.S.; Campos Vega, A.D.; Zhao, X.; Liriano, M.M. Leveraging machine learning to identify predictors of receiving psychosocial treatment for Attention Deficit/Hyperactivity Disorder. Adm. Policy Ment. Health 2020, 47, 680–692. [Google Scholar] [CrossRef]
- Child and Adolescent Health Measurement Initiative. 2018–2019 National Survey of Children’s Health (2 Years Combined), [(SAS/SPSS/Stata)] Indicator Data Set. In Data Resource Center for Child and Adolescent Health supported by Cooperative Agreement from the U.S.; Department of Health and Human Services, Health Resources and Services Administration (HRSA), Maternal and Child Health Bureau (MCHB): Washington, DC, USA, 2013. [Google Scholar]
- Lingineni, R.K.; Biswas, S.; Ahmad, N.; Jackson, B.E.; Bae, S.; Singh, K.P. Factors associated with attention deficit/hyperactivity disorder among US children: Results from a national survey. BMC Pediatr. 2012, 12, 1–10. [Google Scholar] [CrossRef] [PubMed] [Green Version]
- DeCarlo, D.K.; Swanson, M.; McGwin, G.; Visscher, K.; Owsley, C. ADHD and vision problems in the National Survey of Children’s Health. Optom. Vis. Sci. 2016, 93, 459. [Google Scholar] [CrossRef] [PubMed] [Green Version]
- Wüstner, A.; Otto, C.; Schlack, R.; Hölling, H.; Klasen, F.; Ravens-Sieberer, U. Risk and protective factors for the development of ADHD symptoms in children and adolescents: Results of the longitudinal BELLA study. PLoS ONE 2019, 14, e0214412. [Google Scholar] [CrossRef] [Green Version]
- DuPaul, G.J.; Chronis-Tuscano, A.; Danielson, M.L.; Visser, S.N. Predictors of receipt of school services in a national sample of youth with ADHD. J. Atten. Disord. 2019, 23, 1303–1319. [Google Scholar] [CrossRef]
- Zarei, K.; Xu, G.; Zimmerman, B.; Giannotti, M.; Strathearn, L. Adverse childhood experiences predict common neurodevelopmental and behavioral health conditions among US children. Children 2021, 8, 761. [Google Scholar] [CrossRef]
- Ren, Y.; Fang, X.; Fang, H.; Pang, G.; Cai, J.; Wang, S.; Ke, X. Predicting the adult clinical and academic outcomes in boys with ADHD: A 7-to 10-year follow-up study in China. Front. Pediatr. 2021, 9, 751. [Google Scholar] [CrossRef] [PubMed]
- DuPaul, G.J.; Evans, S.W.; Owens, J.S.; Cleminshaw, C.L.; Kipperman, K.; Fu, Q.; Benson, K. School-based intervention for adolescents with attention-deficit/hyperactivity disorder: Effects on academic functioning. J. Sch. Psychol. 2021, 87, 48–63. [Google Scholar] [CrossRef] [PubMed]
- Hoang, H.H.; Tran, A.T.N.; Van Hung Nguyen, T.T.B.; Nguyen, T.A.P.N.; Le, D.D.; Jatho, A.; Onchonga, D.; Van Duong, T.; Nguyen, M.T.; Tran, B.T. Attention Deficit Hyperactivity Disorder (ADHD) and Associated Factors Among First-Year Elementary School Students. J. Multidiscip. Healthc. 2021, 14, 997. [Google Scholar] [CrossRef]
- Rahman, M.S.; Takahashi, N.; Iwabuchi, T.; Nishimura, T.; Harada, T.; Okumura, A.; Takei, N.; Nomura, Y.; Tsuchiya, K.J. Elevated risk of attention deficit hyperactivity disorder (ADHD) in Japanese children with higher genetic susceptibility to ADHD with a birth weight under 2000 g. BMC Med. 2021, 19, 1–13. [Google Scholar] [CrossRef]
- AlZaben, F.N.; Sehlo, M.G.; Alghamdi, W.A.; Tayeb, H.O.; Khalifa, D.A.; Mira, A.T.; Alshuaibi, A.M.; Alguthmi, M.A.; Derham, A.A.; Koenig, H.G. Prevalence of attention deficit hyperactivity disorder and comorbid psychiatric and behavioral problems among primary school students in western Saudi Arabia. Saudi Med. J. 2018, 39, 52. [Google Scholar] [CrossRef]
- Wang, C.; Preisser, J.; Chung, Y.; Li, K. Complementary and alternative medicine use among children with mental health issues: Results from the National Health Interview Survey. BMC Complement. Altern. Med. 2018, 18, 1–17. [Google Scholar] [CrossRef] [PubMed]
- Schubach, M.; Re, M.; Robinson, P.N.; Valentini, G. Imbalance-aware machine learning for predicting rare and common disease-associated non-coding variants. Sci. Rep. 2017, 7, 1–12. [Google Scholar] [CrossRef] [PubMed] [Green Version]
- Matsuoka, D. Classification of imbalanced cloud image data using deep neural networks: Performance improvement through a data science competition. Prog. Earth Planet. Sci. 2021, 8, 1–11. [Google Scholar] [CrossRef]
- Bunkhumpornpat, C.; Sinapiromsaran, K.; Lursinsap, C. MUTE: Majority under-sampling technique. In Proceedings of the 2011 8th International Conference on Information, Communications & Signal Processing, Singapore, 13–16 December 2011; IEEE: Hoboken, NJ, USA, 2011; pp. 1–4. [Google Scholar]
- James, G.; Witten, D.; Hastie, T.; Tibshirani, R. An Introduction to Statistical Learning; Springer: New York, NY, USA, 2013; Volume 112. [Google Scholar]
- Fogelman-Soulié, F. Mining Massive Data Sets for Security: Advances in Data Mining, Search, Social Networks and Text Mining, and Their Applications to Security; IOS Press: Amsterdam, The Netherlands, 2008; Volume 19, pp. 1–366. [Google Scholar]
- Liu, H.; Motoda, H. Feature Selection for Knowledge Discovery and Data Mining; Springer Science & Business Media: Berlin/Heidelberg, Germany, 2012; Volume 454. [Google Scholar]
- Kramer, M.A. Nonlinear principal component analysis using autoassociative neural networks. AIChE J. 1991, 37, 233–243. [Google Scholar] [CrossRef]
- Kratsios, A.; Hyndman, C. Neu: A meta-algorithm for universal uap-invariant feature representation. J. Mach. Lear. Res. 2021, 22, 1–51. [Google Scholar]
- Cuadrado-Godia, E.; Maniruzzaman, M.; Araki, T.; Puvvula, A.; Rahman, M.J.; Saba, L.; Suri, H.S.; Gupta, A.; Banchhor, S.K.; Teji, J.S.; et al. Morphologic TPA (mTPA) and composite risk score for moderate carotid atherosclerotic plaque is strongly associated with HbA1c in diabetes cohort. Comput. Biol. Med. 2018, 101, 128–145. [Google Scholar] [CrossRef]
- Maniruzzaman, M.; Rahman, M.J.; Ahammed, B.; Abedin, M.M. Classification and prediction of diabetes disease using machine learning paradigm. Health Inf. Sci. Syst. 2020, 8, 1–14. [Google Scholar] [CrossRef]
- Maniruzzaman, M.; Rahman, M.J.; Al-MehediHasan, M.; Suri, H.S.; Abedin, M.M.; El-Baz, A.; Suri, J.S. Accurate diabetes risk stratification using machine learning: Role of missing value and outliers. J. Med. Syst. 2018, 42, 1–17. [Google Scholar] [CrossRef] [Green Version]
- Breiman, L. Random forests. Mach. Learn. 2001, 45, 5–32. [Google Scholar] [CrossRef] [Green Version]
- Rish, I. An empirical study of the naive Bayes classifier. In IJCAI 2001 Workshop on Empirical Methods in Artificial Intelligence; ResearchGate: Berlin, Germany, 2001; Volume 3, pp. 41–46. [Google Scholar]
- Quinlan, J.R. Simplifying decision trees. Int. J. Man. Mach. Stud. 1987, 27, 221–234. [Google Scholar] [CrossRef] [Green Version]
- Chen, T.; Guestrin, C. Xgboost: A scalable tree boosting system. In Proceedings of the 22nd Acm Sigkdd International Conference on Knowledge Discovery and Data Mining, San Francisco, CA, USA, 13–17 August 2016; pp. 785–794. [Google Scholar]
- Peterson, L.E. K-nearest neighbor. Scholarpedia J. 2009, 4, 1883. [Google Scholar] [CrossRef]
- Hastie, T.; Tibshirani, R.; Friedman, J. The Elements of Statistical Learning; Springer Series in Statistics; Springer: Berlin/Heidelberg, Germany, 2001. [Google Scholar]
- Cortes, C.; Vapnik, V. Support-vector networks. Mach. learn. 1995, 20, 273–297. [Google Scholar] [CrossRef]
- Zhang, X.; Wu, F.; Li, Z. Application of convolutional neural network to traditional data. Expert Syst. Appl. 2021, 168, 114185. [Google Scholar] [CrossRef]
- Tenev, A.; Markovska-Simoska, S.; Kocarev, L.; Pop-Jordanov, J.; Müller, A.; Candrian, G. Machine learning approach for classification of ADHD adults. Int. J. Psychophysiol. 2014, 93, 162–166. [Google Scholar] [CrossRef] [PubMed]
- Chu, K.C.; Huang, H.J.; Huang, Y.S. Machine learning approach for distinction of ADHD and OSA. In Proceedings of the 2016 IEEE/ACM international Conference on Advances in Social Networks Analysis and Mining (ASONAM), San Francisco, CA, USA, 18–21 August 2016; pp. 1044–1049. [Google Scholar]
- Christiansen, H.; Chavanon, M.L.; Hirsch, O.; Schmidt, M.H.; Meyer, C.; Müller, A.; Rumpf, H.J.; Grigorev, I.; Hoffmann, A. Use of machine learning to classify adult ADHD and other conditions based on the Conners’ Adult ADHD Rating Scales. Sci. Rep. 2020, 10, 1–10. [Google Scholar] [CrossRef] [PubMed]

| Variable Names | Question Types | Categories |
|---|---|---|
| Child’s age | Child age in years | Continuous |
| Sex | Sex of the child | Male and Female |
| Mother’s age | Mother’s age in years | Continuous |
| Allergies | Has a doctor ever told you that the selected child (S.C.) has allergies? | Yes and No |
| Arthritis | Has a doctor ever told you that S.C. has arthritis? | Yes and No |
| Asthma | Has a doctor ever told you that S.C. has asthma? | Yes and No |
| Brain injury | Has a doctor ever told you that S.C. has a brain injury | Yes and No |
| Headaches | Has a doctor ever told you that S.C. has frequent or severe headaches or migraine? | Yes and No |
| Anxiety | Has a doctor ever told you that S.C. had anxiety problems? | Yes and No |
| Depression | Has a doctor ever told you that S.C. had depression problems? | Yes and No |
| Insurance | Is S.C. currently covered by any kind of health insurance plan? | Yes and No |
| Alcohol | To the best of your knowledge, has S.C. ever experienced lived with anyone who had a problem with alcohol or drugs | Yes and No |
| Race | What is this child’s race? | White, Black, and Other |
| Family structure | Family structure | Two-parent-biological/step/adopted and Other-single mother/ father/other |
| Mother’s education | Highest level of education | <High school, High school, and > High school |
| Very LBW | Is child-birth weight <1.5 kg? | Yes and No |
| LBW | Is child-birth weight <2.5 kg? | Yes and No |
| Premature | Premature birth (>3 weeks before due date) | Yes and No |
| Poverty | Income-based on federal poverty level status | <200% and >=200% |
| Classifier Types | Hyper-Parameters | Optimized Values |
|---|---|---|
| RF | max_depth = (2, 3, 5), n_estimators = (25, 50, 100, 200, 300, 600, 1200), min_samples_split = (2, 3, 10), min_samples_leaf = (1, 3, 10), criterion = (gini, entropy) | max_depth = 3, n_estimators = 200, min_samples_split= 10, min_samples_leaf = 10, criterion= entropy |
| DT | min_samples_leaf = (1, 2, 3, 4, 5, 6, 7, 8, 9, 10, 11) | min_samples_leaf = 9 |
| KNN | k = (5, 6, 7,8, 9, 10), leaf_size = (1, 2, 3, 5) | k = 8, leaf_size = 1 |
| MLP | hidden_layer = [(50, 50, 50), (50, 160, 50), (100, 1)], activation = (relu, tanh, logistic), alpha = (0.0001, 0.05), learning_rate = (constant, adaptive) | hidden_layer = (50, 160, 50), activation = logistic, alpha = 0.05, learning_rate = adaptive |
| SVM | C = (1, 10, 100, 1000), = (0.001, 0.0001) | C = 1000, and = 0.001 |
| Variables | Overall, n (%) | Healthy, n (%) | ADHD, n (%) | p-Value |
|---|---|---|---|---|
| Total | 45,779 | 40,561 (88.6) | 5218 (11.4) | |
| Child’s age | 10.6 ± 4.4 | 10.4 ± 4.5 | 12.4 ± 3.4 | <0.001 |
| Sex, Male | 23,901 (52.2) | 20,304 (84.9) | 3597 (15.1) | <0.001 |
| Mother’s age | 30.0 ± 5.8 | 30.2 ± 5.7 | 28.7 ± 6.3 | <0.001 |
| Allergies, Yes | 13,930(30.4) | 11,889 (85.4) | 2041 (14.6) | <0.001 |
| Arthritis, Yes | 182 (0.4) | 151 (83.0) | 31 (17.0) | 0.039 |
| Asthma, Yes | 6293 (13.8) | 5180 (82.3) | 1113 (17.7) | <0.001 |
| Brain injury, Yes | 2482 (5.4) | 2048 (82.5) | 434 (17.5) | <0.001 |
| Headache, Yes | 2457 (5.4) | 1931 (78.6) | 526 (21.4) | <0.001 |
| Anxiety, Yes | 5850 (12.8) | 3652 (62.4) | 2198 (37.6) | <0.001 |
| Depression, Yes | 2744 (6.0) | 1595 (58.1) | 1149 (41.9) | <0.001 |
| Insurance, Yes | 44,057 (96.2) | 39,008 (88.5) | 5049 (11.46) | 0.035 |
| Alcohol, Yes | 4728 (10.3) | 3712 (78.5) | 1016 (21.5) | <0.001 |
| Race, White | 36,235 (79.2) | 31,935 (88.1) | 4300 (11.9) | <0.001 |
| Family structure, two parent-biological/step/adopted | 35,551 (77.7) | 31,940 (89.8) | 3611 (10.2) | <0.001 |
| Mother’s education, High school | 39,048 (85.3) | 34,725 (88.9) | 4323 (11.1) | <0.001 |
| Very LBW, Yes | 558 (1.2) | 451 (80.8) | 107 (19.2) | <0.001 |
| LBW, Yes | 3837 (8.4) | 3289 (85.7) | 548 (14.3) | <0.001 |
| Premature, Yes | 5090 (11.1) | 4287 (84.2) | 803 (15.8) | <0.001 |
| Poverty, <200% | 12,079 (26.4) | 10,426 (86.3) | 1653 (13.7) | <0.001 |
| Variables | OR (95% CI) | SE | p-Value |
|---|---|---|---|
| Child’s age | 1.103 (1.096–1.110) | 0.004 | <0.001 |
| Sex | |||
| Male | 2.727 (2.586–2.877) | 0.074 | <0.001 |
| Female® | 1.000 | ||
| Mother’s age | 0.971 (0.967–0.975) | 0.002 | <0.001 |
| Allergies | |||
| Yes | 1.161 (1.098–1.228) | 0.033 | <0.001 |
| No® | 1.000 | ||
| Arthritis | |||
| Yes | 0.688 (0.442–1.026) | 0.153 | 0.088 |
| No® | 1.000 | ||
| Asthma | |||
| Yes | 1.225 (1.140–1.316) | 0.045 | <0.001 |
| No® | 1.000 | ||
| Brain injury | |||
| Yes | 0.933 (0.837–1.039) | 0.051 | 0.260 |
| No® | 1.000 | ||
| Headache | |||
| Yes | 0.979 (0.879-1.090) | 0.054 | 0.702 |
| No® | 1.000 | ||
| Anxiety | |||
| Yes | 5.217 (4.848–5.613) | 0.195 | <0.001 |
| No® | 1.000 | ||
| Depression | |||
| Yes | 1.807 (1.628–2.005) | 0.096 | <0.001 |
| No® | 1.000 | ||
| Alcohol | |||
| Yes | 1.383 (1.202–1.591) | 0.099 | <0.001 |
| No® | 1.000 | ||
| Insurance | |||
| Yes | 1.440 (1.330–1.558) | 0.058 | <0.001 |
| No® | 1.000 | ||
| Alcohol | |||
| Yes | 1.393 (1.274–1.523) | 0.064 | 0.001 |
| No® | |||
| Race | |||
| White | 1.431 (1.323–1.548) | 0.057 | <0.001 |
| Black | 1.636 (1.449–1.848) | 0.102 | <0.001 |
| Others® | 1.000 | ||
| Family structure | |||
| Two parent biological/step/adopted | 0.833 (0.781–0.887) | 0.027 | <0.001 |
| Other-single mother/father/other® | 1.000 | ||
| Mother’s education | |||
| <High school | 0.876 (0.733–1.046) | 0.079 | 0.142 |
| High school | 1.062 (0.983–1.149) | 0.042 | 0.129 |
| >High school® | 1.000 | ||
| Very LBW | |||
| Yes | 1.353 (1.083–1.691) | 0.195 | 0.003 |
| No® | 1.000 | ||
| LBW | |||
| Yes | 1.015 (0.910–1.132) | 0.057 | 0.791 |
| No® | 1.000 | ||
| Premature | |||
| Yes | 1.474 (1.346–1.615) | 0.069 | <0.001 |
| No® | 1.000 | ||
| Poverty | |||
| <200% | 1.093 (1.012–1.178) | 0.042 | 0.002 |
| >=200%® | 1.000 |
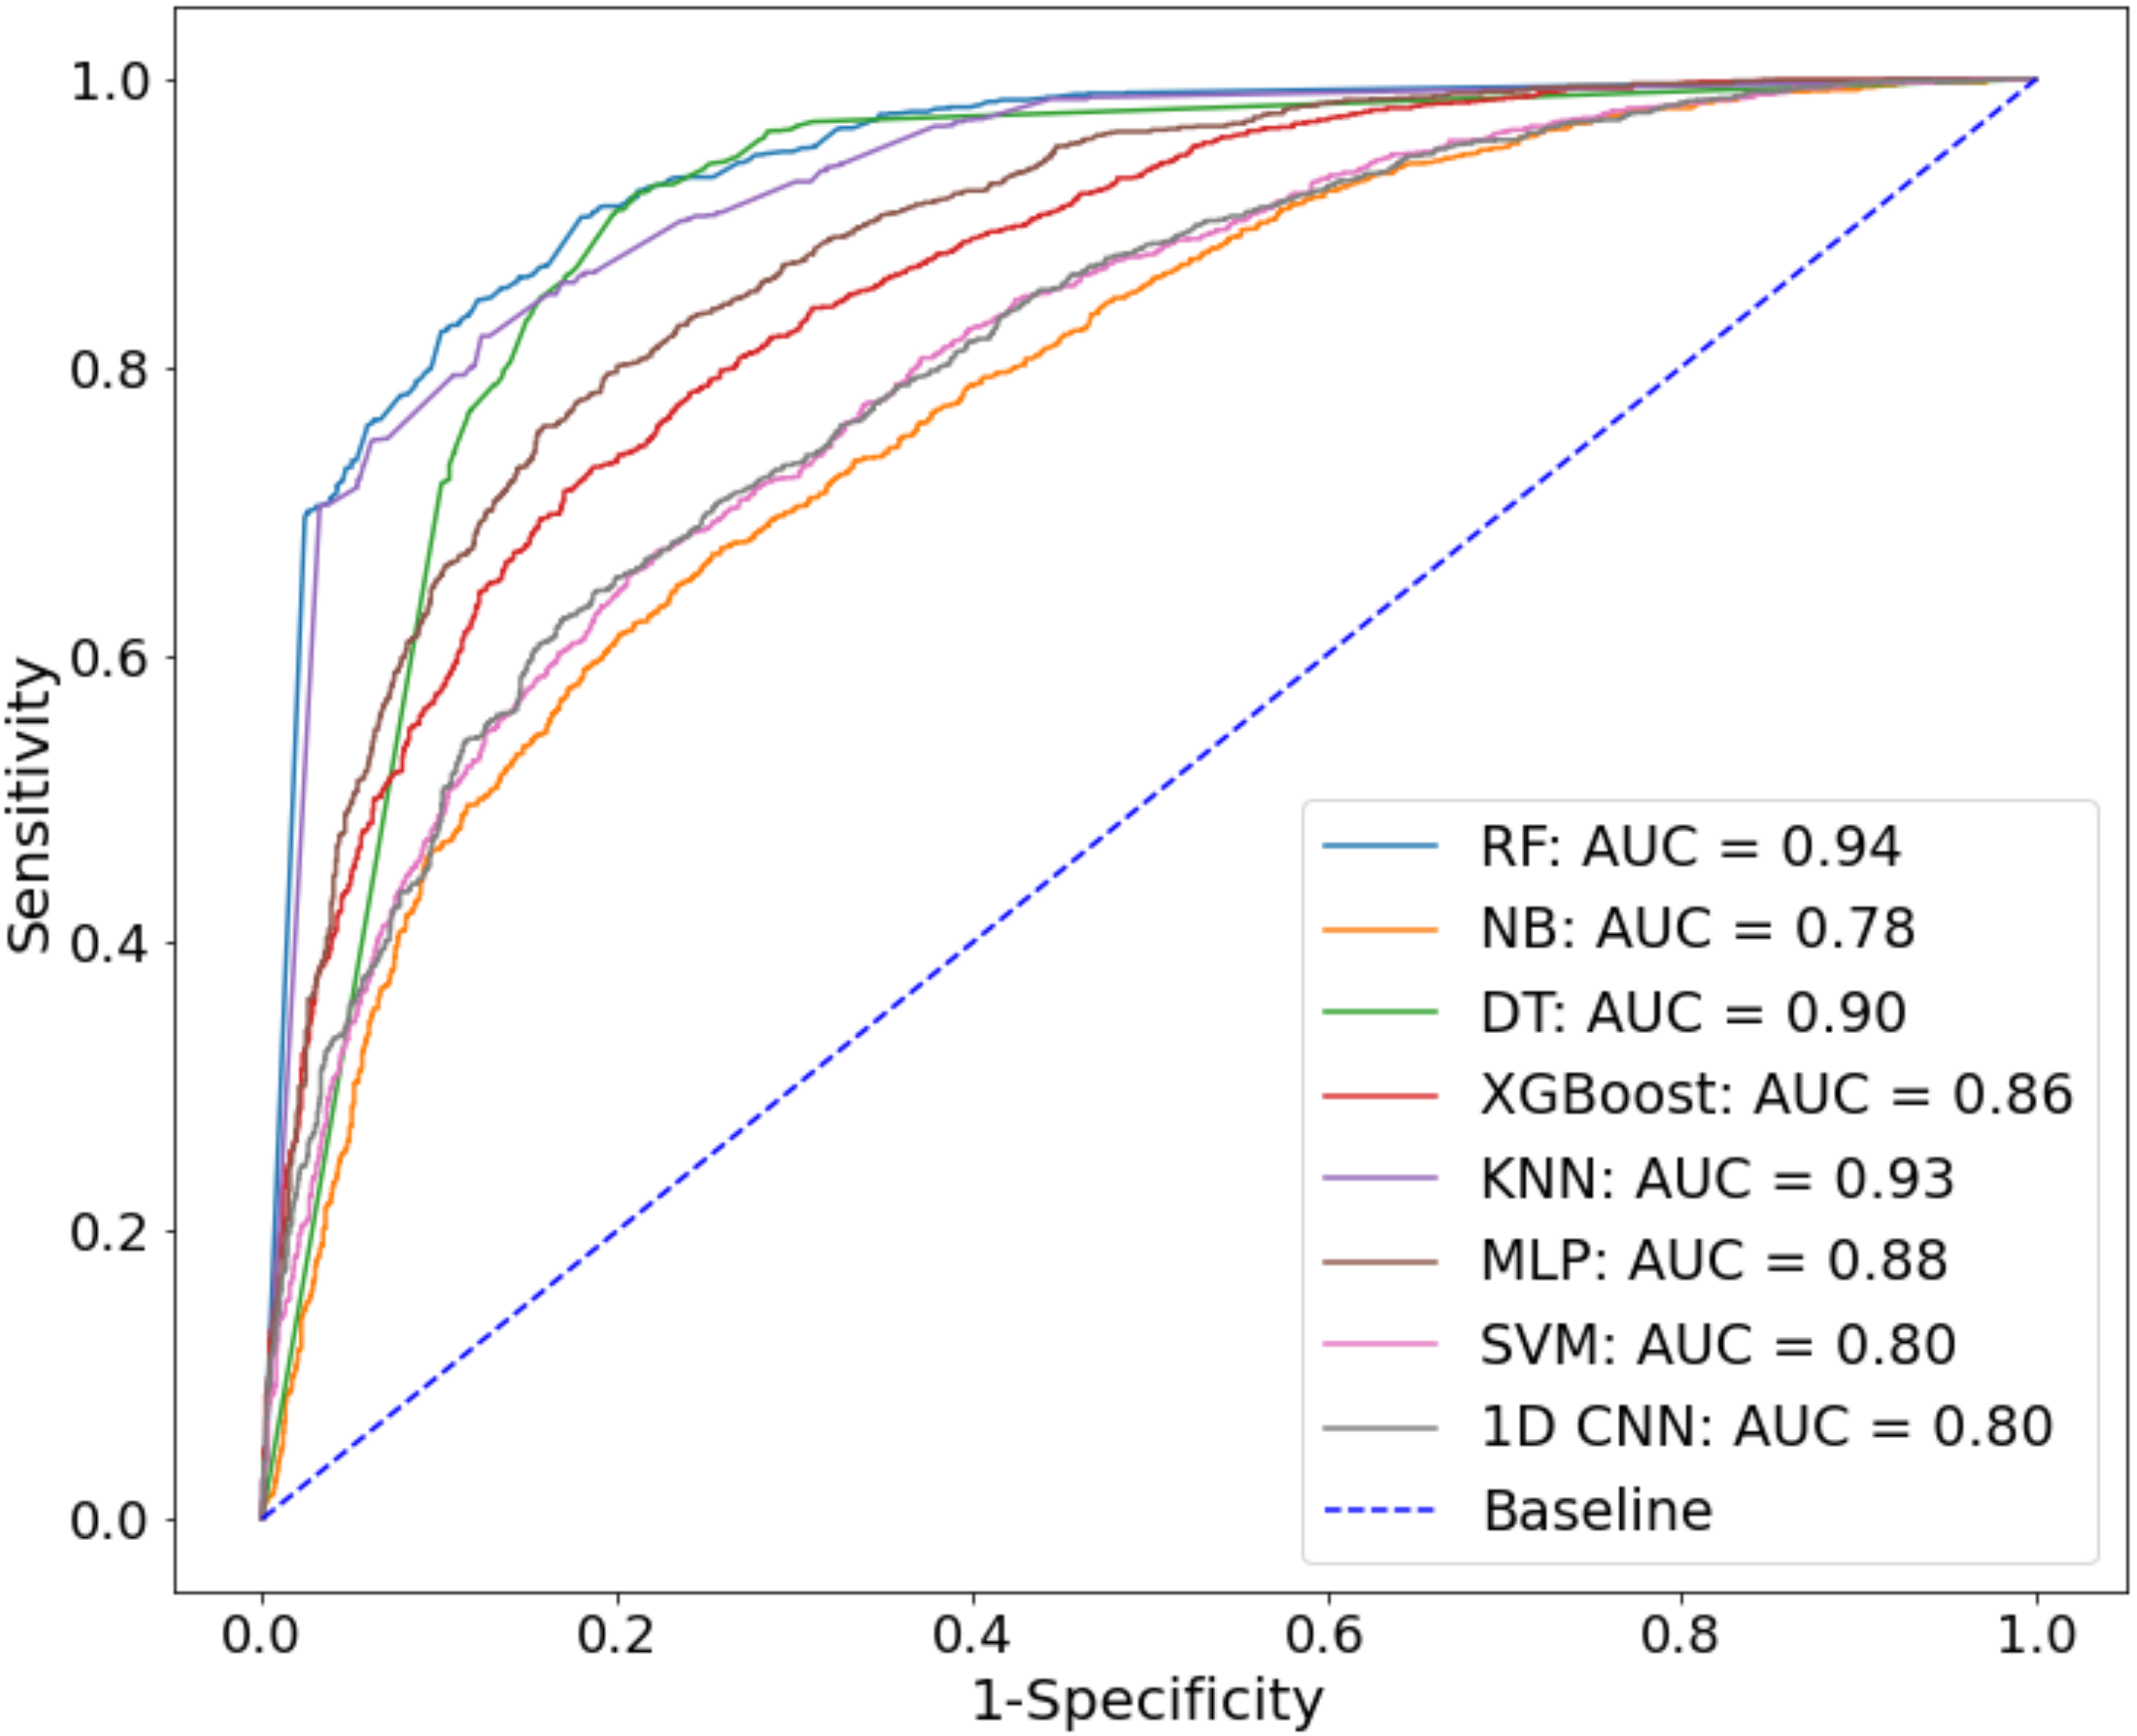
| Classifier Types | Accuracy (%) | SE (%) | SP (%) | AUC |
|---|---|---|---|---|
| RF | 85.5 | 84.4 | 86.4 | 0.94 |
| NB | 69.8 | 77.3 | 65.3 | 0.78 |
| DT | 84.6 | 83.4 | 86.0 | 0.90 |
| XGBoost | 77.0 | 76.8 | 77.3 | 0.86 |
| KNN | 84.0 | 82.6 | 85.6 | 0.92 |
| MLP | 79.9 | 80.1 | 79.6 | 0.88 |
| SVM-RBF | 71.9 | 72.9 | 70.9 | 0.80 |
| 1D CNN | 72.1 | 80.1 | 84.4 | 0.80 |
Publisher’s Note: MDPI stays neutral with regard to jurisdictional claims in published maps and institutional affiliations. |
© 2022 by the authors. Licensee MDPI, Basel, Switzerland. This article is an open access article distributed under the terms and conditions of the Creative Commons Attribution (CC BY) license (https://creativecommons.org/licenses/by/4.0/).
Share and Cite
Maniruzzaman, M.; Shin, J.; Hasan, M.A.M. Predicting Children with ADHD Using Behavioral Activity: A Machine Learning Analysis. Appl. Sci. 2022, 12, 2737. https://doi.org/10.3390/app12052737
Maniruzzaman M, Shin J, Hasan MAM. Predicting Children with ADHD Using Behavioral Activity: A Machine Learning Analysis. Applied Sciences. 2022; 12(5):2737. https://doi.org/10.3390/app12052737
Chicago/Turabian StyleManiruzzaman, Md., Jungpil Shin, and Md. Al Mehedi Hasan. 2022. "Predicting Children with ADHD Using Behavioral Activity: A Machine Learning Analysis" Applied Sciences 12, no. 5: 2737. https://doi.org/10.3390/app12052737
APA StyleManiruzzaman, M., Shin, J., & Hasan, M. A. M. (2022). Predicting Children with ADHD Using Behavioral Activity: A Machine Learning Analysis. Applied Sciences, 12(5), 2737. https://doi.org/10.3390/app12052737