Article

Improved MSRN-Based Attention Block for Mask Alignment Mark Detection in Photolithography

Department of Smart Factory Convergence, Sungkyunkwan University, 2066 Seobu-ro, Jangan-gu, Suwon 16419, Korea
*
Author to whom correspondence should be addressed.
Appl. Sci. 2022, 12(5), 2721; https://doi.org/10.3390/app12052721
Submission received: 30 January 2022 / Revised: 28 February 2022 / Accepted: 4 March 2022 / Published: 6 March 2022
(This article belongs to the Special Issue Modern Computer Vision and Image Processing)

Abstract

:
Wafer chips are manufactured in the semiconductor industry through various process technologies. Photolithography is one of these processes, aligning the wafer and scanning the circuit pattern on the wafer on which the photoresist film is formed by irradiating light onto the circuit pattern drawn on the mask. As semiconductor technology is highly integrated, alignment is becoming increasingly difficult due to problems such as reduction of alignment margin, transmittance due to level stacking structure, and an increase in wafer diameter in the photolithography process. Various methods and research to reduce the misalignment problem that is directly related to the yield of production are constantly being conducted. In this paper, we use machine vision for exposure equipment to improve the image resolution quality of marks for accurate alignment. To improve image resolution quality, we propose an improved Multi-Scale Residual Network (MSRN) that combines Attention Mechanism using a Multi-Scale Residual Attention Block to improve image resolution quality. Our proposed method can extract enhanced features using two different bypass networks and attention blocks with different scale convolution filters. Experiments were used to verify this method, and the performance was improved compared with previous research.

1. Introduction

Wafer chips are used in various industries as core components of electronic devices. The process for manufacturing a semiconductor consists of eight major processes and is divided into a front-end process for processing wafers and a back-end process for cutting and assembling chips in the processed wafer [1,2]. Wafer fabrication, photo-etching, thin film deposition, metal wiring, oxidation and diffusion, ion implantation, chemical mechanical polishing, and cleaning processes are all included in the front-end. In addition, in the back-end, there are processes of electrical die sorting, packaging, and final inspection [3]. Various types of wafer defects occur whenever various processes are performed [4]. In particular, as the difficulty of implementing patterns increases with Pattern Shrink, great difficulties are experienced in overlay management [5]. A semiconductor is composed of a stacked structure of numerous layers, and a circuit is drawn according to an existing design pattern by sequentially stacking layers of conductors and insulators on the wafer through exposure and etching processes.
The overlay vertically stacks the patterns formed on each layer in precise positions, and precise alignment technology is required to increase the overlay value [6]. Additionally, a Critical Dimension (CD) is used to describe the horizontal uniformity of the circuits. The minimum line width is the distance between the patterns, and the CD value should not vary depending on the position of the wafer. The CD value is uniform when measured at the wafer’s center and edge [7]. Using the detected overlayed data, an overlay correction value is calculated and fed back to the exposure apparatus to prevent misalignment defects in subsequent wafers. Each unit process guarantees a high production yield and is developed to strengthen competitiveness in the semiconductor manufacturing industry. Methods and devices for measuring process errors in each unit process are being actively researched. Through technology development, an optimization process is being formed in photolithography, and the performance of major equipment in the process is improving [8]. Misalignment of the photoresist pattern formed by exposure development is one of the considerations during photolithography. As semiconductor technology is highly integrated, alignment is becoming increasingly difficult due to problems such as reduction of alignment margin, transmittance due to level stacking structure, and an increase in wafer diameter and photolithography. Furthermore, misalignment problems occur due to problems such as wafer stage defects, reticle stage defects, and lens defects. To prevent misalignment defects, it is essential to optimize the overlay measurement process, which is an operation to check the alignment of the photoresist pattern formed on the wafer.
A machine vision system is a special optical device that acquires an image from a digital sensor protected inside an industrial camera, through which computer hardware and software process and measure various characteristics for decision making [9,10]. Image processing technology has recently advanced, and camera devices and sensors in production and manufacturing environments have become more intelligent. Additionally, manufacturing process optimization and autonomous correction of manufacturing conditions are becoming possible. Image and image processing technology that achieves high resolution and precision is increasing, and the introduction of visual sensors using images, lasers, lidars, and ultrasonic waves is expanding [11]. When a camera creates an image, the resolution of vision is a numerical expression of a scale that can express an object in detail, and the higher the number of pixels in the photosensitive area, the higher the resolution. To increase the accuracy of object recognition using machine vision, it is necessary to improve the resolution [12]. Recently, super-resolution imaging through deep learning has increased research value in the computer vision and image processing fields. Zhang et al. [13] proposed a high-speed medical imaging super-resolution method based on a deep learning network, and Yongyang et al. [14] proposed road extraction of high-resolution remote sensing images using deep learning. Ugur et al. [15] proposed a comparative study of deep learning approaches for airplane detection in super-resolution satellites.
In this study, we focus on an algorithm that extracts main features to improve image resolution, improves and learns the extracted features, and generates high-resolution images. By improving the resolution of alignment marks and patterns in photography in the semiconductor manufacturing industry, we propose an architecture with improved object detection performance.
This paper’s contributions are as follows:
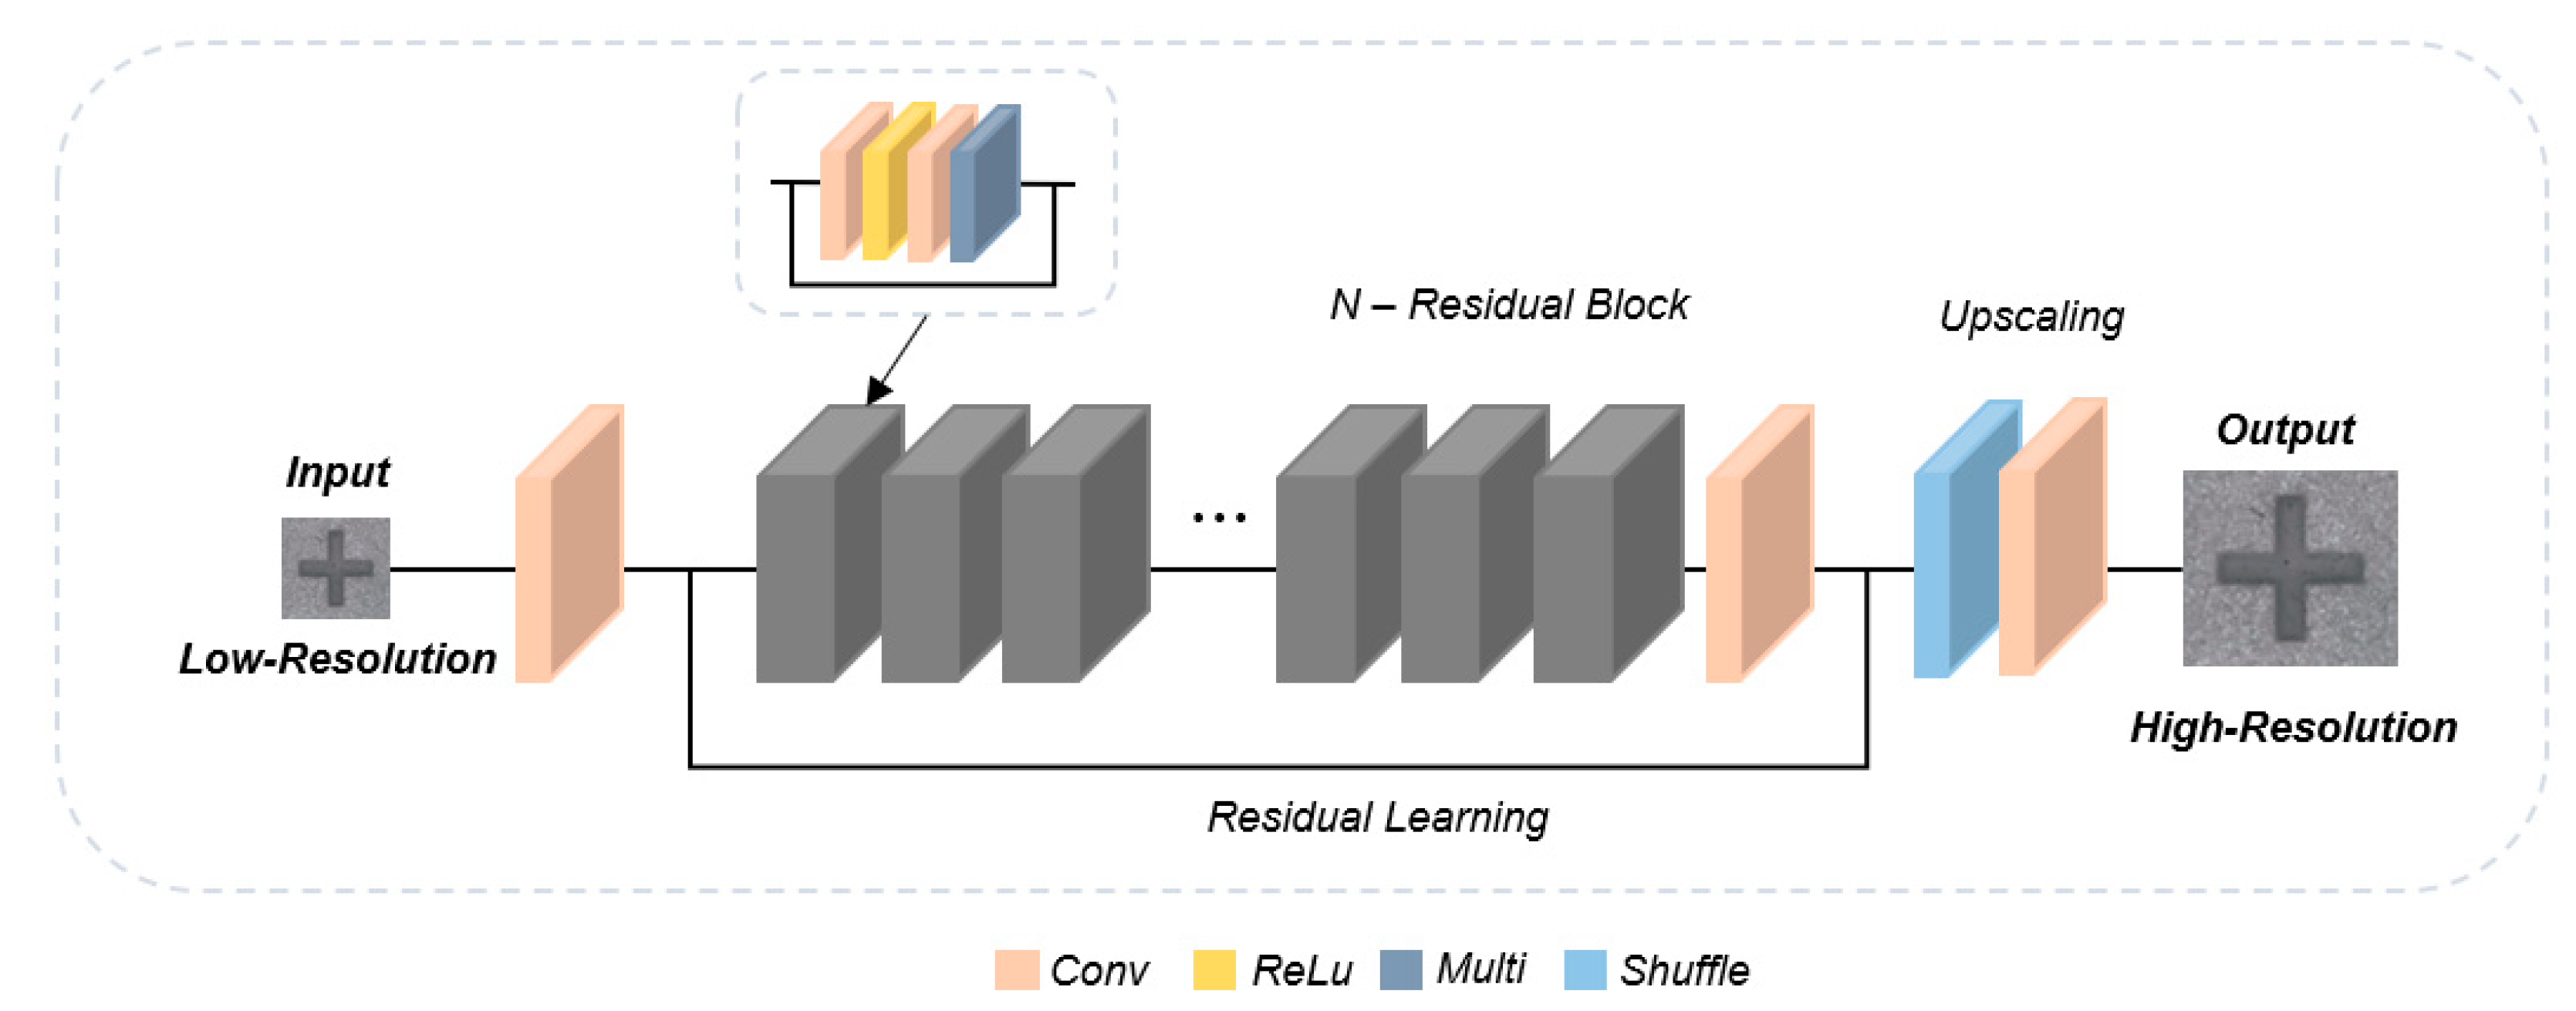
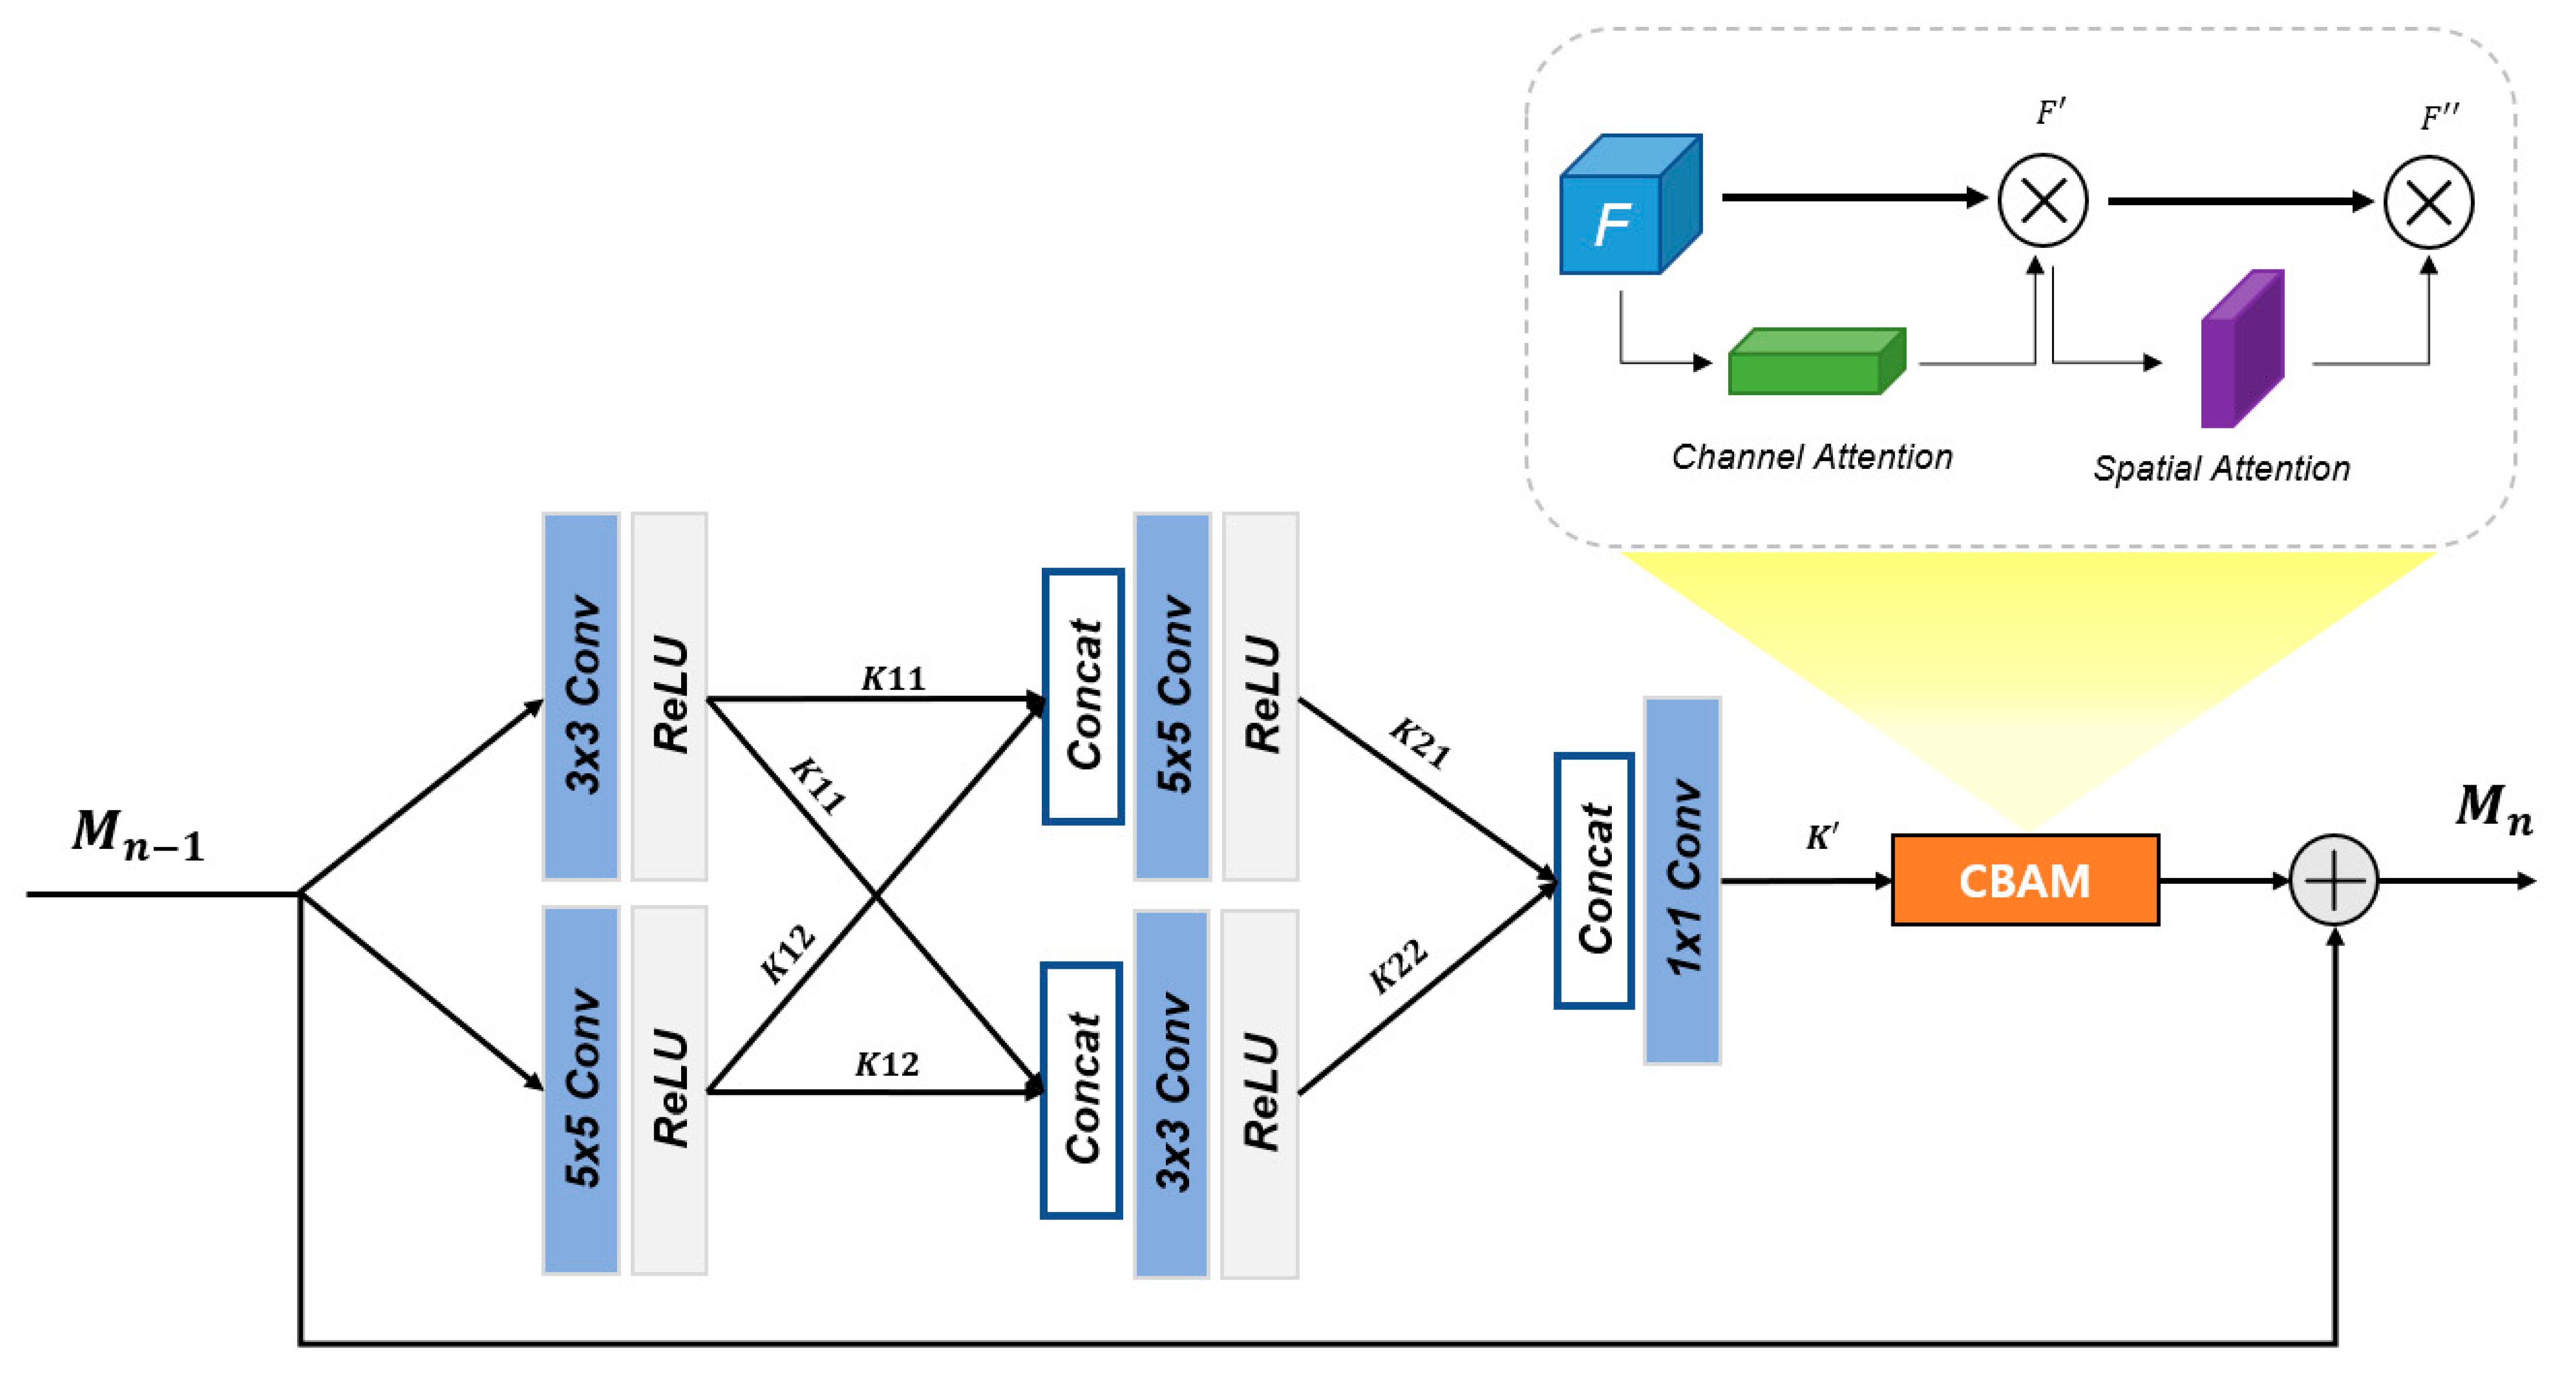
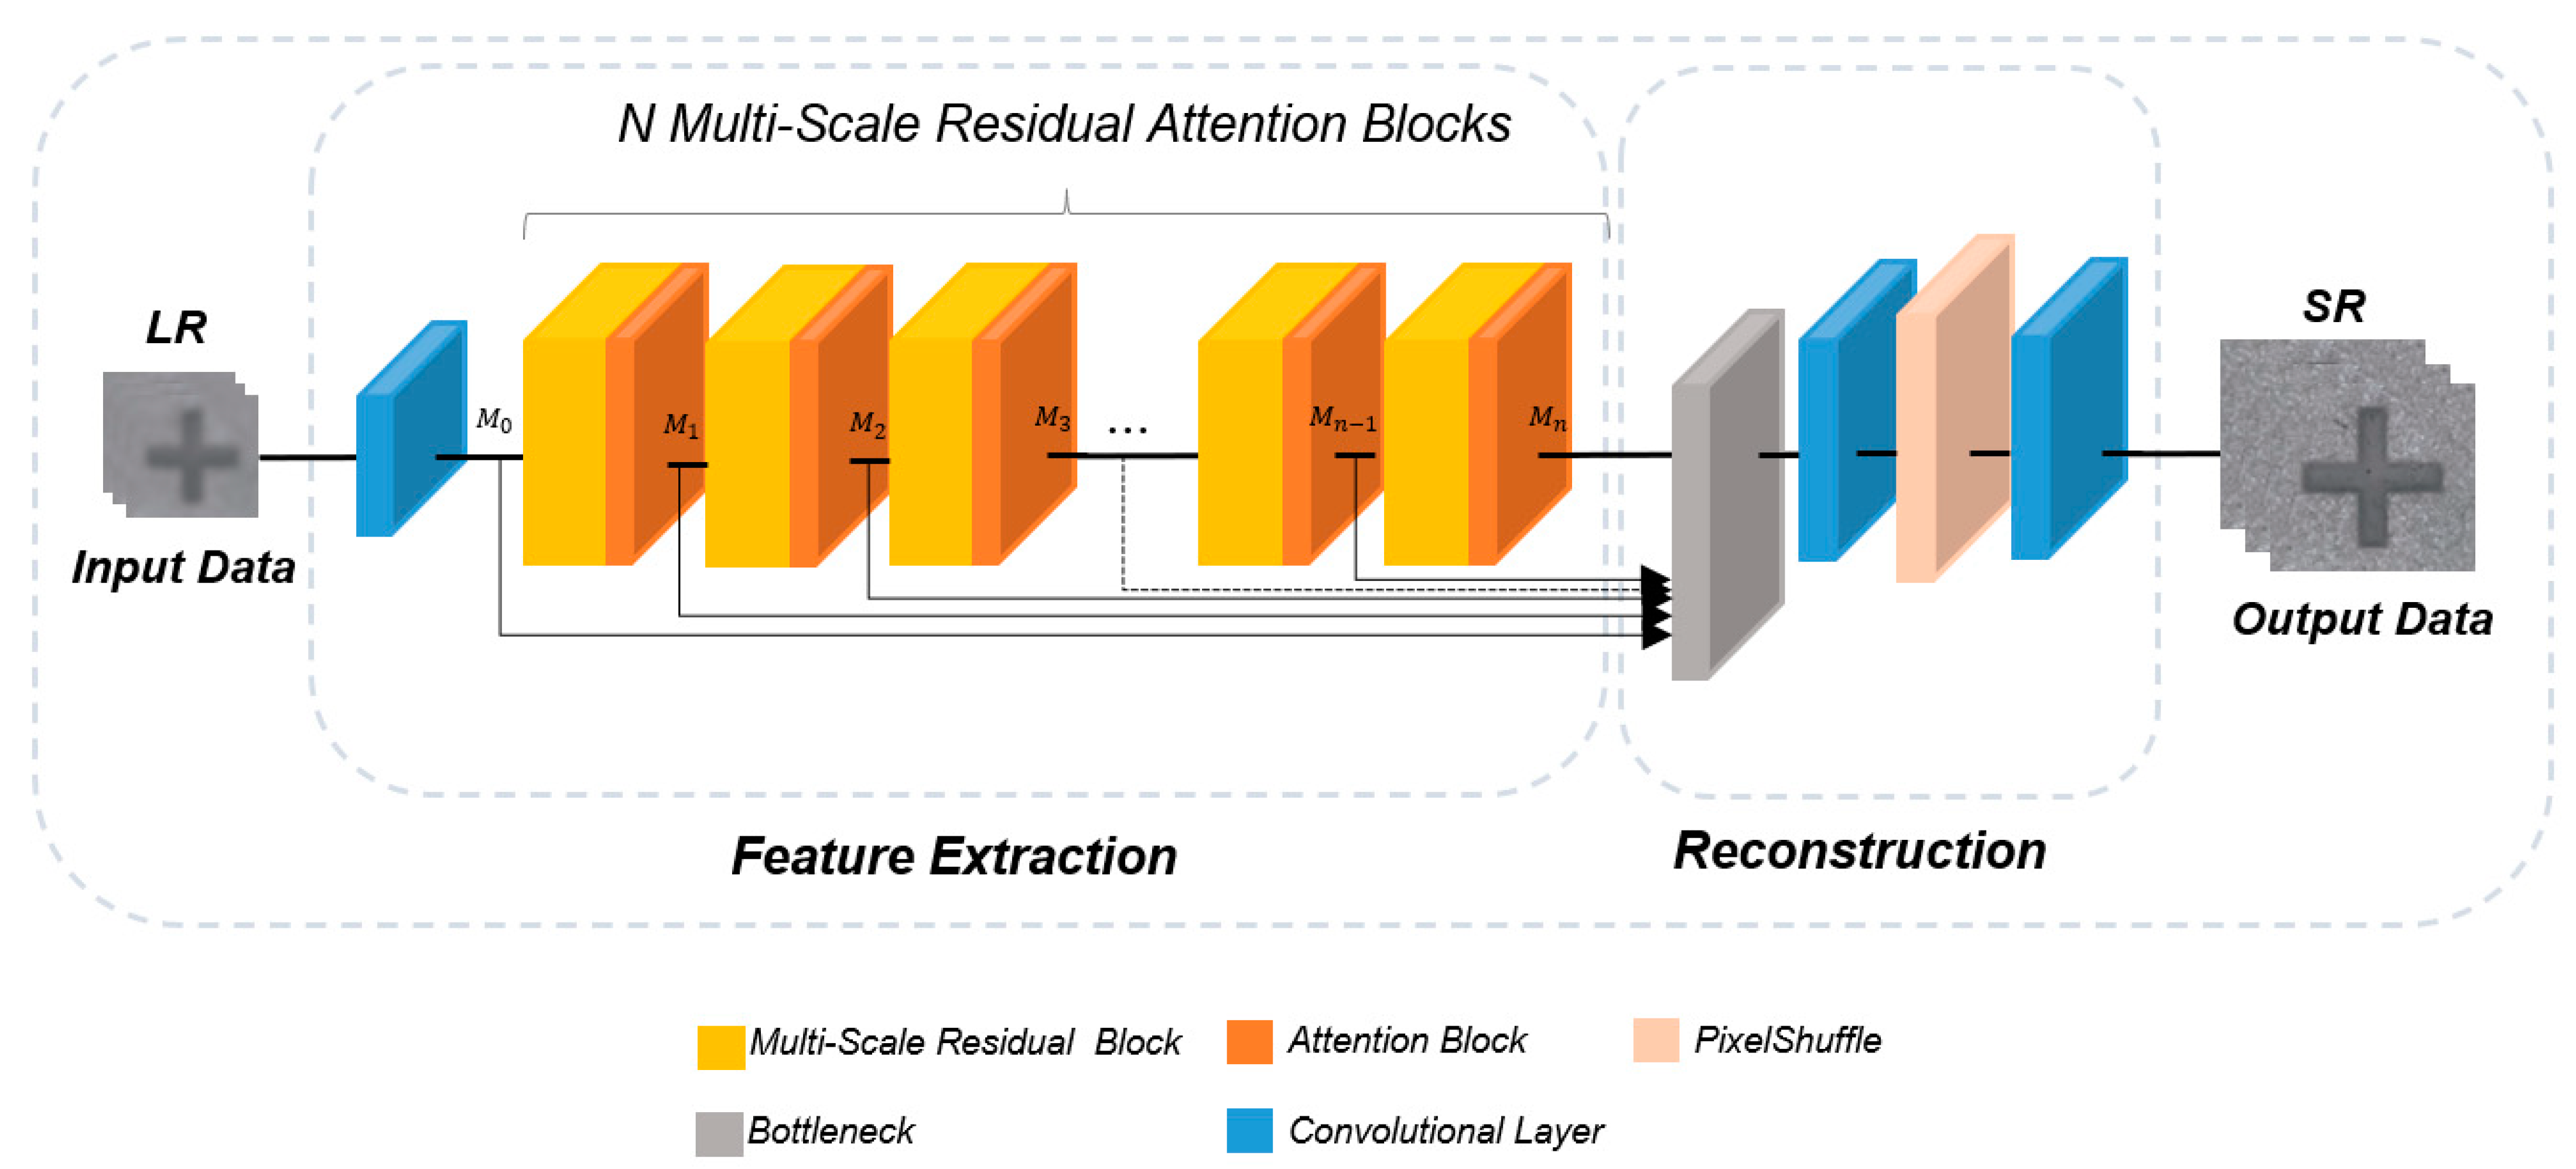
  • A Multi-Scale Residual Attention Block was constructed by applying an Attention Mechanism based on the Multi-Scale Residual Network. We proposed a High-Resolution (HR) model in which the resolution of Low-Resolution (LR) images is improved and the extracted features are improved by reconstructing the model structure of a multiscale network.
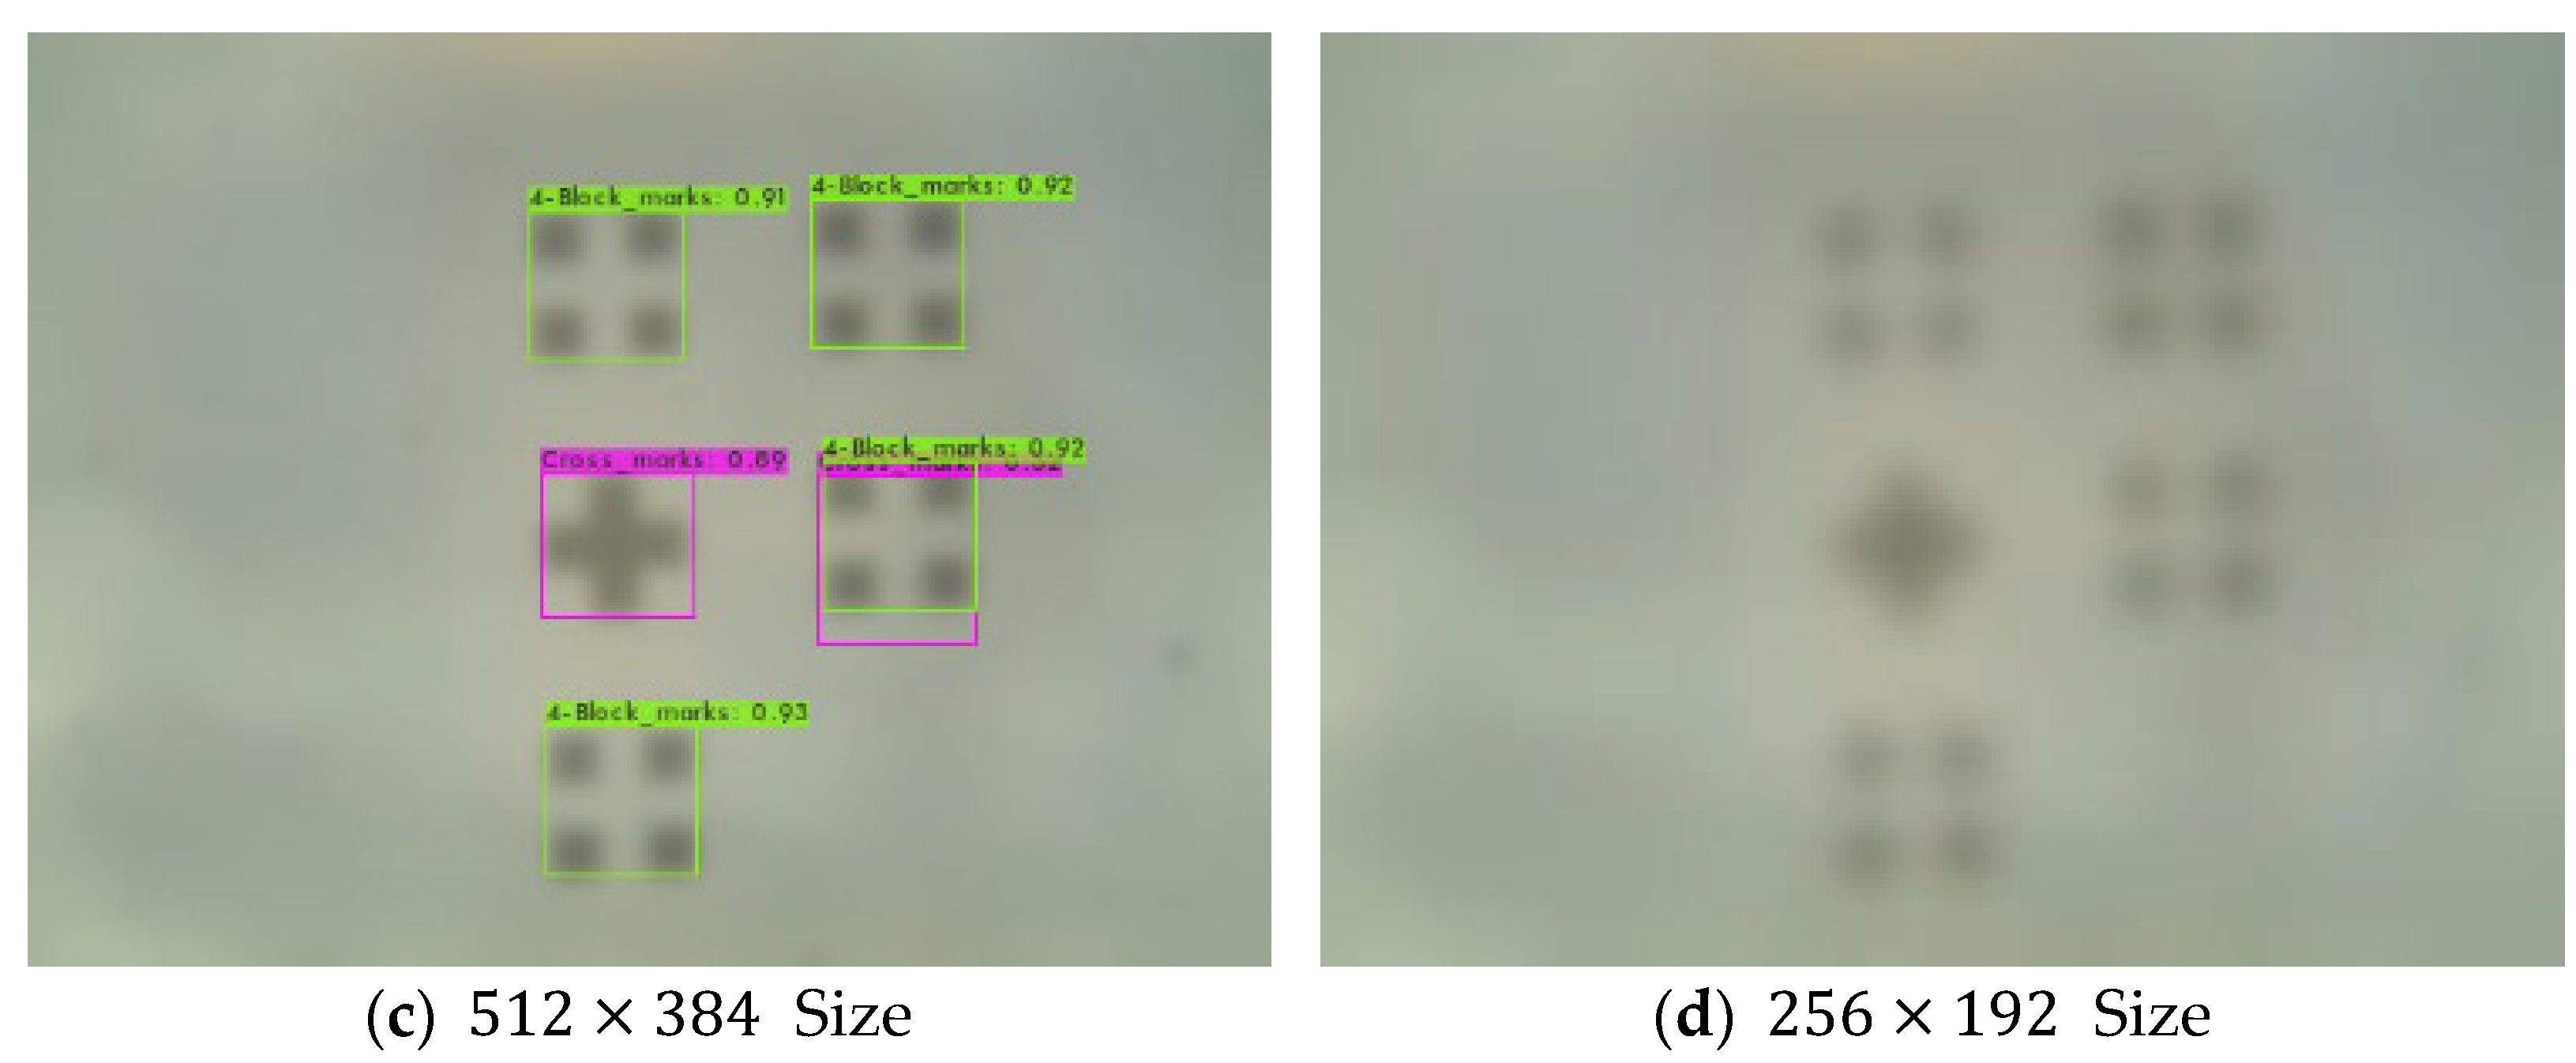
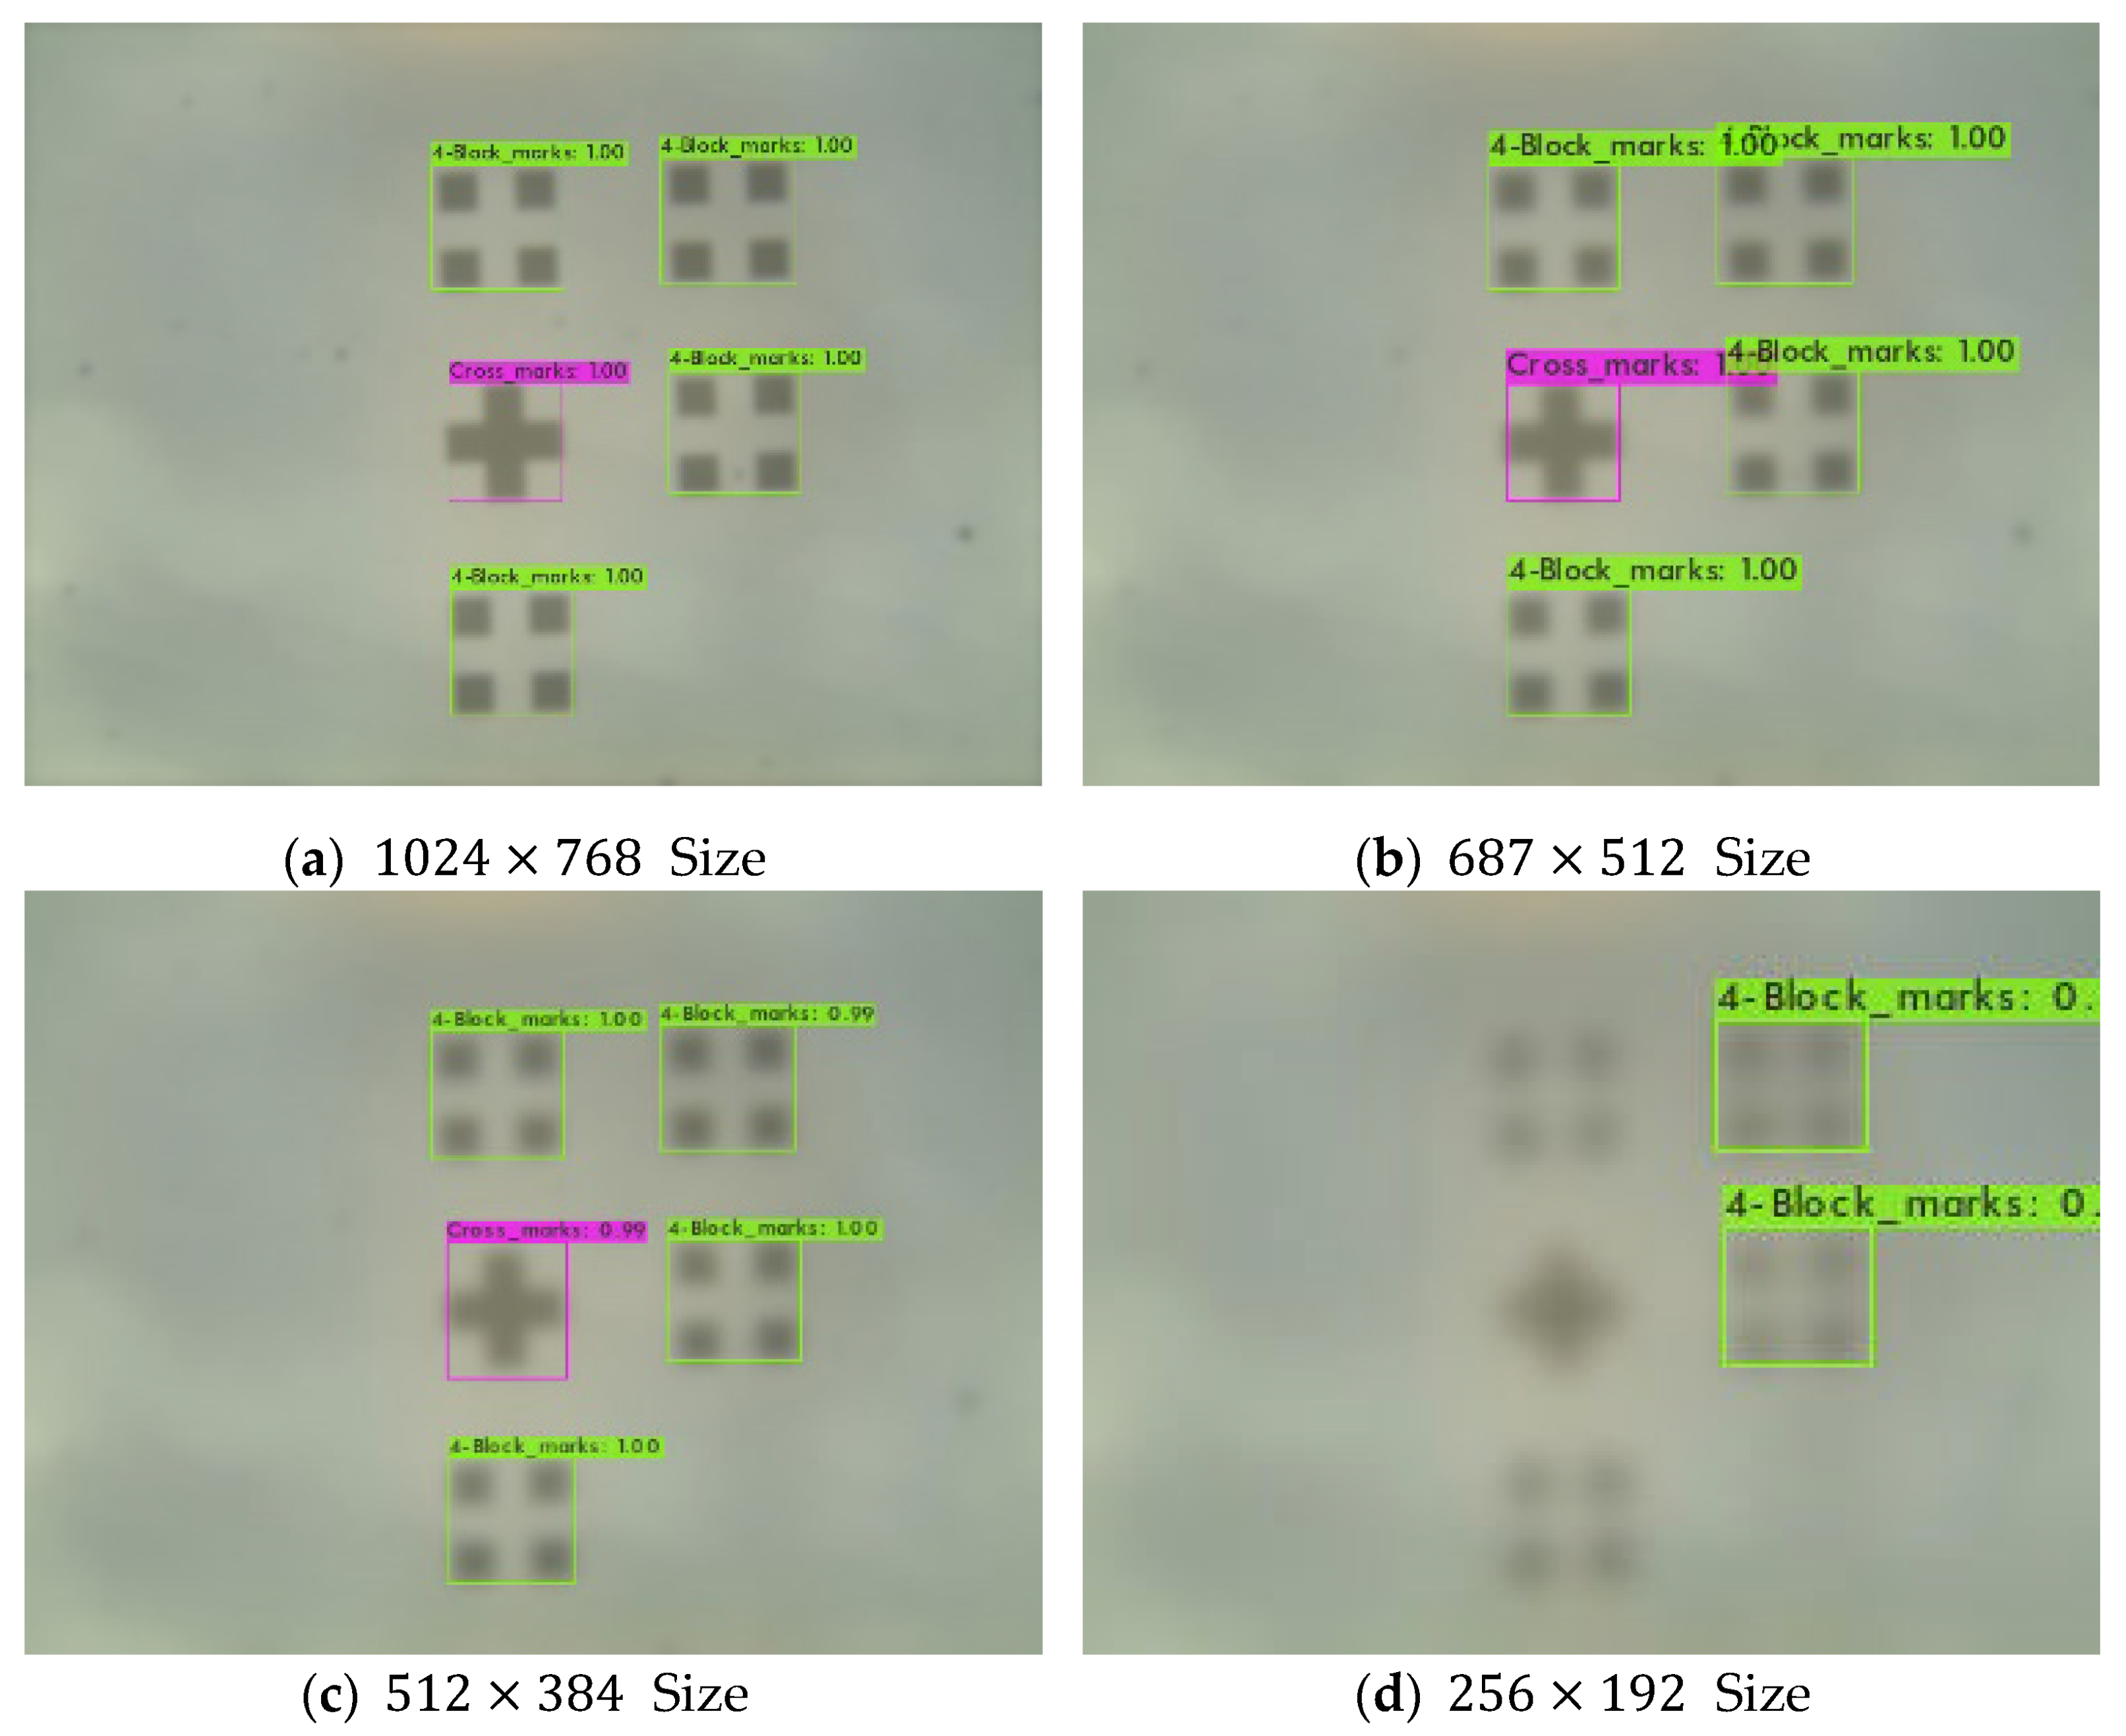
  • We proved that object detection is improved by increasing the image resolution of the proposed model. When detecting an object through a vision machine, the detection performance is improved by improving the resolution.
  • The data collected through the equipment is pre-processed and learned, and it is reliable in practical application through the analysis of the results, images, and detection obtained by conducting various experiments.
The structure of this paper is as follows. In Section 2, alignment technology in photolithography, SISR and MSRN, and Attention Mechanisms are explained as related studies. Section 3 describes the proposed architecture and details. Section 4 describes the experimental progress, evaluation indicators, and experimental results. Section 5 describes the conclusion and future research.

2. Related Work

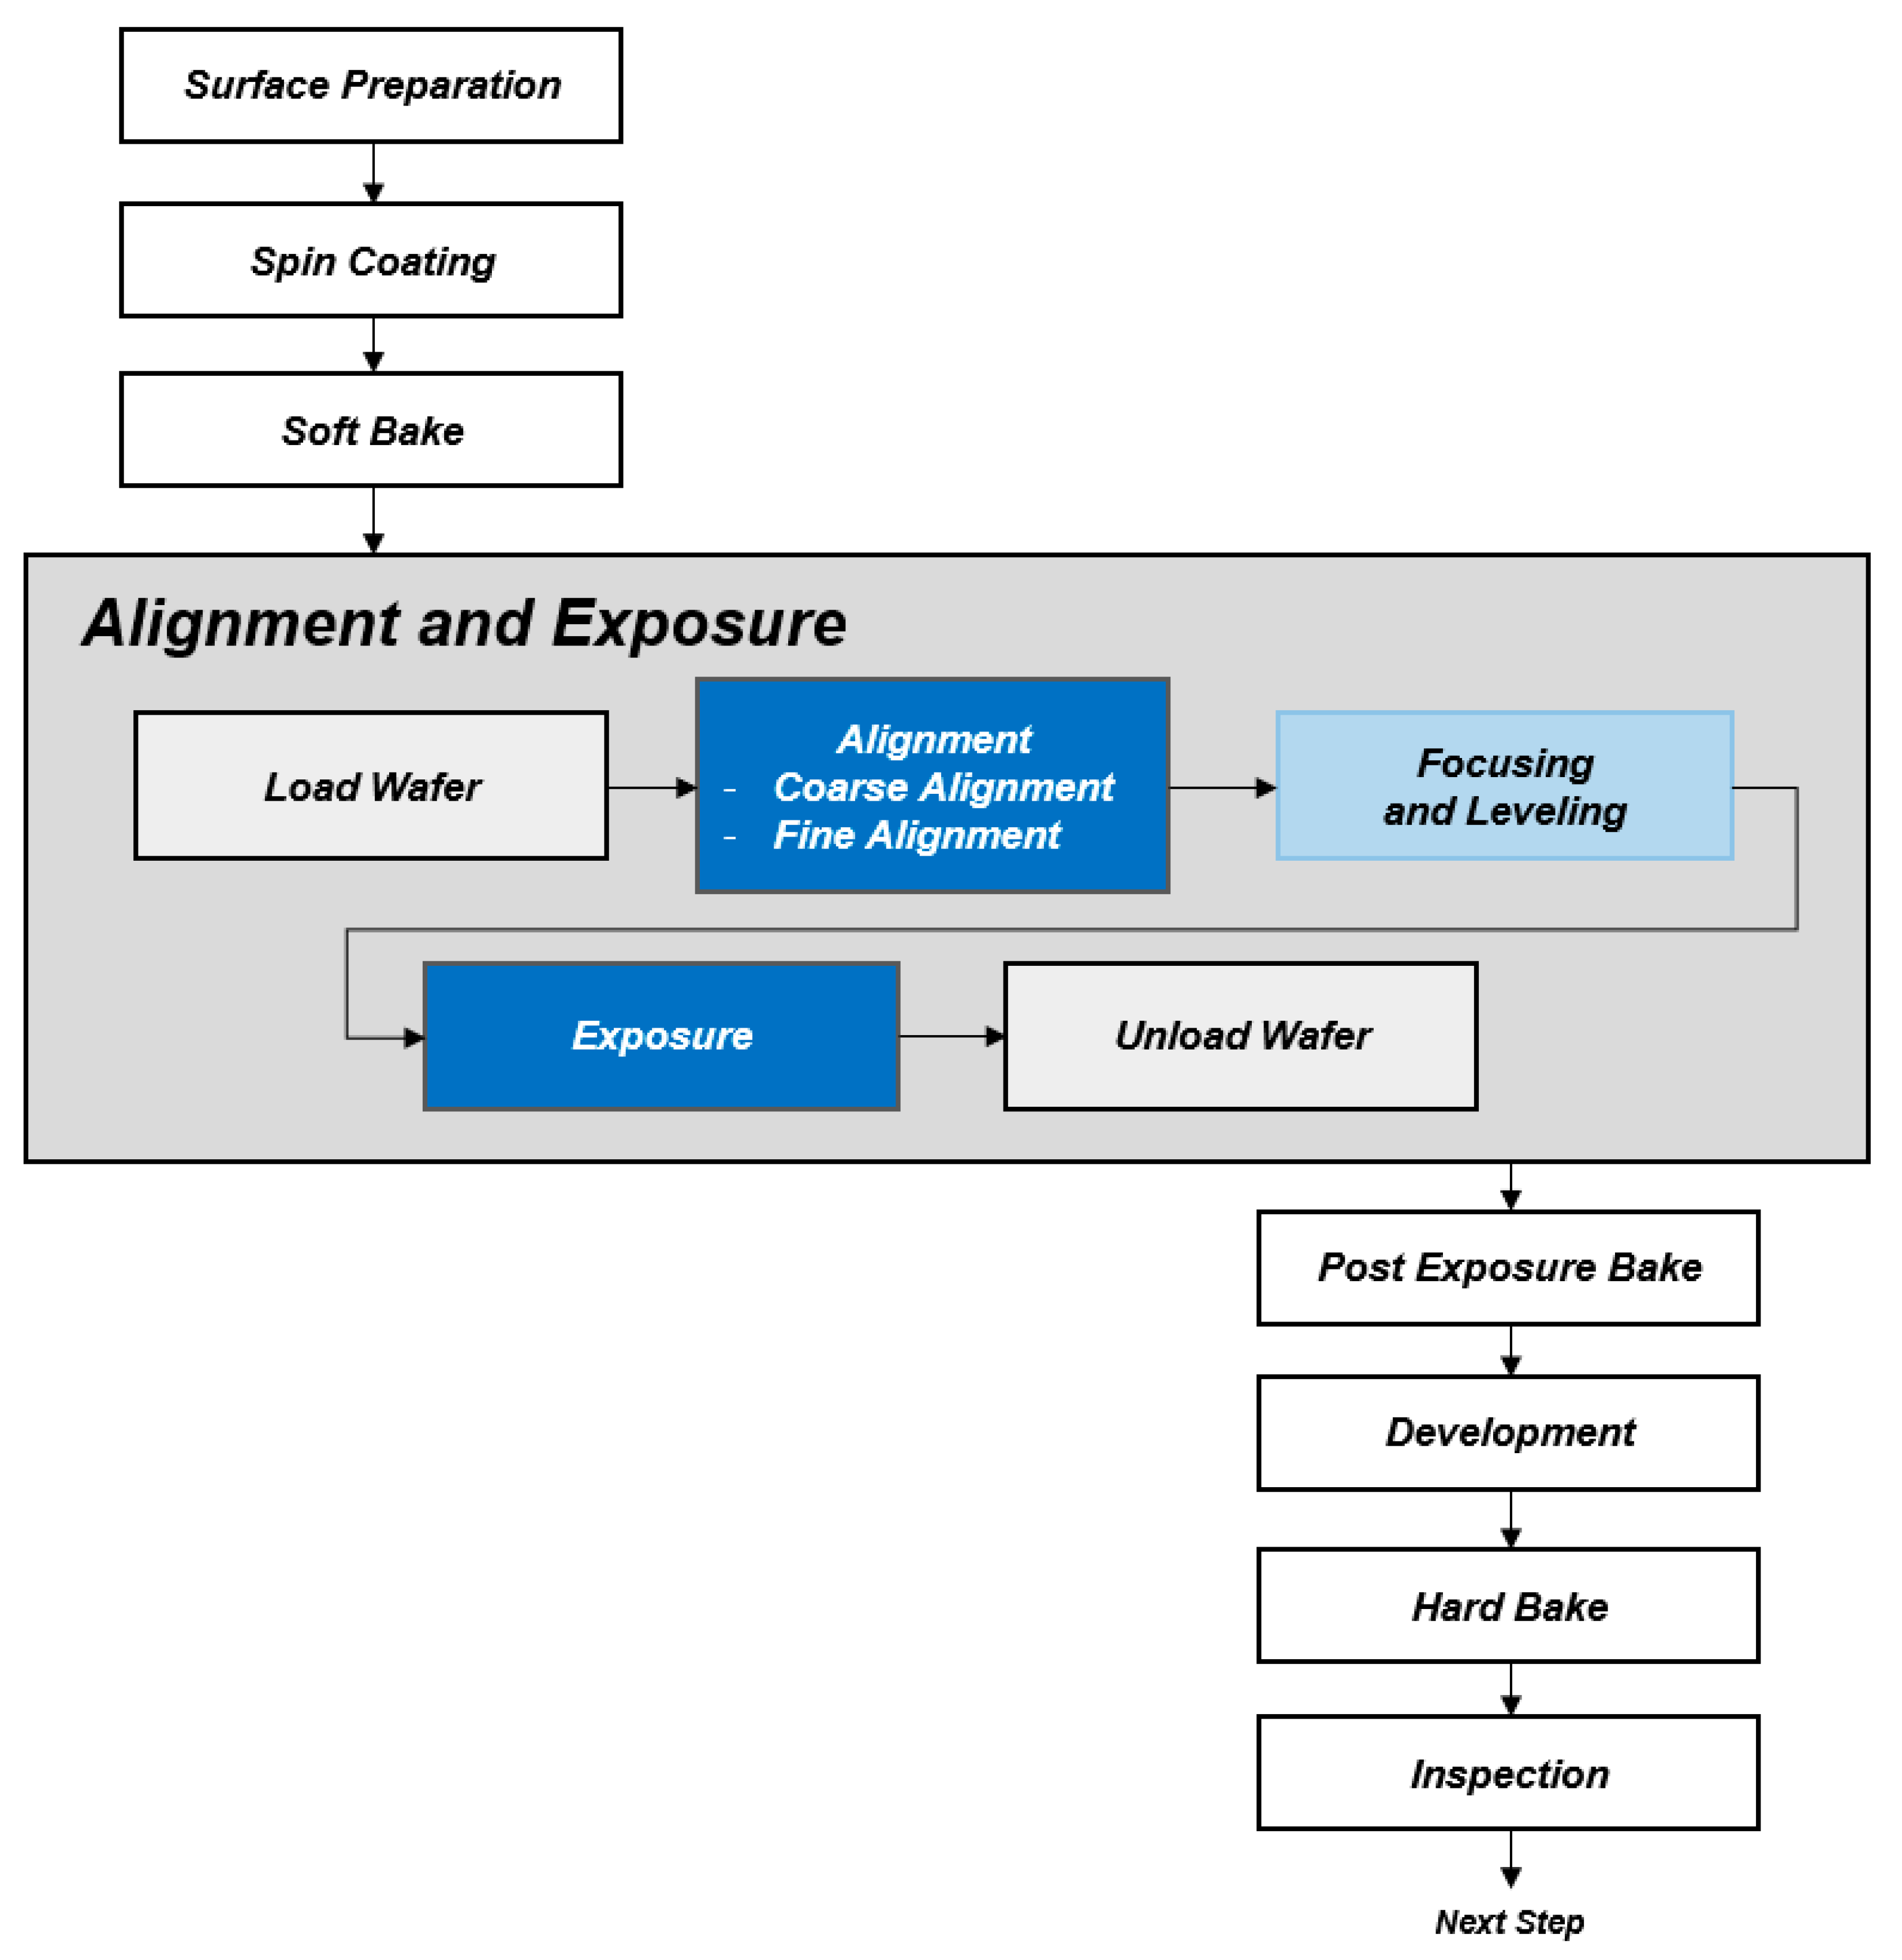
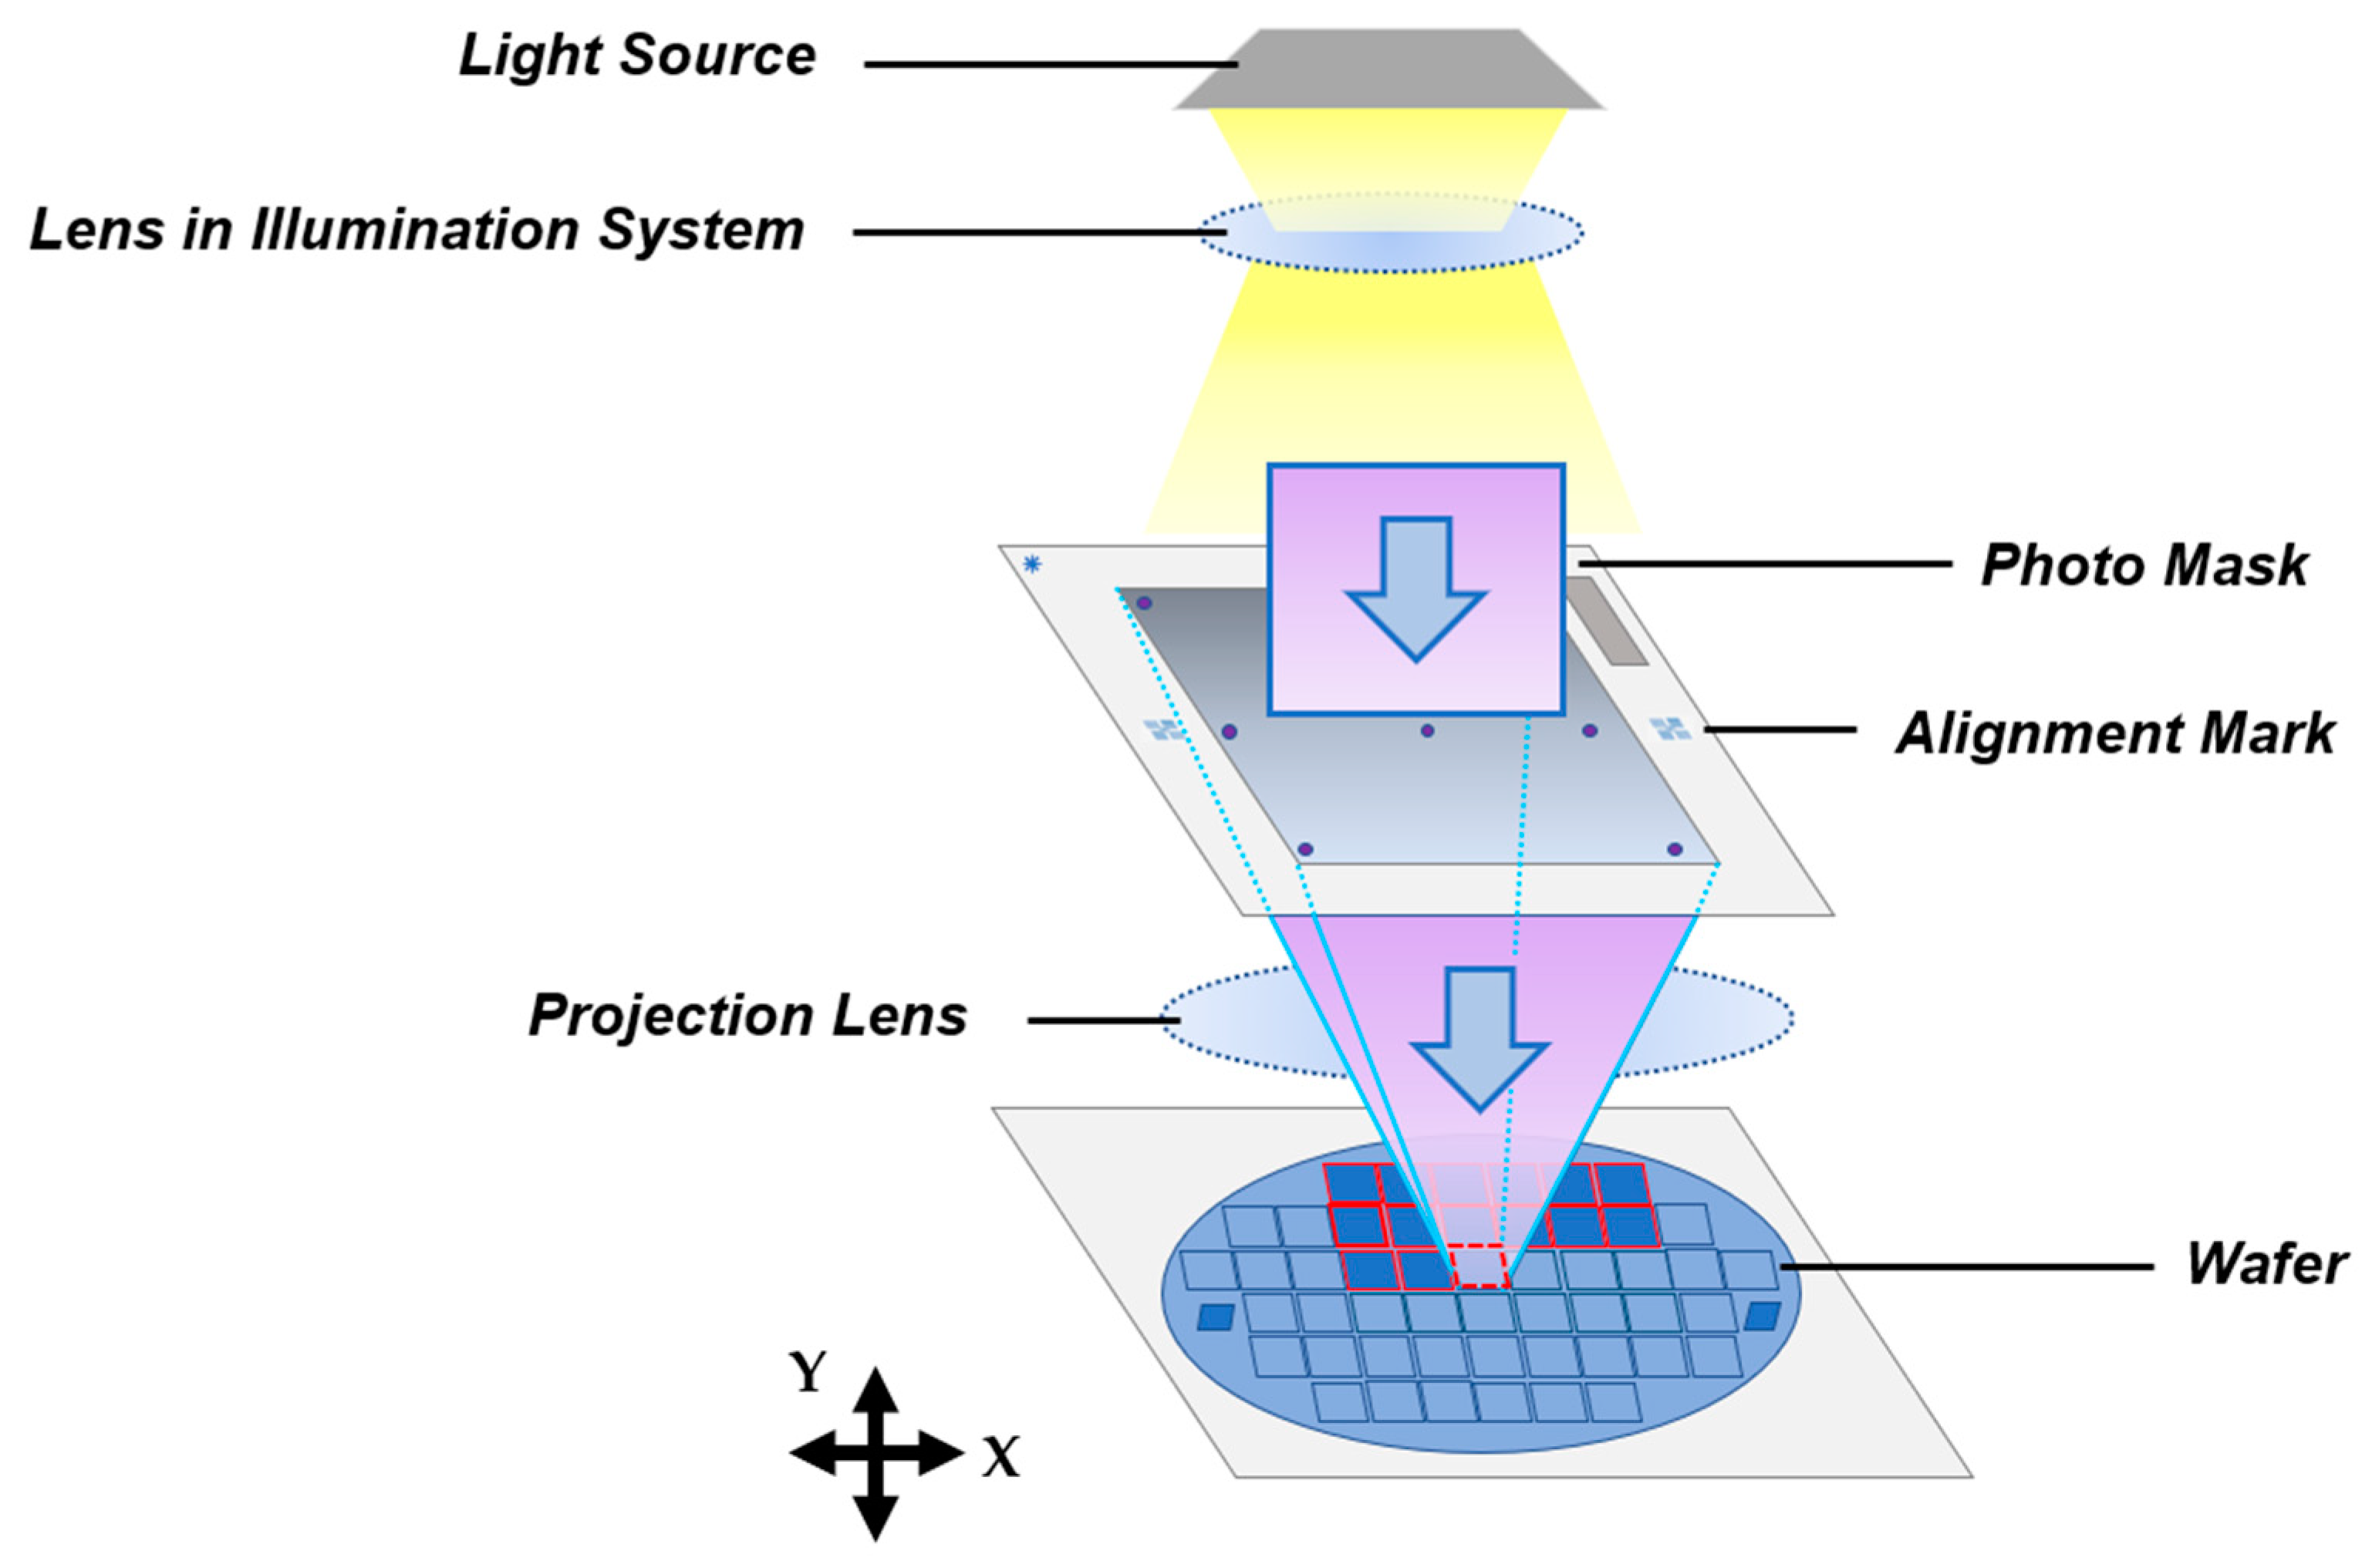
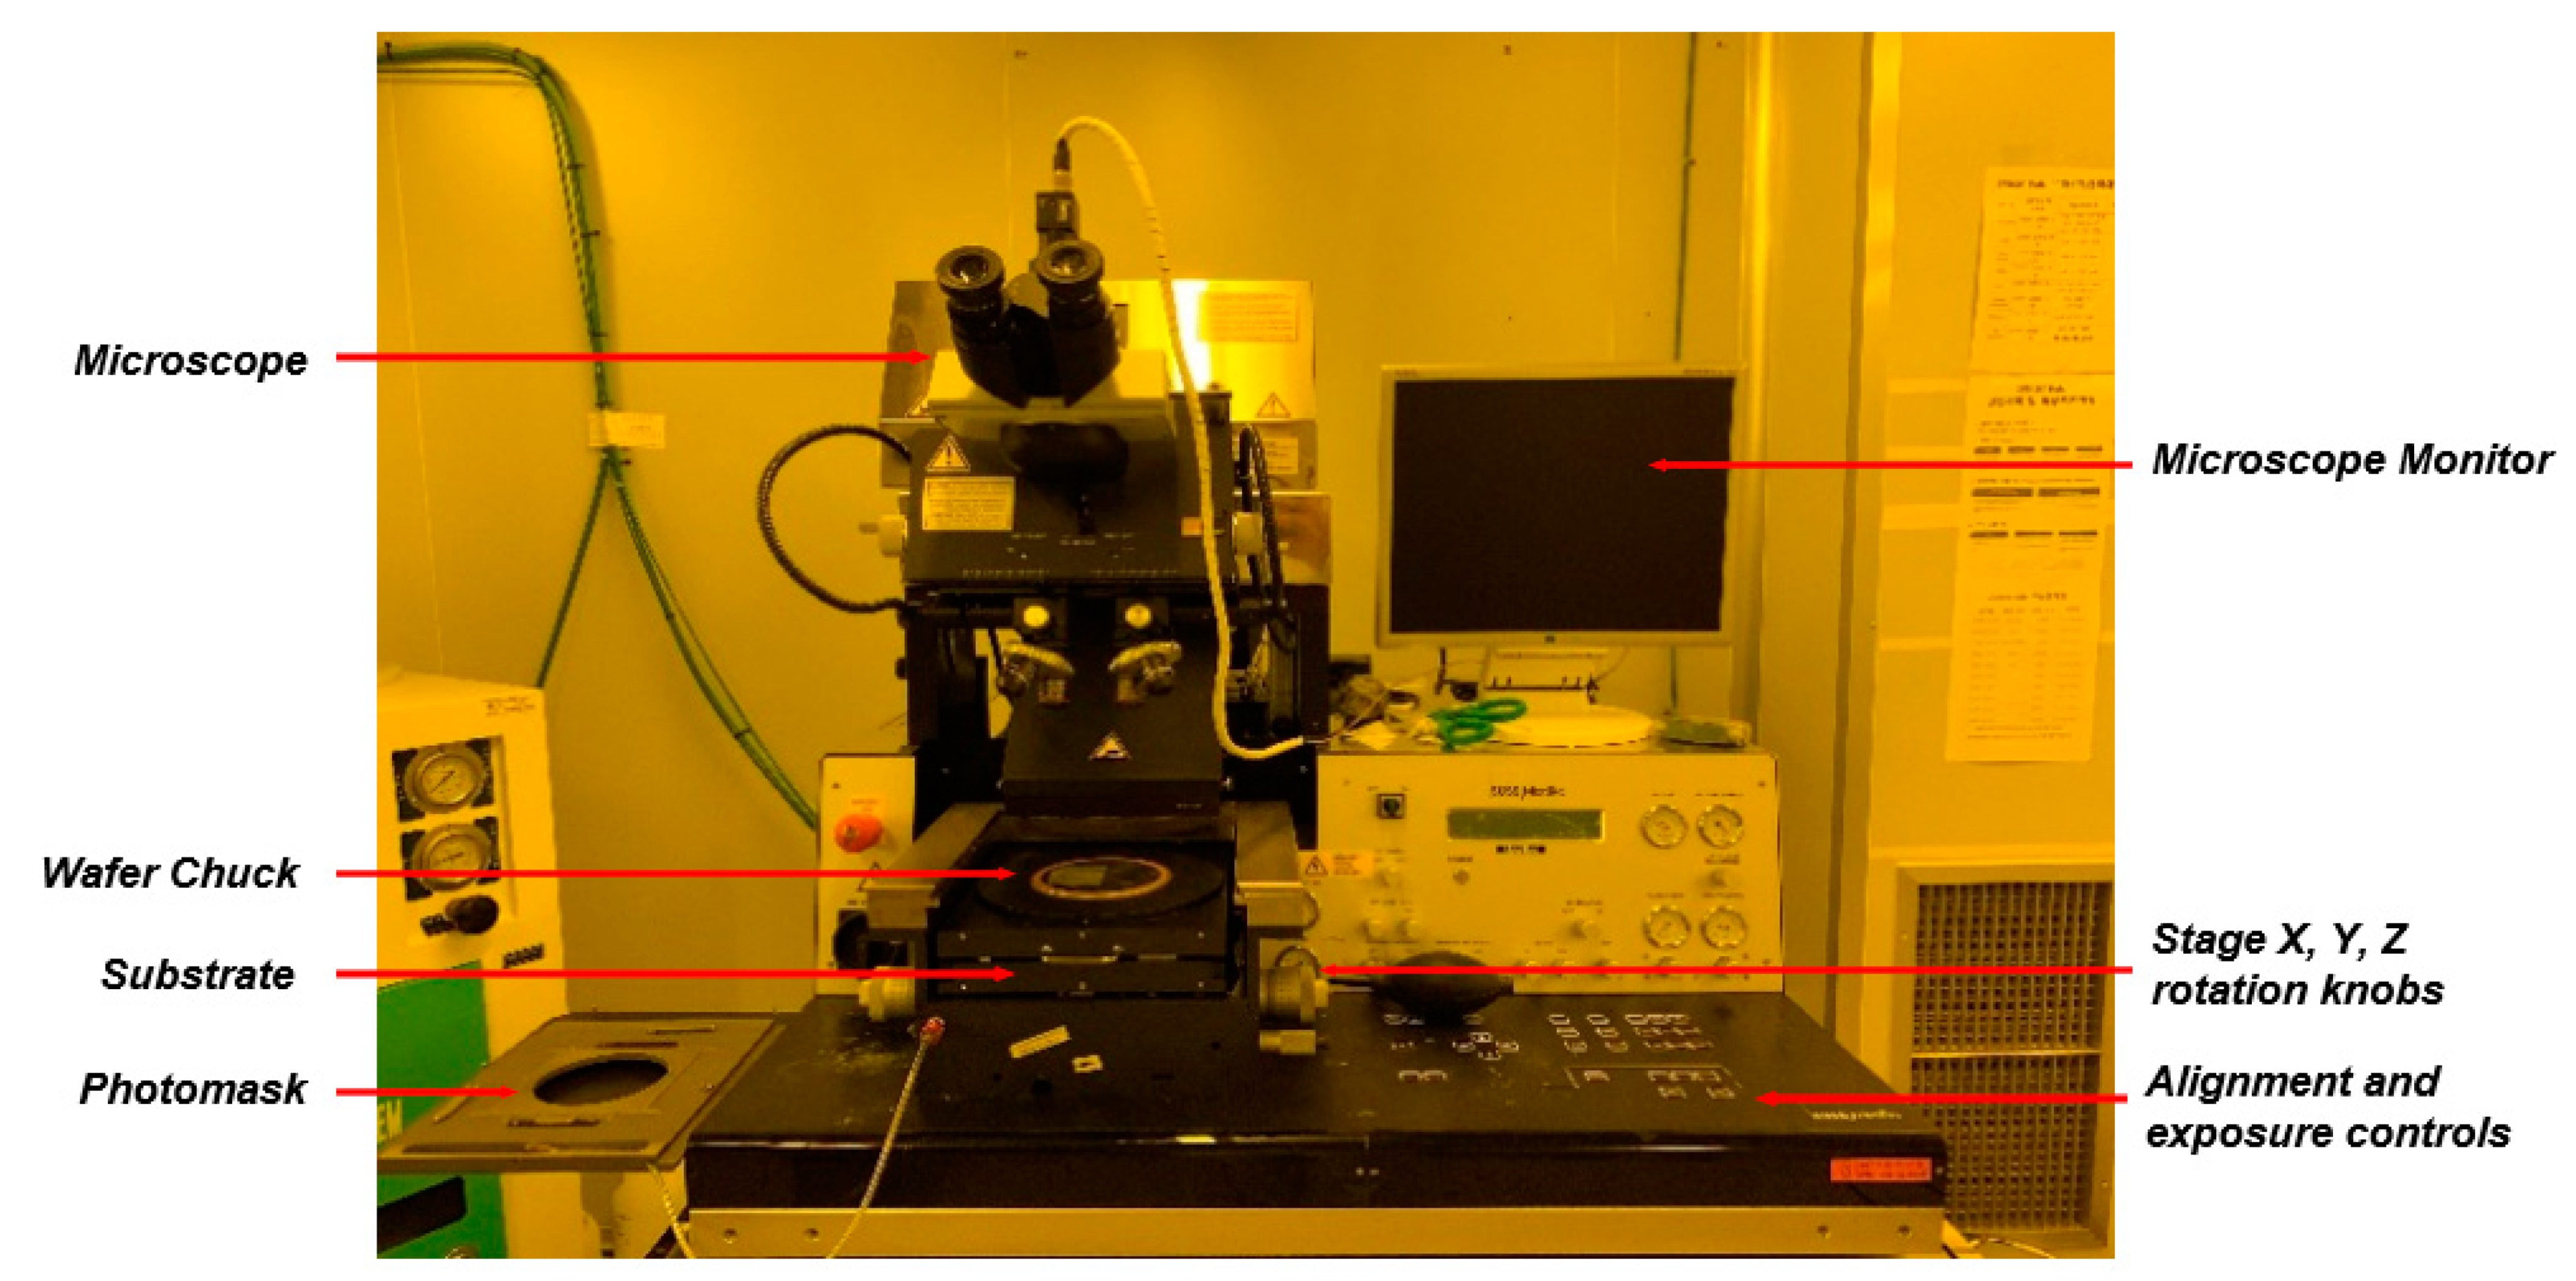
2.1. Semiconductor Mask Aligner

The most important factors that a machine vision algorithm uses in various industrial fields are fast computation time and the reliability of object recognition. In the field applied over several cycles along the feedback loop, the importance of fast computation time and algorithm stability is increasing. In photolithography, a mask aligner is equipment that accurately aligns the wafer and then irradiates the light to draw the circuit pattern on the mask on the wafer [16]. Figure 1 shows the photolithography process workflow.
The photolithography proceeds as follows: First, surface preparation is performed prior to photolithography. There are three processes: wafer cleaning, dehydration baking, and wafer prime. The second is the spin coating process, which is the process of applying photoresist. Third, the soft bake process removes the remaining solvent along with the applied photoresist. Fourth, alignment and exposure are performed. The fifth is Post Exposure Bake (PEB), which is a process of heating and drying the PR after exposure and before development. The sixth is development, which removes the PR from a certain area in order to realize a pattern by separating the necessary and unnecessary parts using the developer. The seventh is a hard bake. This is a process that removes residual solvent, dries PR, and increases adhesion to the substrate. After the last inspection, if the PR is properly applied, the etching process is carried out. Figure 2 shows the overall structure of the mask aligner in photolithography. Several photolithography processes are repeated as a stacked structure while manufacturing a semiconductor chip. Mask alignment is an important process at this time, and the horizontal position between each layer must be precisely aligned. A grayscale image processing technique is used in the visual image to separate the object from the mark [17]. This is a method for objects to be detected based on their threshold values. Setting the threshold value changes the quality of the image depending on the lighting and the environment and introduces a lot of noise [18]. Therefore, dynamic binarization that adjusts the threshold value based on the existing image contrast distribution and object contrast has been studied [19].
The alignment process proceeds as follows: Extract the feature value of the mark before performing mark recognition and alignment. Analyze the geometric shape of the mark, extract the pixels obtained from the pattern, and find the pattern matching within the area. Then, check the markings on both sides of the Mask Alignment (MA) and check whether the alignment of the mask is well achieved through this marking. Next is Global Alignment. Check that both sides of the wafer are marked, and check whether the alignment of the wafer is correct throughout this marking. Finally, Fine Alignment checks whether the print and the reticle are the same. After the mask is properly aligned with the wafer, patterning should be performed sequentially. For this confirmation, various marks exist on the wafer. Photolithography performance factors include resolution, depth of field, field of view indicating viewing angle, modulated transfer function, spatial coherence, alignment accuracy, and throughput factors for semiconductor production yield [20]. There is no tolerance in the exact position when each layer of the wafer is stacked. The measure of the value stacked vertically is called the overlay, and it refers to the alignment state of each layer. Precise alignment technology can increase the overlay value; otherwise, misalign problems will occur. Thermal run-out error, translational error, and rotation error are types of overlay errors. If there is misalignment, there is a very high possibility that the device will malfunction or an electrical defect will occur, resulting in a loss.
The total overlay tolerance is
σ t o t a l 2 = i σ i 2
where σ i is the deviation of the overlay error for the standard i -th masking step, and σ t o t a l is the deviation from the standard total overlay tolerance. Research is being conducted to reduce overlay deviation, reduce loss by minimizing misalignment, and optimize process technology. KIM [21] proposed a wafer alignment process using a multi-vision method for industrial manufacturing. Schmitt-Weaver et al. [22] proposed an efficient high-density wafer alignment metrology method by combining deep learning and wafer leveling metrology of photolithography equipment. Jeong et al. [23] proposed an improved wafer alignment model algorithm for better product overlay. Lee [24] proposed a marker layout to optimize overlay alignment in photolithography. As a method of correcting the position of a wafer using a vision system, a method using an alignment mark is mainly applied. Kim et al. [25] proposed an alignment and position correction method by object deformation.

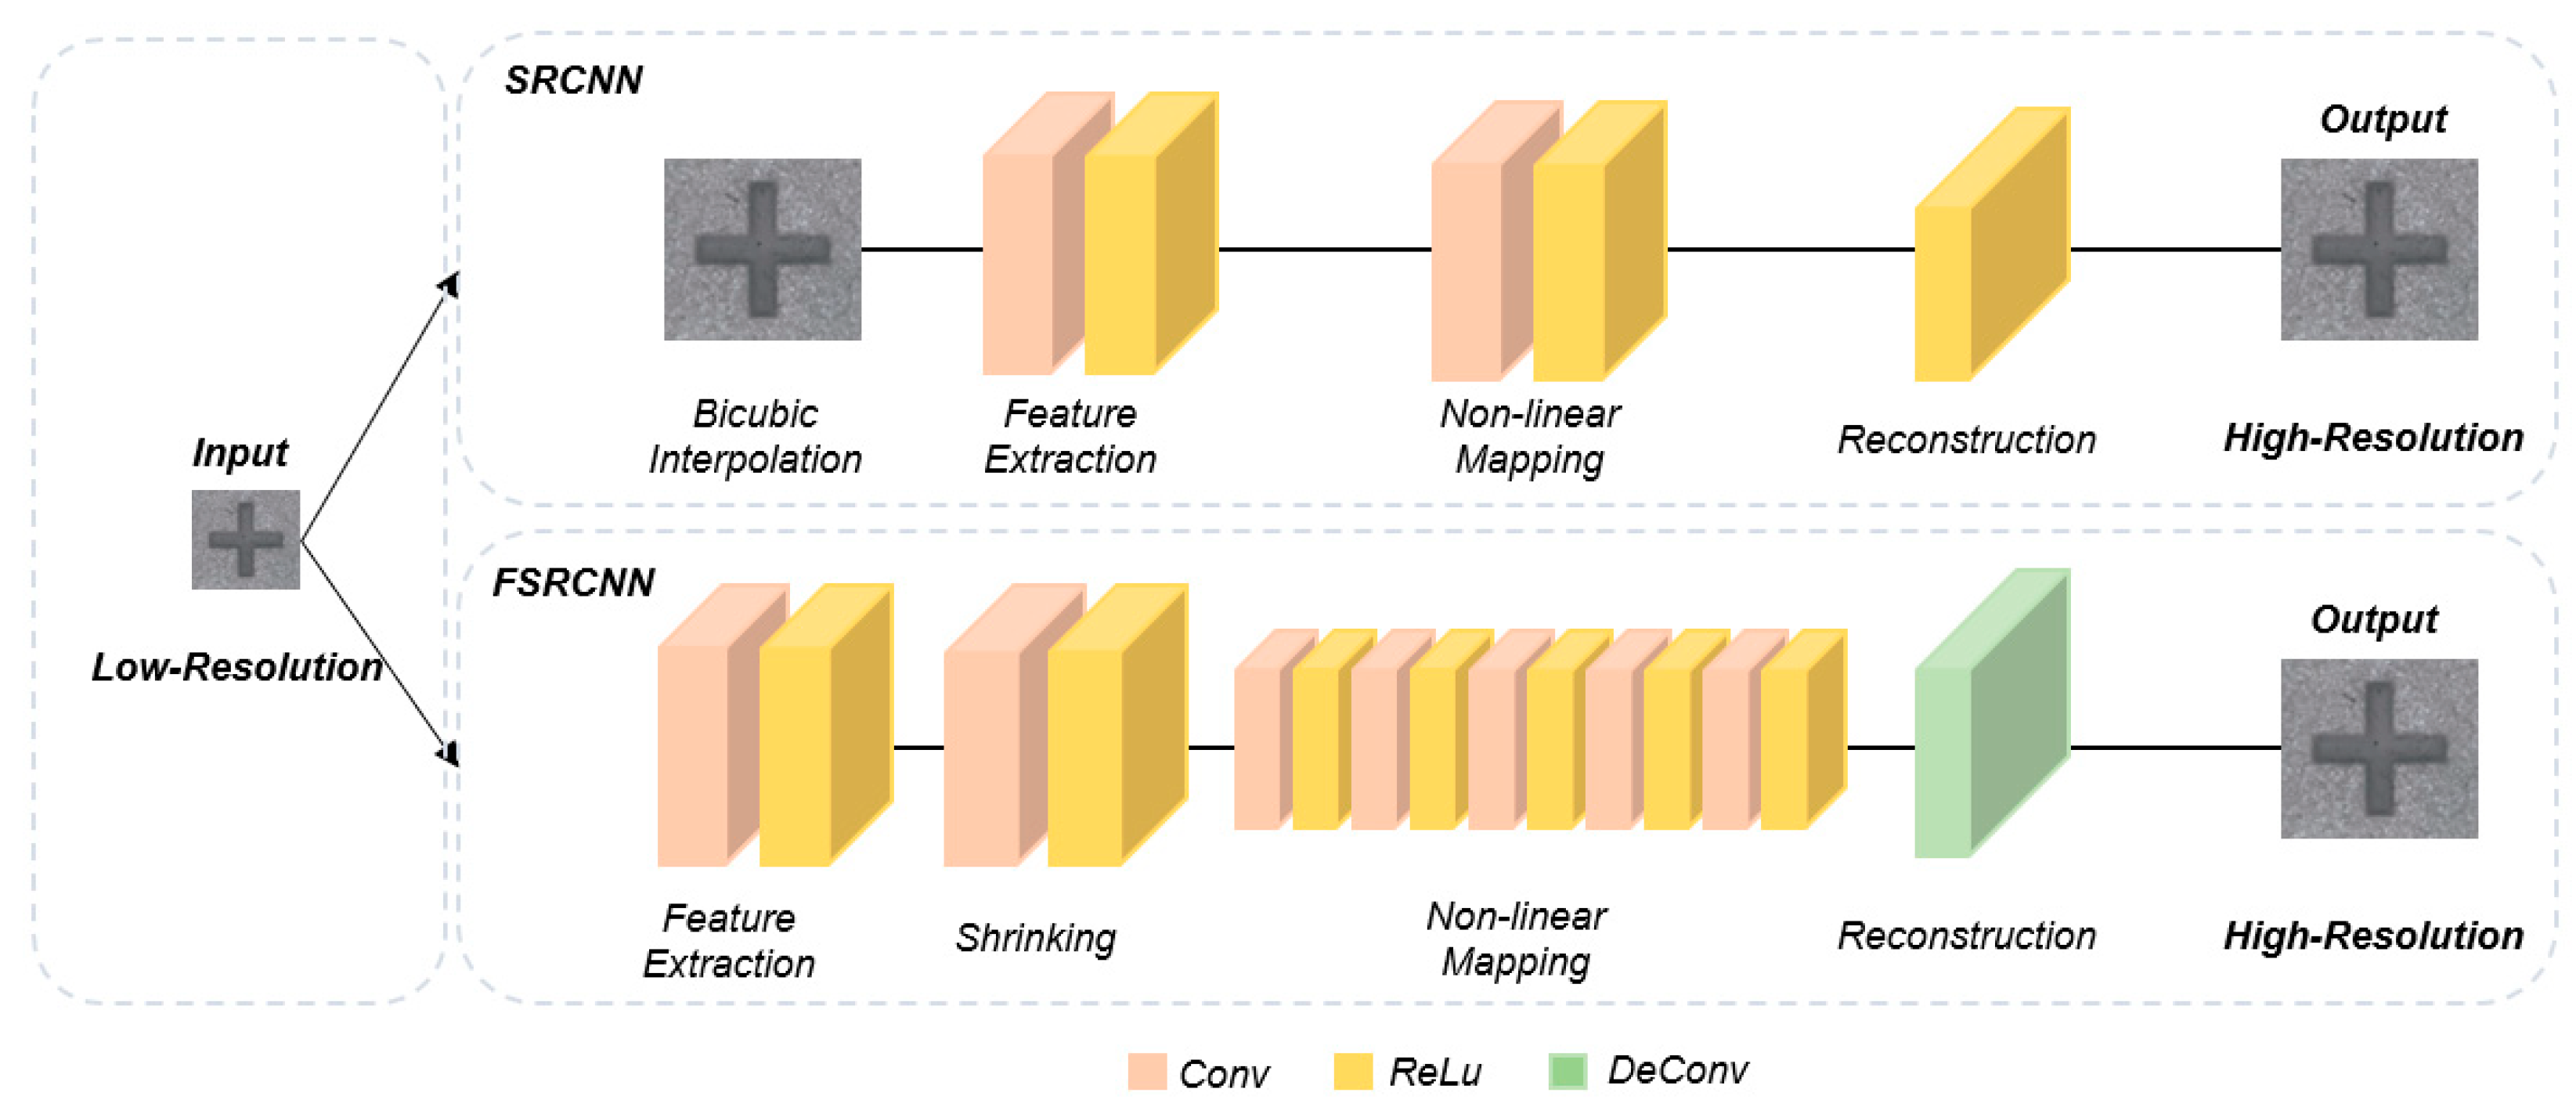
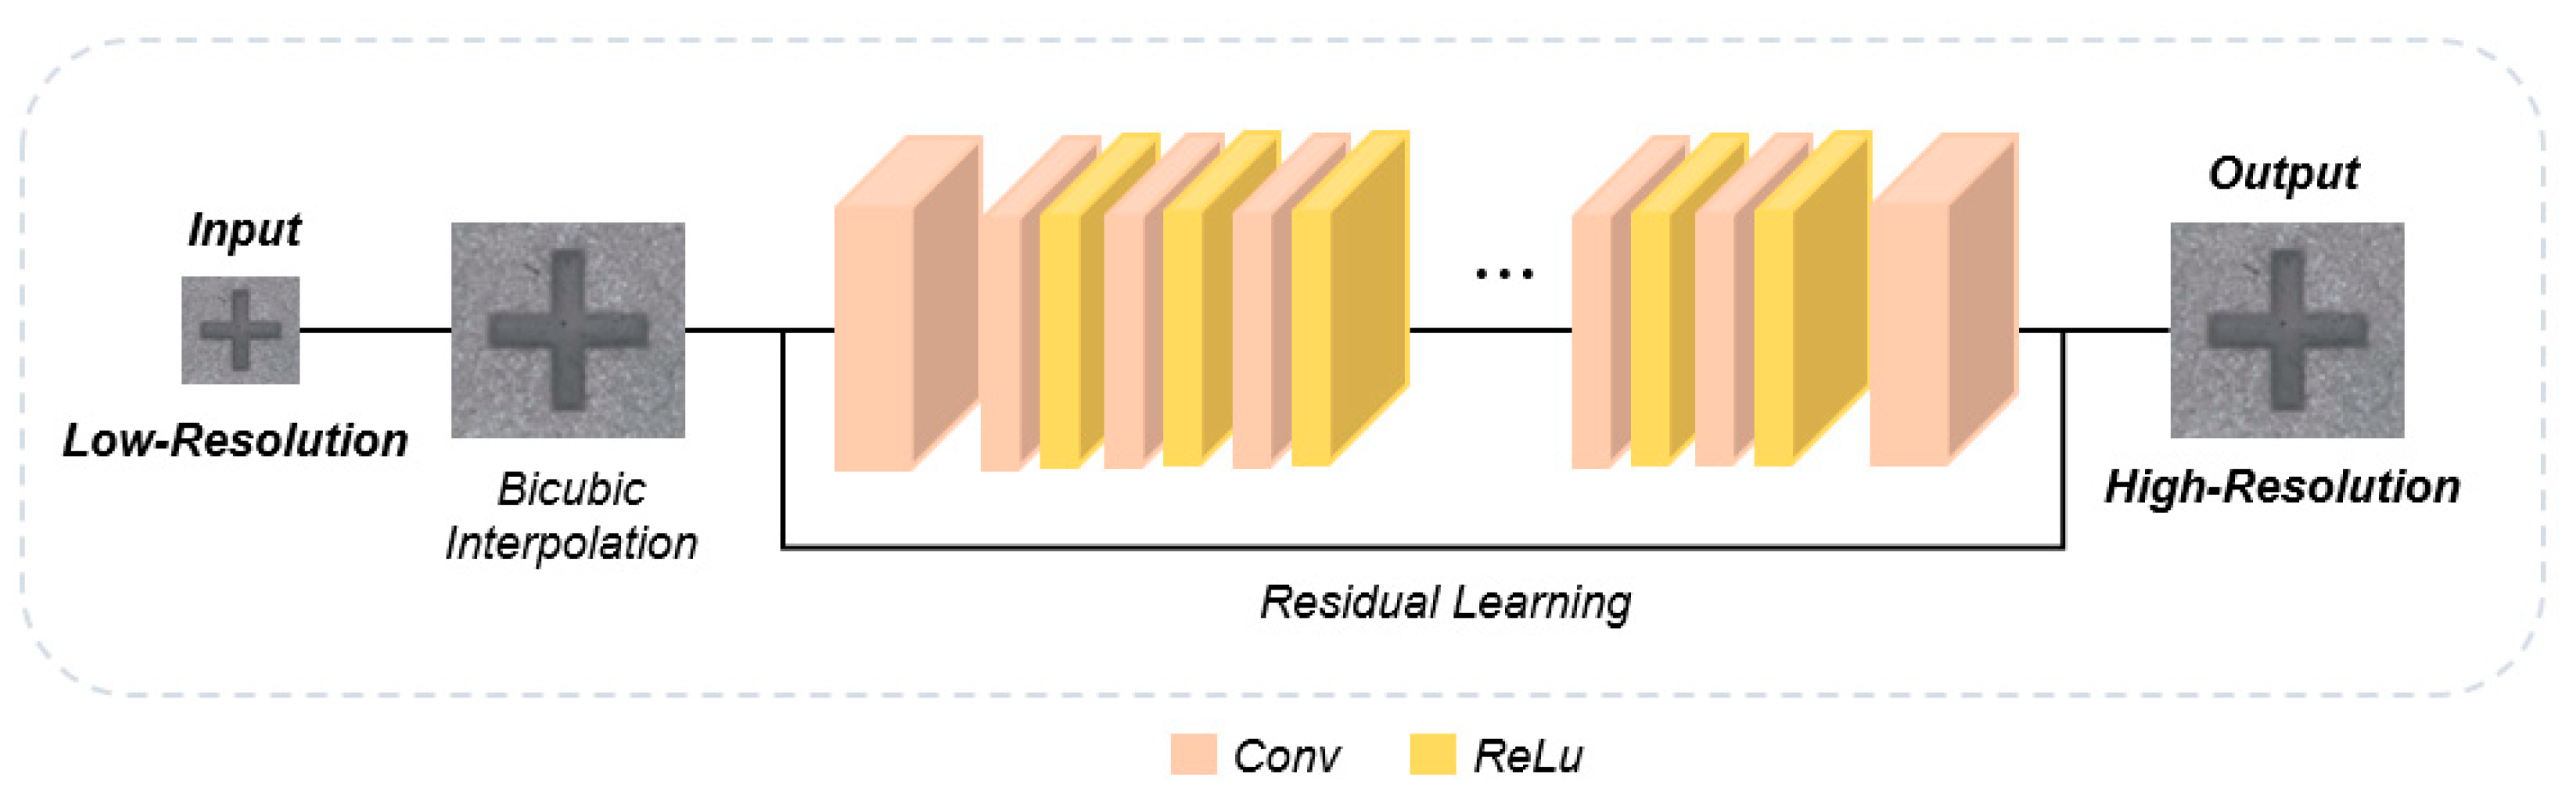
2.2. Deep Learning for Super-Resolution

Reconstruction from a single low-resolution image to a high-resolution image has traditionally been an important technique in the field of computer vision. Image Super-Resolution (SR) converts a low-resolution image into a high-resolution image. At high resolution, deep learning–based models have recently achieved many advantages and improvements over conventional methods. In general, the problem of reconstructing a high-resolution image from a low-resolution image is defined as an improperly established, ill-posed inverse problem. Local patch-based SR techniques using polynomial-based interpolation and linear mapping such as bicubic interpolation have been widely researched. The SR algorithm uses linear mapping to generate high-quality, high-resolution images with relative complexity and computational amounts. LR and HR learn linear mapping from a dictionary to generate high-resolution patches. Anchored Neighborhood Regression (ANR) and adjusted ANR (A+) have shown relatively high performance [26,27]. However, implementing a complex and nonlinear high-resolution model using these techniques is difficult. Deep learning–based SR algorithms are being studied through CNNs and are showing high performance compared with existing algorithms. They use a multi-layer network stacked into layers to learn convolutional filter parameters, which can be accurately transformed by precisely analyzing the complex nonlinear relationships between low-resolution inputs and high-resolution outputs. Dong et al. [28] proposed the Super-Resolution Convolutional Neural Network (SRCNN), a network that introduces deep learning to the super-resolution problem. SRCNN applied an end-to-end method, and all steps were processed in one integrated network. As the input LR image, an upscaled image is used by applying the bicubic interpolation method. There was no difference in the resolution of the images as they passed through the CNN network. This study showed high performance by solving the SR problem from the points of view of conventional signal processing and deep learning. It includes a network with a three-layer Fully Convolution Network structure and an algorithm to improve the image quality of enlarged images by bicubic interpolation. Figure 3 shows the SRCNN/FSRCNN structure.
The network showed higher performance compared to the existing SR algorithm and proved that a deep learning–based network is possible even with the SR algorithm. Dong et al. [28] then proposed a Fast Super Resolution Convolutional Neural Network that increases the model performance while reducing the amount of computation and the number of filter parameters to reduce the weight of the network. Adding a deconvolution layer enlarges the image in the network, and training generates a more optimized high-resolution image. The deconvolution operation serves to increase the horizontal and vertical sizes of the feature map and can increase the output image with resolution. If such a low-resolution input LR image is used, the amount of computation is reduced in proportion to the square of the multiple to be upscaled. As a result, FSRCNN has the advantage of showing a lower number of parameters and higher computational speed compared to SRCNN and higher performance.
Using a deep learning model to design a deep network increases the amount of computation and the number of parameters. However, when learning a deep network, gradient-vanishing or gradient-exploding problems may occur in the backpropagation process toward the input layer, and filter parameters may not be properly learned. Therefore, even if the network is designed deeply, the performance of the network does not increase proportionally. To solve this problem, He et al. [29] proposed ResNet, which is a network that can improve performance without problems, even in deep networks. Residual learning is a method of adding the input LR image to the final output HR image and learning the difference value between the two images. In general, since the input LR image and the output HR image are similar, the difference value is very small, so the problems of gradient vanishing and gradient exploding can be solved. Figure 4 shows the VDSR structure with a relatively deep 20-layer network (at the time the paper was published) through residual learning. VDSR also uses input LR images and output HR images upscaled by bicubic interpolation for network training. The difference between the input LR image and the output HR image is input to the network, and the input LR image is added at the last output stage. This method can simplify computation and can be easily optimized for deep networks. After this, several networks have used this residual learning to design deeper networks. Lim et al. [30] proposed EDSR, which is a deep and wide network that improves high performance. EDSR uses more than 32 layers, and the number of channels has been increased by more than four times that of other existing networks, thus increasing the number of parameters.
Figure 5 shows the overall structure of the EDSR. To reliably learn the deepened network, the network is divided into residual blocks, connected using Skip Connection, and the network is designed to optimize filter parameters. The feature maps are added to each residual block, and the multi-layer that multiplies the constant value after the CNN layer is added to solve the problem of difficulty in learning because the dispersion of the feature maps increases. During the learning process of EDSR, a Sub Pixel Convolutional Neural Network (SPCNN) is used to increase the resolution of the input LR image during the learning process [31]. Through SPCNN, the number of feature maps in the last layer is increased by the number of upscaling squares, and the output HR image of the desired resolution can be restored by calculating and arranging Pixel Shuffle. Through SPCNN, the number of feature maps in the last layer is increased by the number of upscaling squares, and the output HR image of the desired resolution can be restored by calculating and arranging Pixel Shuffle. By using the bicubic interpolation method, the resolution of the input LR image is increased, and it is possible to calculate more efficiently as compared to the VDSR input to the network; thus, the network accuracy is improved. As a result, EDSR showed high performance compared to other deep learning–based SR networks proposed in the same year and consequently had a great influence on various SR networks. Since then, several researchers have shown higher performance by proposing various networks applied to the SR algorithm, and many researchers are still conducting research on the SR algorithm based on deep learning.

2.3. MSRB

Through Multi-scale Residual Block (MSRB), which effectively uses features of different sizes, hierarchical feature fusion uses features from LR images. MSRB is used to obtain image features at different scales; these features are local multiscale features. Outputs passed through MSRB are combined for global feature fusion. The combined local multiscale features and the fused global features maximize the use of LR images and solve the feature disappearance problem in the feature transfer process. In particular, all upscaling factors can be easily used using a relatively simple and efficient reconstruction structure [32]. Qin et al. [33] proposed a new multiscale feature fusion residual network (MSFFRB) with multiple entangled pathways to adaptively detect and fuse image features at various scales based on residual learning. Li et al. [34] proposed an adaptive multiscale deep fusion residual network (AMDF-ResNet) to improve the performance of remote sensing image classification. Dai et al. [35] proved the connected layer model by fusing multi-scale functions and residual learning, by proposing global and residual learning to extract many image edges and details. Images exist in various scales. It is necessary to develop a deep learning–based image SR scheme that can generate features at various scales and levels. Esmaeilzehi et al. [36] proposed a novel residual block for generating rich feature sets extracted at various scales and levels.

2.4. Attention Mechanism

In the field of machine translation, the Attention Mechanism is one of the techniques to solve the problem of low quality in translation due to the lengthy input sentences. The basic concept is to refer back to the entire input sequence from the encoder whenever the word output from the decoder is predicted. Attention must be paid, because the input sequence does not have the same weight as the input word that is related to the predicted word [37]. Seq2Seq is an RNN structure with an encoder and decoder as well as features that cyclically compute with a language neural network. A feature of the Seq2Seq neural network is that it uses a context vector of a fixed size. When words are input, they are first compressed into a fixed size value and then decompressed again, which means that only the important ones are selected in advance and sent to the decoder. Information loss occurs when a great deal of information is reduced to a fixed small value. Therefore, translation quality is degraded, the cyclic operation is inefficient, and the performance is not good [38]. Neural machine translation has become a new paradigm of machine translation, and attention mechanisms have been established as approaches in various languages. All of the attention mechanisms use only temporal attention, in which one scalar value is assigned to one context vector corresponding to the word. Wu et al. [39] proposed a Vector-Magnetic anomaly detection via an attention mechanism deep learning model. Being able to know which words were focused on in a previous time step while generating a translation is a source of information for predicting which words will be focused on in the future. Zheng et al. [40] designed a multi-layered semantic expression network for sentence expression. The Multi-Attention Mechanism obtains semantic information for different levels of sentences. To reduce the uncertainty due to the word order of the sentence, a relative position mask was added and integrated between the words. Therefore, the multi-layered semantic expression network improved the accuracy and comprehensiveness of sentence expression through text recognition and emotion classification tasks.
The bottleneck attention module (BAM) is located at the bottleneck of each network and refers to the part where spatial pooling is performed. Spatial pooling is an essential part of the abstraction process of deep learning, and the spatial resolution of the feature map becomes small. The main factor of BAM is to maximize the value of the important part with attention and decrease the value of the insignificant part by adding BAM before the amount of information decreases in this section. BAM takes 3D conv features as input and outputs conv features refined with attention. The attention of the channel axis and the spatial axis is divided and calculated, each output value is added, and a 3D attention map of the same size as the input is generated through the sigmoid. CBAM followed after research was conducted on BAM. It showed improved performance, and experiments on module pooling, spatial and channel attention combined methods, and interpretability are in progress. Existing BAM was implemented by adding channels and spatials, but CBAM showed that sequentially applying channels first and then applying spatials led to better performance [41,42].

3. Improved MSRN-Based Attention Block

This section introduces the overall architecture of the proposed idea and the Multi-Scale Residual Attention Block (MSRAB) to improve the resolution of the visual image.

3.1. System Architecture

In this paper, we propose an MSRAB that applies the Attention Mechanism to MSRN to correct and detect mask alignment marks in photolithography. The MSRAB was devised to detect and refine image features extracted at different scales from the existing MSRB. The proposed architecture is shown in Figure 6. MSRAB consists of a structure to improve the extracted features by applying the concepts of multiscale function fusion, local residual learning, and CBAM.

3.2. MSRAB

Through two-scale convolution filters, multiple bypass networks are used to find image features at different scales. Figure 7 shows the structure of the Multiscale Residual Attention Block. In the existing multiscale feature extraction module, different channels and different location information in space are provided. The feature map generated at each step is connected to the CBAM module through multiple M blocks. Through this, by combining the location information and context information of various layers, important information in the image can be conveyed well, and an accurate prediction is obtained by obtaining a clear image.
The purpose is to utilize the attention module to focus on a specific area of the image to improve the performance of the model. Characteristics extracted from convolution are mixed with various types of information, and there is a great deal of unnecessary information duplication, which can limit the performance of SISR. To extract image features, convolution kernels and different bypasses were constructed.
The implementation of the multiscale residual block is defined as follows:
K 11 = σ ( w 3 × 3 1 × M n 1 )
K 12 = σ ( w 5 × 5 1 × M n 1 )
K 21 = σ ( w 3 × 3 2 × ( K 11 , K 12 )
K 22 = σ ( w 5 × 5 2 × ( K 11 , K 12 )
K = w 1 × 1 3 × A c · A s ( K 21 , K 22 )
K n = w 1 × 1 × A c · A s ( K 0 , K 1 , K 2 , K n 1 )
Several residual blocks are stacked together to form a residual group, and then hierarchical features are fused in the bottleneck hierarchy; all feature maps are sent to a 1 × 1 convolutional layer and then passed through CBAM. Channel attention is transferred to the average pooling step. For each step, M blocks represent the number of functional maps passed to MSRAB. The input and output of the first convolutional layer move to the next convolutional layer through the extraction map. M blocks combined by attention block are defined as follows:
M n = K + M n 1
CBAM applies channel attention and spatial attention as shown in Figure 7. This process is defined as
F = A c ( F ) F
F = A s ( F ) F
Spatial information is extracted using Average pooling and Max pooling to extract descriptors F a v g c and F m a x c . Then, through Max pooling, object features that are clearly distinguished from others are captured. The output of MLP for each descriptor derives the final output through an element-wise sum.
The above processes can be defined as follows:
A c ( F ) = σ ( M L P ( A v g P o o l ( F ) ) + M L P ( M a x P o o l ( F ) ) )
Descriptors F a v g c and F m a x c are extracted from channel information using Average pooling and Max pooling. After concatenating F a v g c and F m a x c , the attention weight is calculated with one filter with a size of 7 × 7 .
The above sequence of processes can be defined as follows:
A s ( F ) = σ ( f 7 × 7 ( [ A v g P o o l ( F ) ; M a x P o o l ( F ) ] ) )
As the layer of the MSRAB overall model becomes deeper, the method is designed to solve the problem of poor performance due to gradient vanishing and exploding problems. In this study, since the residual block is used for each step, the problem of performance degradation of the model was solved and improved. In addition, it can help the model extract many features from every layer. The two modules of channel attention and spatial attention are combined. In this study, attention blocks were used for each residual block step of feature extraction to solve the problem of model performance degradation; this can help the model extract more features from every layer.

4. Experiment and Results

The methods and algorithms used in the proposed architecture were evaluated for effectiveness and validated against various tasks, models, and datasets.

4.1. Experimental Environments

Table 1 summarizes the system specification.

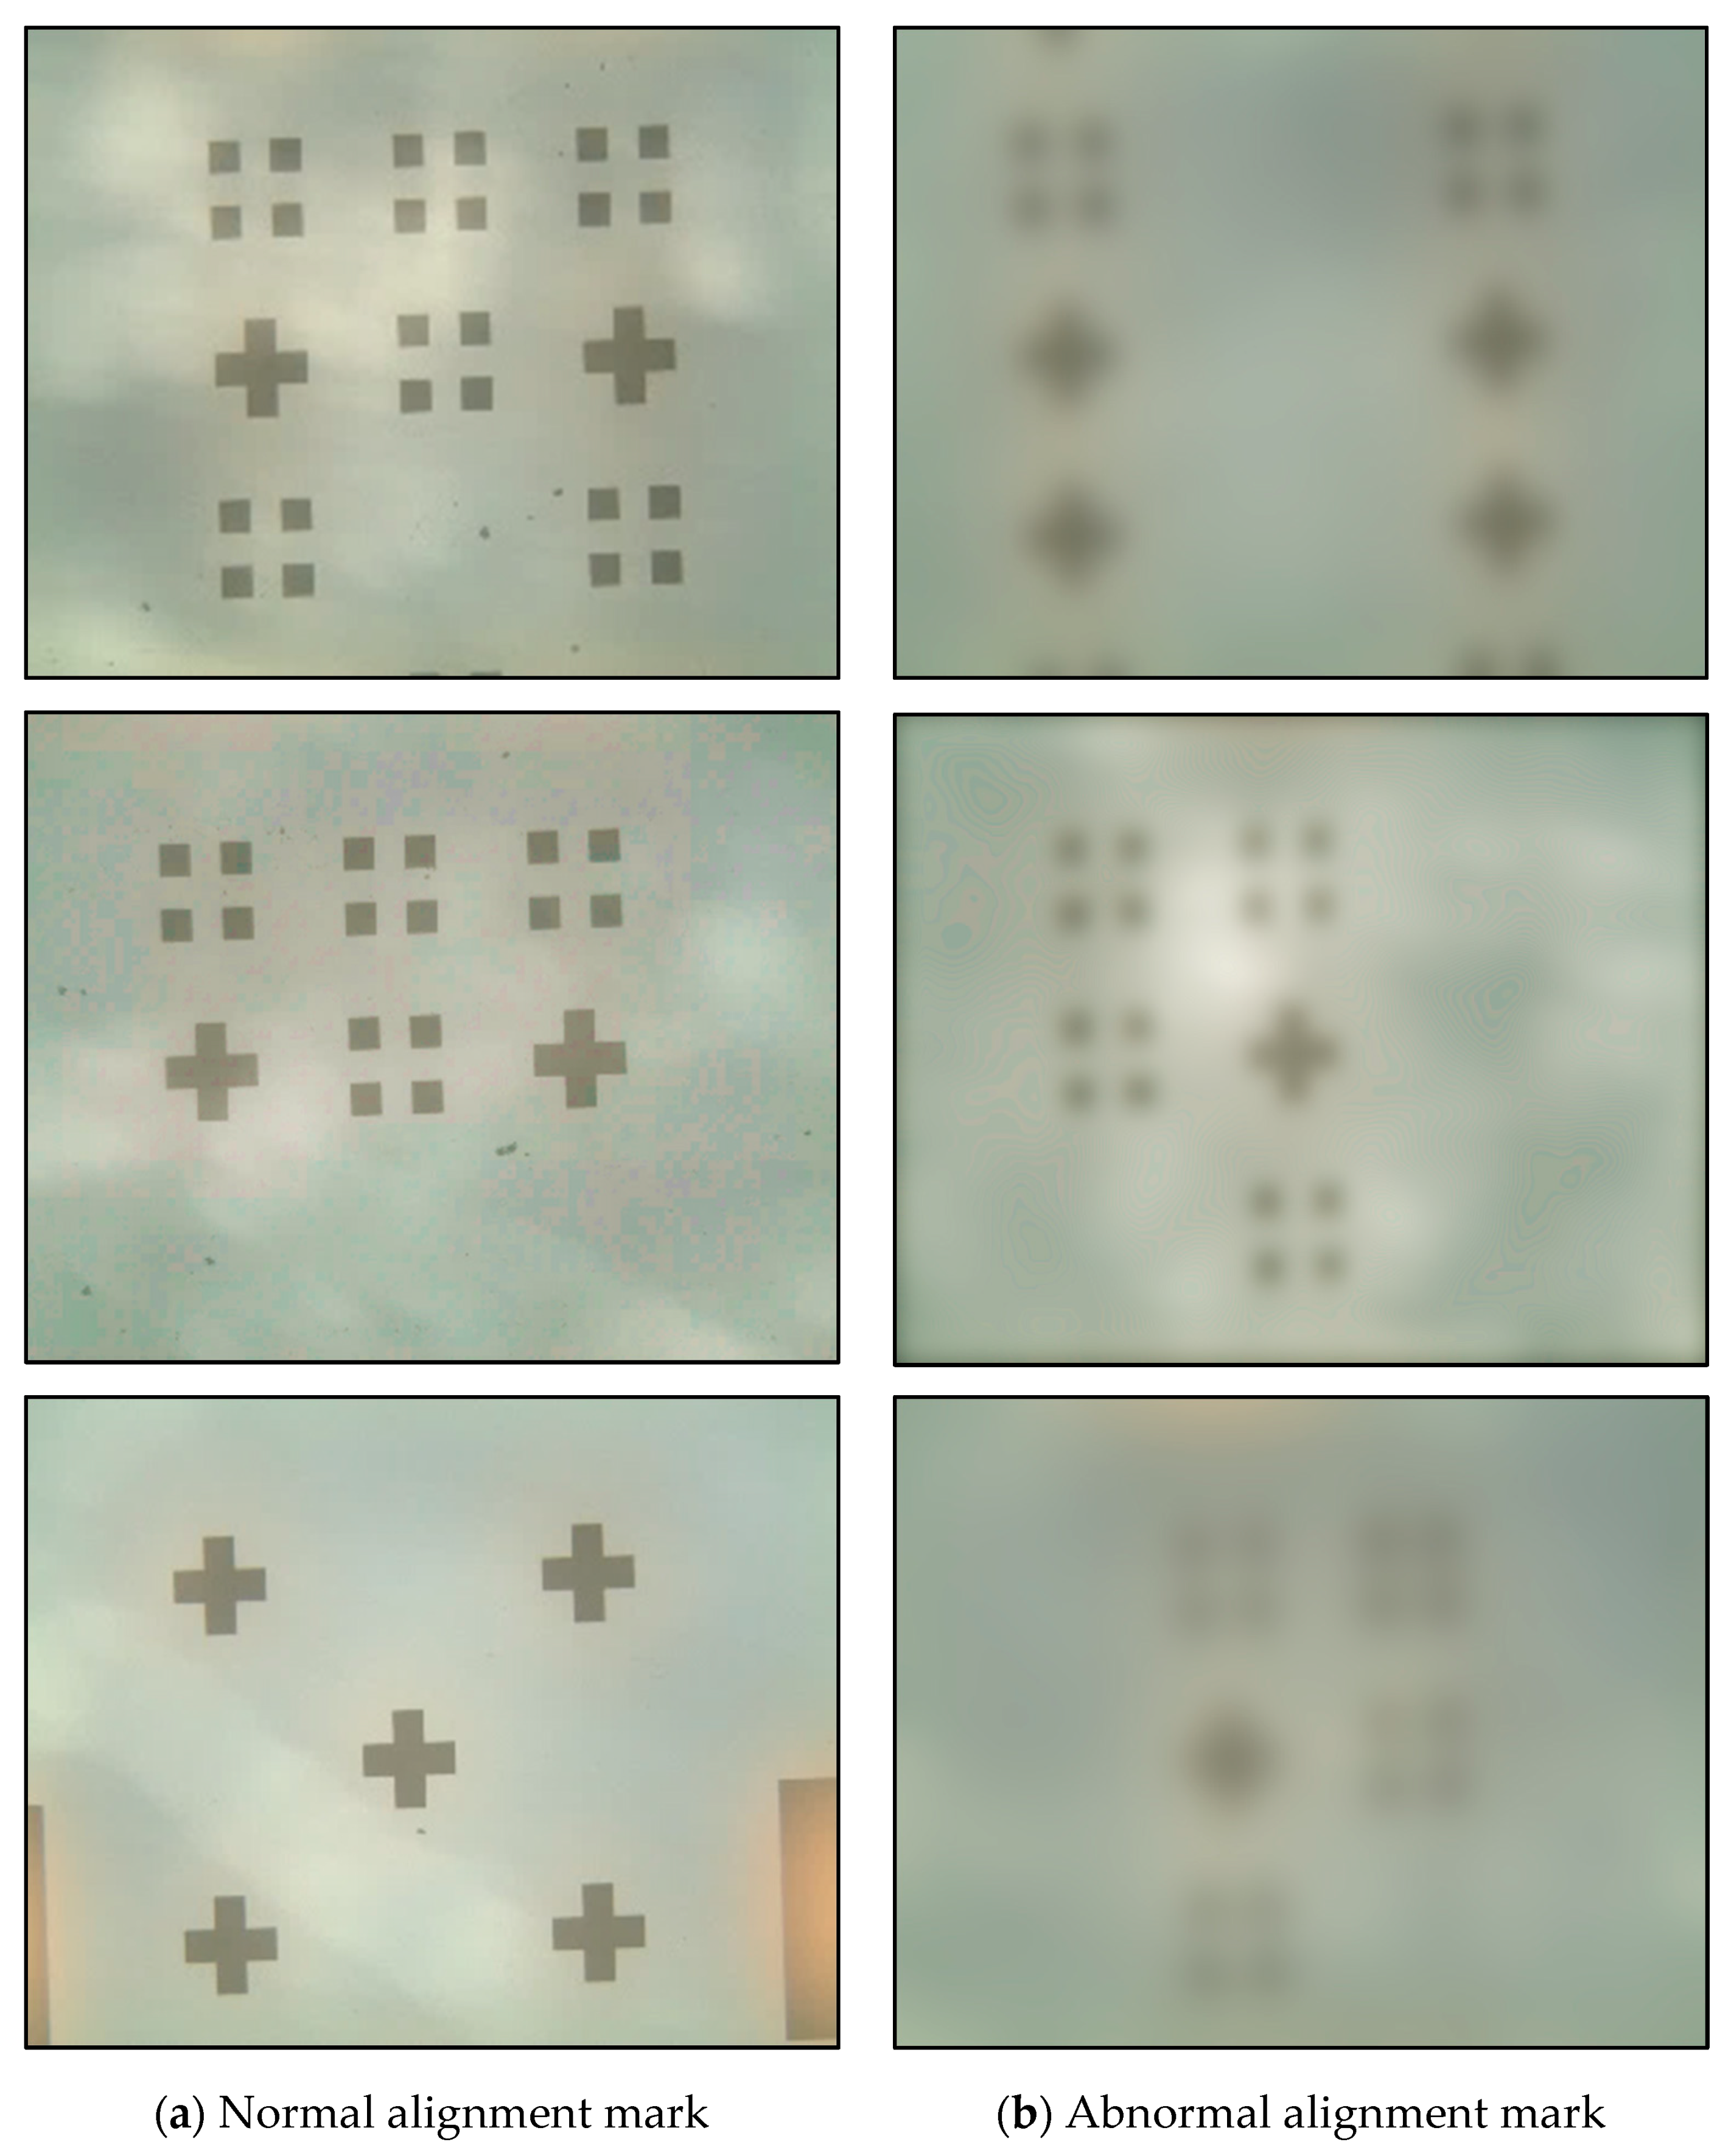
4.2. Data Acquisition

For the experiment, vision data were collected using Mask Aligner equipment. Figure 8 shows the Karl Suss MA6 Mask Aligner instrument used for data acquisition. Each plate is loaded onto the Substrate and Photomask. It is possible to monitor the alignment mark through a microscope and a microscope monitor. The stage can be manipulated in the x, y, and z directions through the controller, and alignment and exposure settings are possible. The mask used in the experiment is 126.6 × 126.6 (mm) in size, and there are various types of alignment marks on the mask. A cross and four block marks were used in the experiment.
The specifications of the Karl Suss MA6 Mask Aligner are shown in Table 2.
Normal data and abnormal data sets were used to test and validate the proposed model. A total of 2500 data points were used in the experiment, and Figure 9 shows the image dataset.

4.3. Evaluation Metrics

To evaluate the model, there are different methods to quantitatively evaluate the image quality in the field of image resolution restoration. Among the various methods, Peak Signal-to-Noise Ratio (PSNR) and Structural Similarity Index Measure (SSIM) were applied for evaluation. PSNR represents the power value of noise concerning the maximum power of the signal and is mainly used to evaluate image quality loss information in lossy compression. PSNR is defined as follows:
P S N R = 10 l o g 10 ( M A X I 2 M S E ) = 20 l o g 10 ( M A X I ) 10 l o g 10 ( M S E )
MAX(I) is the maximum value of the corresponding image and becomes 255 in the case of an 8-bit grayscale image. Mean square error (MSE) is calculated in accordance with Equation (14). A small MSE value means that it is very close to the original, so the higher the PSNR value, the smaller the loss.
M S E = 1 m n i = 0 m 1 j = 0 n 1 [ I ( i , j ) K ( i , j ) ] 2
where   I is a grayscale image of size m × n , and K is an image including noise in I . Since there is MSE in the denominator, the smaller the MSE, the larger the PSNR. Therefore, a high-quality image will have a relatively large PSNR, and a low-quality image will have a relatively small PSNR.
SSIM evaluates the similarity to the original image as a method for image quality evaluation. This is an index to overcome the limitations of PSNR, and it is a method of obtaining the similarity of images considering L (Luminance), C (Contrast), and S (Structure). It has a value between zero and one, and the closer it gets to one, the higher the similarity. The evaluation method of SSIM is defined as follows:
S S I M ( x , y ) = [ I ( x , y ) ] α · [ c ( x , y ) ] β · [ s ( x , y ) ] γ
To proceed with the quantitative evaluation of the image quality of the proposed model, Precision, Recall, Accuracy, F1-score, mAP, and Intersection Over Union (IOU) were verified based on the TP, FP, FN, and TN, which define the relationship between the answer provided by the model for evaluating the detection of an object and the actual result.
Precision is the proportion of what the model classifies as true that is actually true. The evaluation formula is expressed as follows:
P r e c i s i o n = T P T P + F P
The recall is the ratio of those predicted by the model to be true among those that are true, and is expressed as follows:
R e c a l l = T P T P + F N
Accuracy is an intuitive evaluation indicator that can indicate the performance of a model. Accuracy is the number of correctly predicted data divided by the total amount of data.
The formula is expressed as
A c c u r a c y = T P + T N T P + F N + F P + T N
The F1-score is the harmonic average of precision and recall, and is expressed as follows:
F 1 S c r o e = P r e c i s i o n × R e c a l l P r e c i s i o n + R e c a l l
IOU is an indicator that determines whether the detection of each object is successful in general object detection. It is evaluated through the size of the area where the two boxes represent the actual object position and the predicted object overlap, and is expressed as a metric as follows:
I O U = A r e a   o f   O v e r l a p A r e a   o f   U n i o n

4.4. Results

An experiment to improve the resolution of the alignment mark image was conducted by applying the MSRAB model, and the image quality was evaluated. Next, we compare the detection performance of the resolution object before and after image enhancement. YOLOv4, YOLOv4-csp-swish, and YOLOv4-tiny are used to evaluate the detection performance of objects [43].

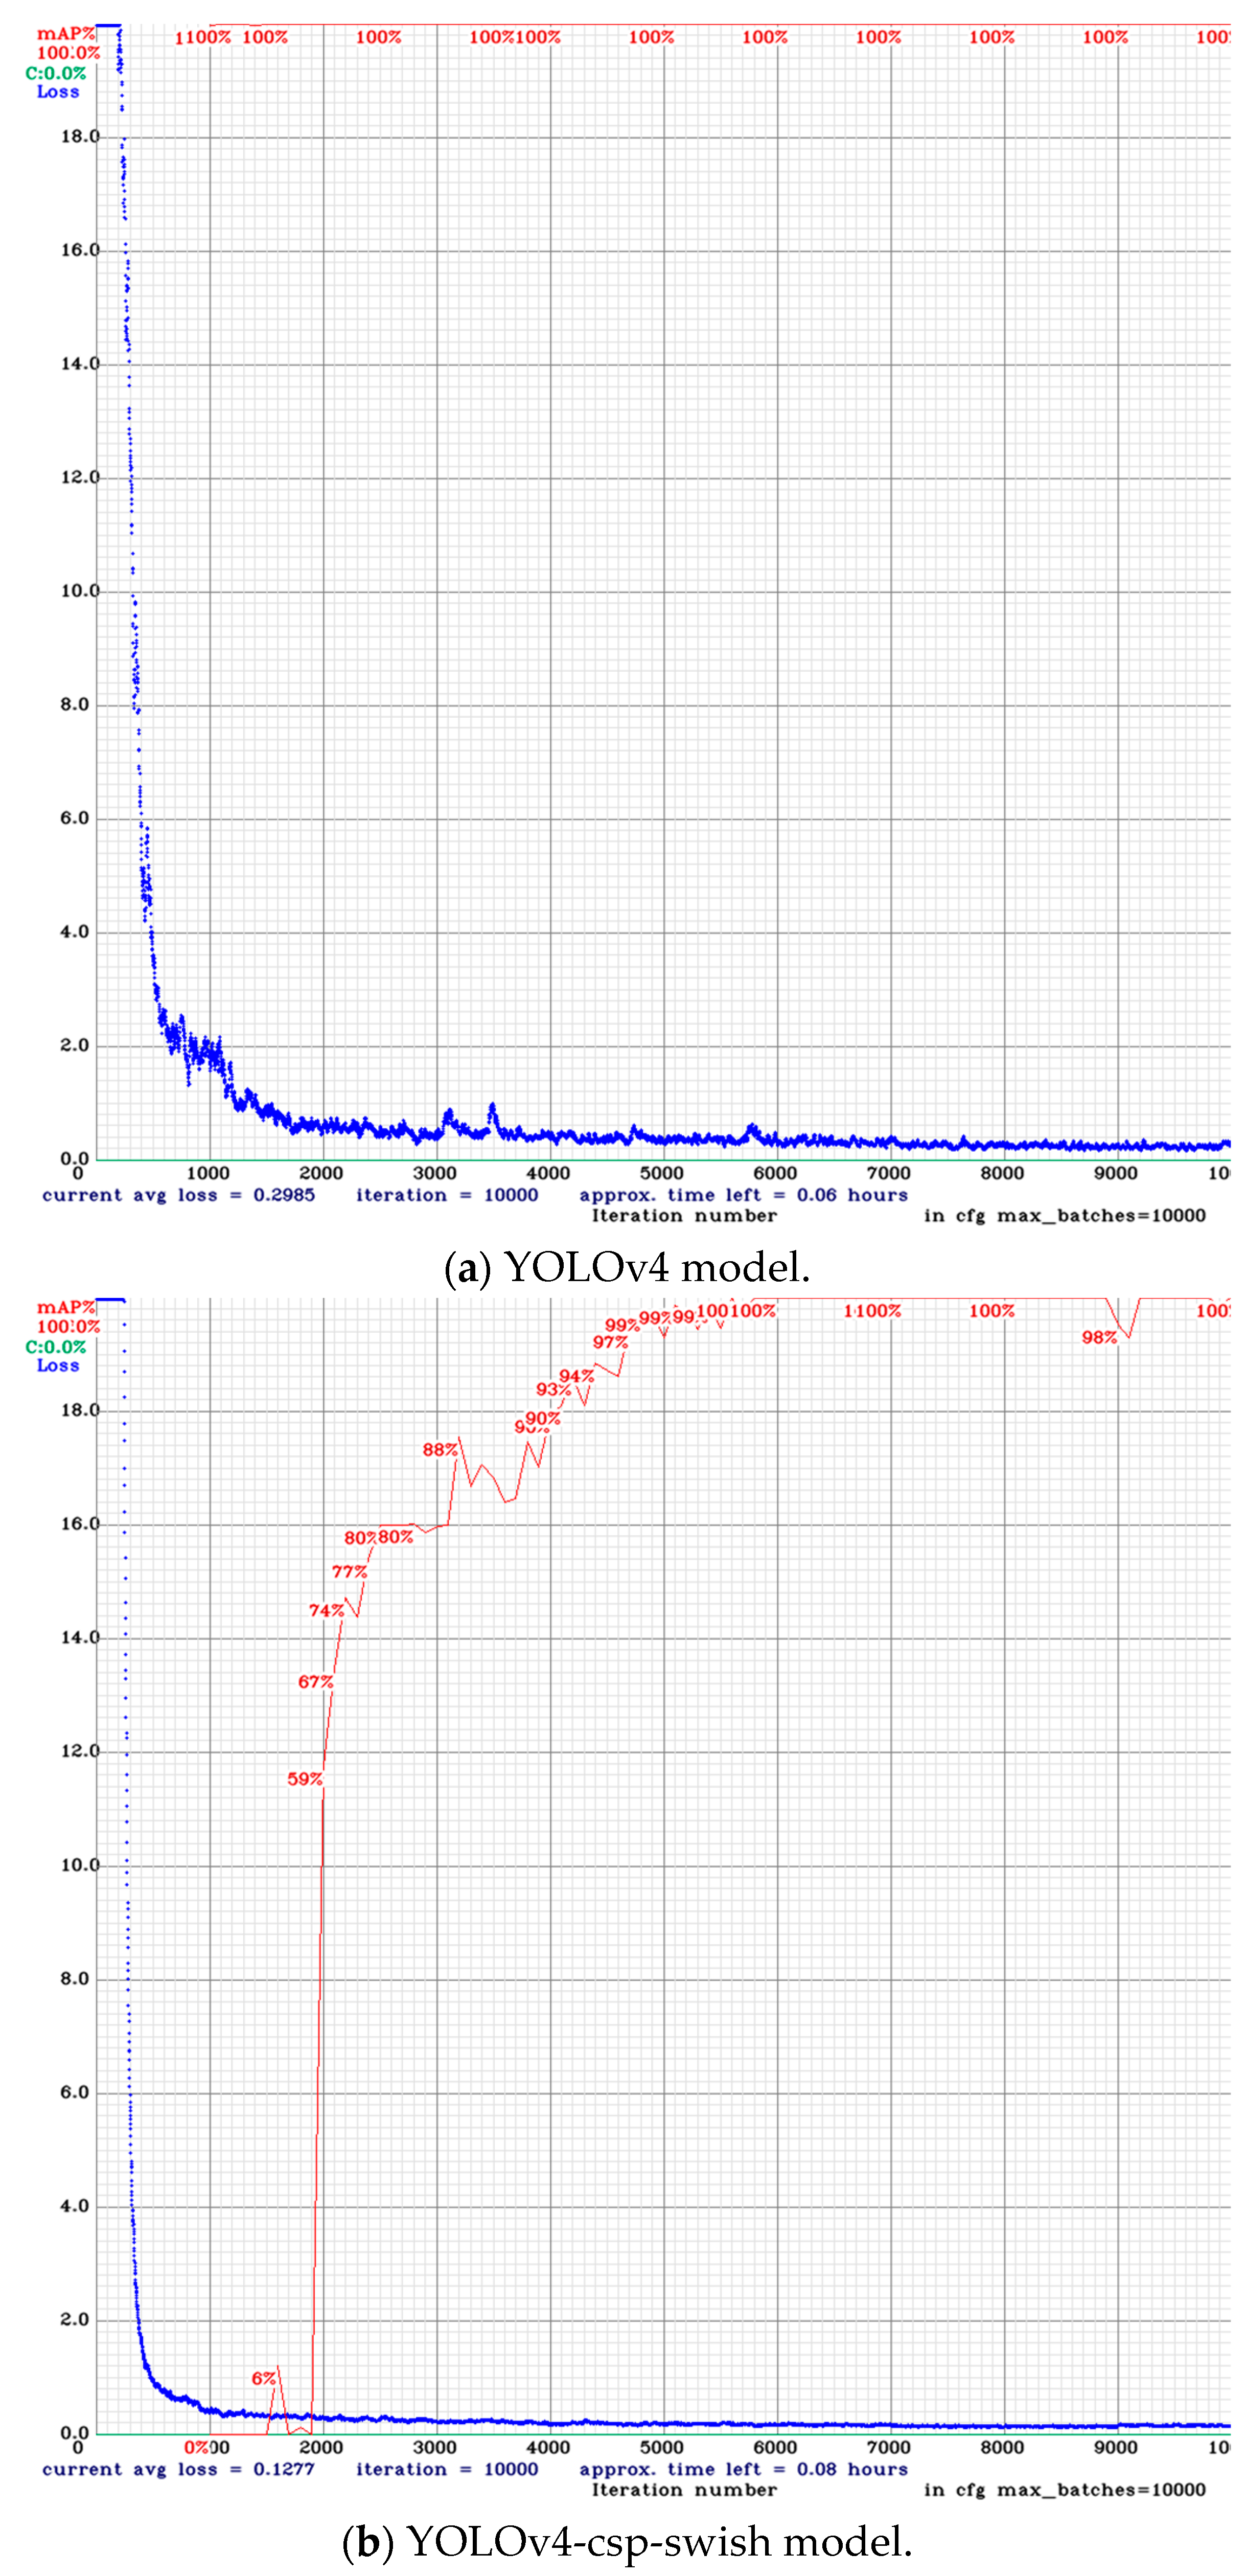
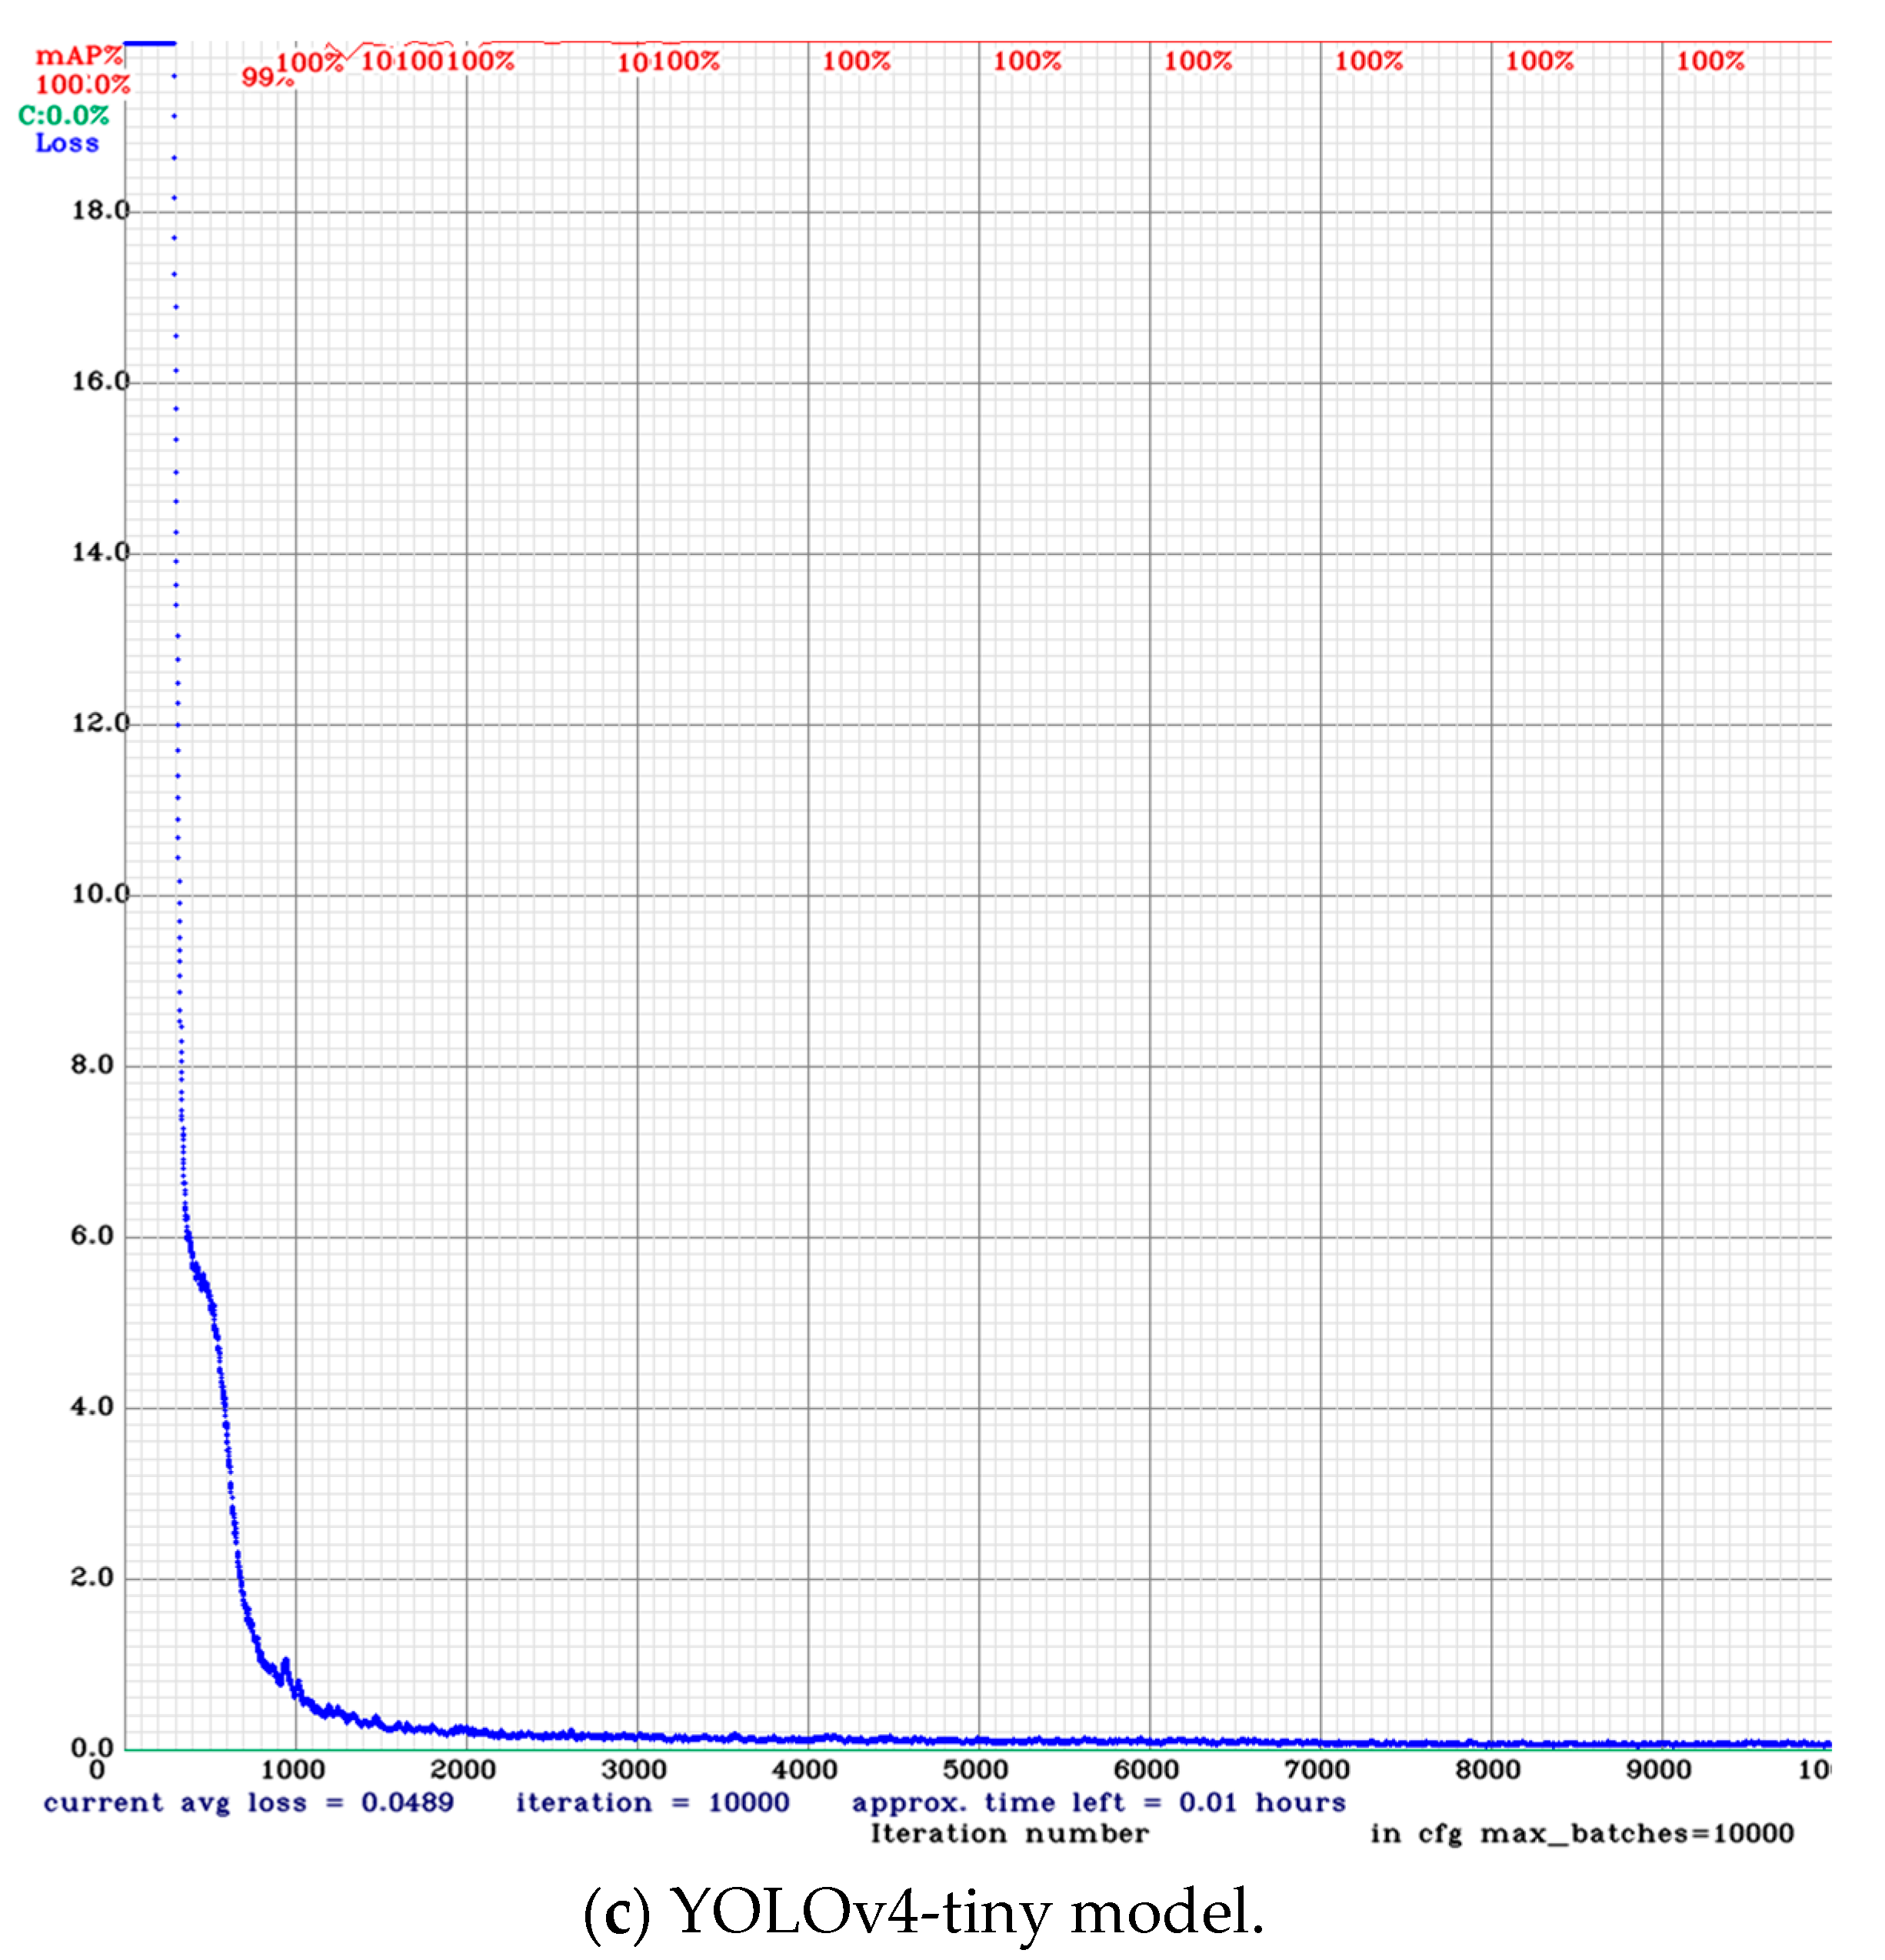
4.4.1. Training Model

In deep learning, data augmentation can solve the imbalance problem, and it is used in various experiments. Data augmentation is used to prevent overfitting problems and increase performance by increasing the number of data, and various studies have been conducted on this topic. In this experiment, the data object alignment mark was standardized, and the learning results of the three models YOLOv4, YOLOv4-csp-swish, and YOLOv4-tiny showed sufficiently high accuracy; therefore, the data augmentation technique was not applied in this experiment. The hyperparameters related to learning are as follows: The model was supplied with a 416 × 416 × 3 (width, height, channel) image input. The batch size was set at 32 subdivisions. The learning rate value was set at 0.0013. The maximum batch size was set as the standard formula for using YOLO Darknet Version 4. The maximum batch value was set to 10,000, reducing the learning rate by 1/10 at 7000 and 8000. The training was conducted with models of YOLOv4, YOLO-csp-swish, and YOLOv4-tiny. During training, we used pre-trained weight models and appropriate convolutional layer filters for YOLOv4, YOLO-csp-swish, and YOLOv4-tiny. Loss and mAP (50%) values were obtained after each iteration, and the training process was stable, as all three models had an average success value of 100% at mAP_0.5. Figure 10 shows a summary of the training process for each model.

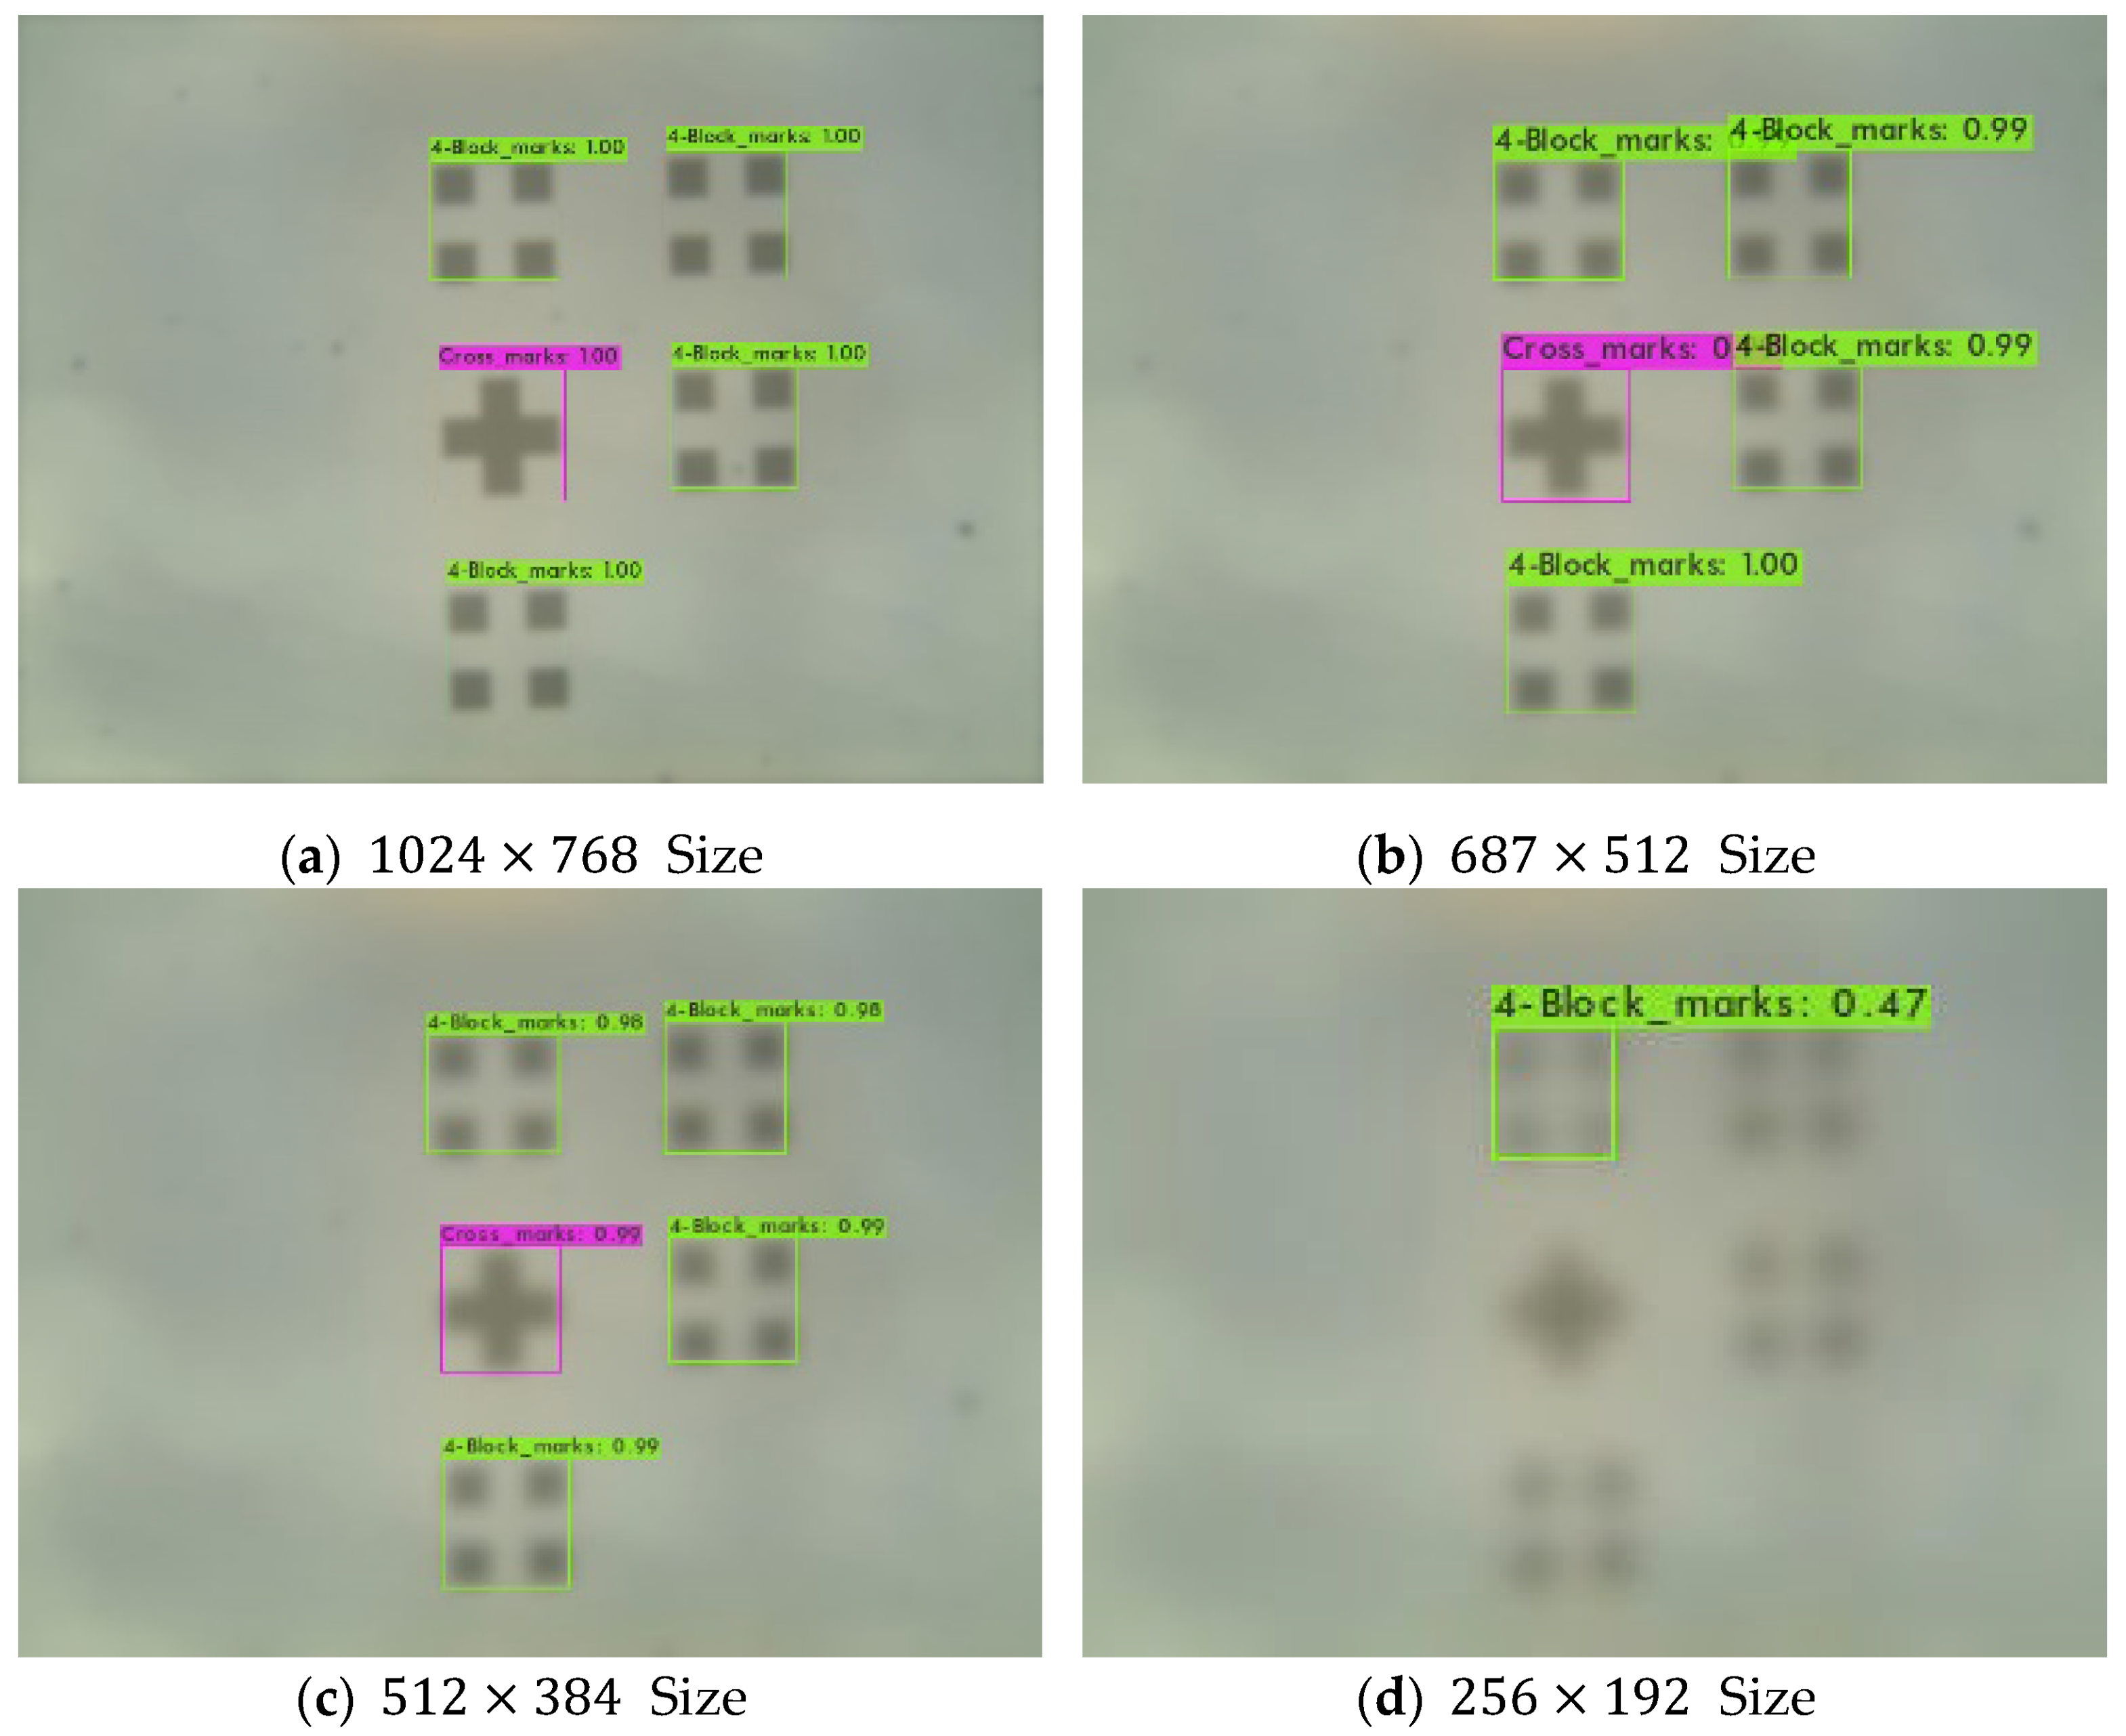
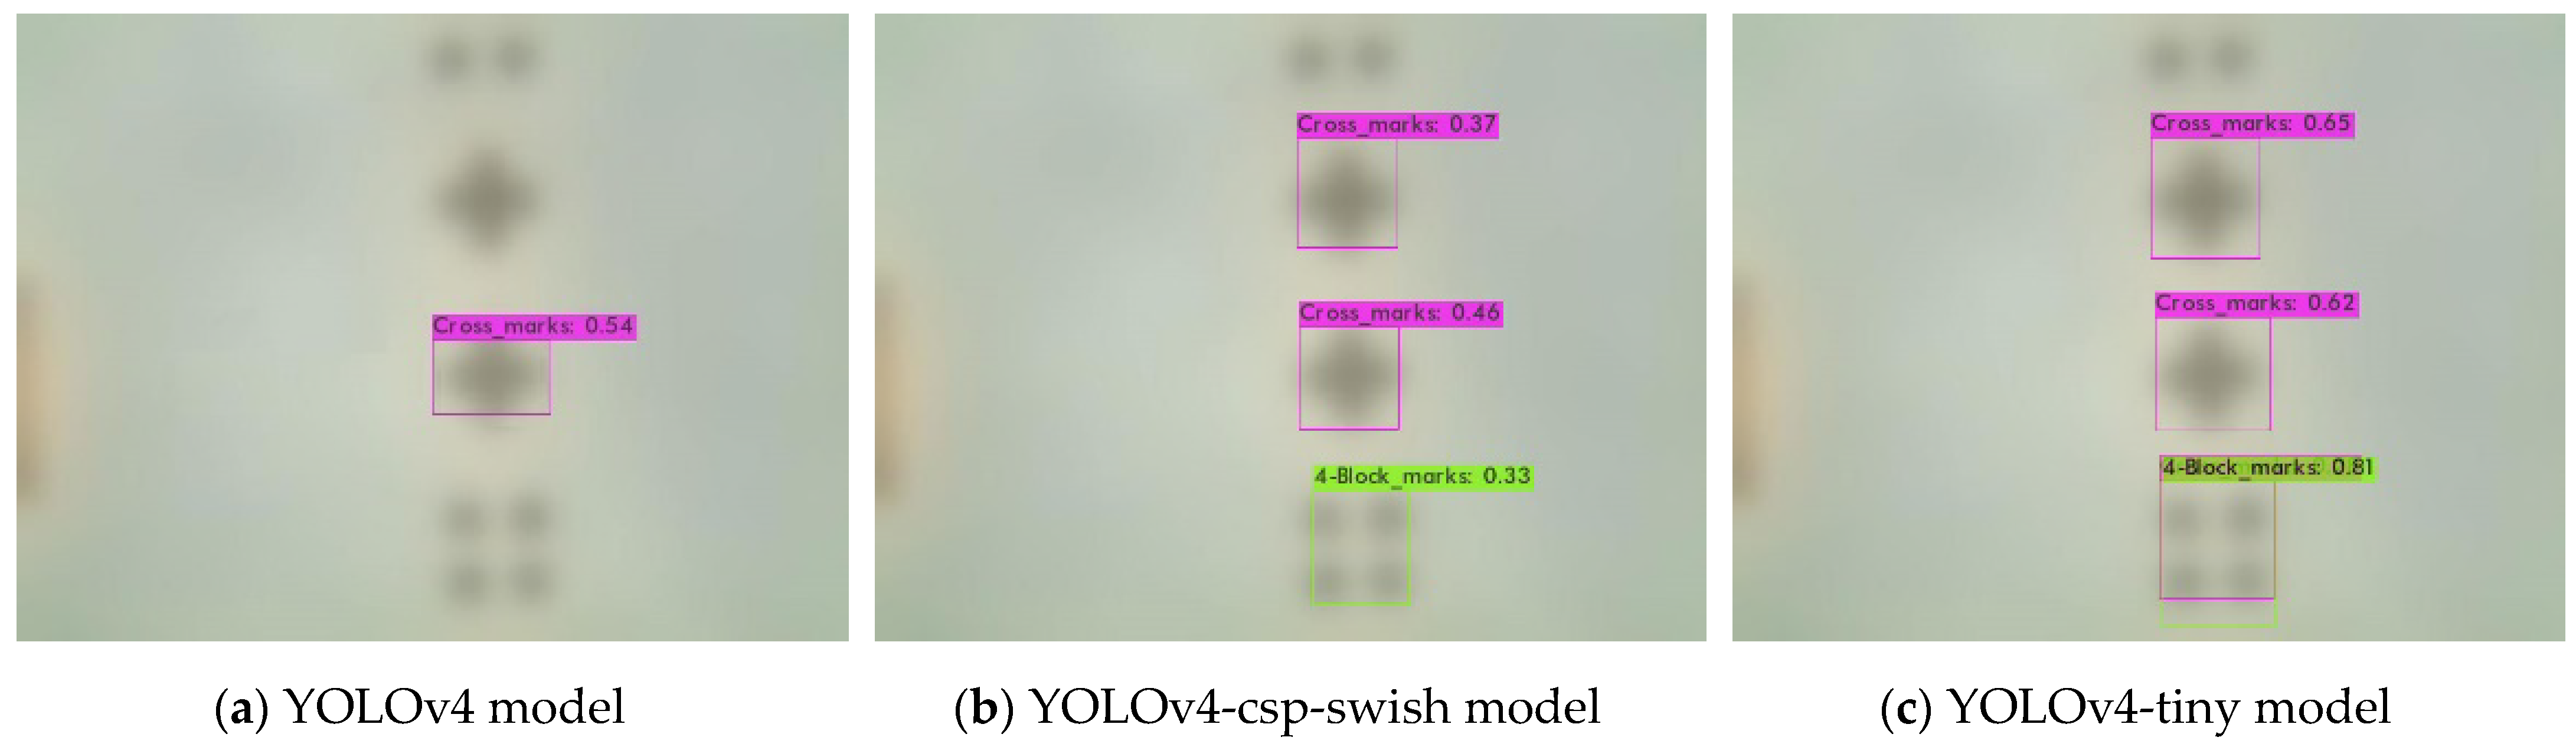
4.4.2. Alignment Mark Detection

The prediction performance is calculated by a loss function that classifies the input data points in the data set. The smaller the loss value, the better the classifier models the relationship between the input data and the output target. The gradual decrease in loss values after each epoch shown in Figure 10 represents the gradual learning process of YOLOv4, YOLO-csp-swish, and YOLOv4-tiny. The curves obtained by the loss functions of YOLOv4, YOLO-csp-swish, and YOLOv4-tiny are very stable after 2000 epochs.
To experiment with various methods, the existing image was resized and tested. Experiments were conducted by changing the image resolution to 687 × 512 , 512 × 384 , and 256 × 192 , including the basic image ( 1024 × 768 ). Figure 11, Figure 12 and Figure 13 are the detection output, showing the alignment obtained from the YOLOv4, YOLO-csp-swish, and YOLOv4-tiny models for each size of the image.
Table 3 shows the Precision, Recall, F1-Score, mAP, and IOU values.
As a result of the test, YOLOv4 performed better than the YOLOv4-csp-swish and YOLOv4-tiny models. Overall, all models detected the alignment marks more thoroughly without omission and with large reliability values. However, during the experiment, there was a decrease in the detection accuracy of the alignment mark depending on the resolution of the camera, and improvement was needed. As shown in Table 3, the performance results of the 512 × 384 size and 256 × 192 size are clearly different. In particular, the alignment detection performance of the 256 × 192 image was poor. Overall Precision, Recall, F1-Score, IOU, and mAp values were significantly lower than other sizes of data. Therefore, an experiment was conducted to improve the image resolution of the 256 × 192 size.

4.4.3. Super Resolution

Table 4 shows the comparison of quantitative results of super resolution with 2 × and 3 × scale sizes using PSNR and SSIM experimental results for bicubic, SRCNN [29], and ESPCN [33]. The multiscale of the proposed model can extract features of objects of different sizes, and the very large network depth helps to extract rich features. With channel attention, the network is more focused on more beneficial functions. The above features help to improve super resolution performance.

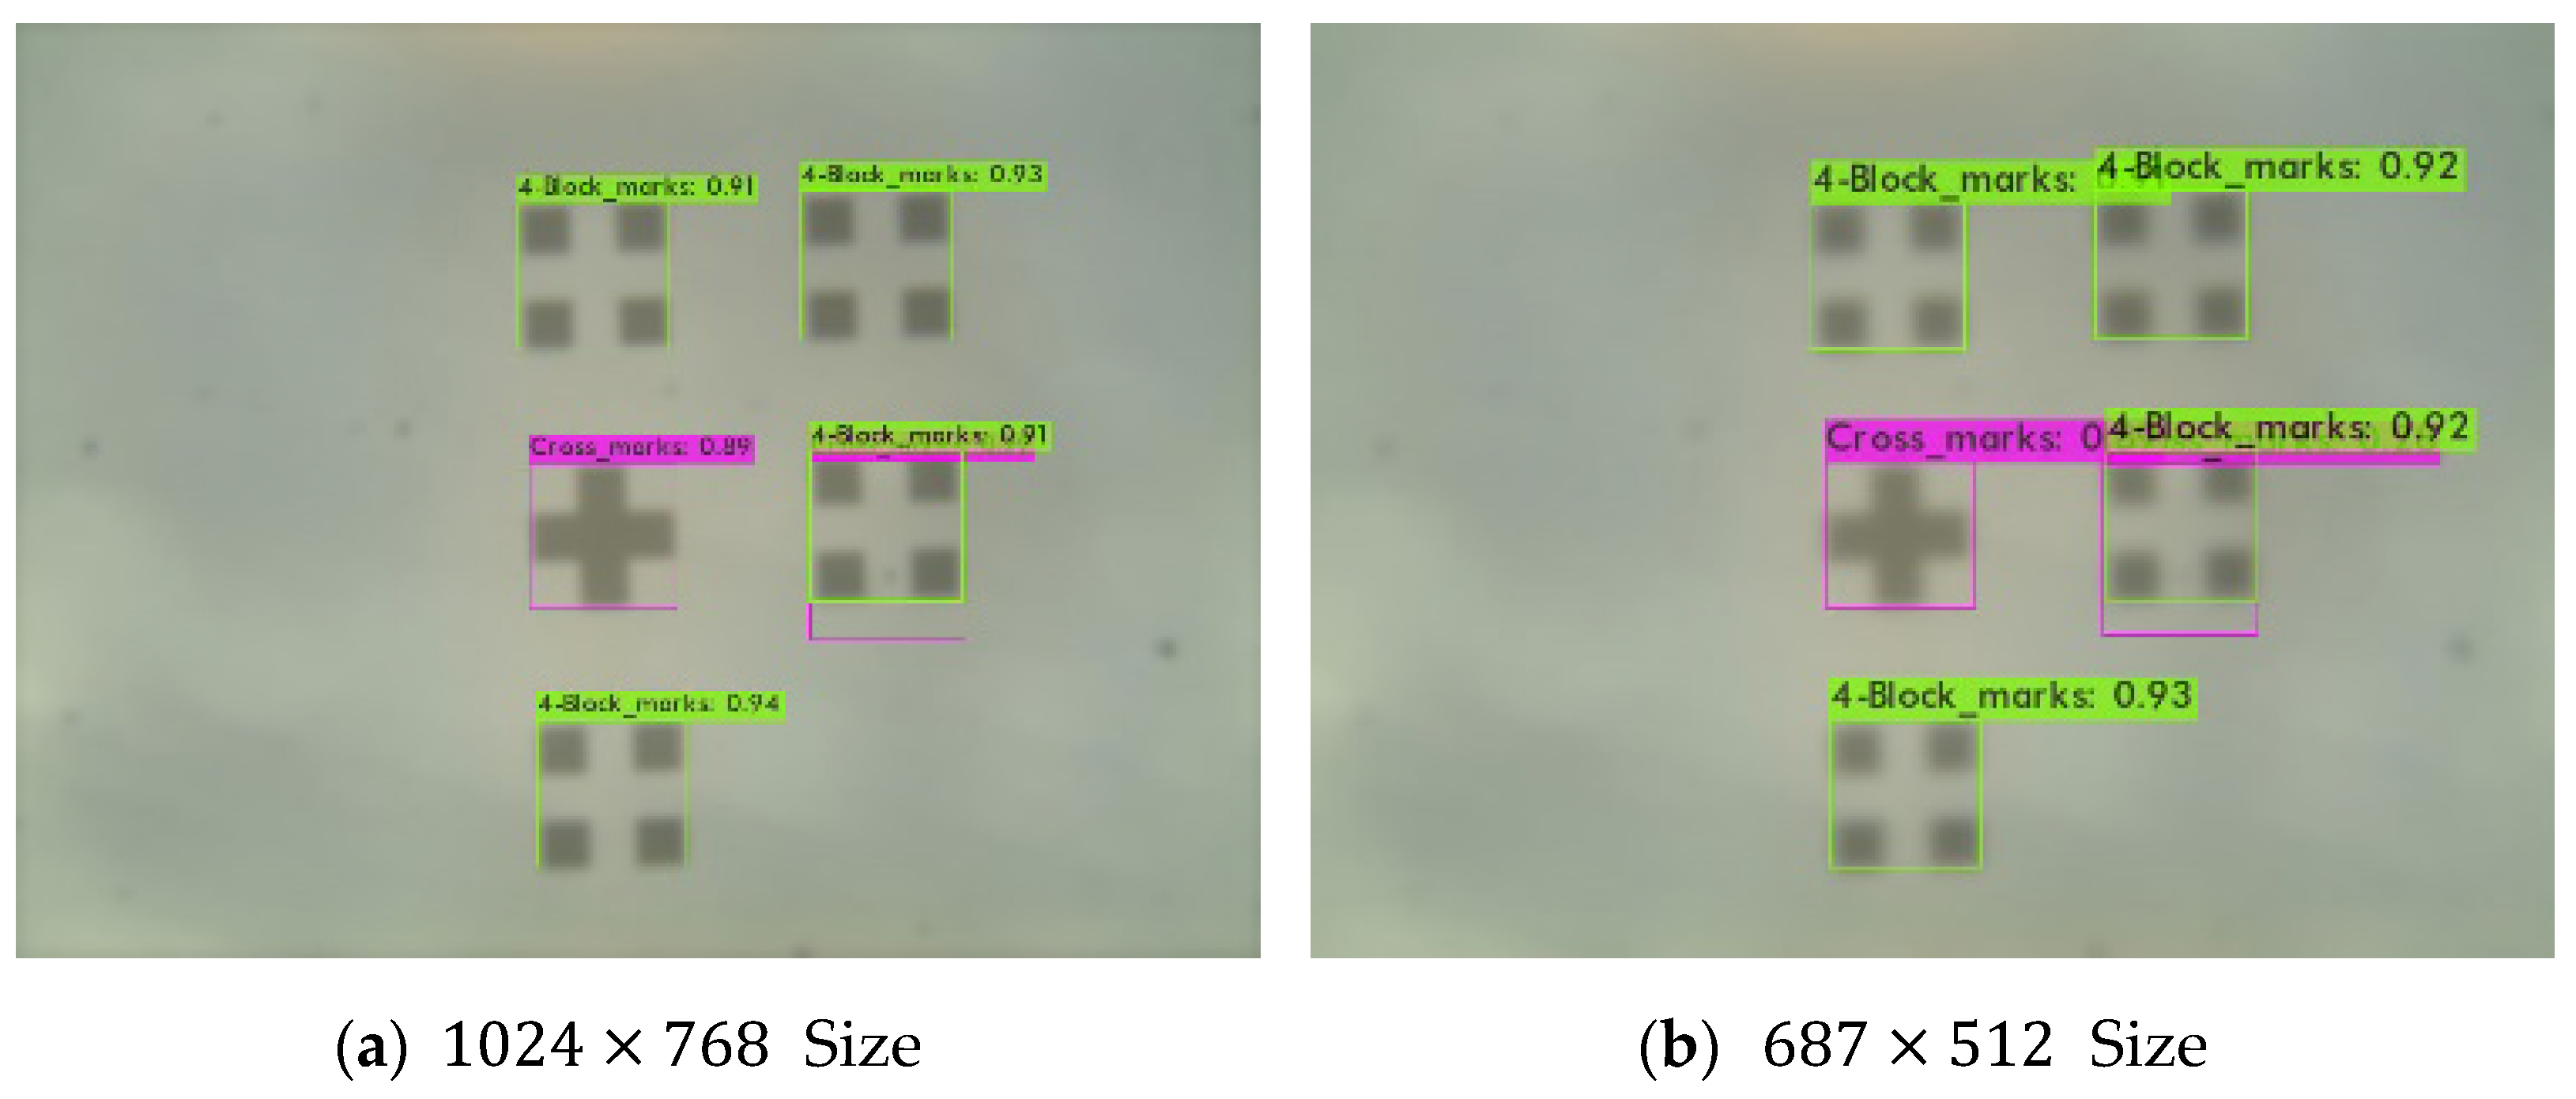
4.4.4. Alignment Mark Detection for Our Model

An experiment to improve the image resolution of the 256 × 192 size was performed. The test was performed in the same environment as specified in Section 4.4.2.
Using our model, a 256 × 192 size × 3 scale resulted in a 768 × 576 size SR image. Figure 14 shows the result of detecting an alignment mark of the 768 × 576 size. There is no significant difference visually between the 256 × 192 and 768 × 576 images, but there is a performance improvement. The detection performance was also improved. Table 5 shows detailed performance results of the 256 × 192 size and 768 × 576 size for the YOLOv4, YOLOv4-csp-swish, and YOLOv4-tiny model.
The overall performance of Precision, Recall, F1-Score, mAP, and IOU was improved in the improved image by applying super resolution. In particular, the IOU result, which judges the success of detecting alignment marks, increased significantly, from 73.89 to 78.29 in the YOLOv4 model compared to other models. The FI-Score improved from 0.34 to 0.46, Recall from 0.21 to 0.30, and Precision from 0.89 to 0.93. Overall, all three models showed that Recall was improved, and Precision and mAp increased. The calculated result suggests it is effective in improving image resolution and is related to object detection. Figure 15 shows the graph of the results for the entire experiment.
Figure 15 is a graph of the results of accuracy, precision, and recall for the entire image. First, the accuracy was excellent when the size was 1024 × 768 , 687 × 512 , and 512 × 384 . However, when it was 256 × 192 , the accuracy was significantly reduced. In size 768 × 576 , to which our proposed model is applied, the accuracy is slightly improved in the YOLOv4-csp-swish and YOLOv4-tiny models compared to 256 × 192 . Precision was improved when we used the YOLOv4 model based on size 256 × 192 . In addition, the reproducibility was excellent when the recall was 1024 × 768 , 687 × 512 , and 512 × 384 size. However, in size 256 × 192 , the reproducibility was significantly lowered. The recall increased by applying the SR image 768 × 576 for our proposed model. In the case of low quality due to the low image resolution, this model was applied to enlarge the image size and to produce the effective results of super resolution. In addition, it was found through the experiment that the size of the image influenced the resolution and object detection. As shown in Figure 15, accuracy, precision, and recall results slightly increased overall. Although some performance results have yet to be obtained, the model proposed through this experiment is expected to be applicable to actual industries. In the experiment, the model was applied to low-quality data to assume unfavorable data in the manufacturing industry, and improvements were made. In other words, it was confirmed that low-quality data were improved, and in the case of normal-quality data, it is expected that there will be sufficient improvement.

5. Conclusions

In this study, we proposed an MSRN-based Attention Block. We applied MSRB and focused on specific features. We were able to implement a good feature extraction map. In particular, by improving the resolution of the small-scale image, the object detection result of the alignment mark was improved. For testing, the image scale size was divided into four equal parts. However, object detection performance deteriorated in certain small-size images. To improve the object detection performance, we applied our proposed model. The proposed method resulted in superior performance compared to the existing method. When the image was applied to the SR model, the resulting Scale × 2 achieved a PSNR of 33.52 and an SSIM of 0.917. With these results, improved accuracy, reproducibility, and prediction results were obtained through the alignment mark detection experiment. These results are believed to help the recognition of alignment marks in semiconductor photolithography. In the semiconductor industry, various convergence technologies in the era of the fourth industrial revolution are being grafted. Through various technologies, it is possible to improve the semiconductor yield. Wafer chips are manufactured using several process technologies. Among them, photolithography is one of the processes of aligning the wafer and scanning the circuit pattern on the wafer on which the photoresist film is formed by irradiating light to the circuit pattern drawn on the mask. As semiconductor technology becomes highly integrated, alignment becomes increasingly difficult due to problems such as reduced alignment margin, transmittance according to level stack structure, increase in wafer diameter, and photolithography processes. Various methods and studies are continuously being utilized and conducted to reduce the misalignment problem, which is directly related to the production yield. Therefore, in this paper, we proposed a model to improve the image resolution quality of marks for accurate alignment as well as improved image super-resolution and object detection performance through experiments. Various experiments were conducted to verify this method, and the performance was improved compared to the previous study.
Vision technology is converging in various manufacturing industries. We believe that there is still much to be explored in the direction of image processing and computer vision related to process and quality control in the manufacturing industry. This study provides a basis for potential work in this area. In the future, we plan to conduct research focusing on reducing the weight of the model and improving its performance.

Author Contributions

Conceptualization, J.P. and J.J.; methodology, J.P.; software, J.P.; validation, J.P. and J.J.; formal analysis, J.P.; investigation, J.P.; resources, J.J.; data curation, J.P.; writing—original draft preparation, J.P.; writing—review and editing, J.J.; visualization, J.P.; supervision, J.J.; project administration, J.J.; funding acquisition, J.J. All authors have read and agreed to the published version of the manuscript.

Funding

This work was supported by the MSIT (Ministry of Science and ICT), Korea, under the ICT Creative Consilience Program (IITP-2021-2020-0-01821) supervised by the IITP (Institute for Information & communications Technology Planning & Evaluation), and the National Research Foundation of Korea (NRF) grant funded by the Korea government (MSIT) (No. 2021R1F1A1060054).

Institutional Review Board Statement

Not applicable.

Informed Consent Statement

Not applicable.

Data Availability Statement

Not applicable.

Acknowledgments

This work was supported by the National Research Foundation of Korea (NRF) grant funded by the Korean government (MSIT) (No. 2021R1F1A1060054).

Conflicts of Interest

The authors declare no conflict of interest.

References

  1. Lee, D.; Yang, J.; Lee, C.; Kim, K. A data-driven approach to selection of critical process steps in the semiconductor manufacturing process considering missing and imbalanced data. J. Manuf. Syst. 2019, 52, 146–156. [Google Scholar] [CrossRef]
  2. Yang, Y. A Deep Learning Model for Identification of Defect Patterns in Semiconductor Wafer Map. In Proceedings of the 2019 30th Annual SEMI Advanced Semiconductor Manufacturing Conference (ASMC), New York, NY, USA, 6–9 May 2019; pp. 1–6. [Google Scholar]
  3. Yu, J. Enhanced Stacked Denoising Autoencoder-Based Feature Learning for Recognition of Wafer Map Defects. IEEE Trans. Semicond. Manuf. 2019, 32, 613–624. [Google Scholar] [CrossRef]
  4. Chien, J.-C.; Wu, M.-T.; Lee, J.-D. Inspection and Classification of Semiconductor Wafer Surface Defects Using CNN Deep Learning Networks. Appl. Sci. 2020, 10, 5340. [Google Scholar] [CrossRef]
  5. Chien, C.-F.; Chen, Y.-H.; Lo, M.-F. Advanced Quality Control (AQC) of Silicon Wafer Specifications for Yield Enhancement for Smart Manufacturing. IEEE Trans. Semicond. Manuf. 2020, 33, 569–577. [Google Scholar] [CrossRef]
  6. Zhang, H.; Feng, T.; Djurdjanovic, D. Dynamic Down-Selection of Measurement Markers for Optimized Robust Control of Overlay Errors in Photolithography Processes. IEEE Trans. Semicond. Manuf. 2022, 1. [Google Scholar] [CrossRef]
  7. Miyamoto, A.; Kawahara, T. Automatic extraction technique of CD-SEM evaluation points to measure semiconductor overlay error. IEEE Trans. Electron. Inf. Syst. 2019, 138, 1278–1286. [Google Scholar] [CrossRef]
  8. Goswami, S.; Hall, S.; Wyko, W.; Elson, J.T.; Galea, J.; Kretchmer, J. In-line Photoresist Defect Reduction through Failure Mode and Root-Cause Analysis:Topics/categories: EO (Equipment Optimization)/DR (Defect Reduction). In Proceedings of the 2020 31st Annual SEMI Advanced Semiconductor Manufacturing Conference (ASMC), New York, NY, USA, 24–26 August 2020; pp. 1–5. [Google Scholar]
  9. Frustaci, F.; Perri, S.; Cocorullo, G.; Corsonello, P. An embedded machine vision system for an in-line quality check of assembly processes. Procedia Manuf. 2020, 42, 211–218. [Google Scholar] [CrossRef]
  10. Mennel, L.; Symonowicz, J.; Wachter, S.; Polyushkin, D.K.; Molina-Mendoza, A.J.; Mueller, T. Ultrafast machine vision with 2D material neural network image sensors. Nature 2020, 579, 62–66. [Google Scholar] [CrossRef]
  11. Penumuru, D.P.; Muthuswamy, S.; Karumbu, P. Identification and classification of materials using machine vision and machine learning in the context of industry 4.0. J. Intell. Manuf. 2020, 31, 1229–1241. [Google Scholar] [CrossRef]
  12. Wang, J.; Sun, K.; Cheng, T.; Borui, J.; Deng, C.; Zhao, Y.; Liu, D.; Mu, Y.; Tan, M.; Wang, X.; et al. Deep High-Resolution Representation Learning for Visual Recognition. IEEE Trans. Pattern Anal. Mach. Intell. 2021, 43, 3349–3364. [Google Scholar] [CrossRef] [Green Version]
  13. Zhang, S.; Liang, G.; Pan, S.; Zheng, L. A Fast Medical Image Super Resolution Method Based on Deep Learning Network. IEEE Access 2019, 7, 12319–12327. [Google Scholar] [CrossRef]
  14. Xu, Y.; Xie, Z.; Feng, Y.; Chen, Z. Road Extraction from High-Resolution Remote Sensing Imagery Using Deep Learning. Remote Sens. 2018, 10, 1461. [Google Scholar] [CrossRef] [Green Version]
  15. Alganci, U.; Mehmet, S.; Elif, S. Comparative Research on Deep Learning Approaches for Airplane Detection from Very High-Resolution Satellite Images. Remote Sens. 2020, 12, 458. [Google Scholar] [CrossRef] [Green Version]
  16. Zhang, Y.; Ma, X.; Zhang, F.; Huang, H. Telecentricity measurement for exposure system of photolithography tools. Opt. Eng. 2020, 59, 034109. [Google Scholar] [CrossRef]
  17. Adel, M.; Ghinovker, M.; Golovanevsky, B.; Izikson, P.; Kassel, E.; Yaffe, D.; Bruckstein, A.M.; Goldenberg, R.; Rubner, Y.; Rudzsky, M. Optimized overlay metrology marks: Theory and experiment. IEEE Trans. Semicond. Manuf. 2004, 17, 166–179. [Google Scholar] [CrossRef]
  18. Fung, R.; Hanna, A.M.; Vendrell, O.; Ramakrishna, S.; Seideman, T.; Santra, R.; Ourmazd, A. Dynamics from noisy data with extreme timing uncertainty. Nature 2016, 532, 471–475. [Google Scholar] [CrossRef]
  19. Gonzalez, R.C.; Woods, R.; Barry, R.M. Digital Image Processing. 2008. Available online: https://www.imageprocessingplace.com/ (accessed on 29 January 2022).
  20. Qi, C.; Sivakumar, A.I.; Gershwin, S.B. Impact of Production Control and System Factors in Semiconductor. Wafer Fabrication. IEEE Trans. Semicond. Manuf. 2008, 21, 376–389. [Google Scholar]
  21. KIM, J. New Wafer Alignment Process Using Multiple Vision Method for Industrial Manufacturing. Electronics 2018, 7, 39. [Google Scholar] [CrossRef] [Green Version]
  22. Emil, S.-W.; Kaustuve, B. Pairing wafer leveling metrology from a lithographic apparatus with deep learning to enable cost effective dense wafer alignment metrology. SPIE Adv. Lithogr. 2019, 10961, 35–40. [Google Scholar]
  23. Jeong, I.; Kim, H.; Kong, Y.; Song, J.; Ju, J.; Kim, Y.; Lambregts, C.; Yu, M.; Rahman, R.; Karssemeijer, L.; et al. Improved wafer alignment model algorithm for better on-product overlay. Proc. SPIE 2019, 10961, 41–50. [Google Scholar]
  24. Lee, K.; Kim, C. Marker layout for optimizing the overlay alignment in a photolithography process. IEEE Trans. Semicond. Manuf. 2019, 32, 212–219. [Google Scholar] [CrossRef]
  25. Kim, H.; Song, C.; Yang, H. Algorithm for automatic alignment in 2D space by object transformation. Microelectron. Reliab. 2006, 46, 100–108. [Google Scholar] [CrossRef]
  26. Timofte, R.; De Smet, V.; Van Gool, L. Anchored neighborhood regression for fast example-based super-resolution. In Proceedings of the IEEE International Conference on Computer Vision, Sydney, Australia, 2–8 December 2013; pp. 1920–1927. [Google Scholar]
  27. Timofte, R.; De Smet, V.; Van Gool, L. A+: Adjusted anchored neighborhood regression for fast super-resolution. In Proceedings of the Asian Conference on Computer Vision, Singapore, 1–5 November 2014; pp. 111–126. [Google Scholar]
  28. Dong, C.; Loy, C.C.; He, K.; Tang, X. Image super-resolution using deep convolutional networks. In Proceedings of the European Conference on Computer Vision (ECCV), Zurich, Switzerland, 6–12 September 2014; pp. 184–199. [Google Scholar]
  29. He, K.; Zhang, X.; Ren, S.; Sun, J. Deep residual learning for image recognition. In Proceedings of the IEEE Conference on Computer Vision and Pattern Recognition, Las Vegas, NV, USA, 27–30 June 2016; pp. 770–778. [Google Scholar]
  30. Lim, B.; Son, S.; Kim, H.; Nah, S.; Lee, K. Enhanced deep residual networks for single image super-resolution. In Proceedings of the IEEE Conference on Computer Vision and Pattern Recognition Workshops, Honolulu, HI, USA, 21–26 July 2017; pp. 136–144. [Google Scholar]
  31. Shi, W.; Caballero, J.; Huszár, F.; Totz, J.; Aitken, A.P.; Bishop, R.; Rueckert, D.; Wang, Z. Real-time single image and video super-resolution using an efficient sub-pixel convolutional neural network. In Proceedings of the IEEE Conference on Computer Vision and Pattern Recognition, Las Vegas, NV, USA, 27–30 June 2016; pp. 1874–1883. [Google Scholar]
  32. Li, J.; Fang, F.; Mei, K.; Zhang, G. Multi-scale residual network for image super-resolution. In Proceedings of the European Conference on Computer Vision (ECCV), Munich, Germany, 8–14 September 2018; pp. 517–532. [Google Scholar]
  33. Qin, J.; Huang, Y.; Wen, W. Multi-scale feature fusion residual network for Single Image Super-Resolution. Neurocomputing 2020, 379, 334–342. [Google Scholar] [CrossRef]
  34. Li, G.; Li, L.; Zhu, H.; Liu, X.; Jiao, L. Adaptive multiscale deep fusion residual network for remote sensing image classification. IEEE Trans. Geosci. Remote Sens. 2019, 57, 8506–8521. [Google Scholar] [CrossRef]
  35. Dai, Y.; Zhuang, P. Compressed sensing MRI via a multi-scale dilated residual convolution network. Magn. Reson. Imaging 2019, 63, 93–104. [Google Scholar] [CrossRef] [Green Version]
  36. Esmaeilzehi, A.; Ahmad, M.O.; Swamy, M.N.S. PHMNet: A Deep Super Resolution Network using Parallel and Hierarchical Multi-scale Residual Blocks. In Proceedings of the 2020 IEEE International Symposium on Circuits and Systems (ISCAS), Seville, Spain, 12–14 October 2020; pp. 1–5. [Google Scholar]
  37. Zhang, B.; Xiong, D.; Su, J. Neural machine translation with deep attention. IEEE Trans. Pattern Anal. Mach. Intell. 2018, 42, 154–163. [Google Scholar] [CrossRef]
  38. Liu, T.; Wang, K.; Sha, L.; Chang, B.; Sui, Z. Table-to-text generation by structure-aware seq2seq learning. In Proceedings of the Thirty-Second AAAI Conference on Artificial Intelligence, New Orleans, LA, USA, 2–7 February 2018. [Google Scholar]
  39. Wu, X.; Huang, S.; Li, M.; Deng, Y. Vector Magnetic Anomaly Detection via an Attention Mechanism Deep-Learning Model. Appl. Sci. 2021, 11, 11533. [Google Scholar] [CrossRef]
  40. Zheng, W.; Liu, X.; Yin, L. Sentence Representation Method Based on Multi-Layer Semantic Network. Appl. Sci. 2021, 11, 1316. [Google Scholar] [CrossRef]
  41. Woo, S.; Park, J.; Lee, J.Y.; Kweon, I.S. Cbam: Convolutional block attention module. In Proceedings of the European Conference on Computer Vision (ECCV), Munich, Germany, 8–14 September 2018; pp. 3–19. [Google Scholar]
  42. Zhang, Z.; Lan, C.; Zeng, W.; Jin, X.; Chen, Z. Relation-aware global attention for person re-identification. In Proceedings of the IEEE/CVF Conference on Computer Vision and Pattern Recognition (CVPR), Seattle, WA, USA, 14–19 June 2020; pp. 3186–3195. [Google Scholar]
  43. Ge, Z.; Liu, S.; Wang, F.; Li, Z.; Sun, J. YOLOX: Exceeding YOLO Series in 2021. In Proceedings of the Computer Vision and Pattern Recognition (CVPR), Nashville, TN, USA, 19–25 June 2021. [Google Scholar]
Figure 1. Workflow of the photolithography process.
Applsci 12 02721 g001
Figure 2. Structure of the Mask Aligner.
Applsci 12 02721 g002
Figure 3. Structure of SRCNN/FSRCNN.
Applsci 12 02721 g003
Figure 4. Structure of VDSR.
Applsci 12 02721 g004
Figure 5. Structure of EDSR.
Applsci 12 02721 g005
Figure 6. Structure of the proposed model.
Applsci 12 02721 g006
Figure 7. Structure of the proposed detailed model.
Applsci 12 02721 g007
Figure 8. Karl Suss MA6 Mask Aligner.
Applsci 12 02721 g008
Figure 9. Alignment mark images collected using the vision camera of the MA6 Mask Alignment equipment.
Applsci 12 02721 g009
Figure 10. Training process with the models.
Applsci 12 02721 g010aApplsci 12 02721 g010b
Figure 11. YOLOv4 model.
Applsci 12 02721 g011
Figure 12. YOLOv4-csp-swish model.
Applsci 12 02721 g012aApplsci 12 02721 g012b
Figure 13. YOLOv4-tiny model.
Applsci 12 02721 g013
Figure 14. The 768 × 576 (SR) size detection results.
Applsci 12 02721 g014
Figure 15. Experimental results of images for each size.
Applsci 12 02721 g015aApplsci 12 02721 g015b
Table 1. System specification.
Hardware EnvironmentSoftware Environment
CPU: Intel Core i7-8700k, 3.7 Ghz, Window PyTorch framework
Six-core twelve threads 16 GB
GPU: GeForce GTX 1080Ti
Python 3.6
Darknet C++ Interface
Table 2. Karl Suss MA6 Mask Aligner’s specification.
ContentsSpecifications
OverviewUV broadband (250–450 nm), I-line (365 nm), and G-line (436 nm) wavelength available
Exposure methodsFlood, proximity, soft and hard contacts, low vacuum andvacuum contacts
Mask size 2.5 × 2.5 ,   4 × 4 ,   5 × 5   and   8 × 8
Wafer size for top-side alignmentup to 6” in diameter (small samples, 2”, 3”, 4”, and 6”)
Wafer size for bottom-side alignment3″ and 4″ chucksore
Maximum wafer thickness3 mm
OtherThe machine is exclusively intended for use as an alignment and/or exposure device for substrates used in semiconductor and microsystems technology
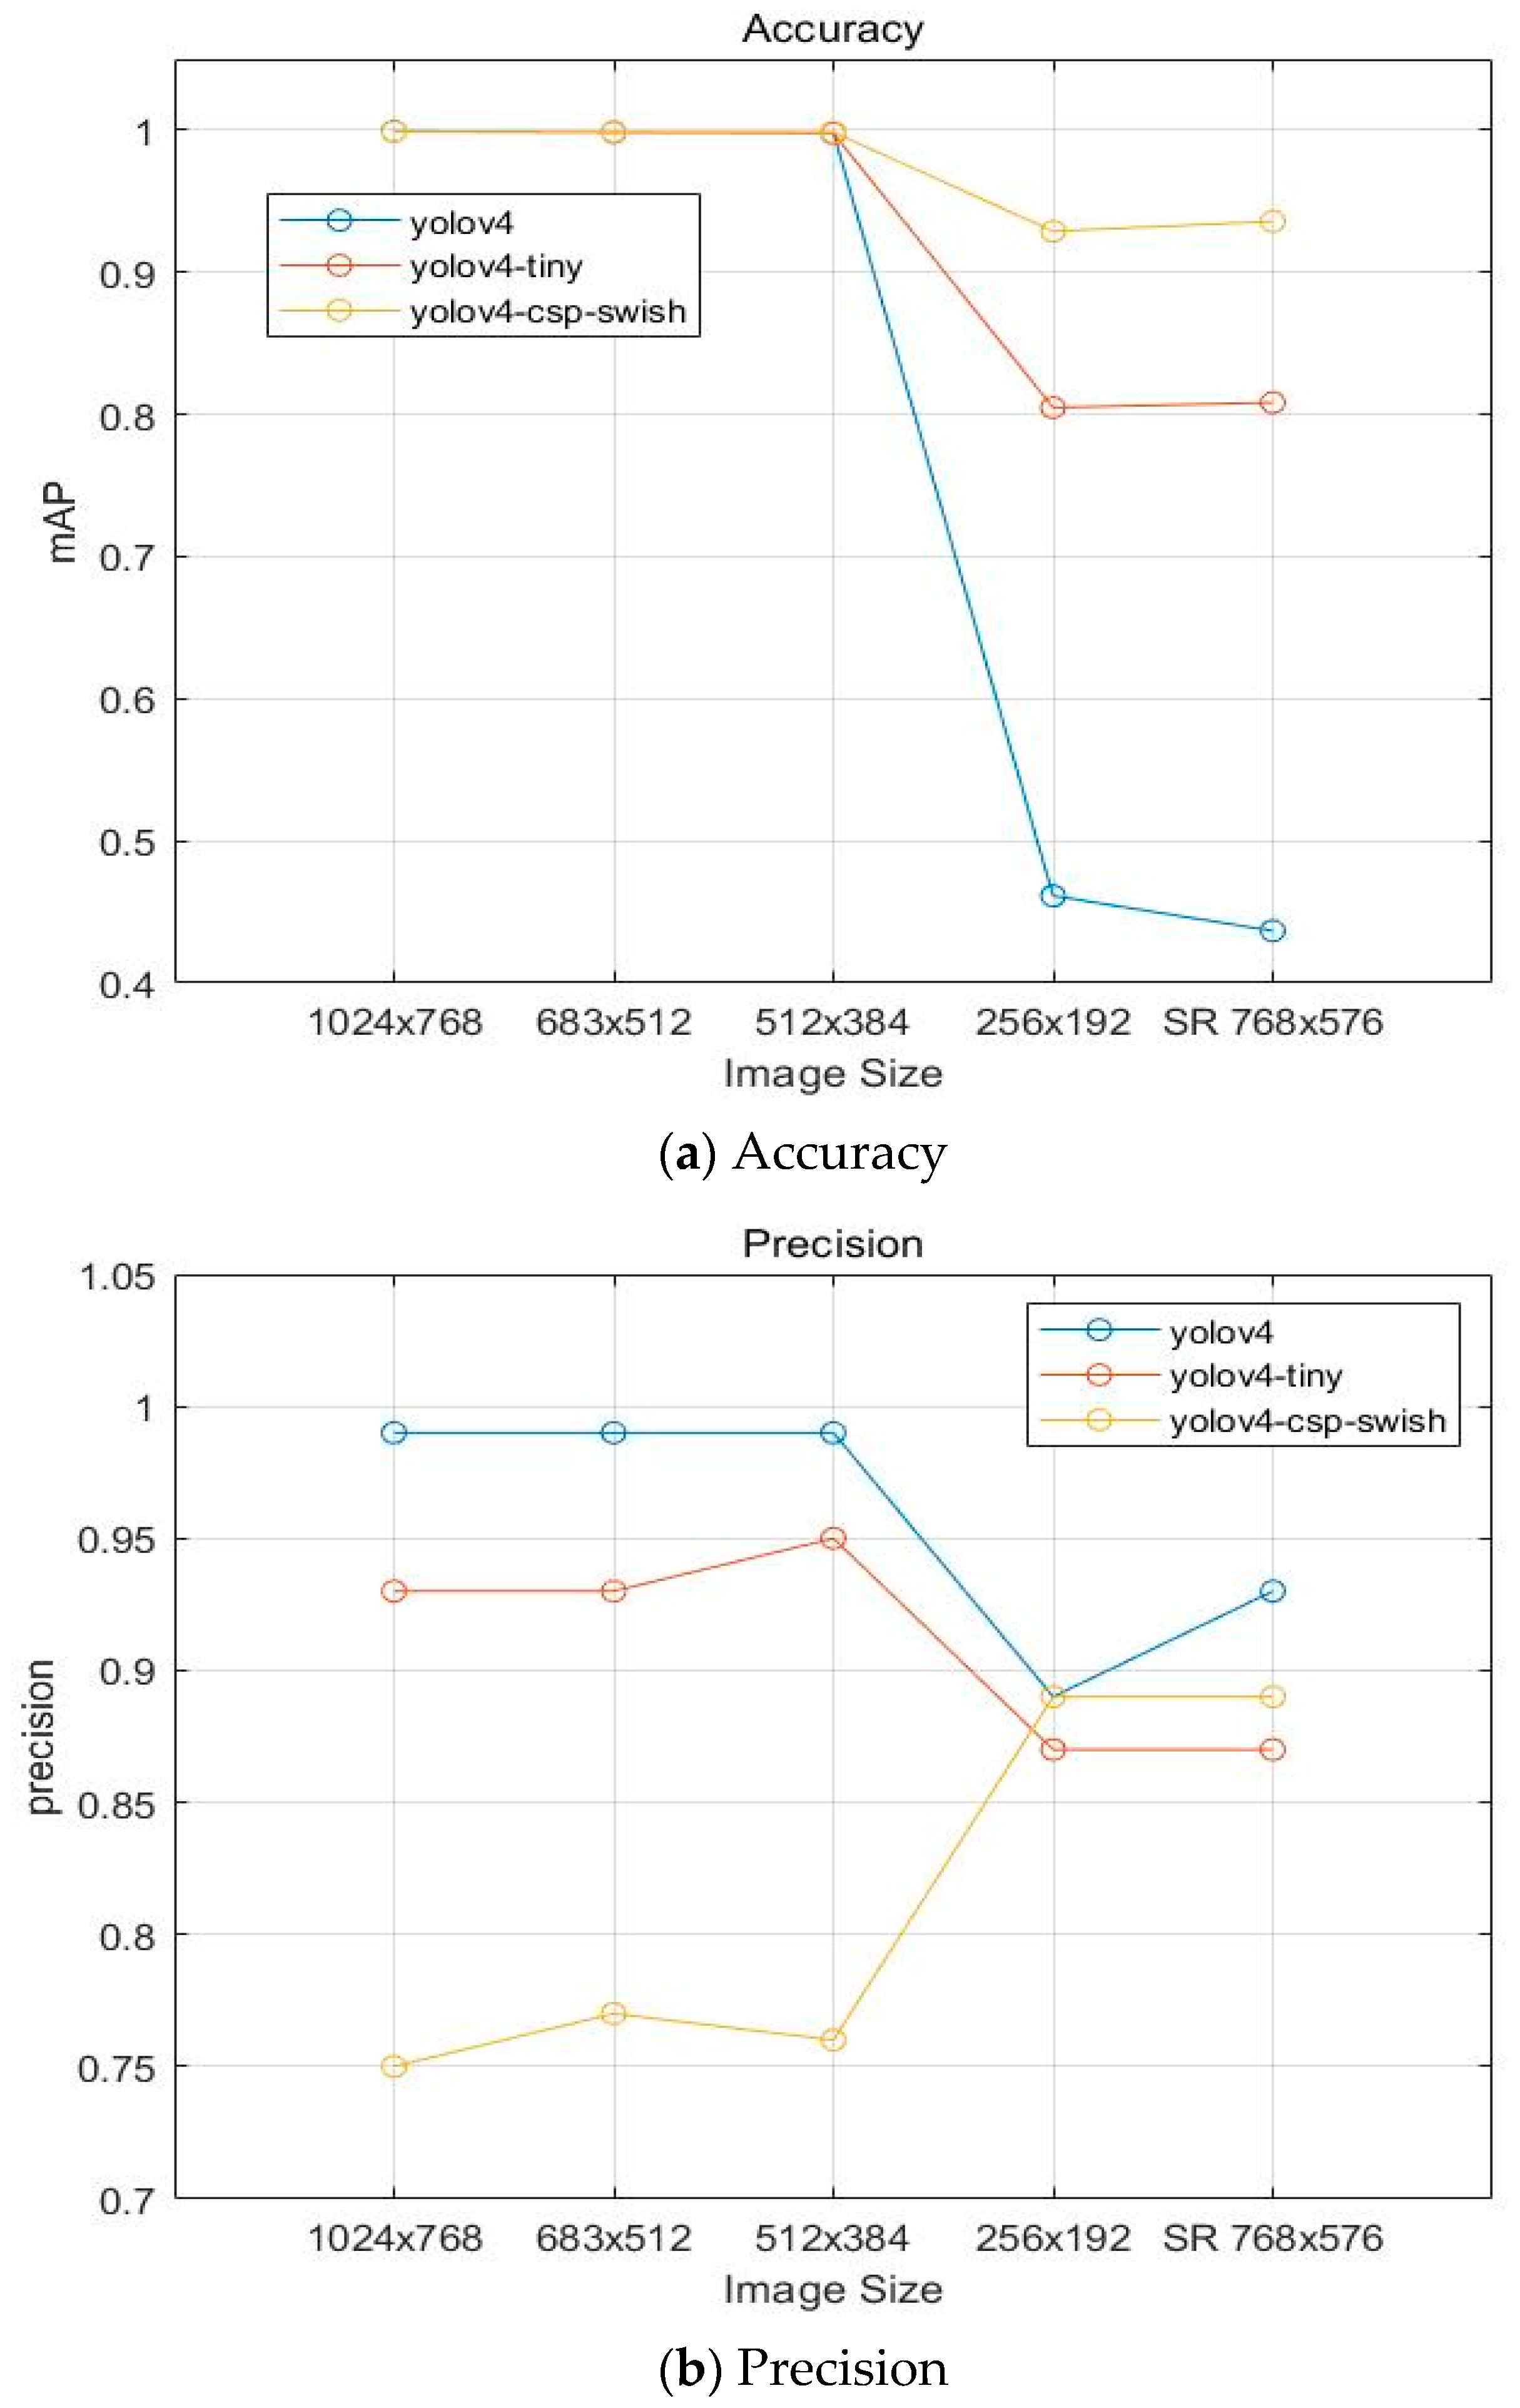
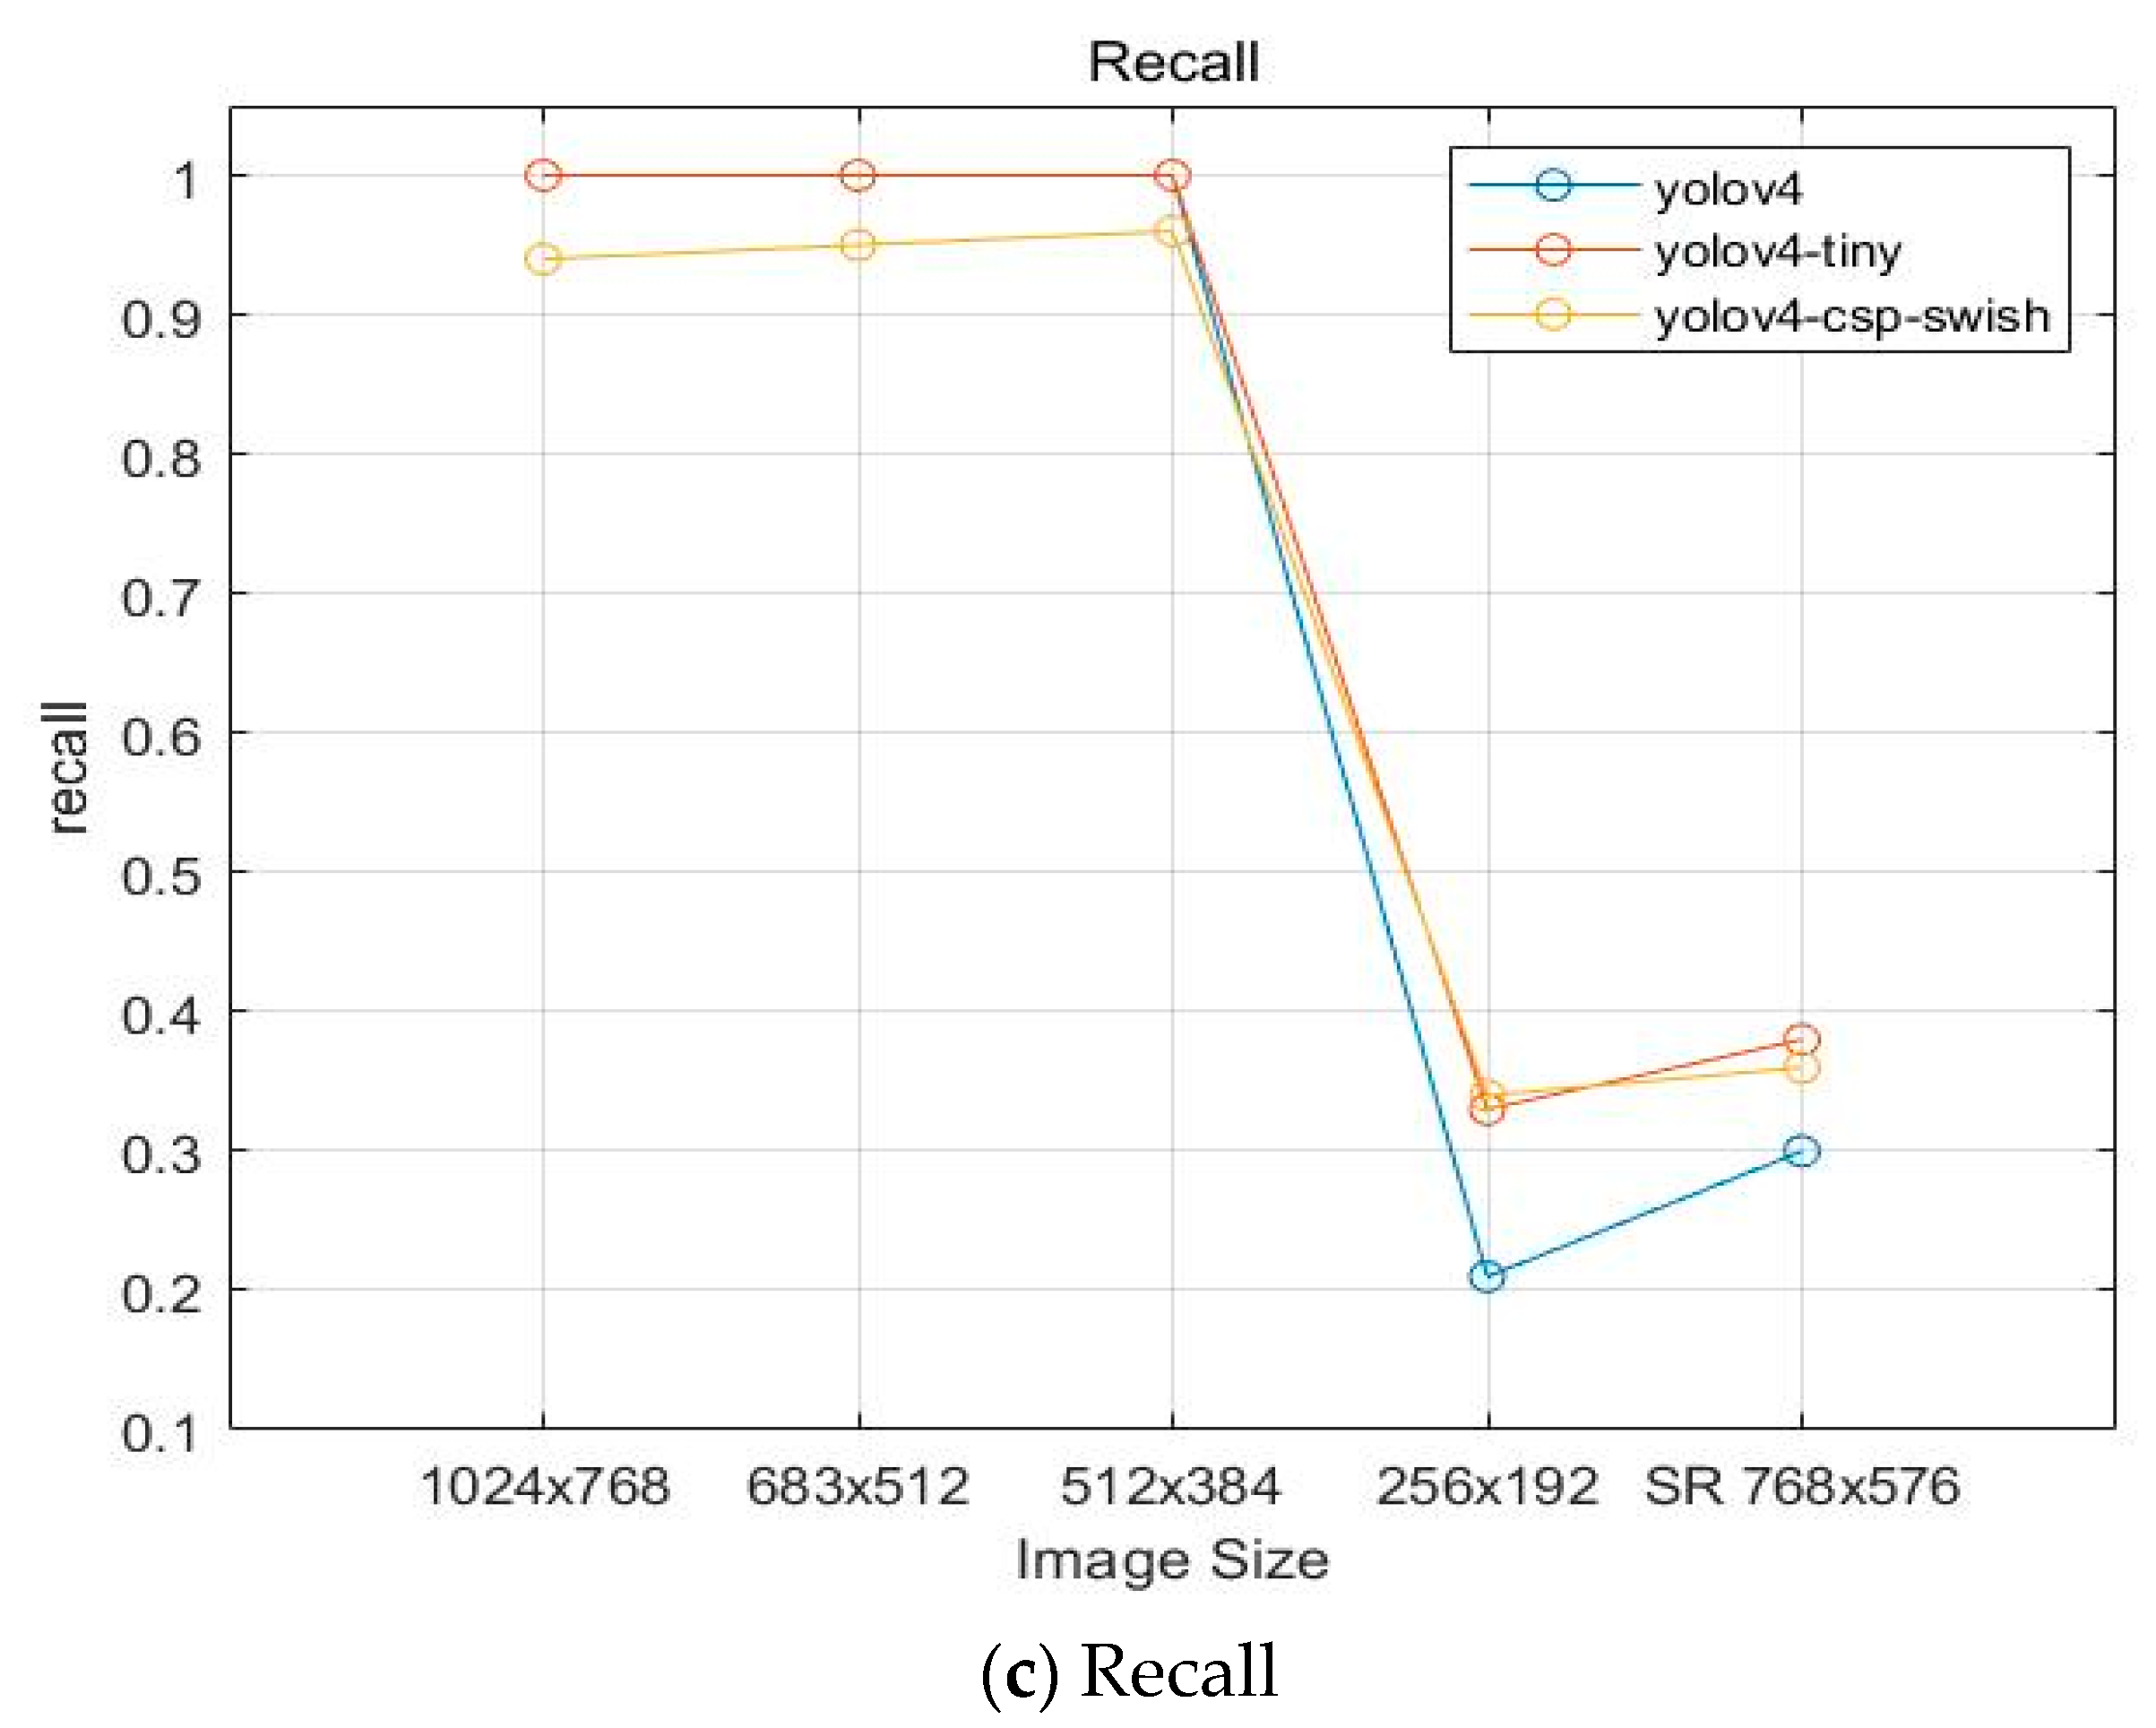
Table 3. Test results.
ModelImage SizemAP@50PrecisionRecallF1-ScoreIOU
YOLOv4 1024 × 768 99.930.991192.39
687 × 512 98.890.9910.9991.2
512 × 384 99.820.9910.9989.88
256 × 192 46.130.890.210.3473.89
YOLOv4-csp-swish 1024 × 768 99.900.750.940.8369.78
687 × 512 99.890.770.950.8571.22
512 × 384 92.860.760.960.8569.62
256 × 192 92.890.890.340.4974.34
YOLOv4-tiny 1024 × 768 99.910.9510.9684.13
687 × 512 99.840.9310.9784.01
512 × 384 99.720.9310.9784.2
256 × 192 80.480.870.330.4866.25
Table 4. Comparison with other models.
MethodScalePSNRSSIM
Bicubic × 230.560.871
A+ [27]32.290.895
SRCNN [29]32.450.903
ESPCN [33]32.910.911
MSRN [32]33.260.914
Ours33.520.917
Bicubic × 327.730.783
A+ [27]28.970.807
SRCNN [29]29.280.820
ESPCN [33]29.510.825
MSRN [32]29.640.831
Ours29.870.839
Table 5. Test results for our model.
ModelImage SizemAP@50PrecisionRecallF1-ScoreIOU
YOLOv4 256 × 192 46.130.890.210.3473.89
768 × 576 (SR)46.670.930.300.4678.29
YOLOv4-csp-swish 256 × 192 92.890.890.340.4974.34
768 × 576 (SR)93.580.890.360.5174.46
YOLOv4-tiny 256 × 192 80.480.870.330.4866.25
768 × 576 (SR)80.850.870.380.5367.45
Publisher’s Note: MDPI stays neutral with regard to jurisdictional claims in published maps and institutional affiliations.

