1. Introduction
As driving a vehicle becomes a major part of our daily life, the incidence of traffic accidents increases due to numerous factors. Driver breathing abnormalities, such as apnea or hyperventilation, and drowsy driving are among the main causes of traffic accidents every year. According to a recent study, approximately 20% of traffic accidents are caused by drowsiness, which accounts for a large proportion of all accidents [
1,
2]. Detecting driver breathing abnormalities and drowsy driving in advance and implementing real-time measurement can thus prevent major accidents. A highly accurate driver vital monitoring study becomes necessary in this regard [
3,
4].
Vital monitoring methods for conventional drivers were conducted by cameras and motion sensors inside the vehicle to monitor factors that are external to the body, such as the driver’s eyelid closing [
5] and nodding of the head or using electromyography (EMG) and electrocardiogram (ECG) sensors [
6,
7]. However, conventional methods have difficulties in directly recognizing the driver’s movements in low-illuminance environments, such as night driving. In addition, methods using EMG and ECG sensors require physical contact between the driver’s skin and the sensor [
8,
9] or have problems such as the use of the internal vehicle space for sensor installation.
Driver vital sign monitoring using frequency-modulated continuous-wave (FMCW) radar [
10] is a non-contact method that uses electromagnetic waves and has the advantages of low power consumption and small packaging [
11], solving the problems of conventional methods. Conventional methods of monitoring driver vital signals [
12,
13,
14] estimate the respiration rate in situations where the driver’s condition is stable and the driver’s movement is not incorporated. However, in the actual driving environment, monitoring vital signs accurately is very difficult because of external factors such as the driver’s movements while driving [
10]. The FMCW radar is a distance-based communication device that uses electromagnetic waves. The driver’s movement causes irregular fluctuations in the radar signal [
15], which reduces the accuracy of vital signal monitoring through the FMCW radar [
16]. Therefore, it is necessary to compensate for the respiration signal reflecting the movement of the driver in the movement situation to improve the accuracy of signal extraction [
17,
18].
In this paper, we introduce a new signal compensation index setting method that detects the driver’s movement using a 60 GHz bandwidth FMCW radar and compensates for the distorted driver’s respiration signal. To verify the accuracy of the proposed algorithm, we monitored the driver’s vital signals for seven driving situations, depending on the driver’s movement. We quantified the driver’s movement and used it to set a signal compensation index. In the results, respiration rates estimated from the driver’s respiration signal, which was compensated by the proposed method and that without compensation, were compared with the actual driver respiration rate, in contrast to the conventional vital signal monitoring method.
2. Methods
2.1. FMCW Radar
Radar is a detection device that transmits electromagnetic waves and modulates the received signal reflected from the target. Radars are divided into several types according to the modulation method of the transmitted and received signals. This study considers FMCW radar using component modulation in terms of frequency. The FMCW radar transmits a chirp signal with a linearly increasing frequency. The difference in frequency between the transmitted and received signals is defined as an intermediate frequency (IF). After mixing the transmitted and received signals of the FMCW radar, a low-band filtering process is performed to extract the IF signal [
19].
is the linear frequency increase in the chirp signal defined by
,
is the bandwidth of the FMCW radar,
is the chirp duration,
is the time delay between the transmitted and received signal,
is the carrier frequency, and
is the magnitude of the radar signal. Moreover, the transmitted and received signals are processed within microseconds. Therefore, because
, (1) is approximated as (2).
The FMCW radar estimates the distance to the target using the frequency and phase of the IF signal. If the distance between the radar and object changes, the time delay between the transmitted and received signals is converted into the phase component
by the change in target position, where
is
. The IF signal is remodeled as (3);
is the phase of the current signal.
is the sampling index of the chirp, and
is the distance from the target. Fast Fourier transform processing was performed to extract the frequency and phase components of the IF signal.
is the number of samples in the chirp, and
is the range resolution index of the radar. Vital signals, such as respiration or heartbeat, are detected using the phase variation of the intermediate signal over time.
where
is the target range in which an object is assumed to exist.
2.2. Vital Signal Detection
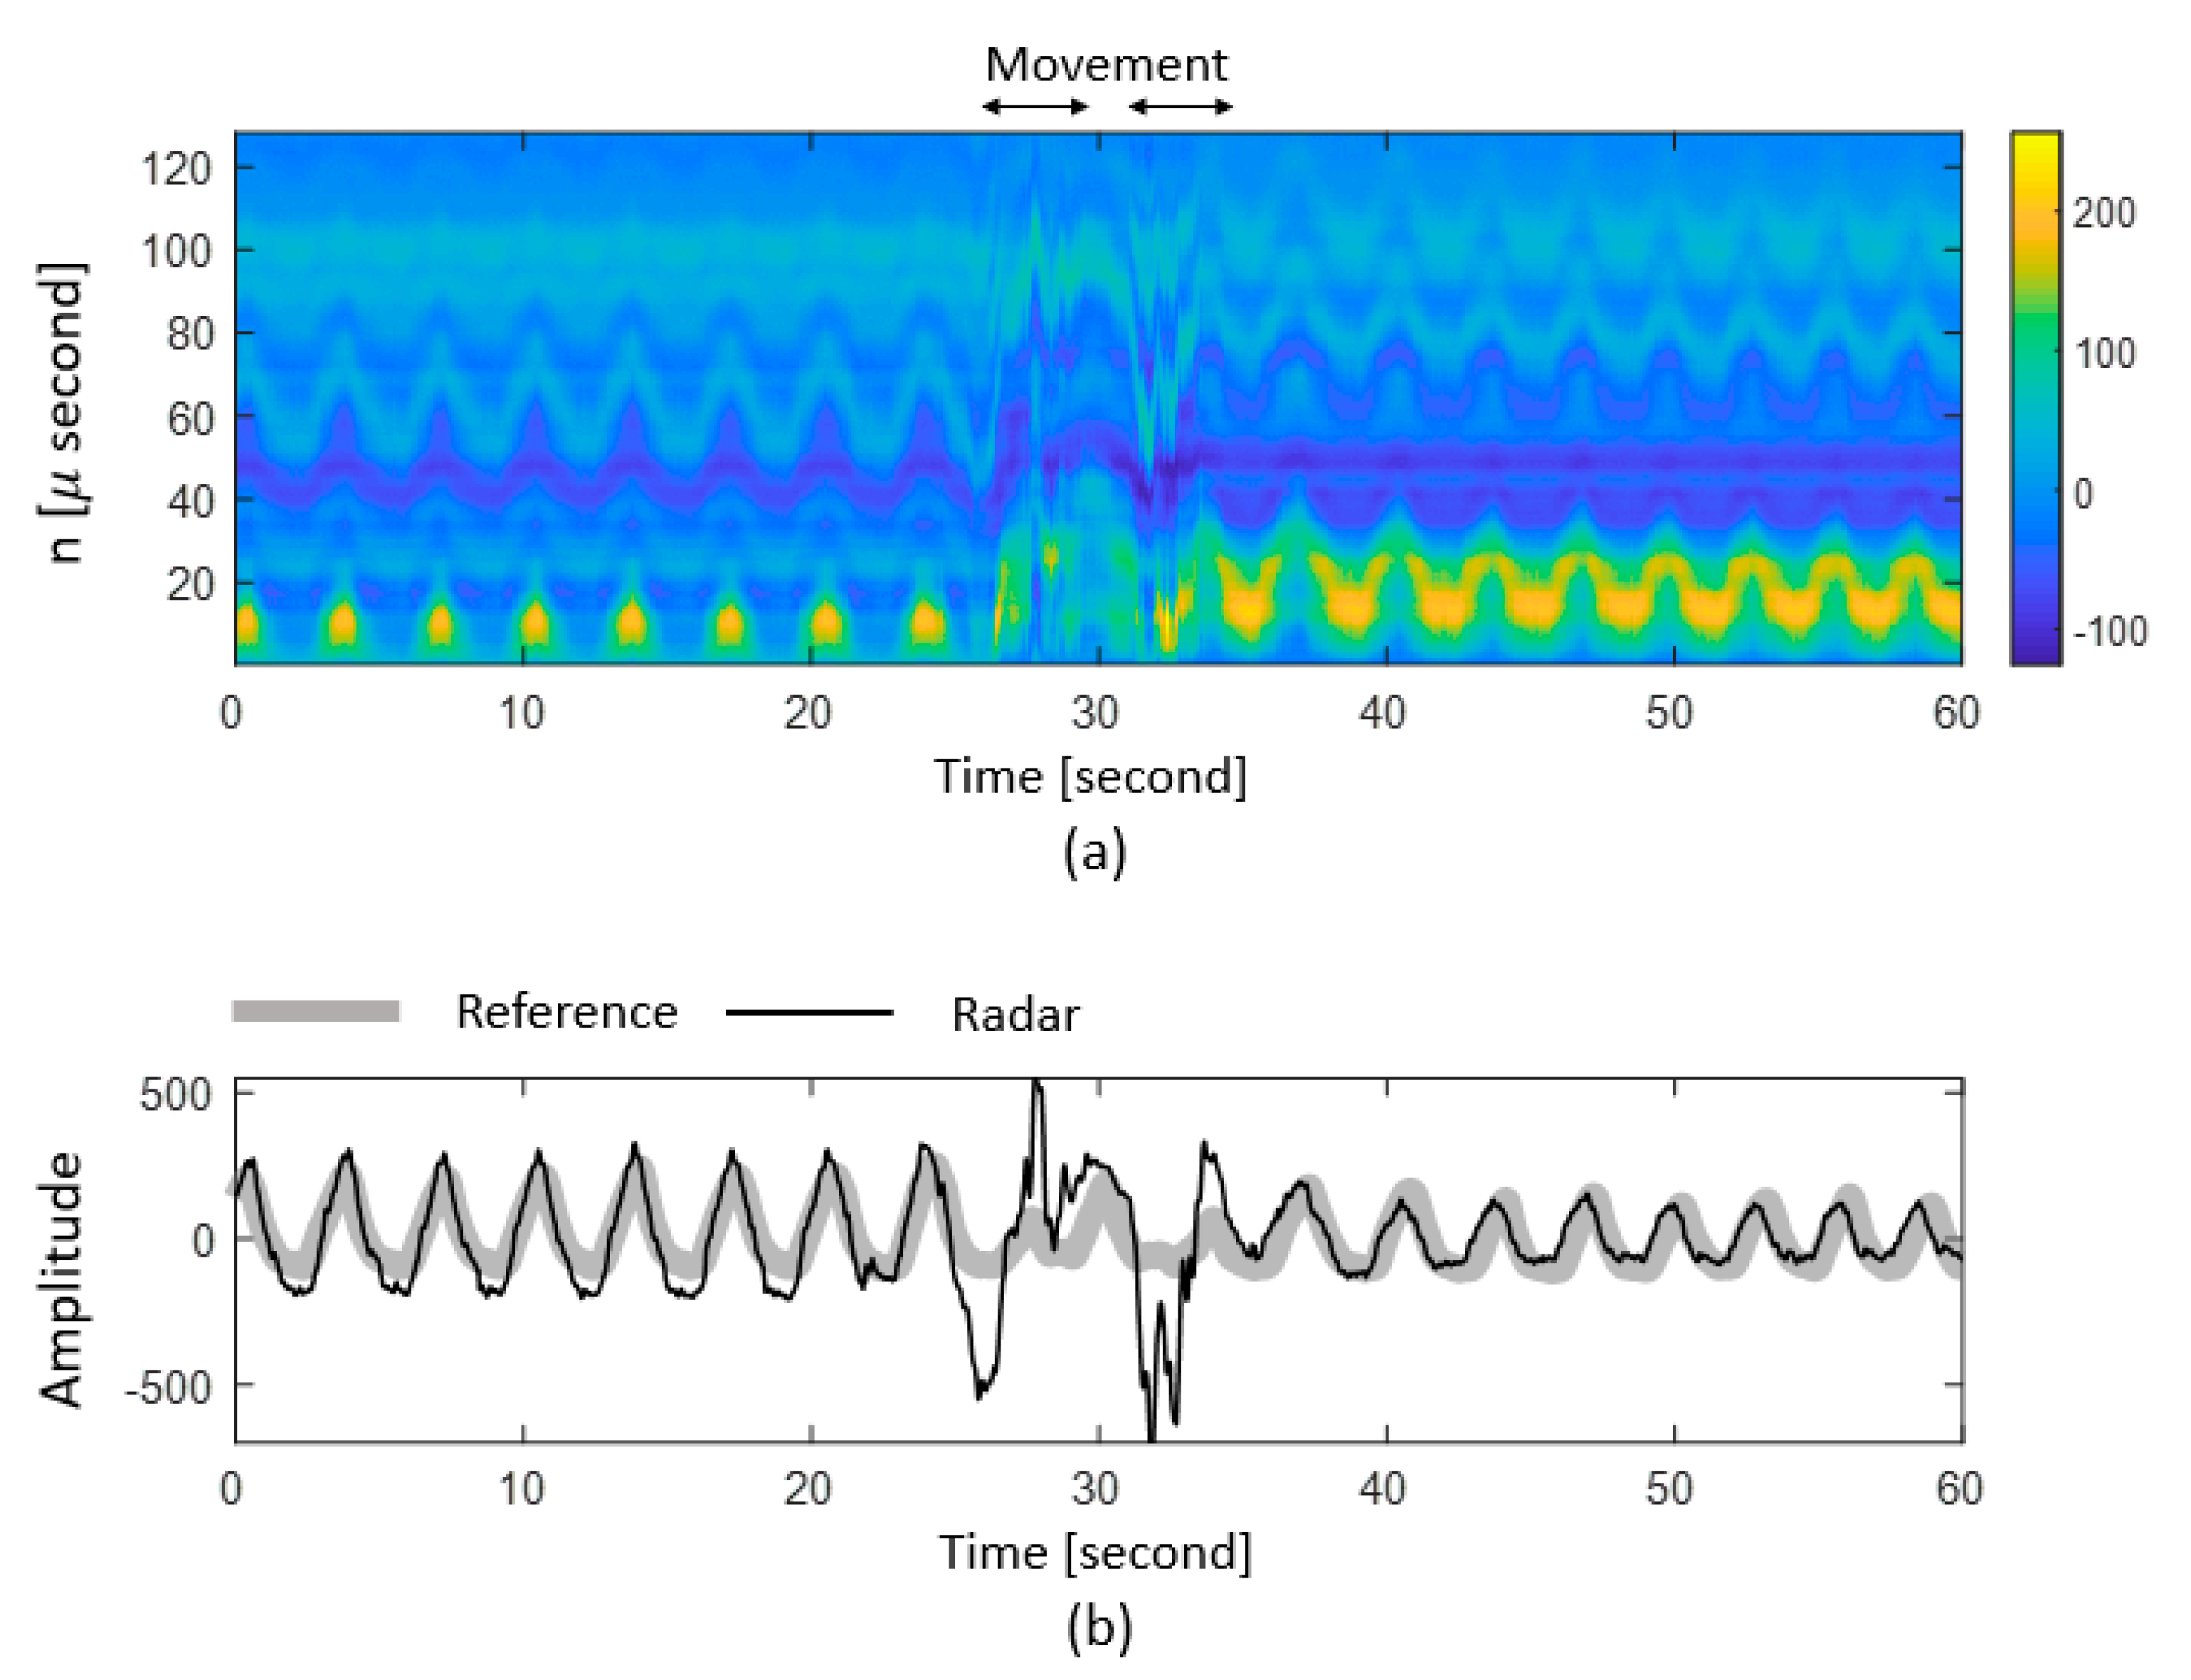
Figure 1 shows an example of a driver’s respiration signal measured by the FMCW radar.
Figure 1a is an image of the driver’s IF signal, and the color bar shows the amplitude of the IF signal. Time is the scan time, n is the sampling time in a chirp. The section where the driver movement occurred is indicated at the top of the figure. The difference in the displacement of the signal caused by the driver’s breathing forms a wave pattern, which indicates respiration. Irregular distortion of the respiration signal occurs in the movement section. However, in the other sections, we can see that the driver’s respiration signal is regular. For comparison with the reference respiration, a respiration signal extracted from the radar is derived using the phase component of the signal obtained after fast Fourier transform processing of the IF signal. Phase component was derived from the radar signal of a specific range bin. The specific range refers to the distance between the radar and the driver and was extracted using the magnitude-phase coherency (MPC) [
20]. The reference respiration signal was acquired by a pressure sensor worn on the abdomen.
Figure 1b shows a comparison between the respiration derived from the IF signal and that from the reference sensor.
Figure 1b demonstrates that if movement occurs, the radar signal is distorted compared to the reference respiration. Thus, to accurately detect the driver’s breathing, it is necessary to compensate for the respiration signal in situations where the driver is not stationary.
2.3. Movement Quantification
In this study, we assumed that the respiration signal in the movement section was a distorted signal. To compensate for the radar signal irregularly distorted by motion [
21], we defined the difference in the signal magnitude as a motion index
.
is derived by averaging the difference in magnitude from the signal immediately preceding in time for the specific range [
22].
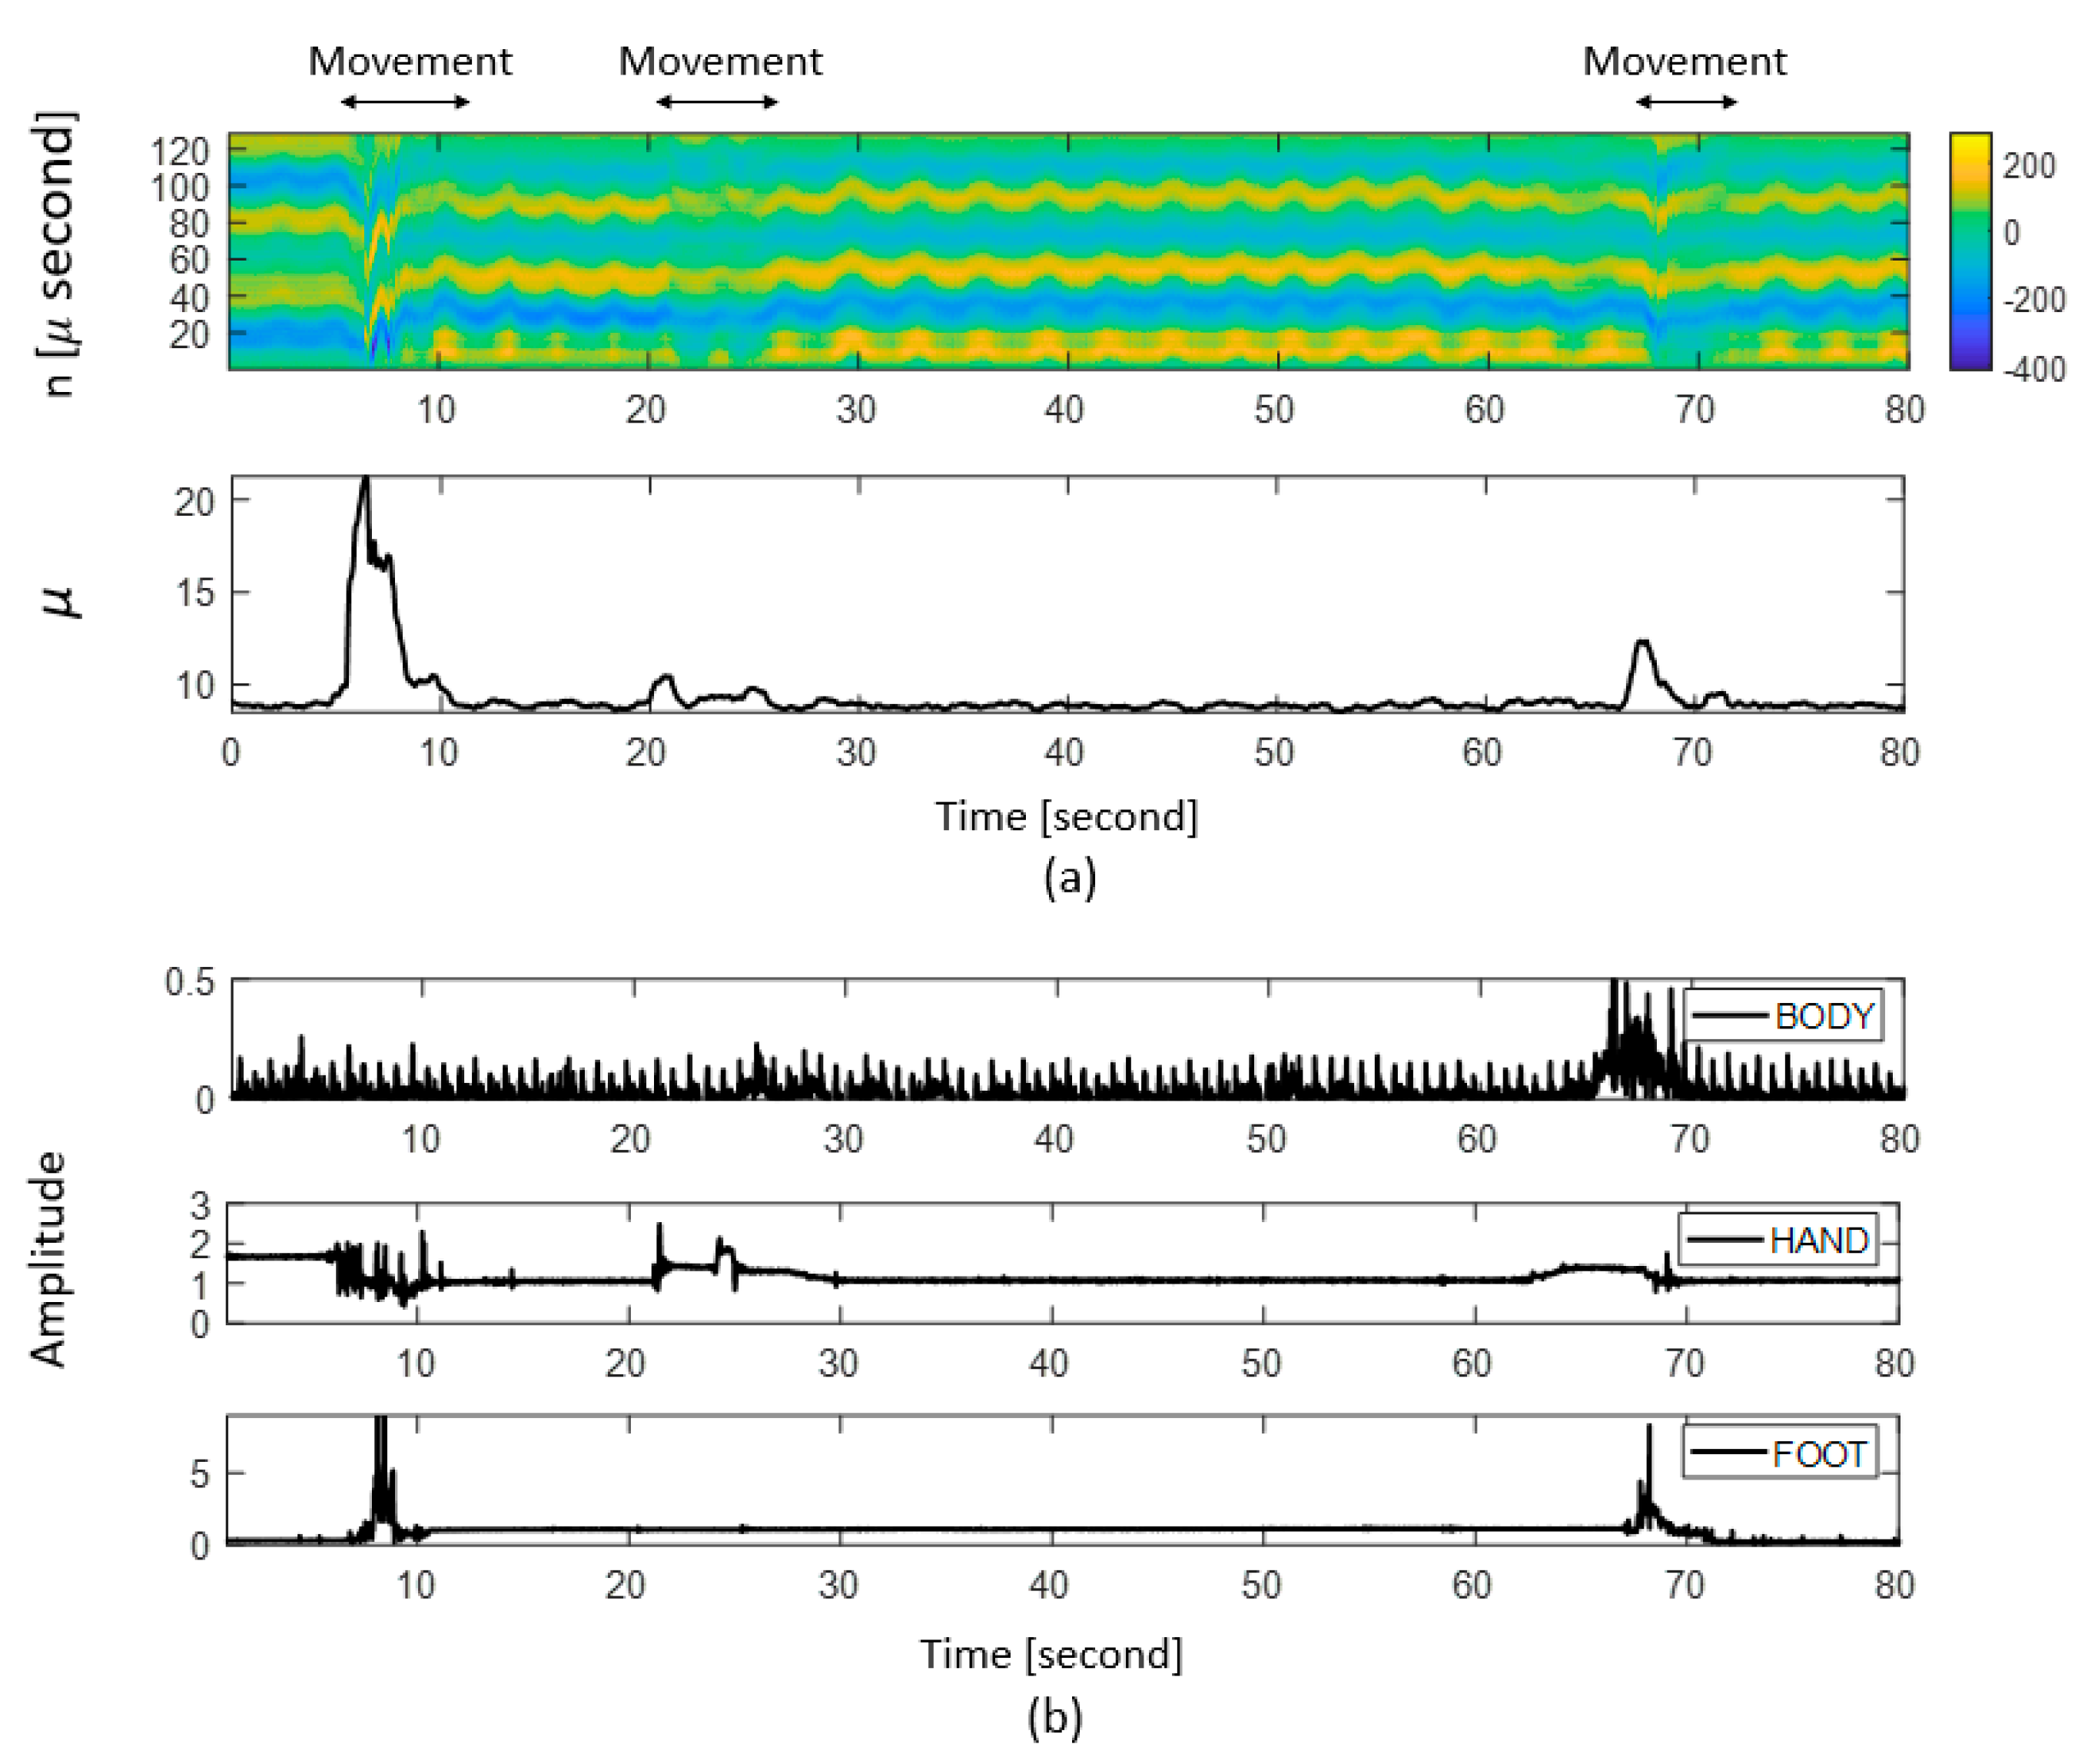
Figure 2 depicts the accuracy of the motion index for driver motion detection. To ensure that
detects the driver’s movement accurately, we compared it with the actual movement of the driver, which was detected by an acceleration sensor.
Figure 2a shows the driver’s respiration signal and the driver’s motion index value derived from the driving situation where there is movement. The radar signal was measured by installing a radar inside the driver’s car seat. For the reliability of the proposed motion index,
Figure 2b shows the driver’s body acceleration value measured by the acceleration sensors, which were worn on the driver’s chest, right wrist, and foot. From the variability of the measured acceleration values, it is possible to check the section in which the driver moves within the measurement time. In the section where driver movement occurred, as shown at the top of
Figure 2a, irregular distortion of the driver’s respiration signal occurred. Not only the driver’s chest, which is the transmission direction of the radar signal but also the movement of the arms and legs can cause a fine displacement difference in the driver’s body, resulting in distortion of the signal. Therefore, compared with
Figure 2b, it can be seen that distortion of the respiration signal is caused not only by the driver’s body but also by the movement of the arms and legs necessary for driving. We confirmed that the motion quantification index reflects the driver’s movement by matching the section where the driver’s movement occurs with the fluctuation of the motion quantification index.
2.4. Distortion Compensation
We introduce a method of compensating a distorted signal using a motion quantification index to detect respiration more accurately than the conventional detection method in a movement situation.
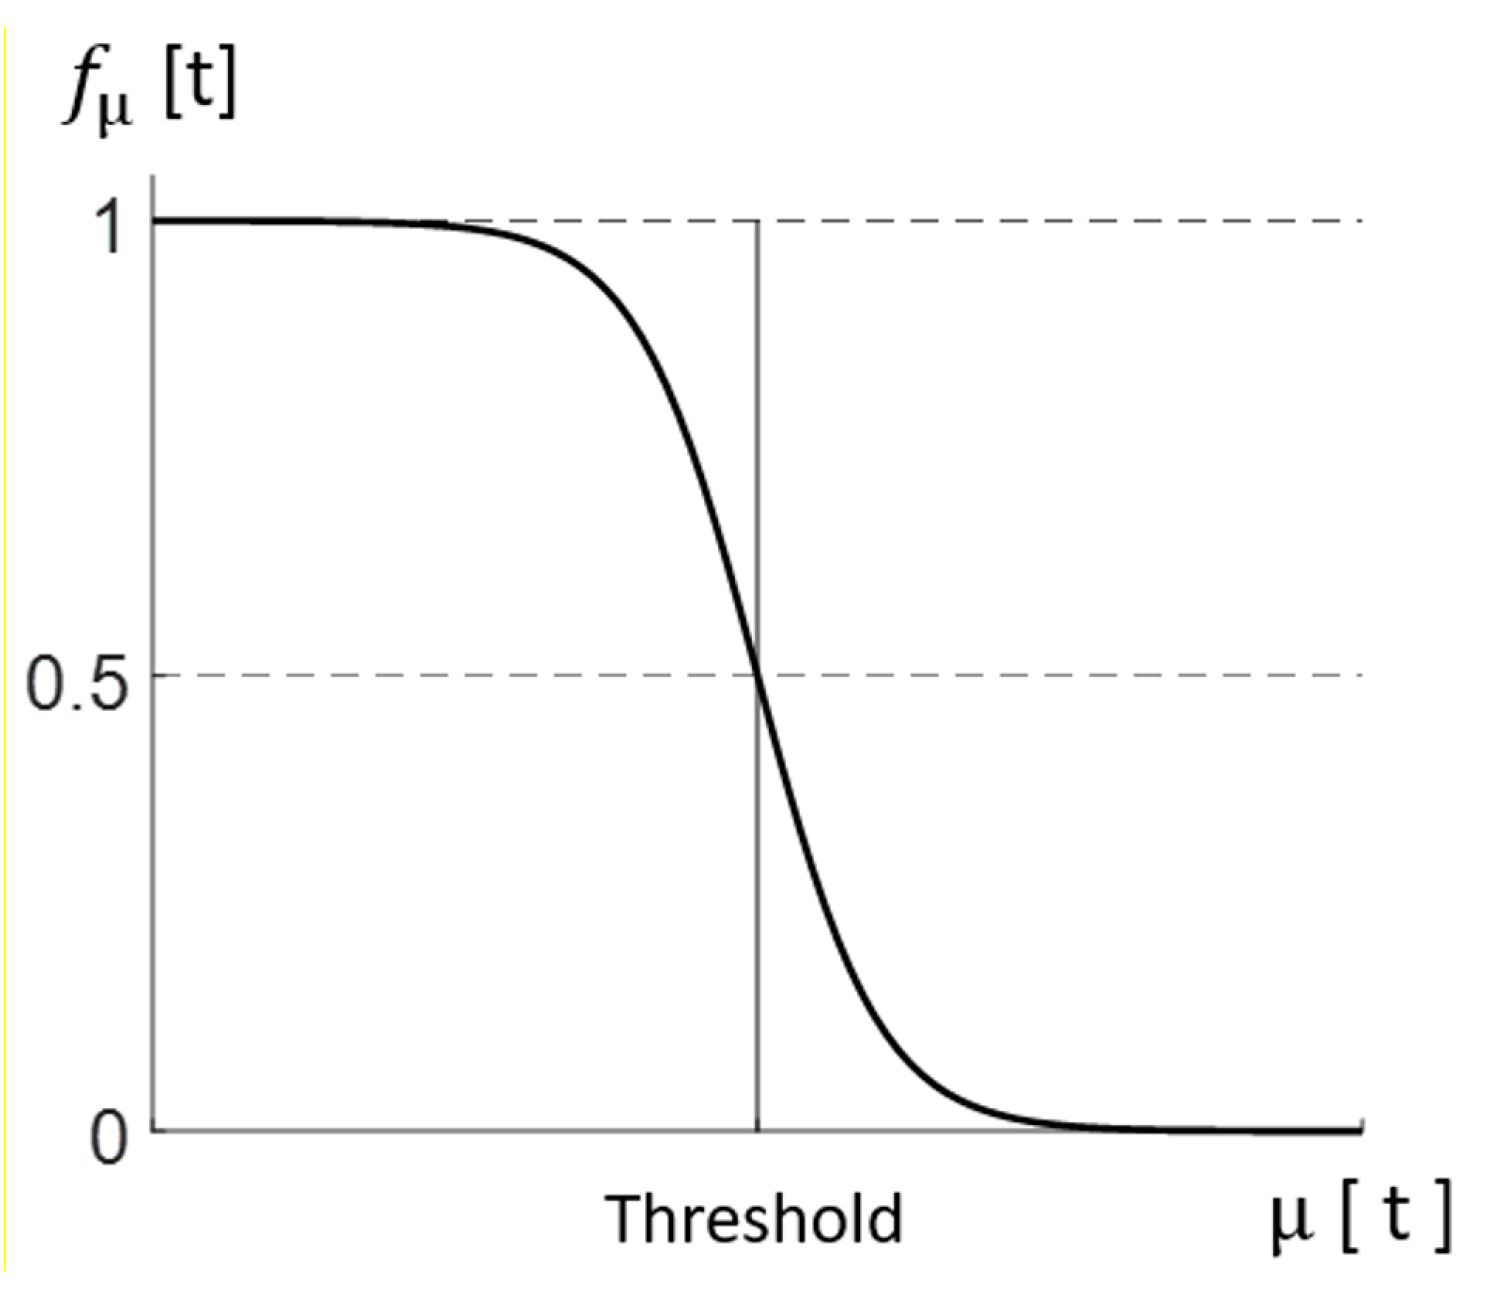
Figure 3 shows the distortion signal compensation index that sets the signal compensation interval.
converges to 0 when the driver’s movement quantification index increases above the threshold and to 1 when it decreases [
23]. The threshold value is set as the average of the movement quantification index during the entire measurement time.
is expressed by using (7). The signal compensation sector was set according to the degree of motion, quantified from the motion index.
We devise the compensation of signal distortion as (8) using
.
is the phase of the fast Fourier transform processed IF signal. If decreases below the threshold, converges to 1, reflecting the phase value of the current signal as the final phase. Conversely, if increases beyond the threshold, converges to 0, reflecting the immediately preceding value of the final compensated phase to the current phase.
We applied (8) to the driver’s respiration signal to check the effectiveness of compensating the distorted signal in the movement section. To compensate for the distortion in a radar signal, we compared the difference in the signal magnitude with time shift. The shift time is set to 1 s.
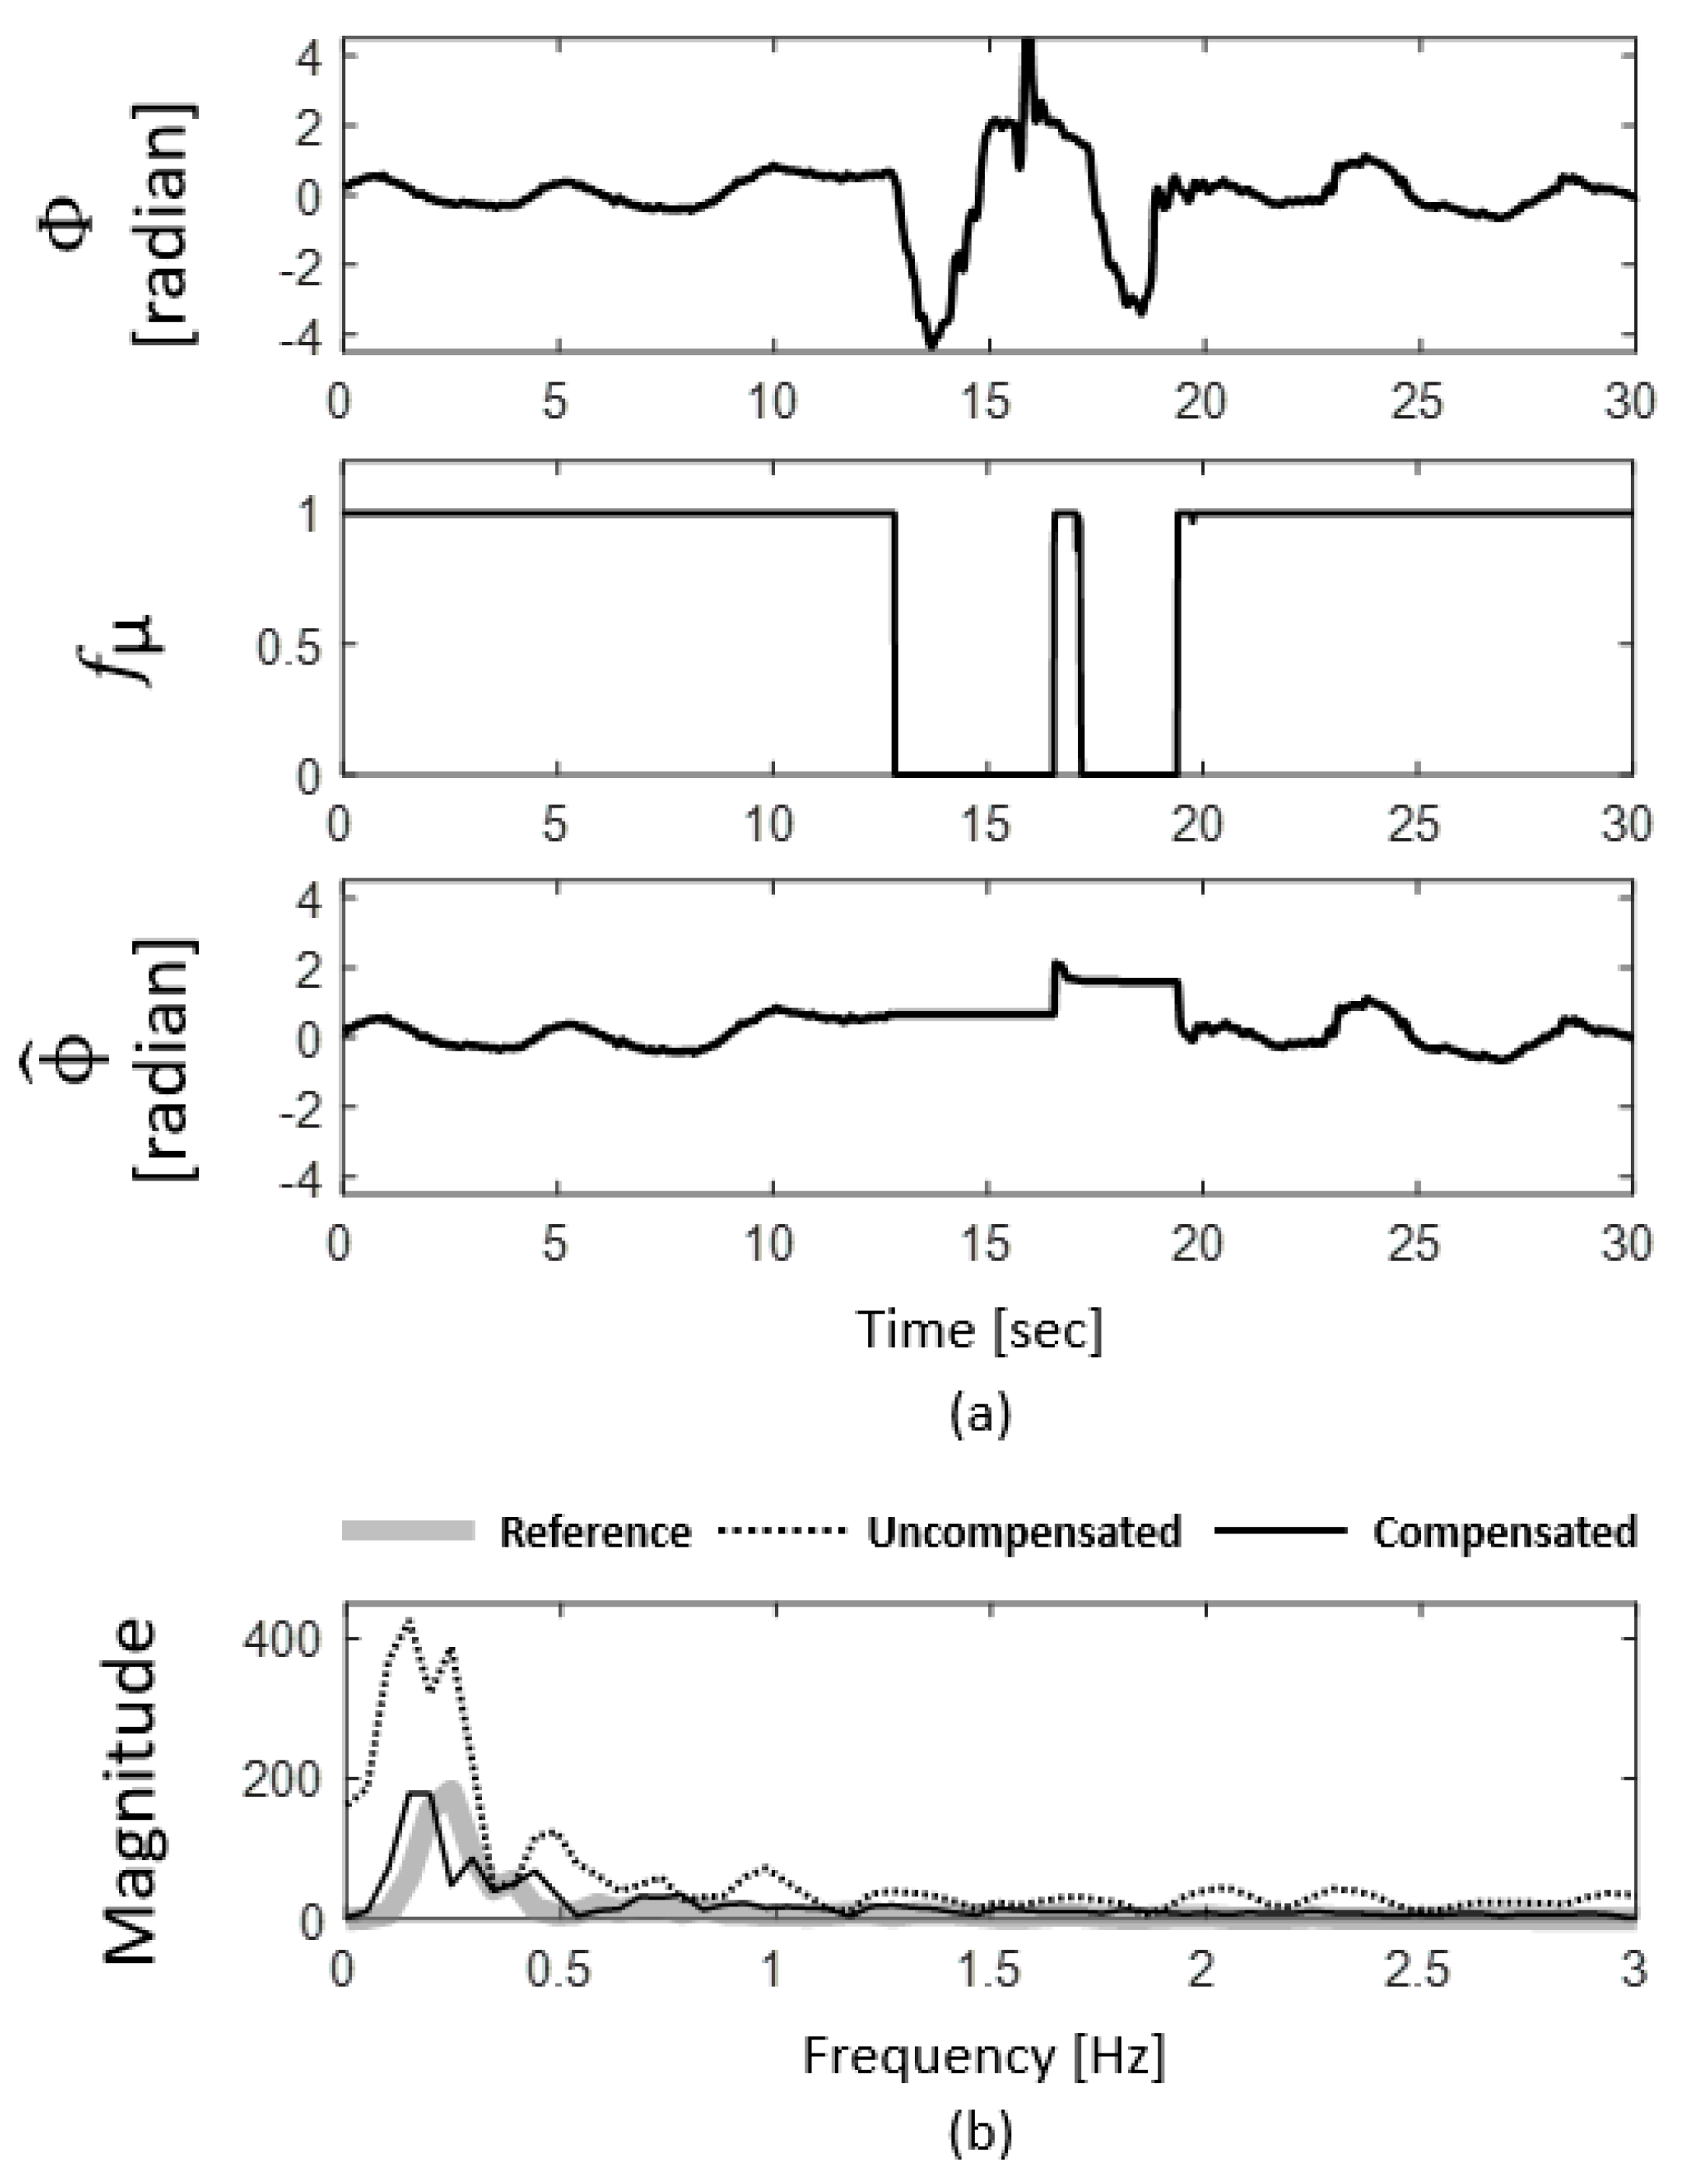
Figure 4 shows the driver signal compensation process distorted by movement and the corresponding variation in the frequency components. The result of the compensated signal due to the driver’s movement using the proposed method is shown in
Figure 4a. By the movement,
converges to 0, and the phase component at this time is compensated through (8); thus, it can be confirmed that the driver respiration signal is consequentially compensated.
Figure 4b shows the frequency component at one point in time when the driver is not in a dynamic state to confirm the accuracy of the signal compensation. The frequency extracted from the calibrated driver’s respiration signal matches that of the actual respiration signal compared with the frequency of the uncompensated signal. Therefore,
Figure 4b ensures that the distorted driver respiration signal is compensated by the movement through frequency component comparison.
2.5. Respiration Rate Estimation
We calculated the driver’s respiration rate per minute from the signal compensated using a previously suggested method (8).
Figure 5 shows the estimation results of the respiration rate according to the compensation. The respiration rate was estimated by peak tracking [
24] using the frequency component of the driver’s vital signals.
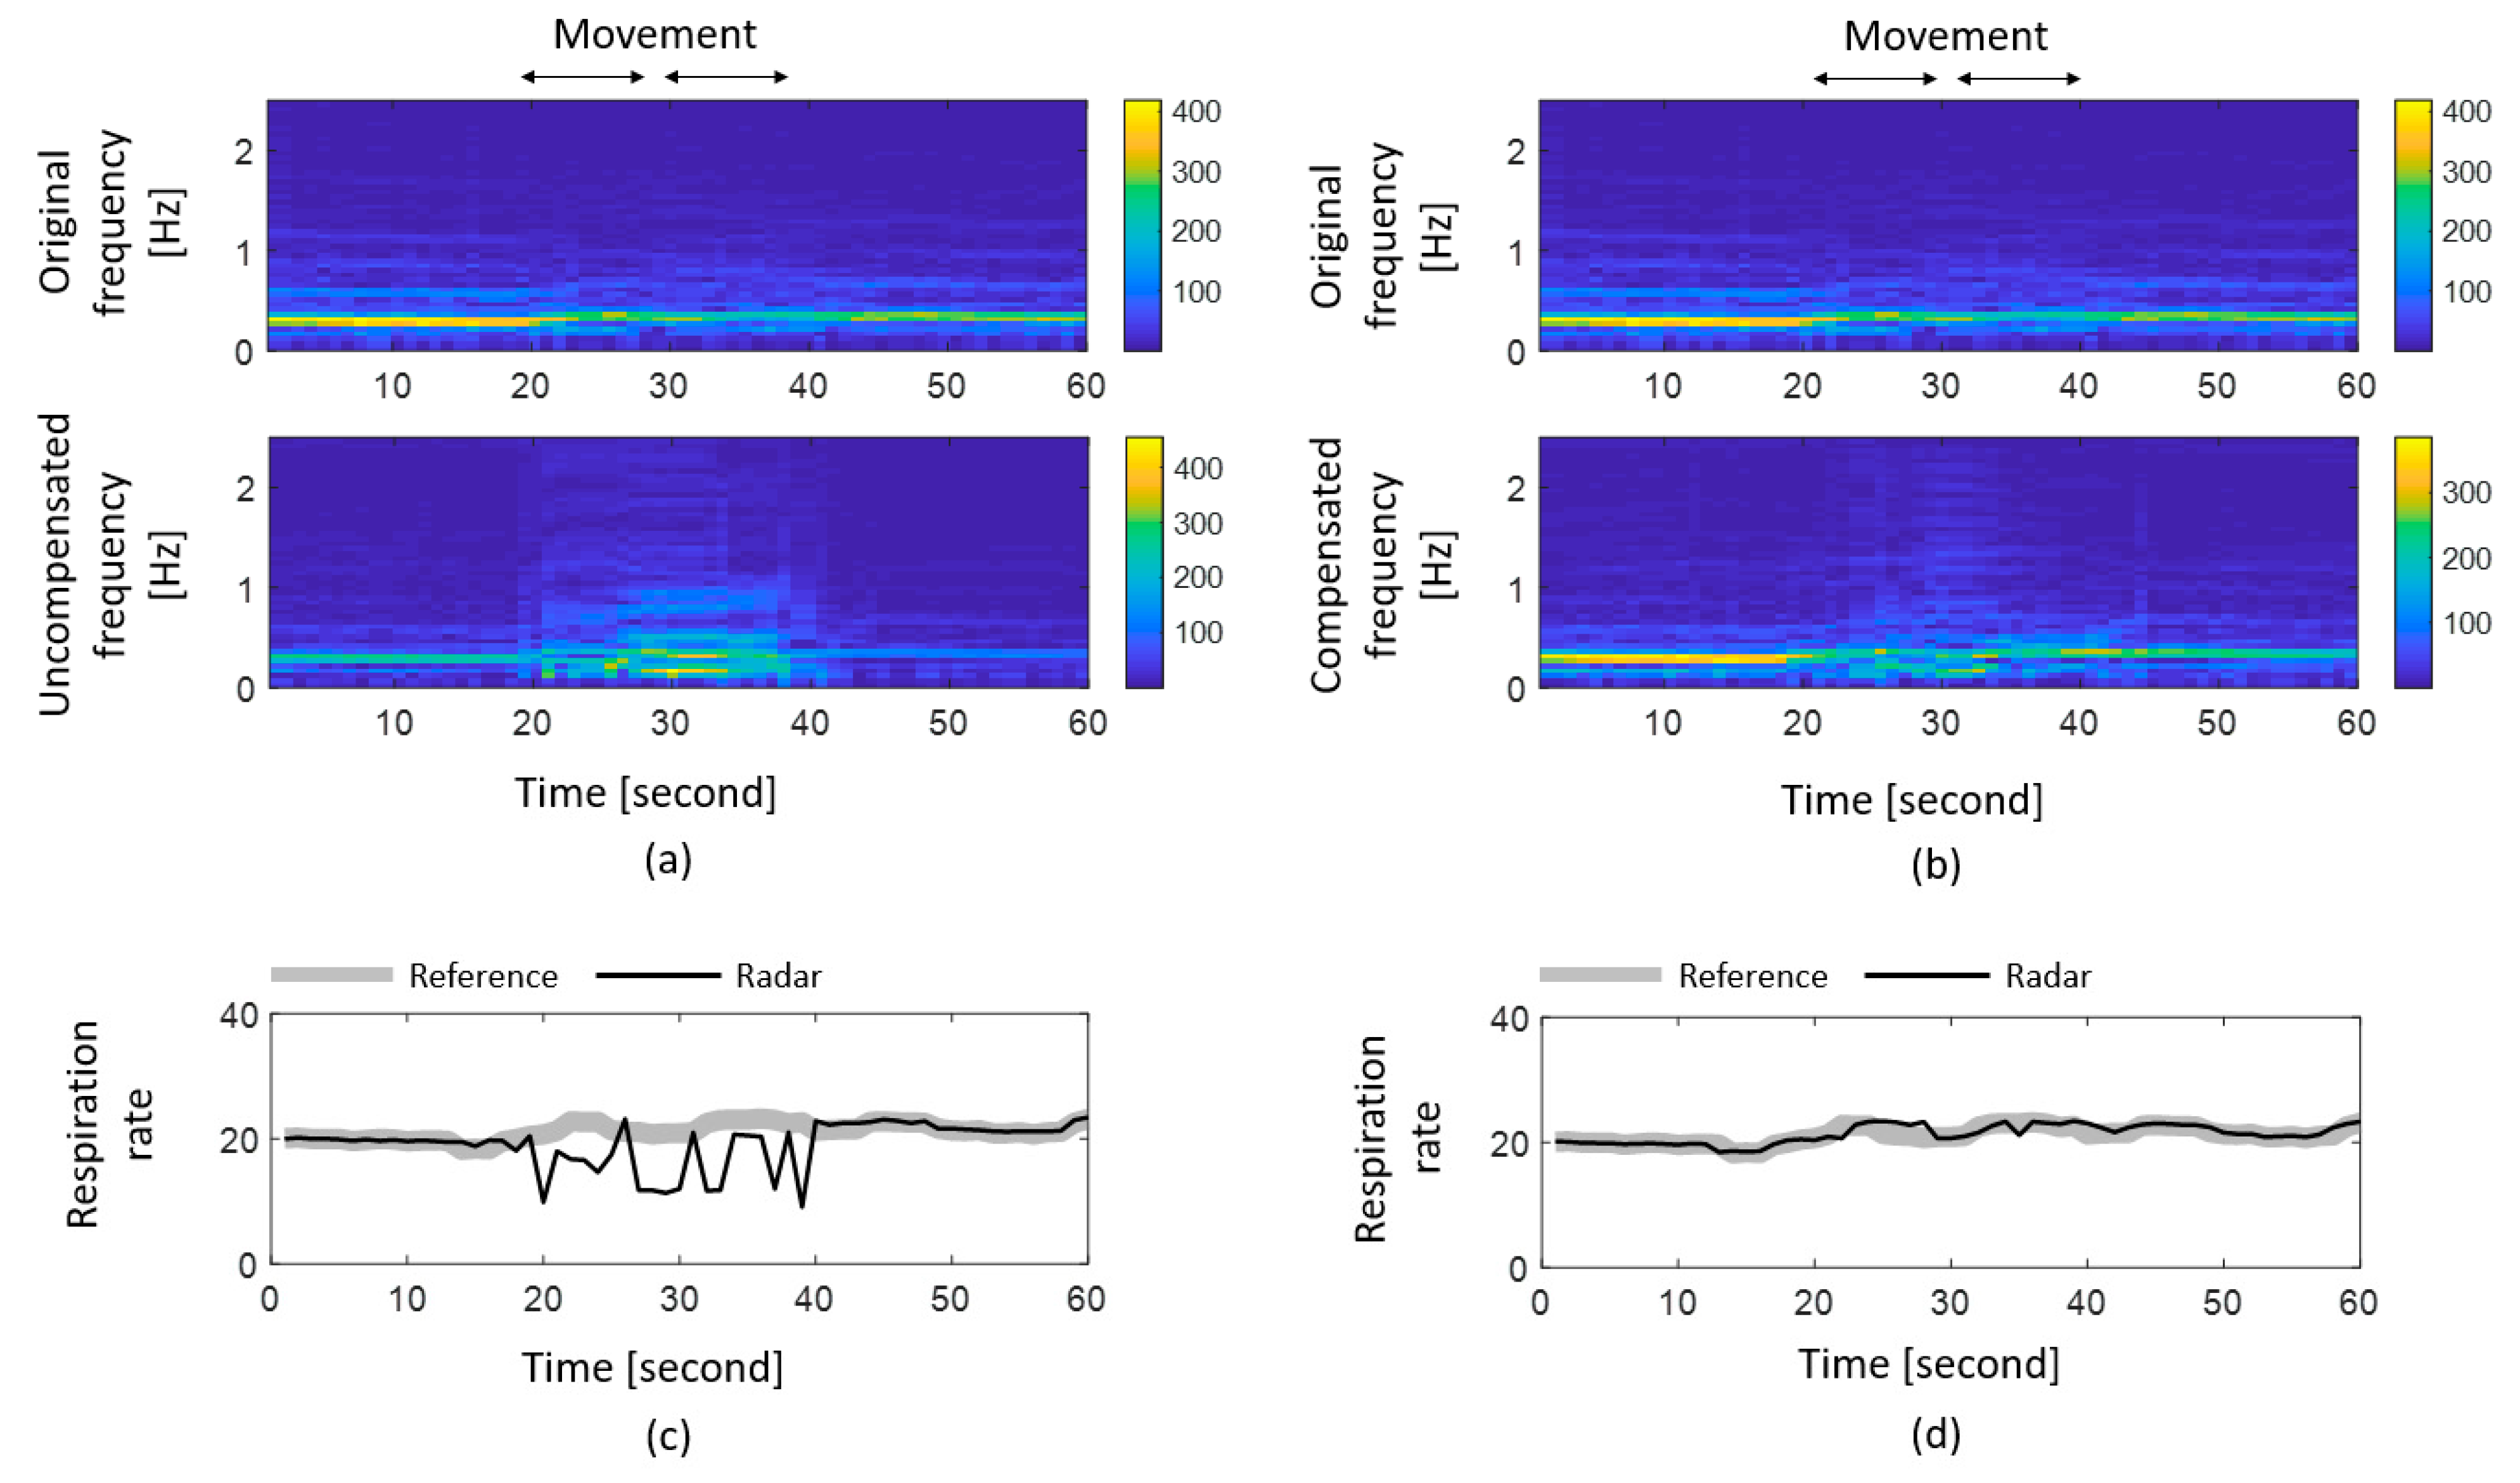
Figure 5a shows the frequencies of the original and distorted respiration signals. The estimated respiratory rate, including the movement situation, is inaccurate compared to the reference respiration rate, as shown in
Figure 5c. Contrary to the previous results,
Figure 5b represents the frequency of the respiratory signal compensated by the method proposed in (8). The frequency value of the compensated respiration signal is strongly confirmed at 0.35 to 0.4 Hz and is similar to the original signal.
To verify the accuracy of the signal compensation, the compensated respiration rate using the peak tracking technique was compared with the actual respiration rate. As a result,
Figure 5d shows that the trends of the compensated original respiratory rate coincide.
3. Processing
3.1. Radar Processing
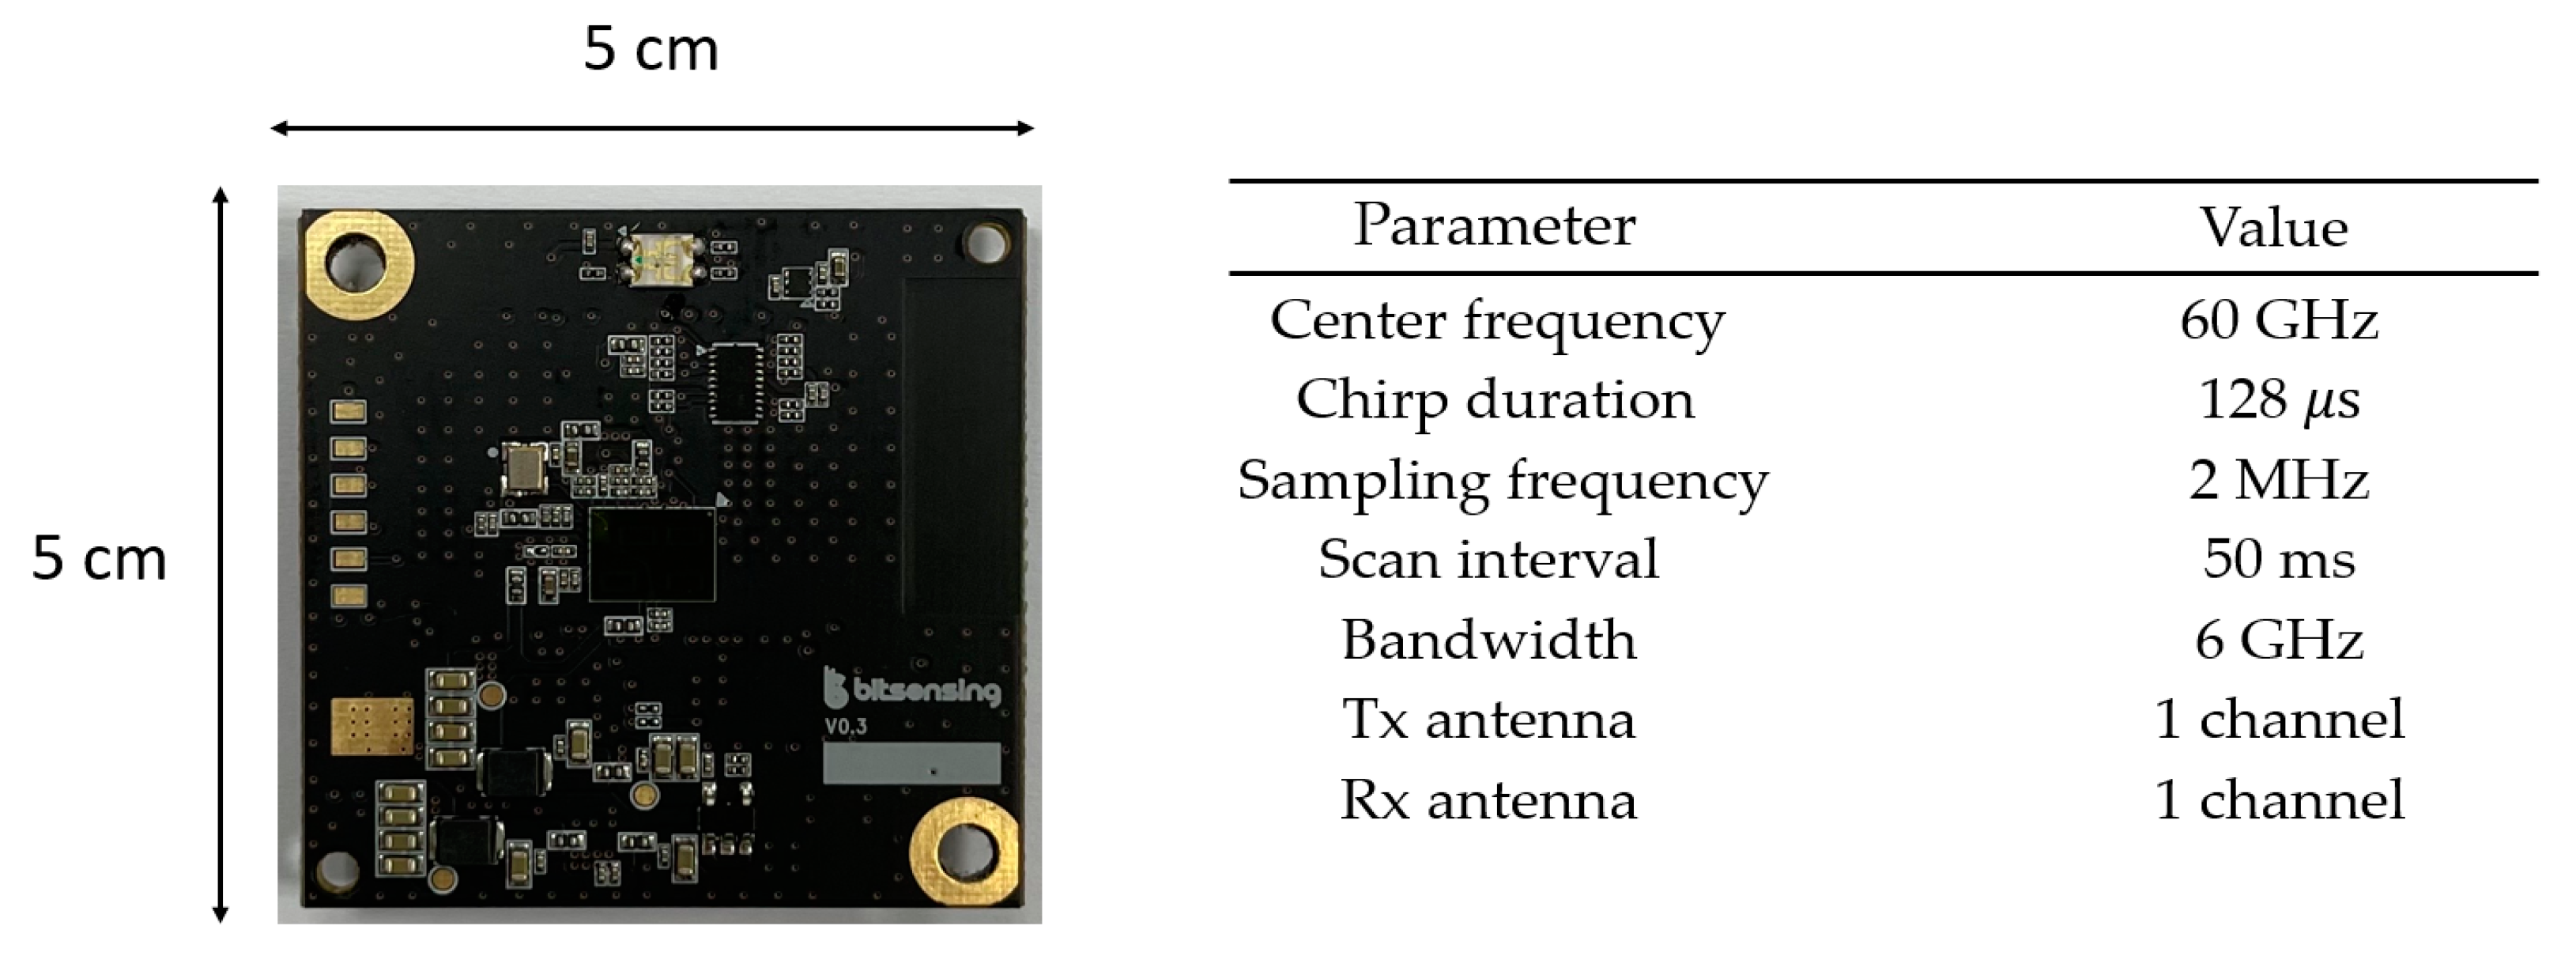
We conducted all the experimental processes and implemented the proposed algorithm using the FMCW radar (Bitsensing INC., Seoul, Korea) [
25] specification in
Figure 6 with its parameters used for recording. The radar with these specifications can detect objects that are in front of it within the range of 0–3.187 m.
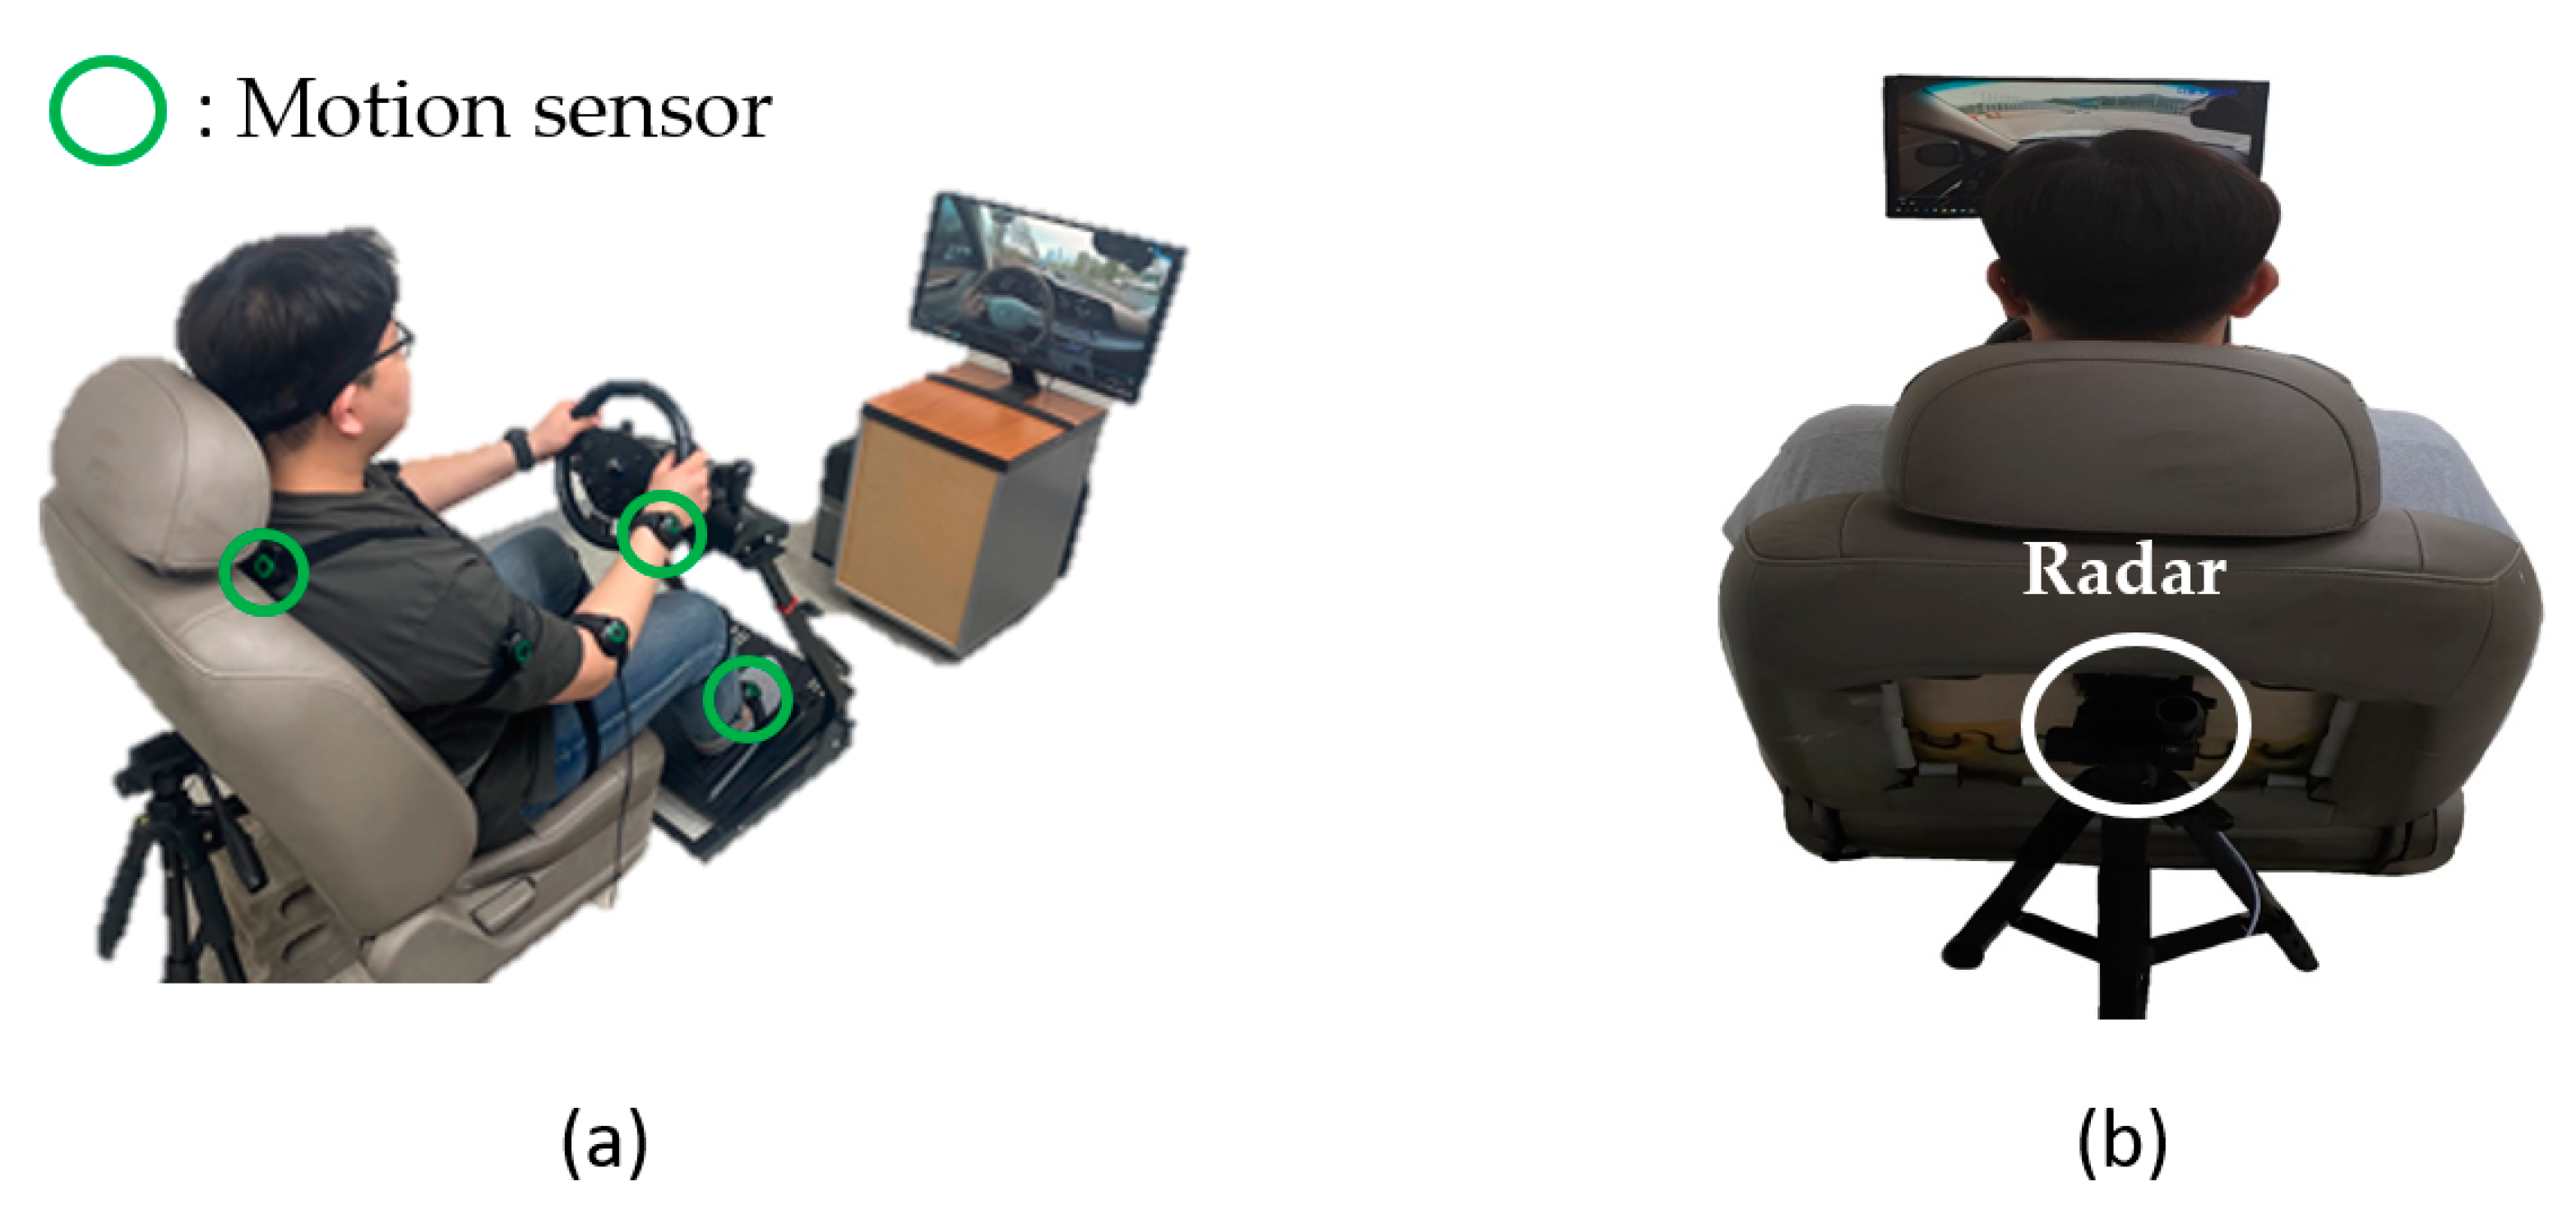
Figure 7 shows the experimental environment for detecting driver vital signals, equipped with an actual vehicle car seat and driving equipment to simulate actual driving conditions. A reference respiration rate for comparison was measured using a Neulog Respiration Monitor Belt logger sensor (Neulog Inc., Rishon-Lezion, Israel).
Figure 7a shows the location of the acceleration sensor attachment. The driver’s movements were measured using Perception Neuron Studio (Noitom Inc., Beijing, China). We used the acceleration values worn on the driver’s chest, right wrist, and foot of the 14 motion sensors attached to the body as circled in
Figure 7a. The radar was placed inside the car seat, facing the center of the chest of the driver shown in
Figure 7b.
3.2. Experimental Processing
We classified the driver’s vital signal measurement process into seven situations according to the driver’s movements in
Table 1. Each experiment consisted of one minute, and it was conducted while watching driving videos for each situation on the front display in
Figure 7a. In addition, all the drivers were well acquainted with each experimental environment.
Because of the experimental characteristics associated with the radar installed inside the vehicle car seat, we limited the object detection range of the radar to 5–27.5 cm. To reduce the signal processing complexity, we selected candidates for the target range from the driver’s respiration signal using MPC. Using peak tracking in the frequency domain, we calculated the respiratory rate from the driver’s reference and estimated respiration signals. To ensure accuracy of the estimated respiration rate from the compensated respiration signal in the motion situation, we compared it with the actual respiration rate, which was obtained using a respiration sensor.
4. Result
4.1. Respiration Rate Estimation Result
We compensated the respiration signal for each driving situation according to the occurrence of movement and examined the accuracy of the estimated respiratory rate from the compensated signal.
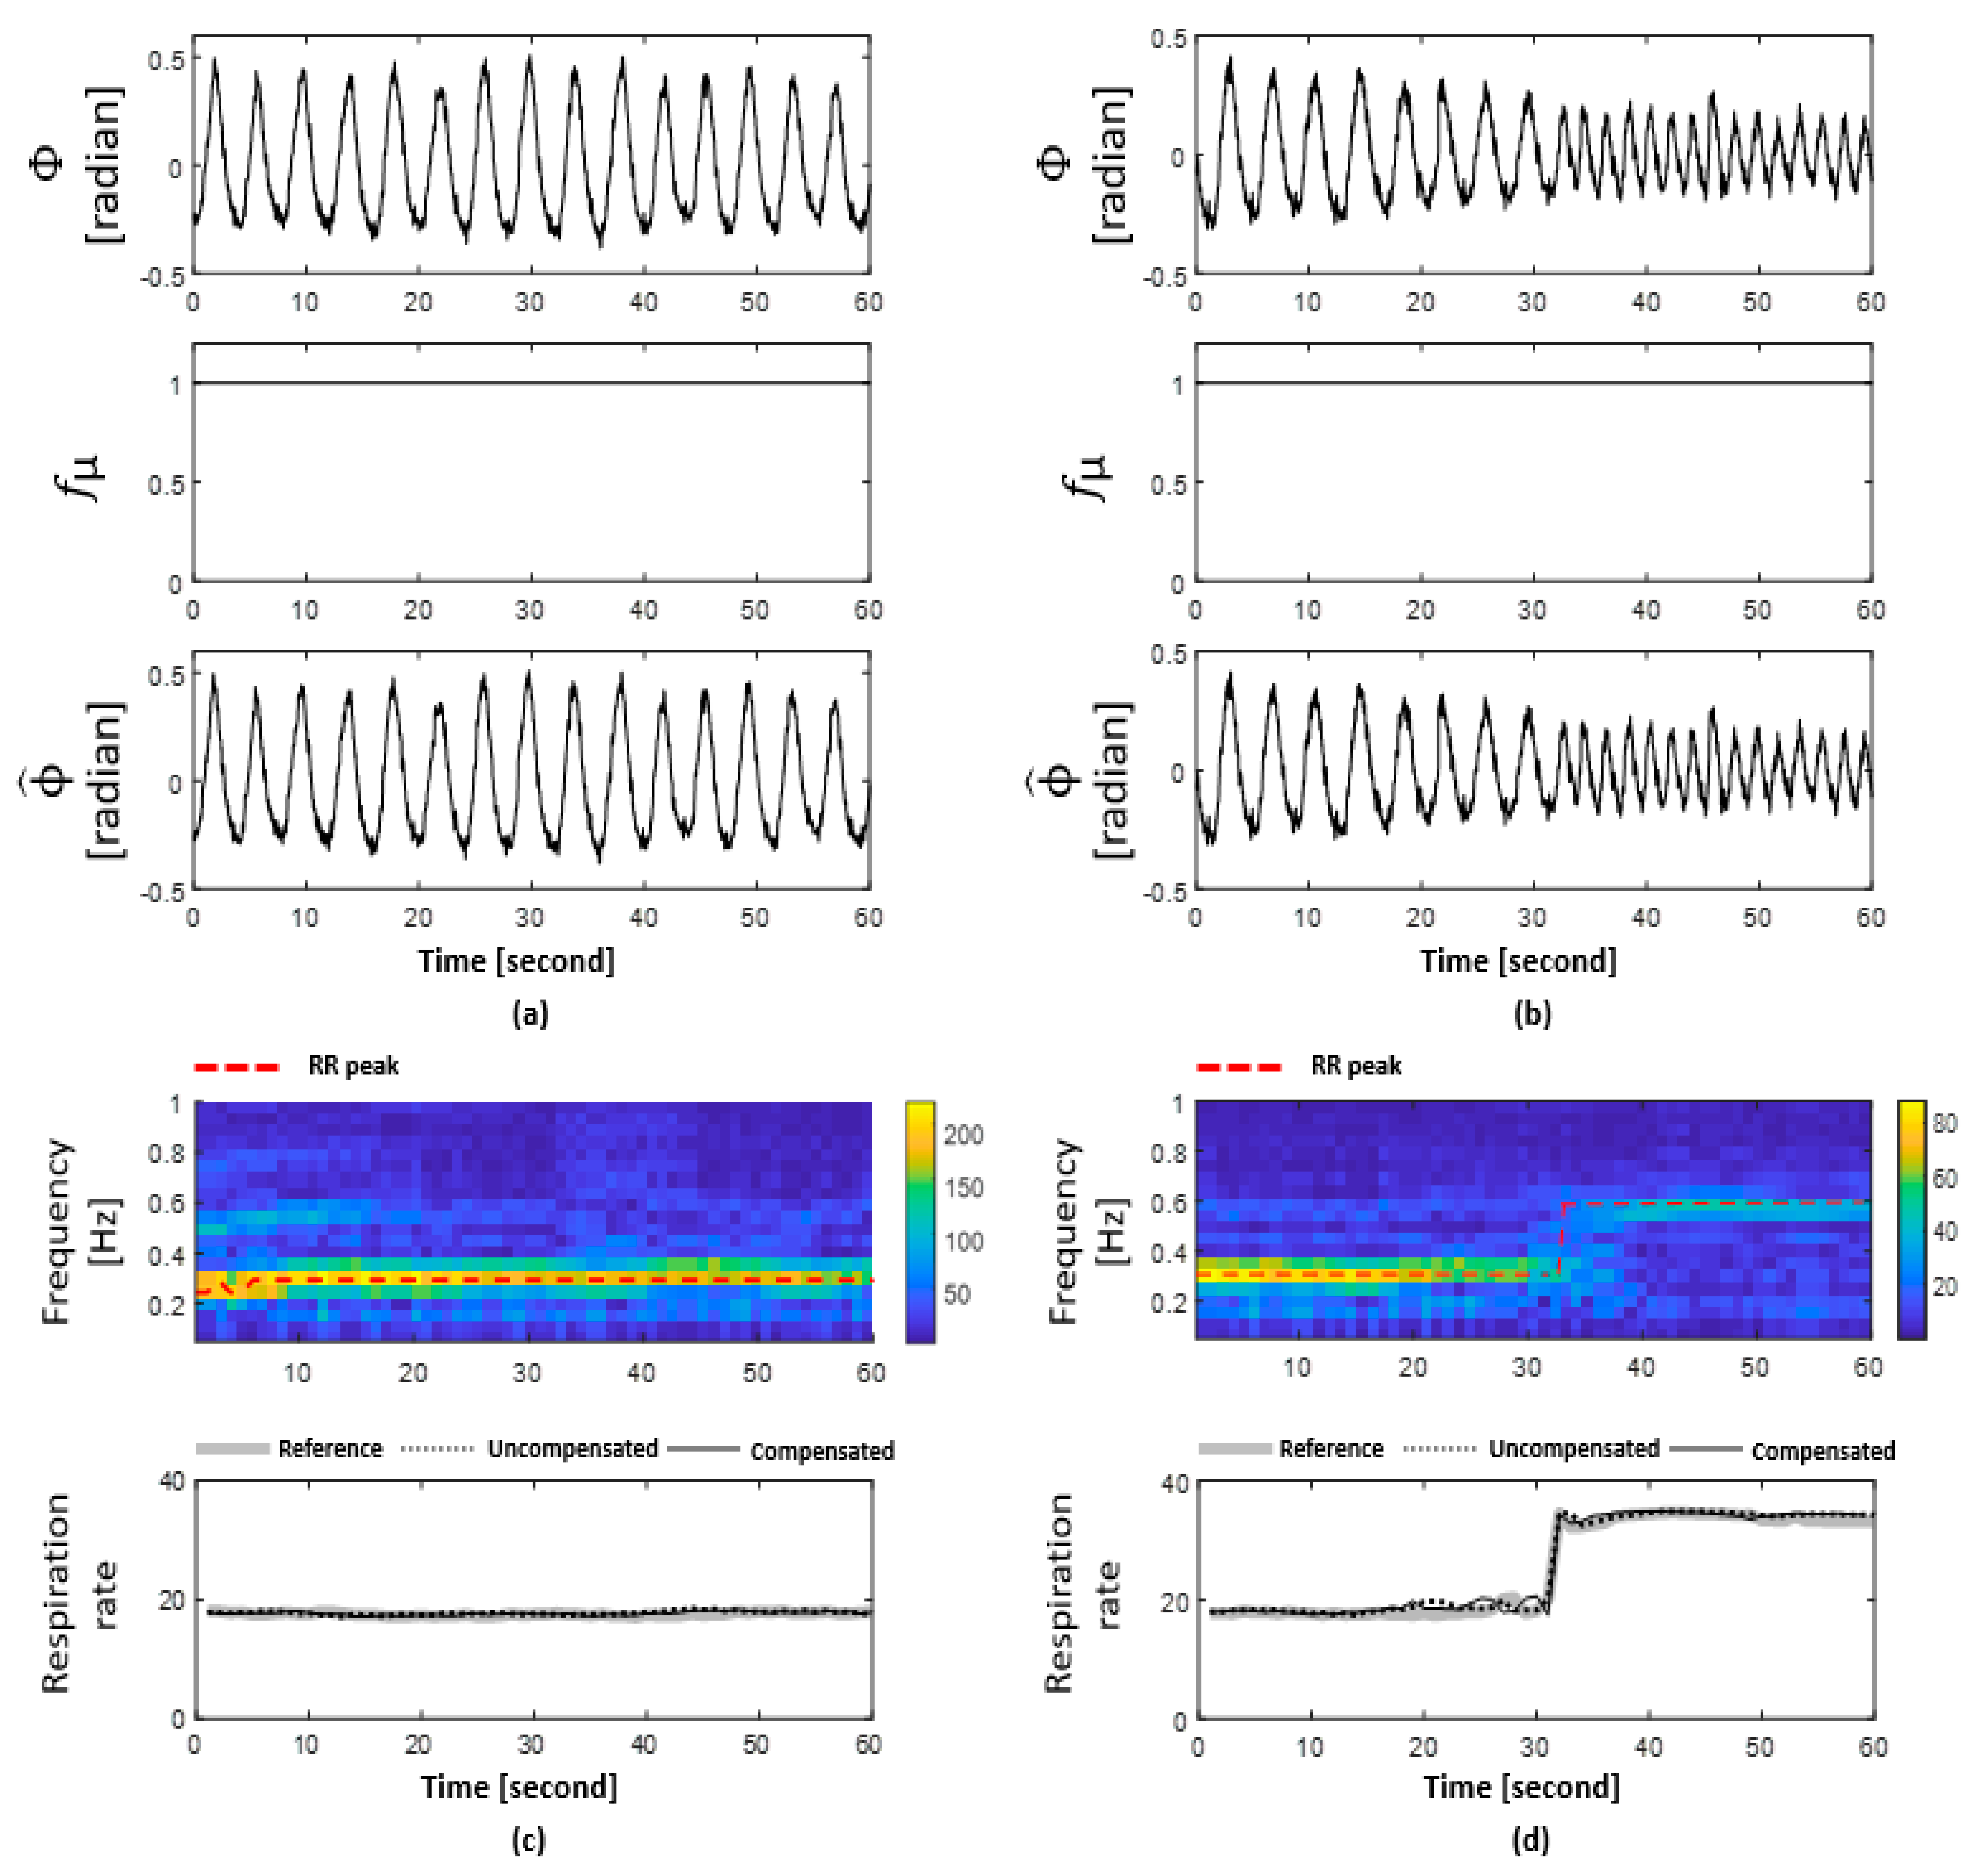
Figure 8 shows the driver’s respiration signal and respiratory rate estimation results for a driving situation in which the driver was motionless.
Figure 8a,b are both for motionless cases, so the respiration signal is regular, and the corresponding signal compensation index value is 1. As shown in
Figure 8c,d, we confirmed that the respiratory rate estimated from the frequency component of the respiration signal using peak tracking in both driving situations matches the reference respiratory rate.
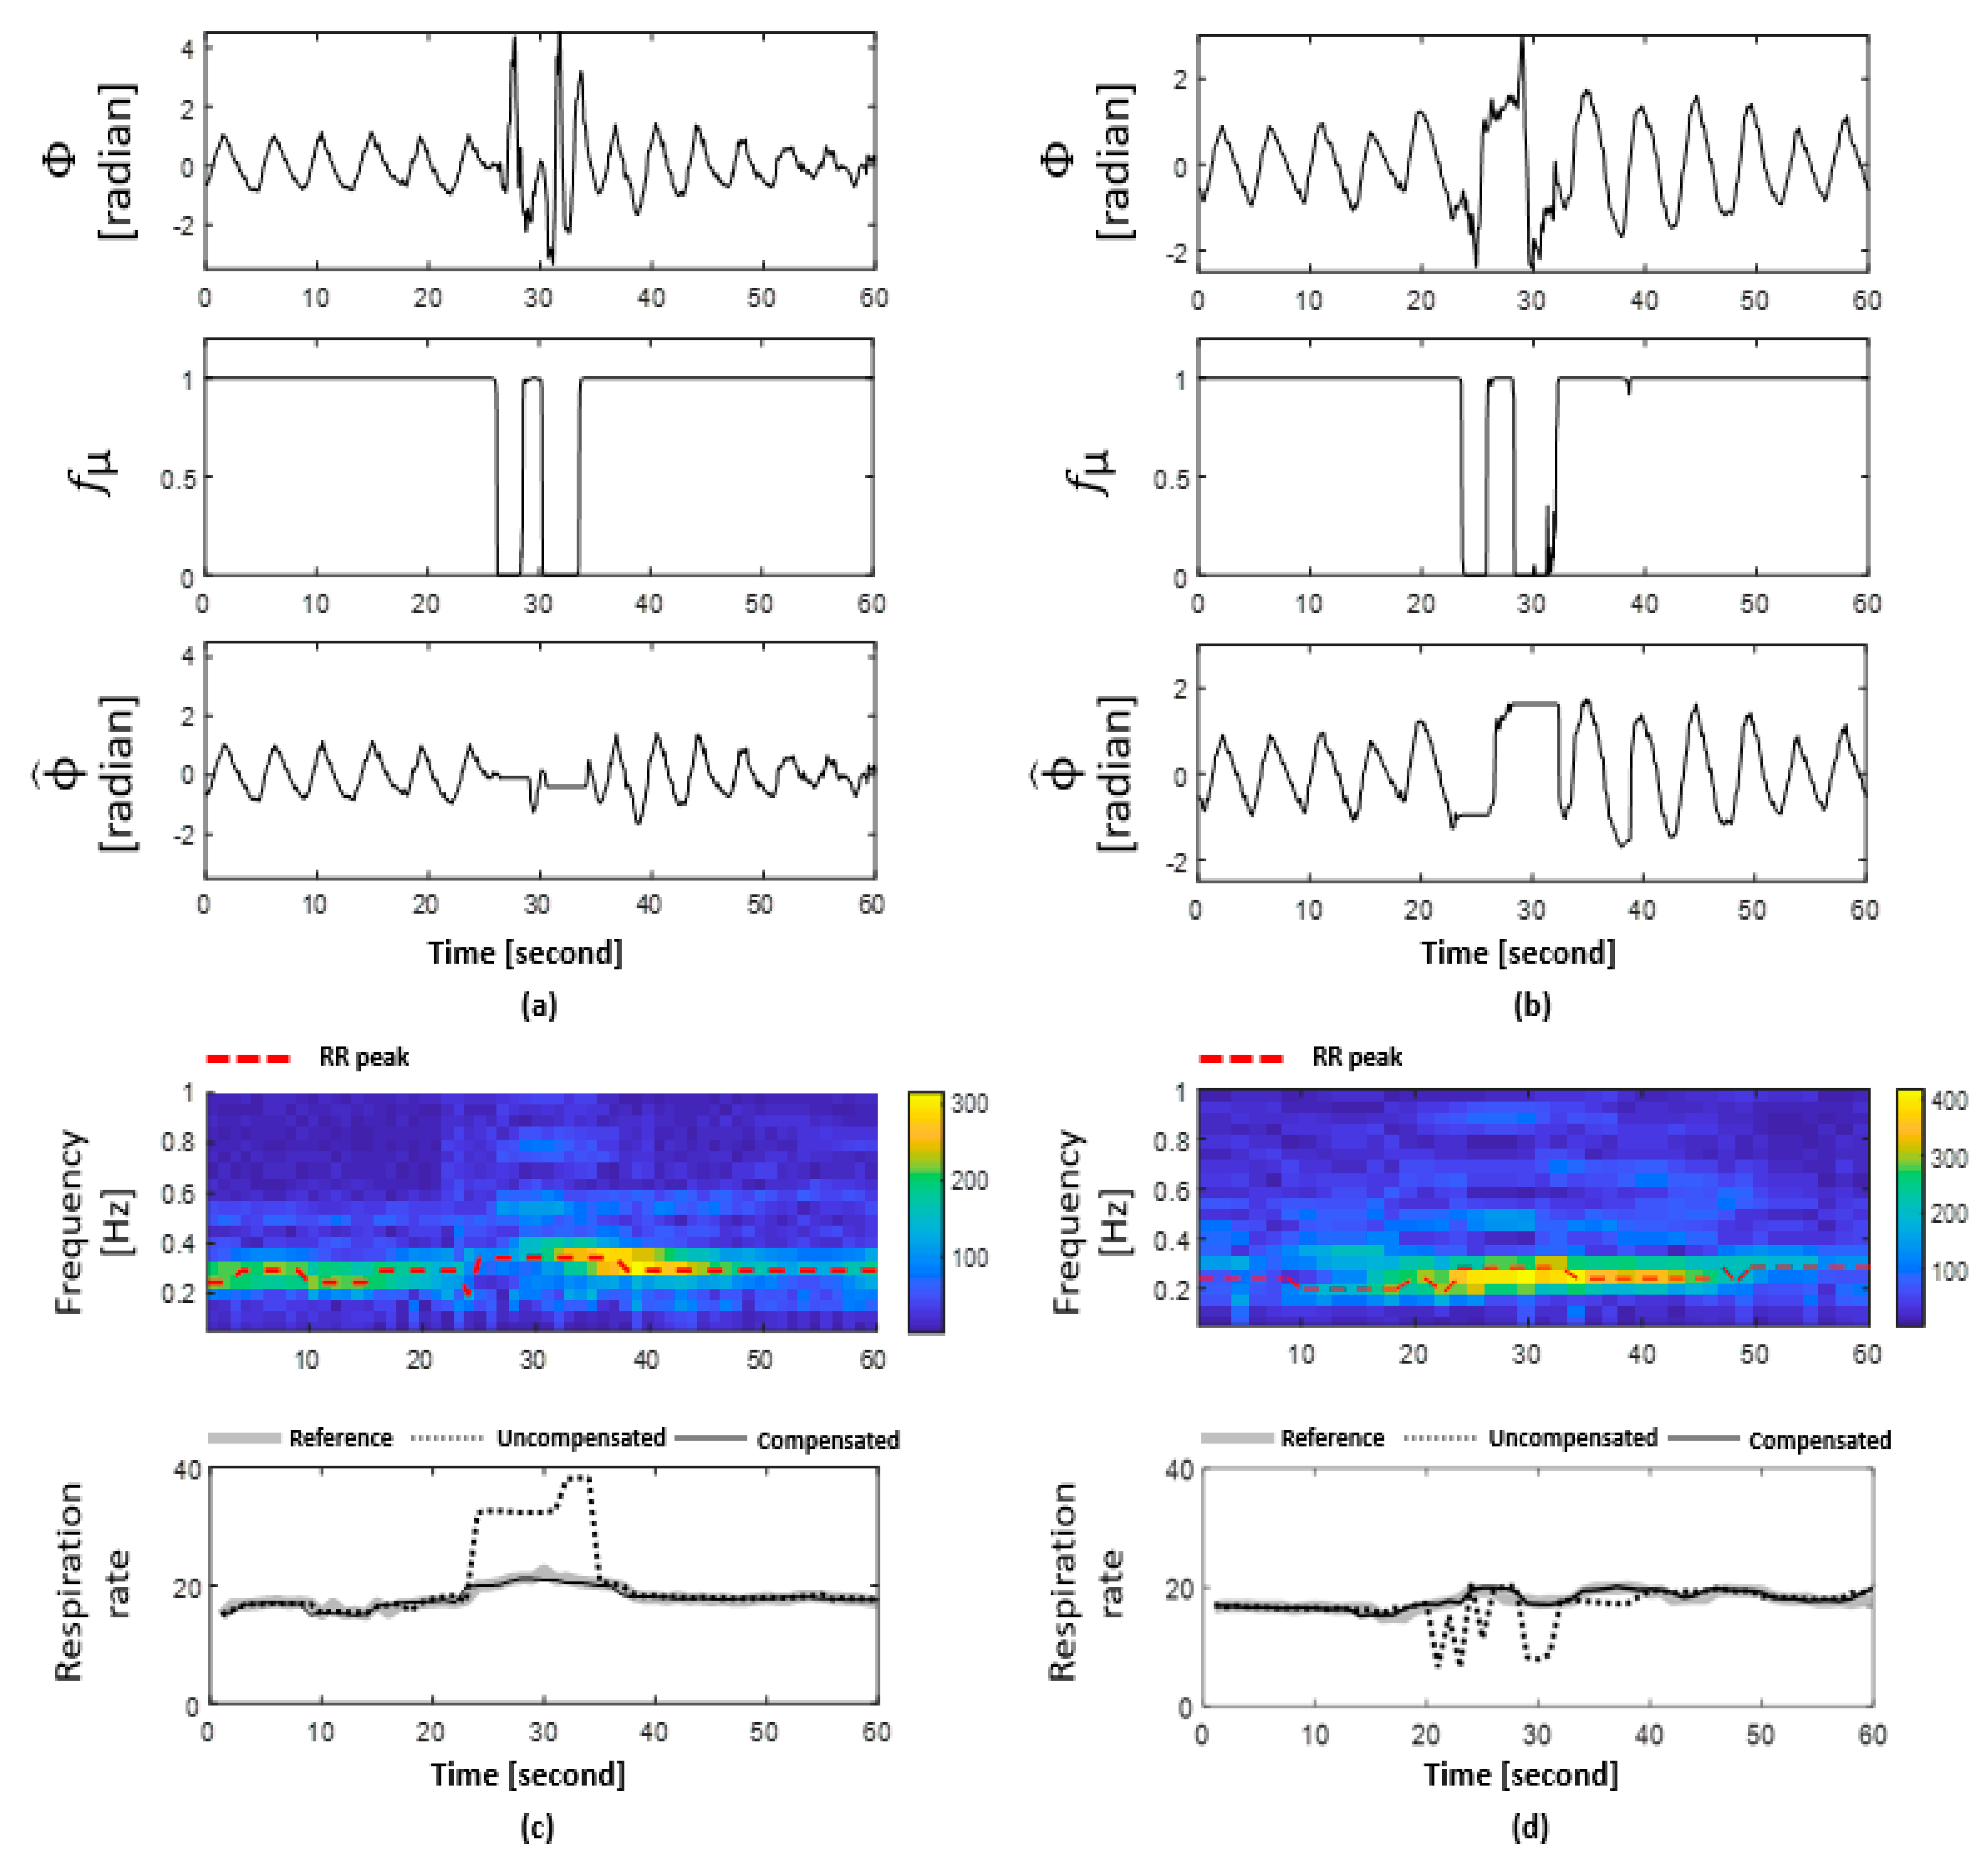
Figure 9 shows the results of estimating the driver’s respiration signal and respiratory rate in a driving situation accompanied by the driver’s movement.
Figure 9a–d are the results of the direction change, namely left turn and right turn, respectively. An irregular distortion of the driver’s respiration signal occurs in the direction change situation, and it is compensated by (8). The respiratory rate from the compensated driver respiration signal correlates highly with the reference respiratory rate.
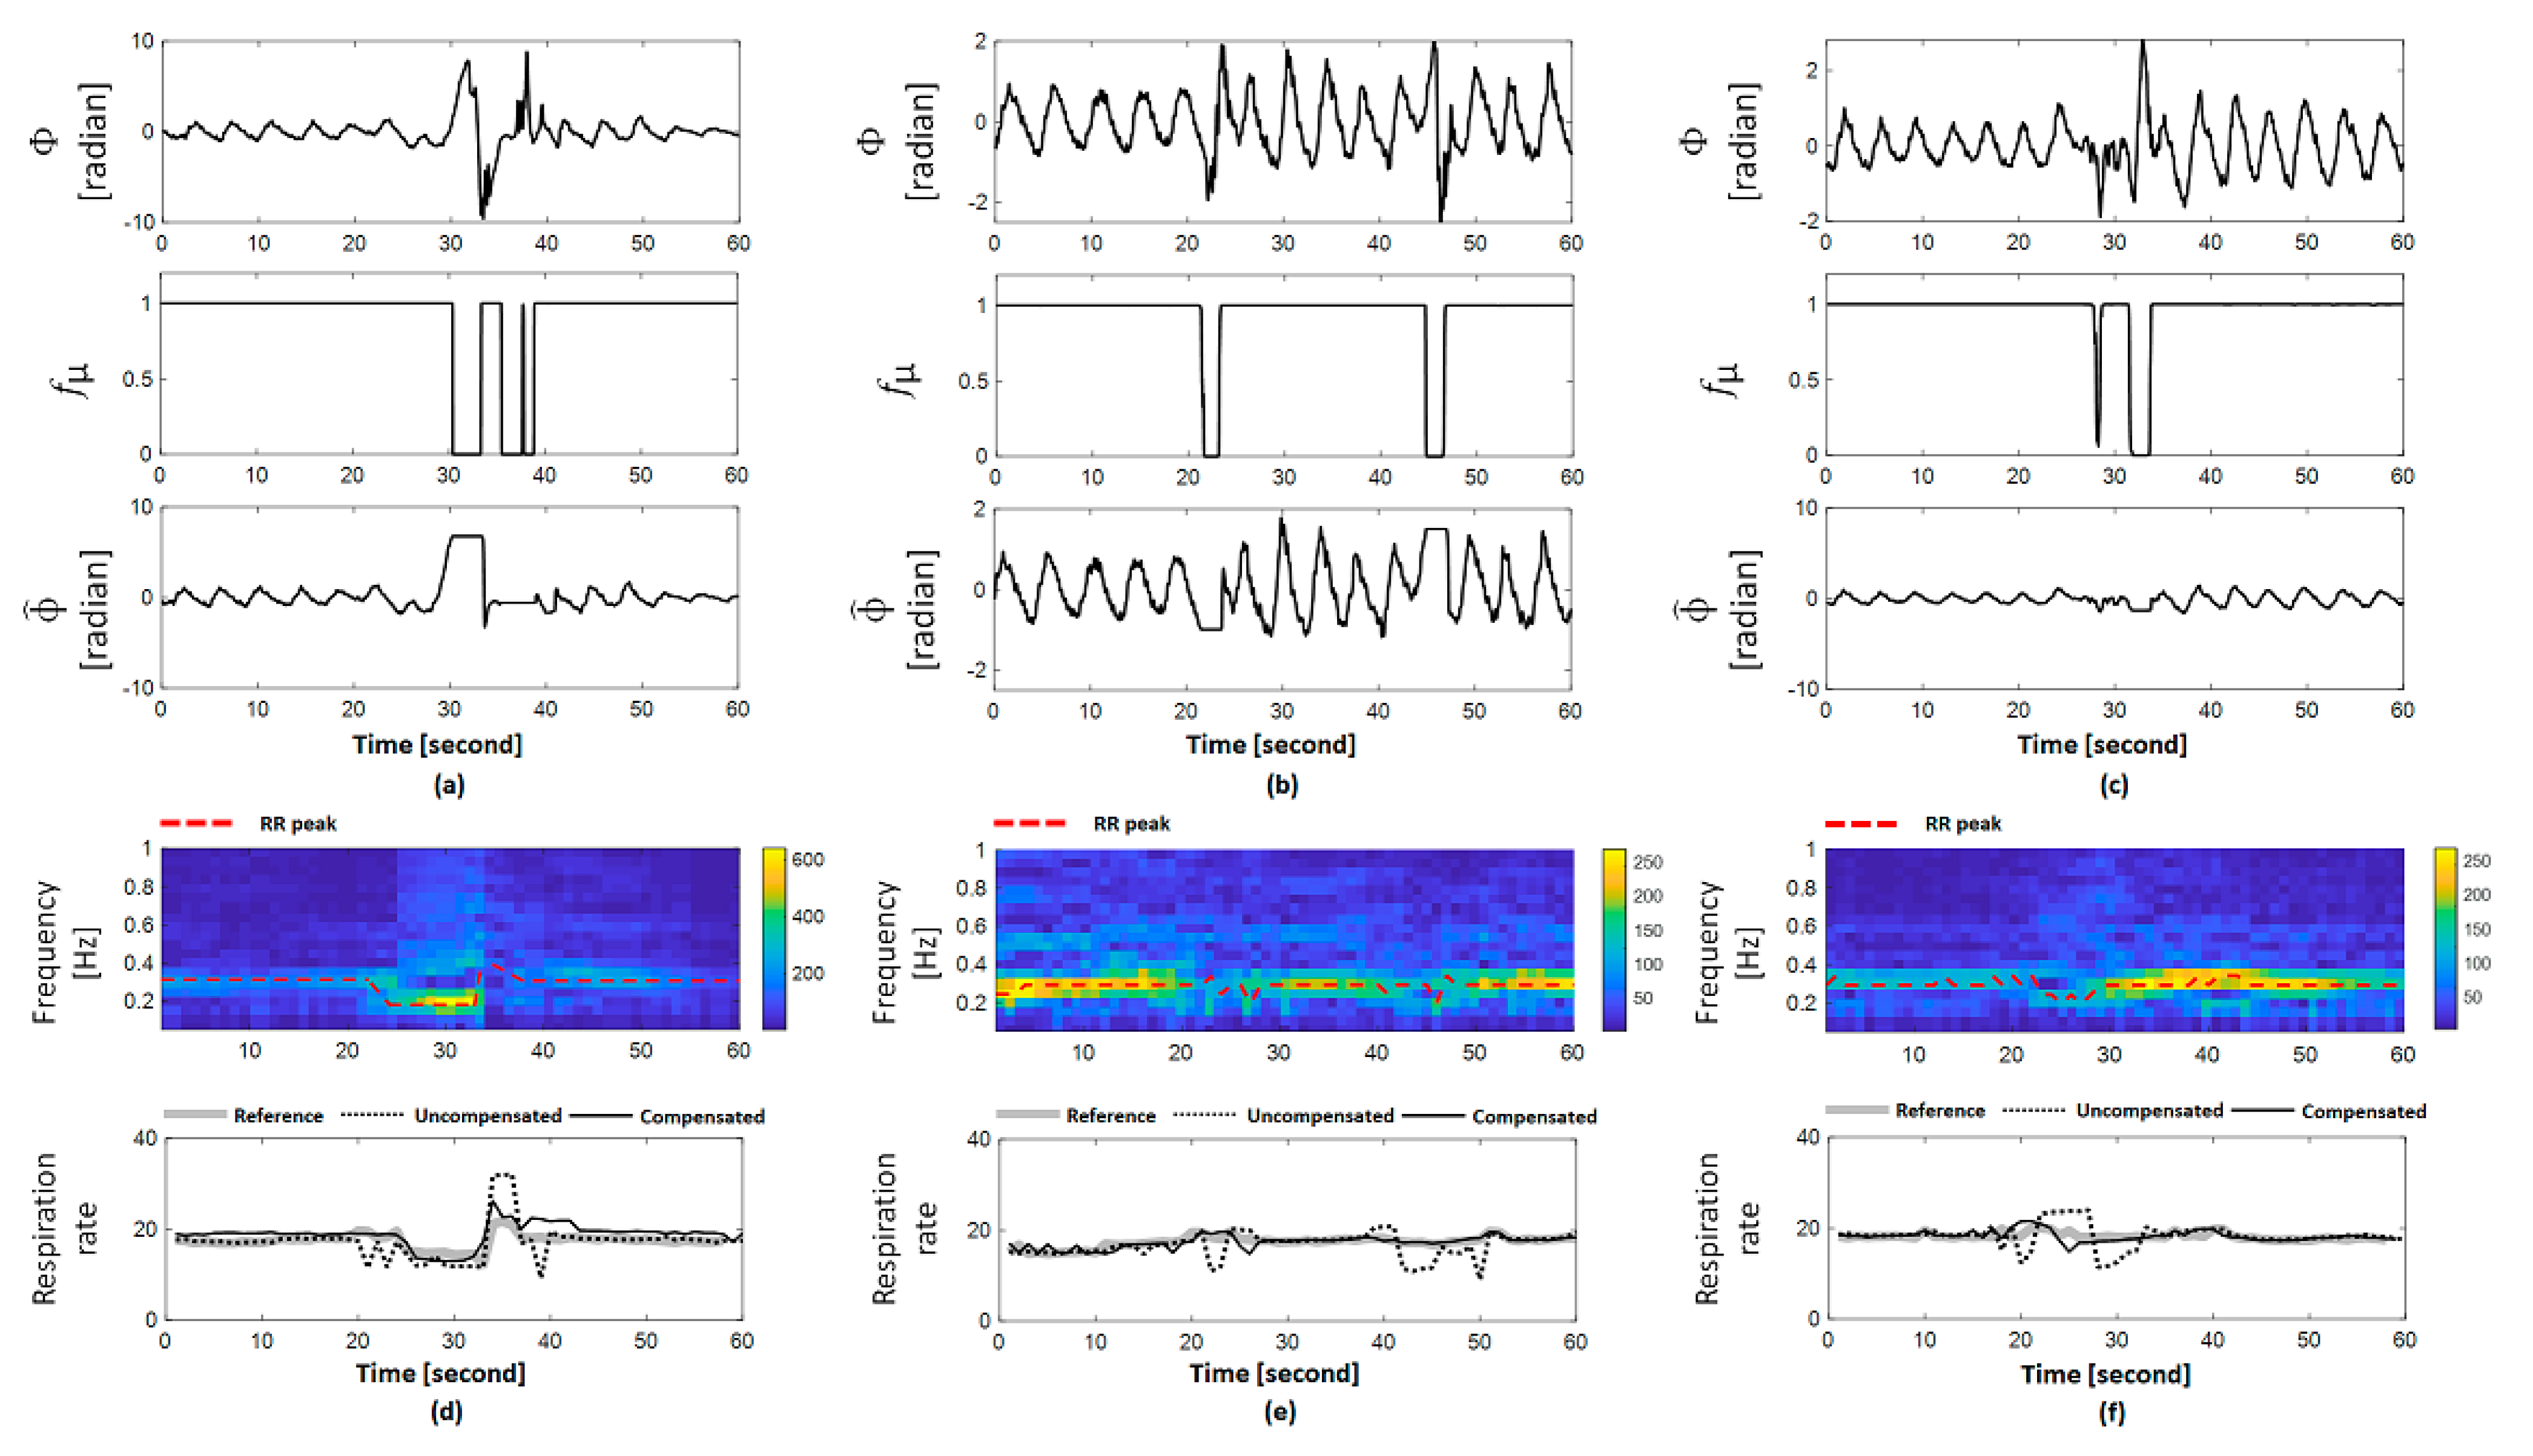
Figure 10 shows the results of estimating the driver’s respiration signal and respiration rate in driving situations that include lane change and complex movements such as deceleration, acceleration, and straight driving. As direction changes, the signal is distorted in the section where movement occurs. As shown in
Figure 10a, a sudden stop is accompanied by a large movement of the driver’s body. Thus, the variability in
is higher than that in other driving situations. In the case of
Figure 10b, after stopping while driving in a straight line, driving is resumed, and
is relatively small because the driver’s movement is less than that of a sudden stop. In both driving situations mentioned above, the distorted driver signal is compensated by detecting the section where the driver moves. In addition,
Figure 10d,e show that the accuracy of the respiratory rate estimation increased through the proposed method.
Figure 10c shows that the respiration signal when changing lanes is similar to that of the direction change situation but is associated with relatively less movement of the driver’s body. The distortion of the respiration signal occurs due to body movement when the driver changes lanes. However, there is little change in the driver’s body when changing directions, which causes a relatively low change in the motion index
We detected the driver’s movement when changing lanes and compensated for signal distortion. This movement situation also results in high accuracy of the compensated respiratory rate shown in
Figure 10f. The results demonstrate that the proposed method compensates for an irregularly distorted signal in a driving situation in which movement exists, and it accurately estimates the respiratory rate.
4.2. Accuracy Analysis
We calculated the mean error and accuracy of the estimated respiratory rate from the compensated respiration signal according to the driving situation for the three drivers. Accuracy is the absolute difference between the reference respiratory rate and the estimated respiration signals. In addition, the error was estimated by the standard deviation of the respiration rate.
Table 2 shows the accuracy of the respiratory rate of the drivers for each driving situation. Distortion of the driver’s respiration signal only occurs when the driver’s movement is detected. Thus, we showed the accuracy of the estimated respiratory rate only for the situation in which movement occurred. The respiratory rate estimated from the compensated respiration signal has a lower error compared to the reference respiratory rate in the case of direction change (left and right turn) and complex driving where a large movement is detected in the driver’s body. There are individual differences in body movements for each driving situation. Thus, when changing lanes, the driver’s motion quantification value is generally low, and there is almost no signal distortion.
Therefore, the estimated respiratory rate error is the same for the two subjects, before and after signal compensation. Overall, for most drivers, the proposed method for estimating a driver’s respiratory rate has higher accuracy than conventional methods.
5. Conclusions
Accurate driver vital signal monitoring during driver movements is a very useful technology for the prevention of major driving accidents caused by respiratory abnormalities. For limited driving situations in an experimental environment, we acquired driver vital signals using a highly portable FMCW radar, which can be packaged in small sizes. Because the accuracy of driver vital signal detection and respiration rate estimation varies greatly depending on the driver’s movement, a distorted signal compensation index based on motion quantification is newly introduced for more accurate respiration rate estimation in movement situations. Using the experimental results, we proved that the driver’s respiration signal distorted by movement can be accurately compensated using the proposed signal compensation method. The results showed that the respiration rate estimated by the proposed method had improved accuracy compared to that of conventional methods. The proposed signal compensation method is useful for monitoring vital signs in all fields where movement exists during monitoring.
The limitation of this work is that it has been performed offline. To make it be performed in real time, radar needs to be installed in a vehicle, and all the signal processing modules also need to be embedded in the radar sensor module. More experiments and sensitive analysis of the threshold values in real road under driving situations remain for future works for rigorous demonstration.
Author Contributions
Conceptualization, Y.-K.Y.; Data curation, Y.-K.Y.; Formal analysis, Y.-K.Y.; Investigation, Y.-K.Y.; Methodology, Y.-K.Y.; Project administration, H.-C.S.; Resources, H.-C.S.; Software, Y.-K.Y.; Supervision, H.-C.S.; Validation, H.-C.S.; Visualization, Y.-K.Y. and H.-C.S.; Writing—original draft, Y.-K.Y.; Writing—review & editing, H.-C.S. All authors have read and agreed to the published version of the manuscript.
Funding
This work was supported by institute of Information & communications Technology Planning & Evaluation (IITP) grant funded by the Korea government (MSIT) (No. 2021-0-00305).
Institutional Review Board Statement
Not applicable.
Informed Consent Statement
Informed consent was obtained from all subjects involved in the study.
Data Availability Statement
Not applicable.
Conflicts of Interest
The authors declare no conflict of interest.
References
- Stutts, J.C.; Wilkins, J.W.; Scott Osberg, J.; Vaughn, B.V. Driver risk factors for sleep-related crashes. Accid. Anal. Prev. 2003, 35, 321–331. [Google Scholar] [CrossRef]
- Drake, C.; Roehrs, T.; Breslau, N.; Johnson, E.; Jefferson, C.; Scofield, H.; Roth, T. The 10-year risk of verified motor vehicle crashes in relation to physiologic sleepiness. Sleep 2010, 33, 745–752. [Google Scholar] [CrossRef] [PubMed] [Green Version]
- Vinci, G.; Lenhard, T.; Will, C.; Koelpin, A. Microwave interferometer radar-based vital sign detection for driver monitoring syst. In Proceedings of the 2015 IEEE MTT-S International Conference on Microwaves for Intelligent Mobility (ICMIM), Heidelberg, Germany, 27–29 April 2015; IEEE: Piscataway, NJ, USA, 2015; pp. 1–4. [Google Scholar]
- Choi, H.I.; Song, W.J.; Song, H.; Shin, H.C. Selecting Target Range with Accurate Vital Sign Using Spatial Phase Coherency of FMCW Radar. Appl. Sci. 2021, 11, 4514. [Google Scholar] [CrossRef]
- Salzillo, G.; Natale, C.; Fioccola, G.B.; Landolfi, E. Evaluation of driver drowsiness based on real-time face analysis. In Proceedings of the 2020 IEEE International Conference on Systems, Man, and Cybernetics (SMC), Toronto, CA, Canada, 11–14 October 2020; IEEE: Piscataway, NJ, USA, 2020; pp. 328–335. [Google Scholar]
- Li, C.; Cummings, J.; Lam, J.; Graves, E.; Wu, W. Radar Remote Monitoring of Vital Signs. IEEE Microw. Mag. 2009, 10, 47–56. [Google Scholar] [CrossRef]
- Khushaba, R.N.; Kodagoda, S.; Lal, S.; Dissanayake, G. Driver drowsiness classification using fuzzy wavelet-packet-based feature-extraction algorithm. IEEE Trans. Biomed. Eng. 2011, 58, 121–131. [Google Scholar] [CrossRef] [PubMed] [Green Version]
- Castro, I.D.; Mercuri, M.; Patel, A.; Puers, R.; Van Hoof, C.; Torfs, T. Physiological driver monitoring using capacitively coupled and radar sensors. Appl. Sci. 2019, 9, 3994. [Google Scholar] [CrossRef] [Green Version]
- Gwak, J.; Hirao, A.; Shino, M. An investigation of early detection of driver drowsiness using ensemble machine learning based on hybrid sensing. Appl. Sci. 2020, 10, 2890. [Google Scholar] [CrossRef]
- Adib, F.; Mao, H.; Kabelac, Z.; Katabi, D.; Miller, R.C. Smart homes that monitor breathing and heart rate. In Proceedings of the 33rd annual ACM conference on human factors in computing systems, CHI 2015, Seoul, Korea, 18–23 April 2015; pp. 837–846. [Google Scholar]
- Pace, P.E. Detecting and Classifying Low Probability of Intercept Radar; Artech House: London, UK, 2009. [Google Scholar]
- Tran, Q.T.; Ton, T.L.; Nguyen, N.T.M.; Nguyen, B.D. A k-band noninvasive vital signs monitoring system in automotive applications. In Proceedings of the 2019 International Symposium on Electrical and Electronics Engineering (ISEE), Ho Chi Minh City, Vietnam, 10–12 October 2019; IEEE: Piscataway, NJ, USA, 2019; pp. 85–88. [Google Scholar]
- Schires, E.; Georgiou, P.; Lande, T.S. Vital sign monitoring through the back using an UWB impulse radar with body coupled antennas. IEEE Trans. Biomed. Circuits Syst. 2018, 12, 292–302. [Google Scholar] [CrossRef] [PubMed]
- Yun, Y.; Lee, J.; Kim, J.; Kim, Y. Detection Scheme of Heart and Respiration Signals for a Driver of Car with a Doppler Radar. J. Soc. Disaster Inf. 2020, 16, 87–95. [Google Scholar]
- Yang, Z.; Bocca, M.; Jain, V.; Mohapatra, P. Contactless breathing rate monitoring in vehicle using UWB radar. In Proceedings of the 7th International Workshop on Real-World Embedded Wireless Systems and Networks, Shenzhen, China, 4 November 2018; pp. 13–18. [Google Scholar]
- Ricciuti, M.; Ciattaglia, G.; de Santis, A.; Gambi, E.; Senigagliesi, L. Contactless heart rate measurements using RGB-camera and radar. In Proceedings of the 6th International Conference on Information and Communication Technologies for Ageing Well and eHealth, ICT4AWE 2020, Prague, Czech Republic, 3–5 May 2020; pp. 121–129. [Google Scholar]
- Pan, J.; Ni, Z.K.; Shi, C.; Zheng, Z.; Ye, S.; Fang, G. Motion Compensation Method Based on MFDF of Moving Target for UWB MIMO Through-Wall Radar System. IEEE Geosci. Remote Sens. Lett. 2021, 19, 1–5. [Google Scholar] [CrossRef]
- Hu, X.; Lu, M.; Li, Y.; Wang, Y. Motion compensation for TDM MIMO radar by sparse reconstruction. Electron. Lett. 2017, 53, 1604–1606. [Google Scholar] [CrossRef]
- Anghel, A.; Vasile, G.; Cacoveanu, R.; Ioana, C.; Ciochina, S. Short-range wideband FMCW radar for millimetric displacement measurements. IEEE Trans. Geosci. Remote Sens. 2014, 52, 5633–5642. [Google Scholar] [CrossRef] [Green Version]
- Choi, H.I.; Song, H.; Shin, H.C. Target range selection of FMCW radar for accurate vital information extraction. IEEE Access 2020, 9, 1261–1270. [Google Scholar] [CrossRef]
- Choi, H.I.; Noh, G.J.; Shin, H.C. Measuring the depth of anesthesia using ordinal power spectral density of electroencephalogram. IEEE Access 2020, 8, 50431–50438. [Google Scholar] [CrossRef]
- Kim, J.D.; Lee, W.H.; Lee, Y.; Lee, H.J.; Cha, T.; Kim, S.H.; Song, K.M.; Lim, Y.H.; Cho, S.H.; Cho, S.H.; et al. Non-contact respiration monitoring using impulse radio ultrawideband radar in neonates. R. Soc. Open Sci. 2019, 6, 190149. [Google Scholar] [CrossRef] [PubMed] [Green Version]
- Shah, S.A.; Fleming, S.; Thompson, M.; Tarassenko, L. Respiratory rate estimation during triage of children in hospitals. J. Med. Eng. Technol. 2015, 39, 514–524. [Google Scholar] [CrossRef] [PubMed]
- Zhang, Z.; Pi, Z.; Liu, B. TROIKA: A general framework for heart rate monitoring using wrist-type photoplethysmographic signals during intensive physical exercise. IEEE Trans. Biomed. Eng. 2014, 62, 522–531. [Google Scholar] [CrossRef] [PubMed] [Green Version]
- Bitsensing.BTS60. Available online: http://bitsensing.com/60ghz-mini-h/ (accessed on 13 January 2022).
Figure 1.
Measured respiratory signals. (a) Radar signal, (b) respiratory signal measured by radar at a specific range bin and from actual breathing.
Figure 1.
Measured respiratory signals. (a) Radar signal, (b) respiratory signal measured by radar at a specific range bin and from actual breathing.
Figure 2.
Comparison of the quantification accuracy of motion index. (a) Respiratory signal and motion quantification index, (b) acceleration value for different parts of the driver’s body (chest, back of the hand, and back of the foot).
Figure 2.
Comparison of the quantification accuracy of motion index. (a) Respiratory signal and motion quantification index, (b) acceleration value for different parts of the driver’s body (chest, back of the hand, and back of the foot).
Figure 3.
Signal compensation index reflecting motion quantification index.
Figure 3.
Signal compensation index reflecting motion quantification index.
Figure 4.
Components comparison of respiration signal based on compensation. (a) Compensation of distorted phase components of respiration signal, (b) comparison of frequency components of respiration signal according to the distortion compensation.
Figure 4.
Components comparison of respiration signal based on compensation. (a) Compensation of distorted phase components of respiration signal, (b) comparison of frequency components of respiration signal according to the distortion compensation.
Figure 5.
Compensation results comparison. (a,b) Frequency components of driver’s respiration signal, (c,d) estimated respiratory rate.
Figure 5.
Compensation results comparison. (a,b) Frequency components of driver’s respiration signal, (c,d) estimated respiratory rate.
Figure 6.
Single-channel FMCW radar.
Figure 6.
Single-channel FMCW radar.
Figure 7.
Respiratory signal measurement environment. (a) Experimental setup and location of wearable motion sensors attachment, (b) location of FMCW radar.
Figure 7.
Respiratory signal measurement environment. (a) Experimental setup and location of wearable motion sensors attachment, (b) location of FMCW radar.
Figure 8.
Compensated respiration estimation and comparison in situations where the driver is motionless. (a,c) Respiration compensation in straight driving, (b,d) respiration compensation in straight driving with faster breathing after 30 s.
Figure 8.
Compensated respiration estimation and comparison in situations where the driver is motionless. (a,c) Respiration compensation in straight driving, (b,d) respiration compensation in straight driving with faster breathing after 30 s.
Figure 9.
Compensated respiration rate estimation and comparison in each situation where the driver’s movement is present. (a,c) Respiration compensation in turn left, (b,d) respiration compensation in turn right.
Figure 9.
Compensated respiration rate estimation and comparison in each situation where the driver’s movement is present. (a,c) Respiration compensation in turn left, (b,d) respiration compensation in turn right.
Figure 10.
Compensated respiration rate estimation and comparison for each situation in which the driver’s movement is present. (a,d) Respiration compensation in sudden stop, (b,e) respiration compensation in stop and start, (c,f) respiration compensation in lane change.
Figure 10.
Compensated respiration rate estimation and comparison for each situation in which the driver’s movement is present. (a,d) Respiration compensation in sudden stop, (b,e) respiration compensation in stop and start, (c,f) respiration compensation in lane change.
Table 1.
Driving experiment conditions according to the movement.
Table 1.
Driving experiment conditions according to the movement.
| Driving Situation | Driver Movement | Detail |
|---|
| O | X |
|---|
| Straight 1 | | √ | Normal breathing for 1 min |
| Straight 2 | | √ | Normal and fast breathing per 30 s |
| Left Turn | √ | | 1. High driver motion value 2. Long movement duration |
| Right Turn | √ | | 1. High driver motion value 2. Long movement duration |
| Complex Driving 1 | √ | √ | Stopping and driving straight |
| Complex Driving 2 | √ | √ | Sudden stopping and lane changing |
| Lane Change | √ | | 1. Low driver motion value 2. Short movement duration |
Table 2.
Respiratory rate accuracy analysis according to each driving situation.
Table 2.
Respiratory rate accuracy analysis according to each driving situation.
Driving
Situation | Subject # | Respiration Rate Error |
|---|
| Before Compensation | After Compensation | p-Value(ANOVA) |
|---|
| Left Turn | 1 | | | 0.0003 |
| 2 | | |
| 3 | | |
| Mean value ± SD | | |
| Right Turn | 1 | | | 0.0106 |
| 2 | | |
| 3 | | |
| Mean value ± SD | | |
| Complex Driving 1 | 1 | | | 0.0372 |
| 2 | | |
| 3 | | |
| Mean value ± SD | | |
| Complex Driving 2 | 1 | | | 0.0075 |
| 2 | | |
| 3 | | |
| Mean value ± SD | | |
| Lane Change | 1 | | | 0.0022 |
| 2 | | |
| 3 | | |
| Mean value ± SD | | |
| Publisher’s Note: MDPI stays neutral with regard to jurisdictional claims in published maps and institutional affiliations. |
© 2022 by the authors. Licensee MDPI, Basel, Switzerland. This article is an open access article distributed under the terms and conditions of the Creative Commons Attribution (CC BY) license (https://creativecommons.org/licenses/by/4.0/).


