
Impact of the Speed of Airflow in a Cleanroom on the Degree of Air Pollution

 , , ,
, , , 
Abstract
:1. Introduction
2. Materials and Methods
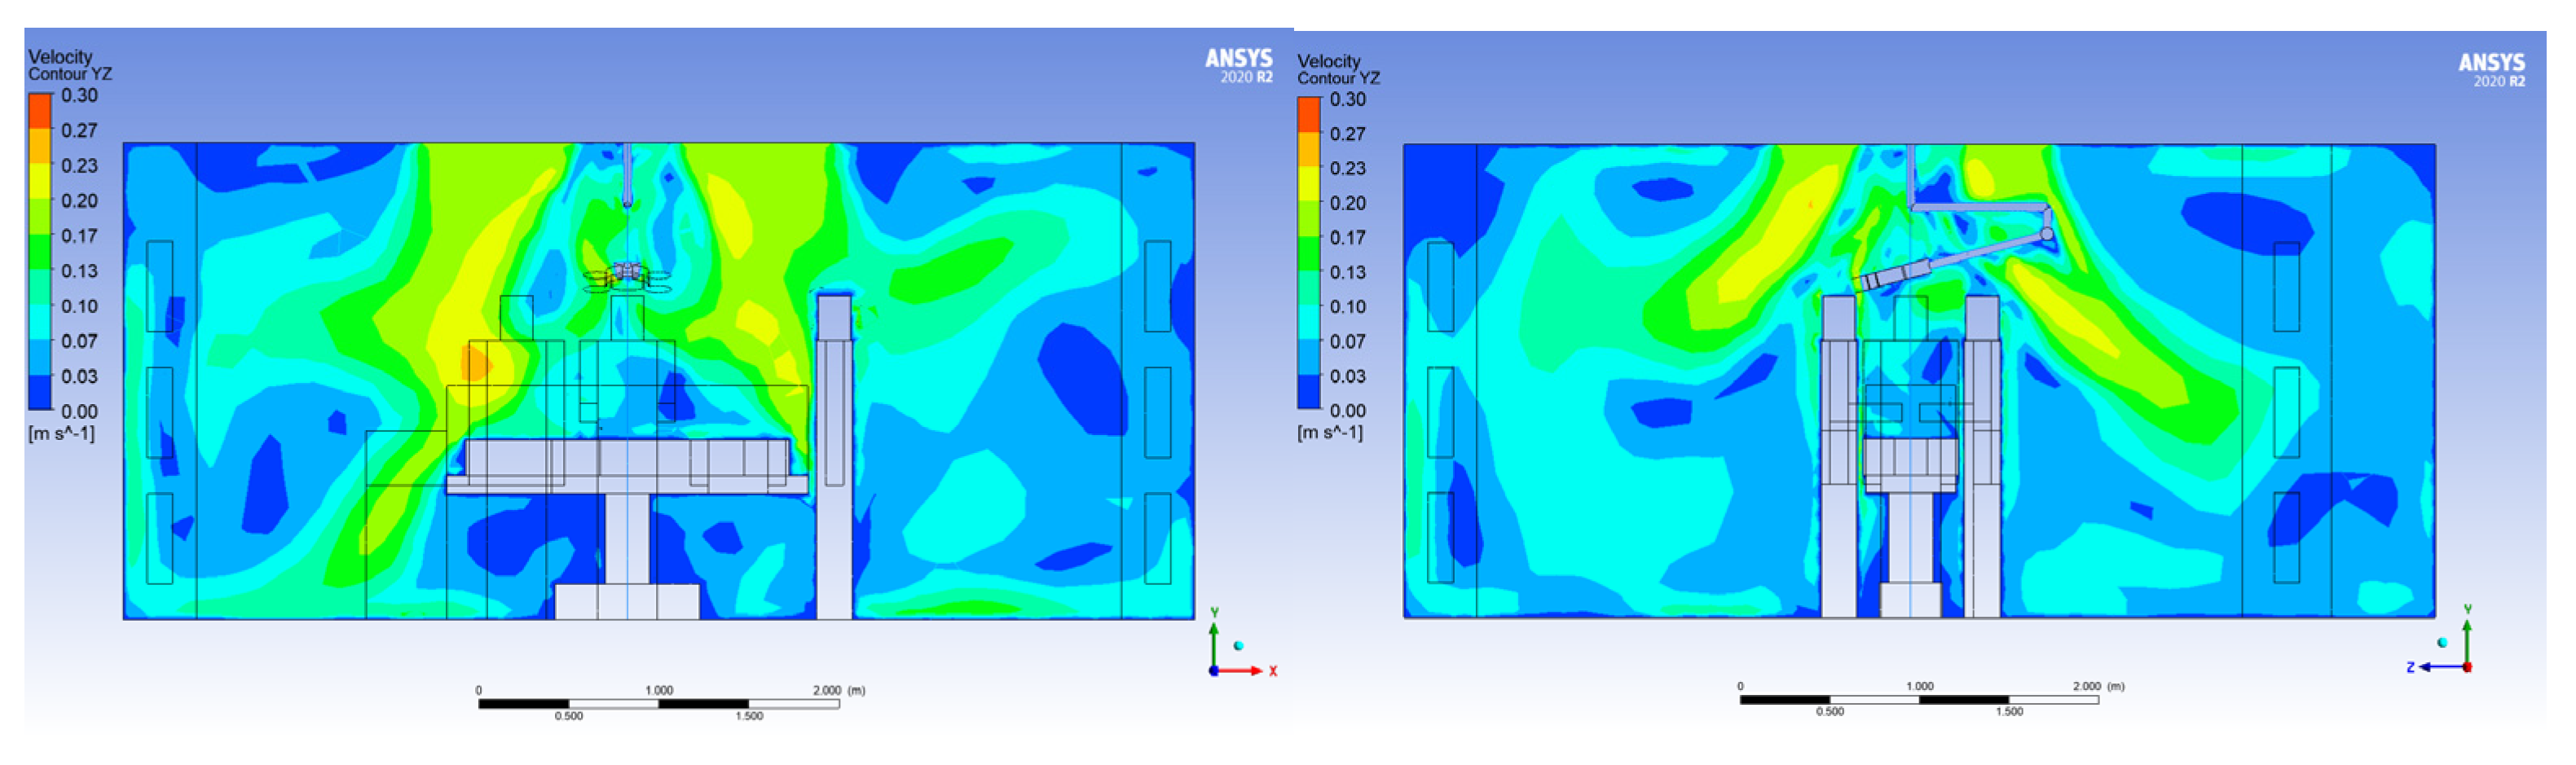
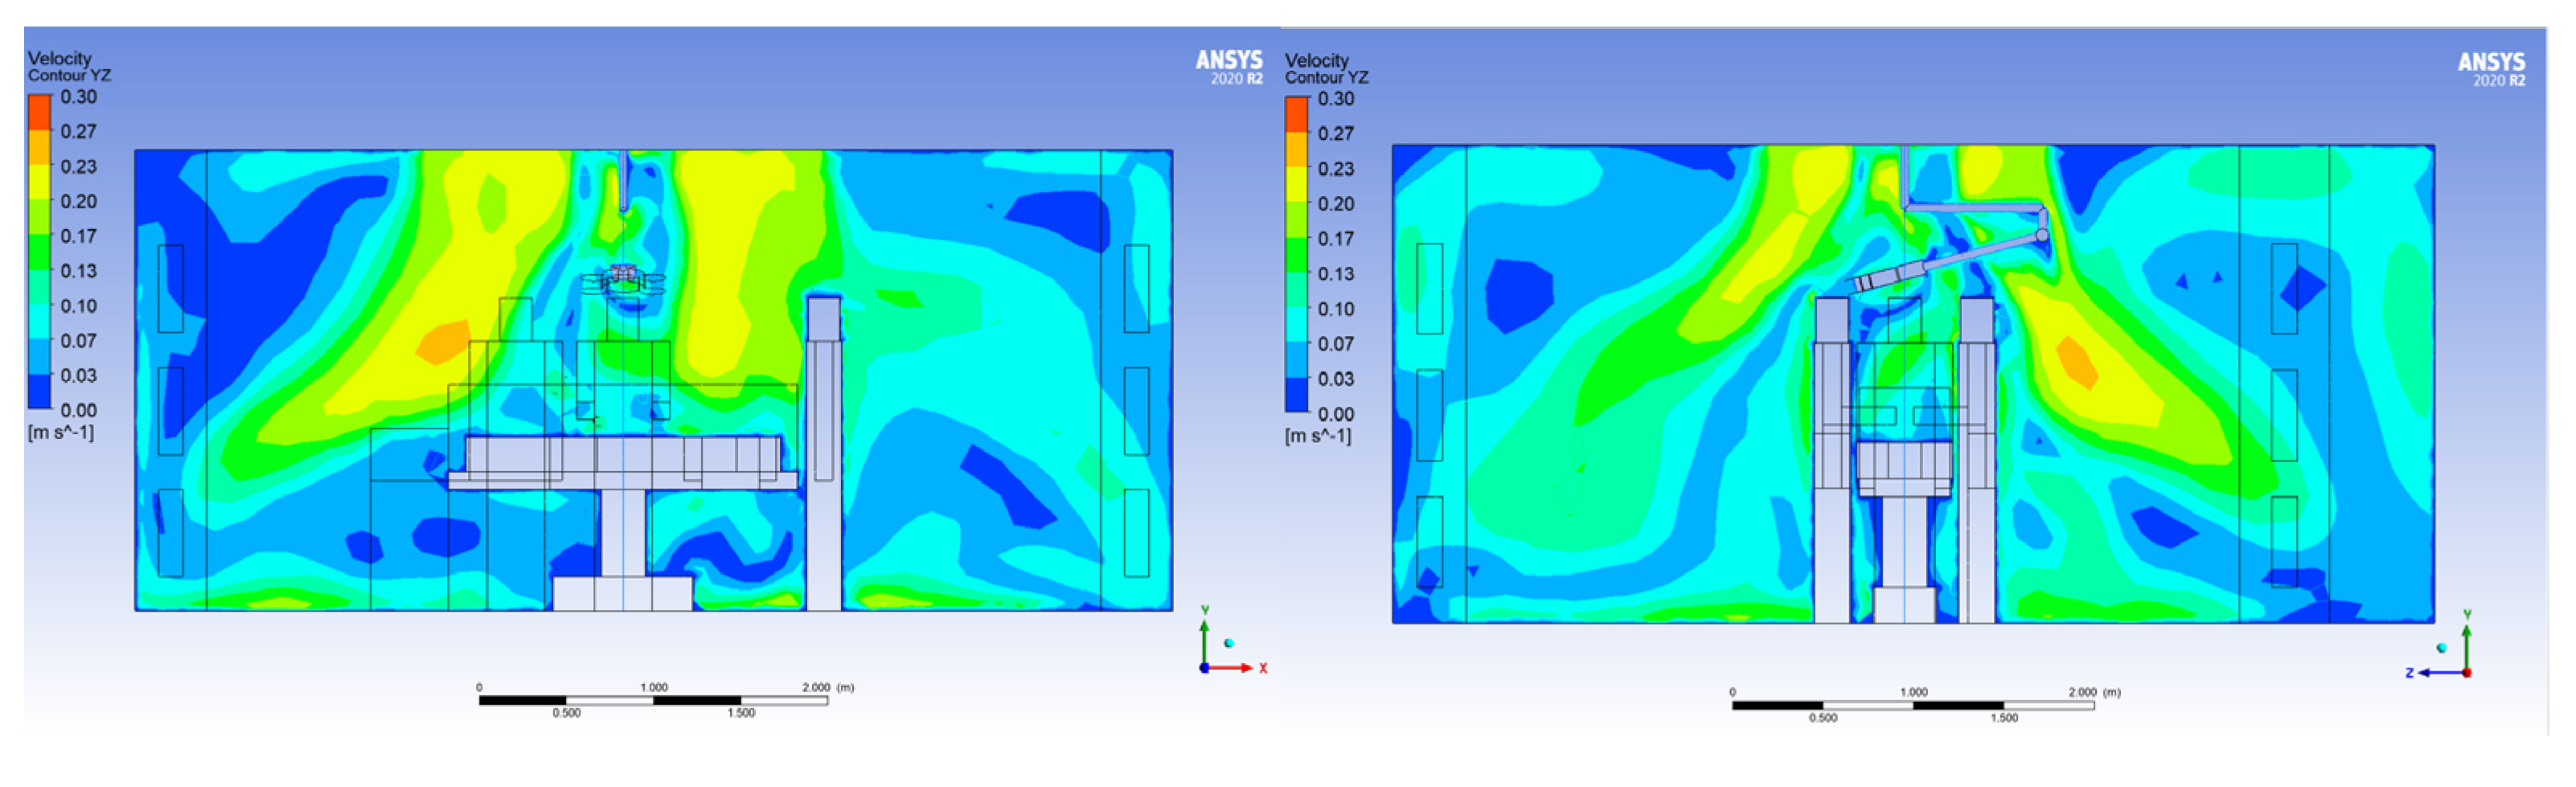
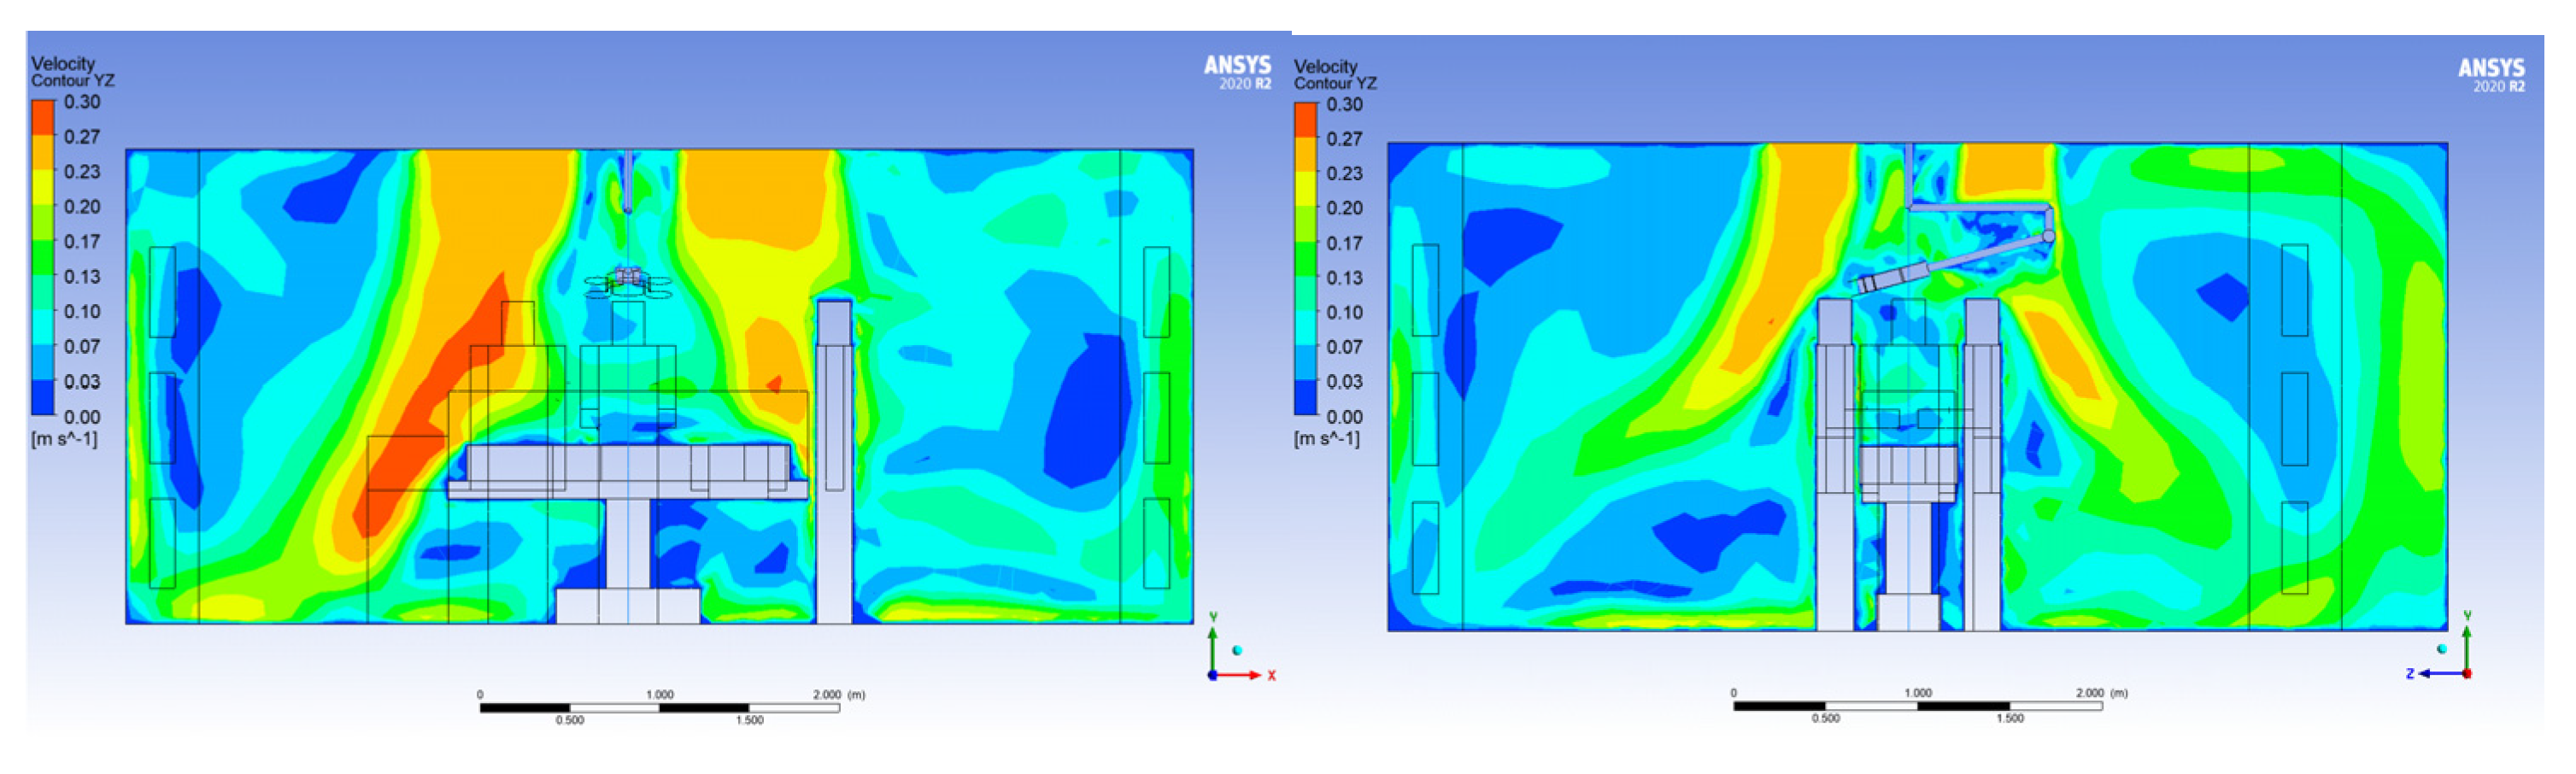
2.1. CFD Simulation
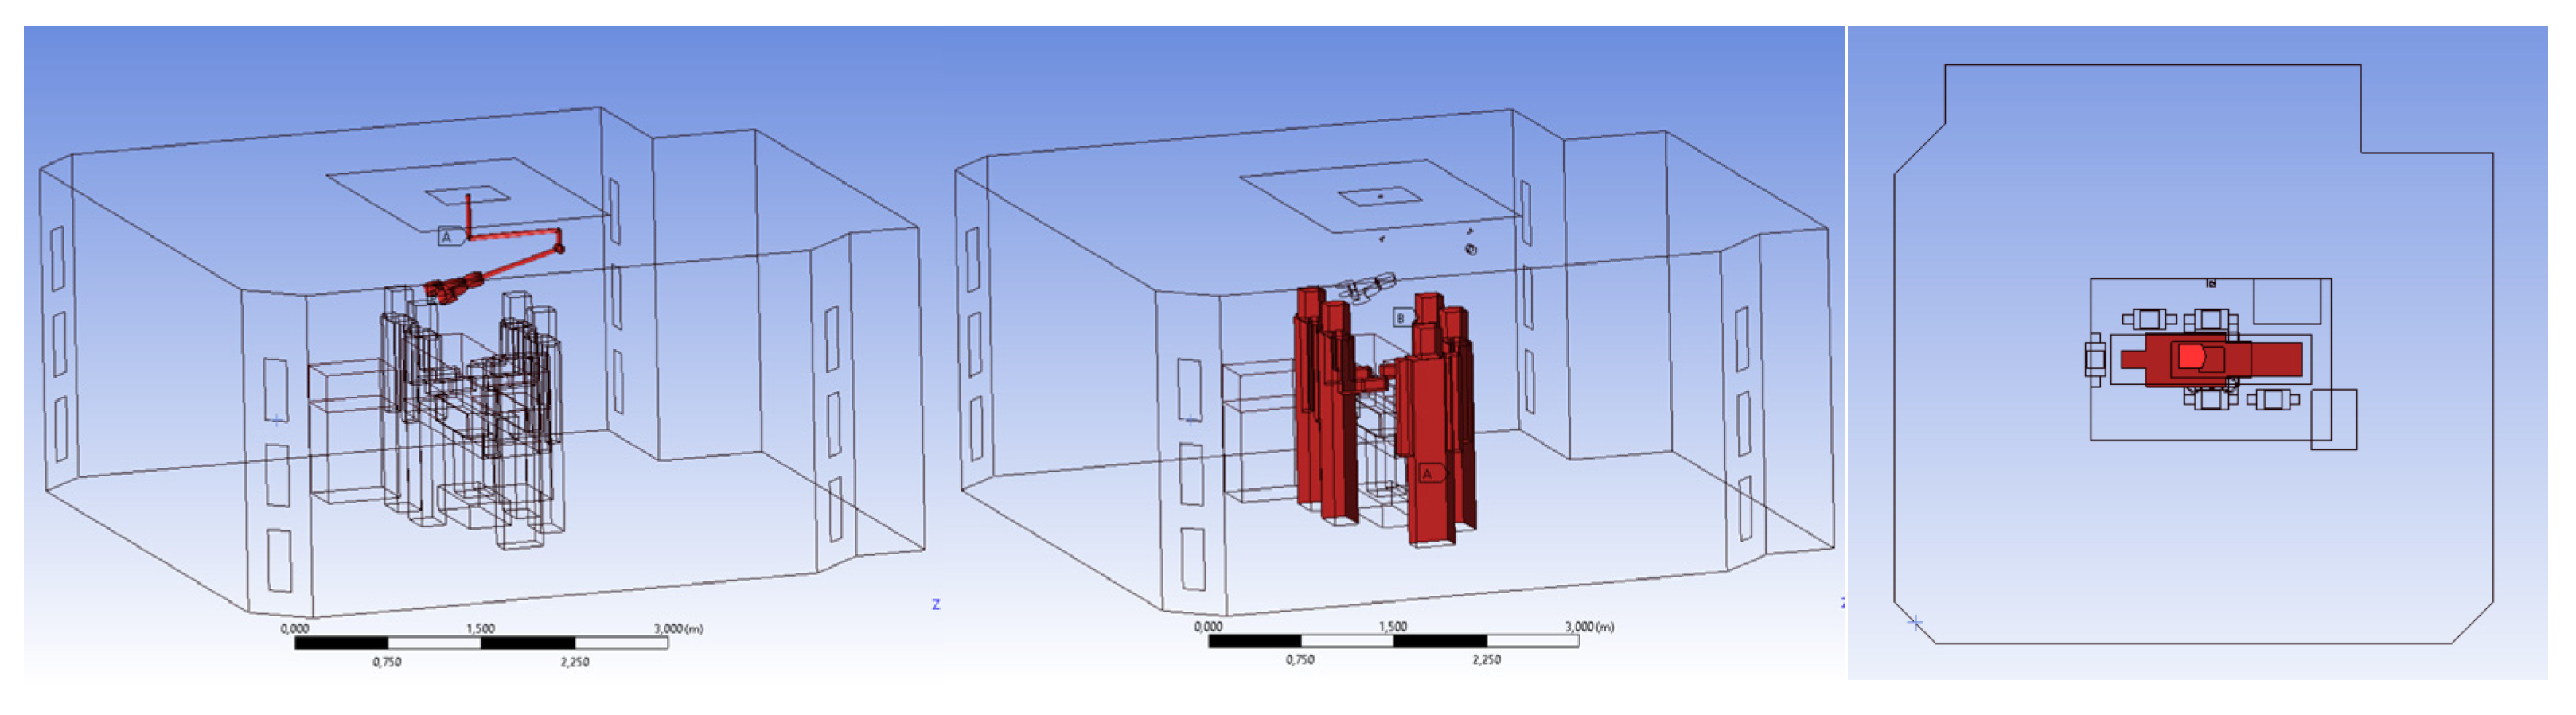
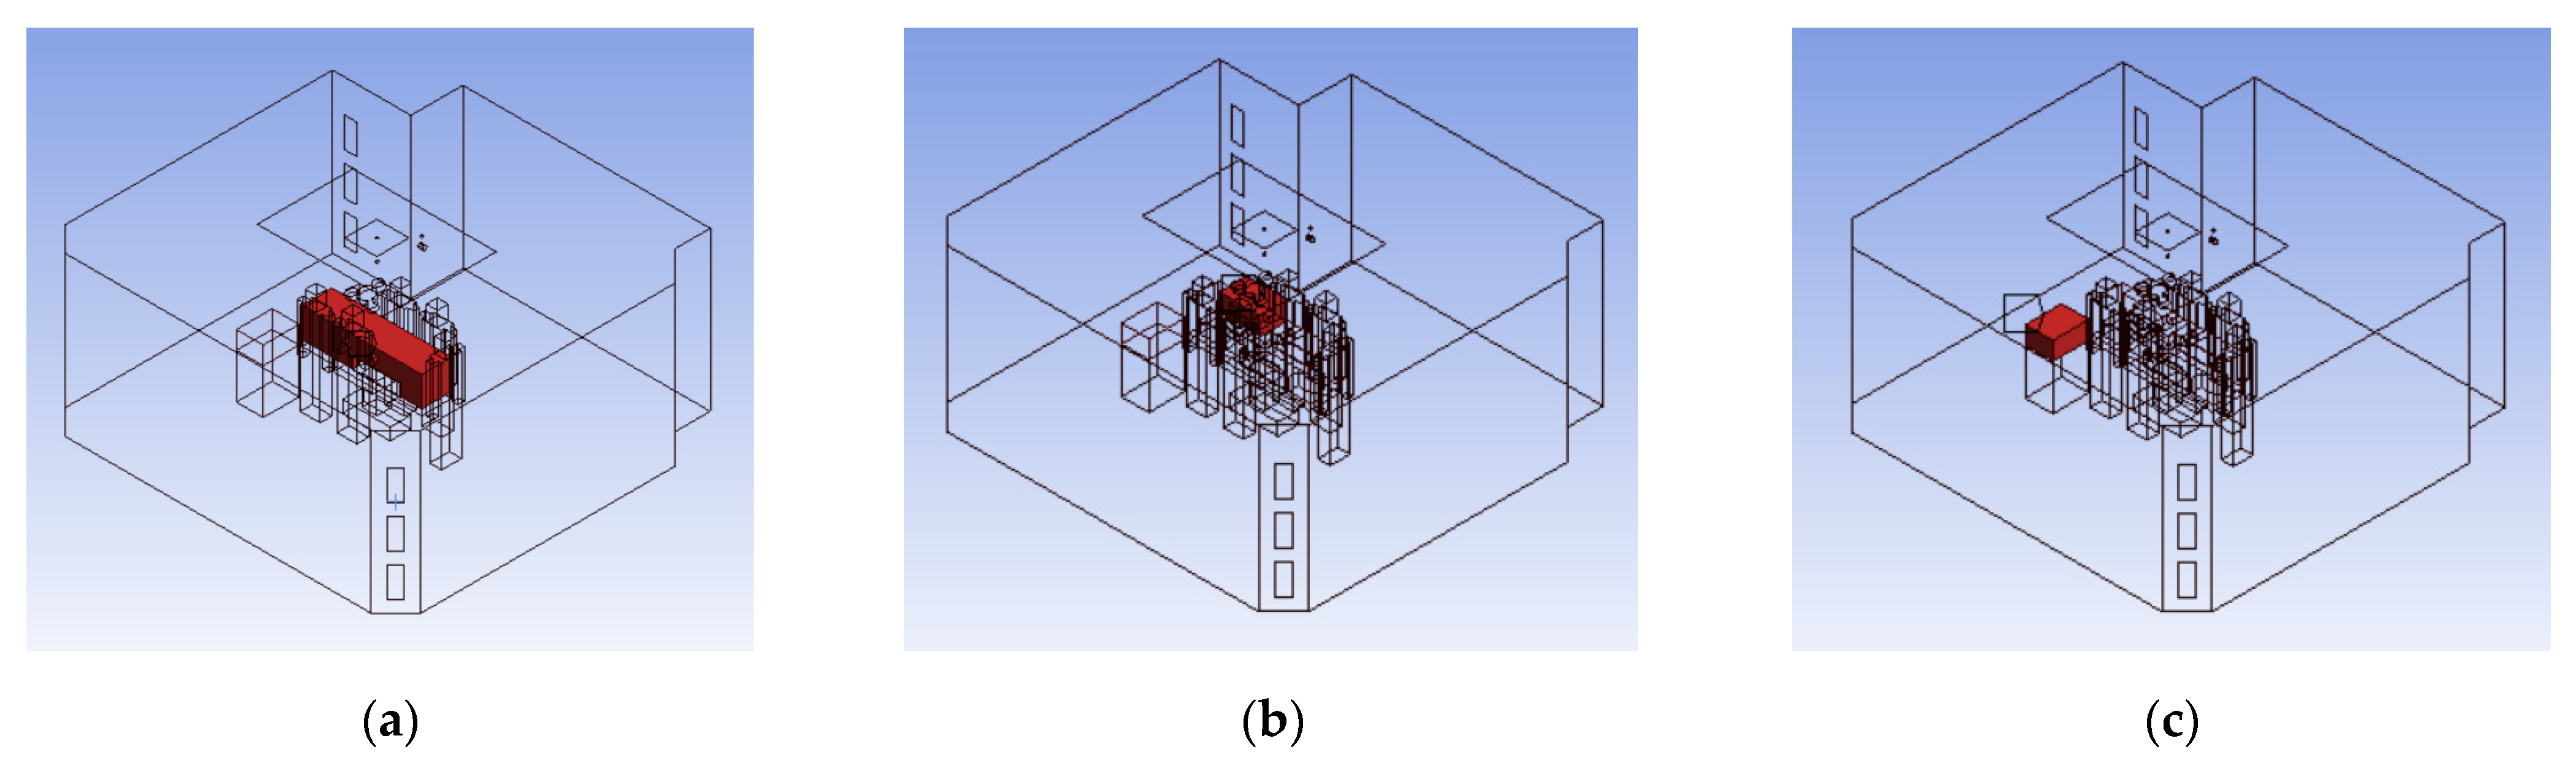
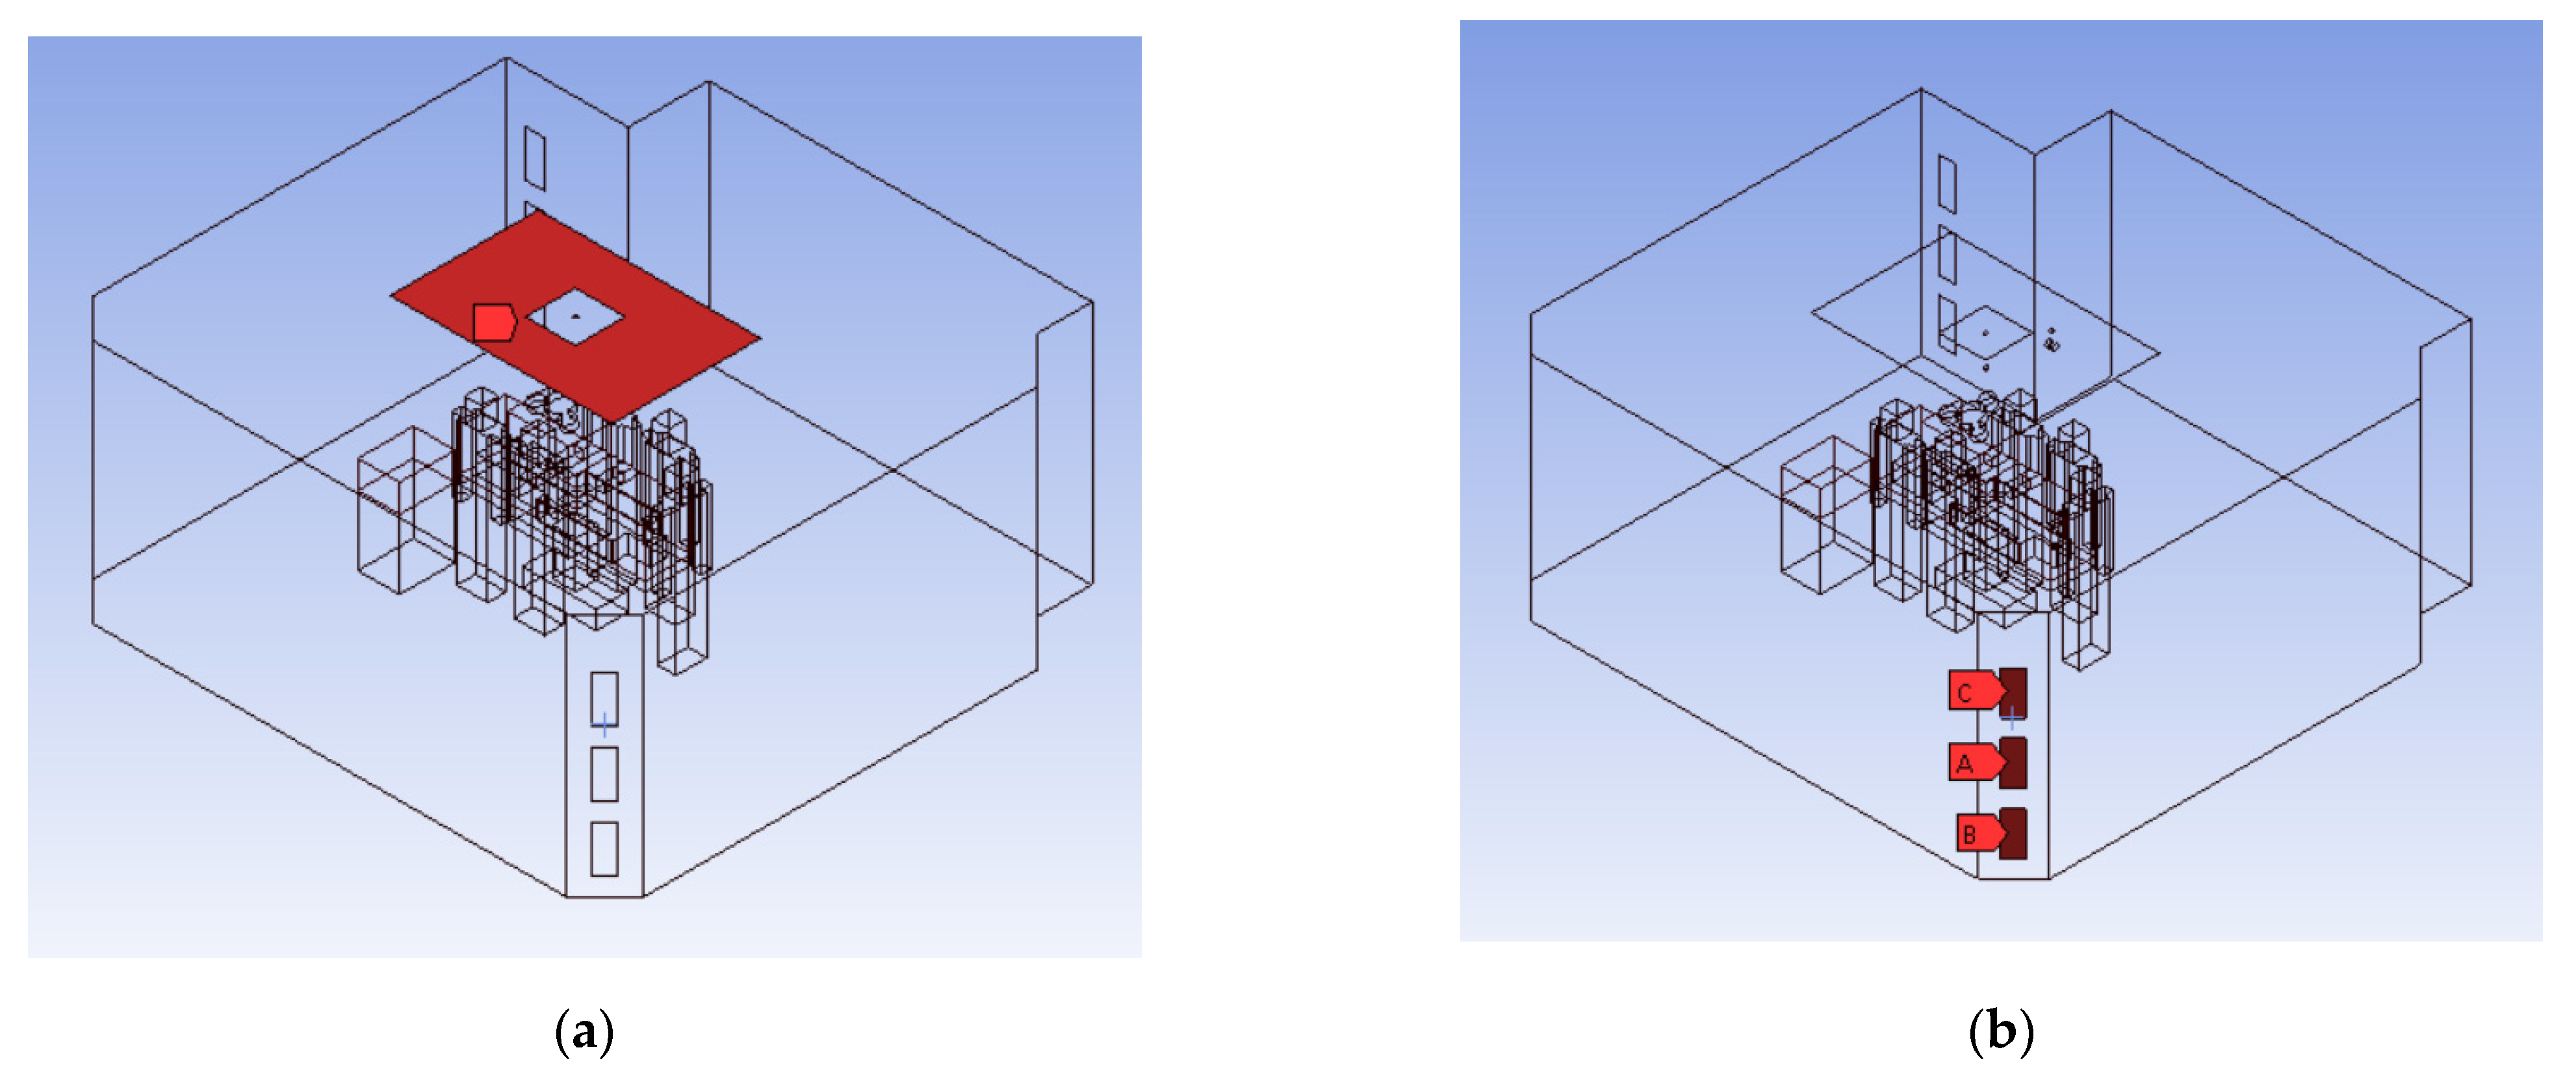
2.1.1. Model
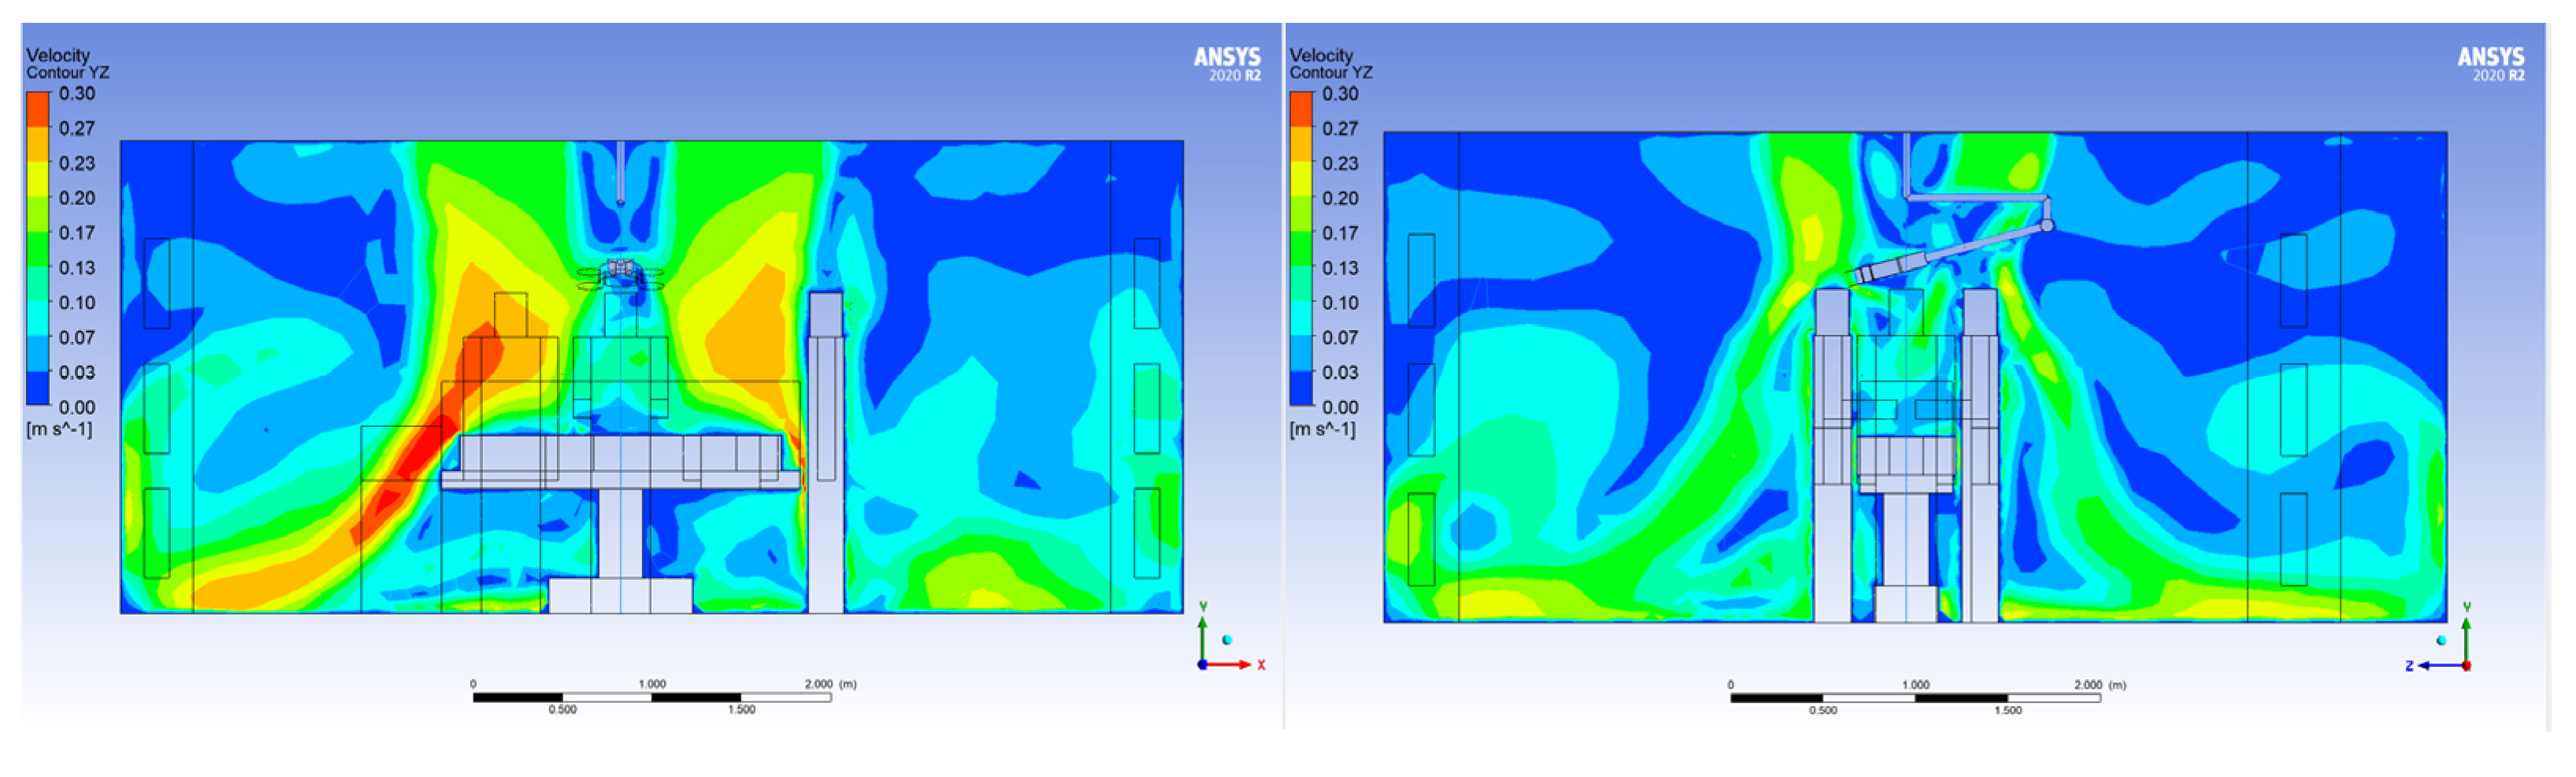
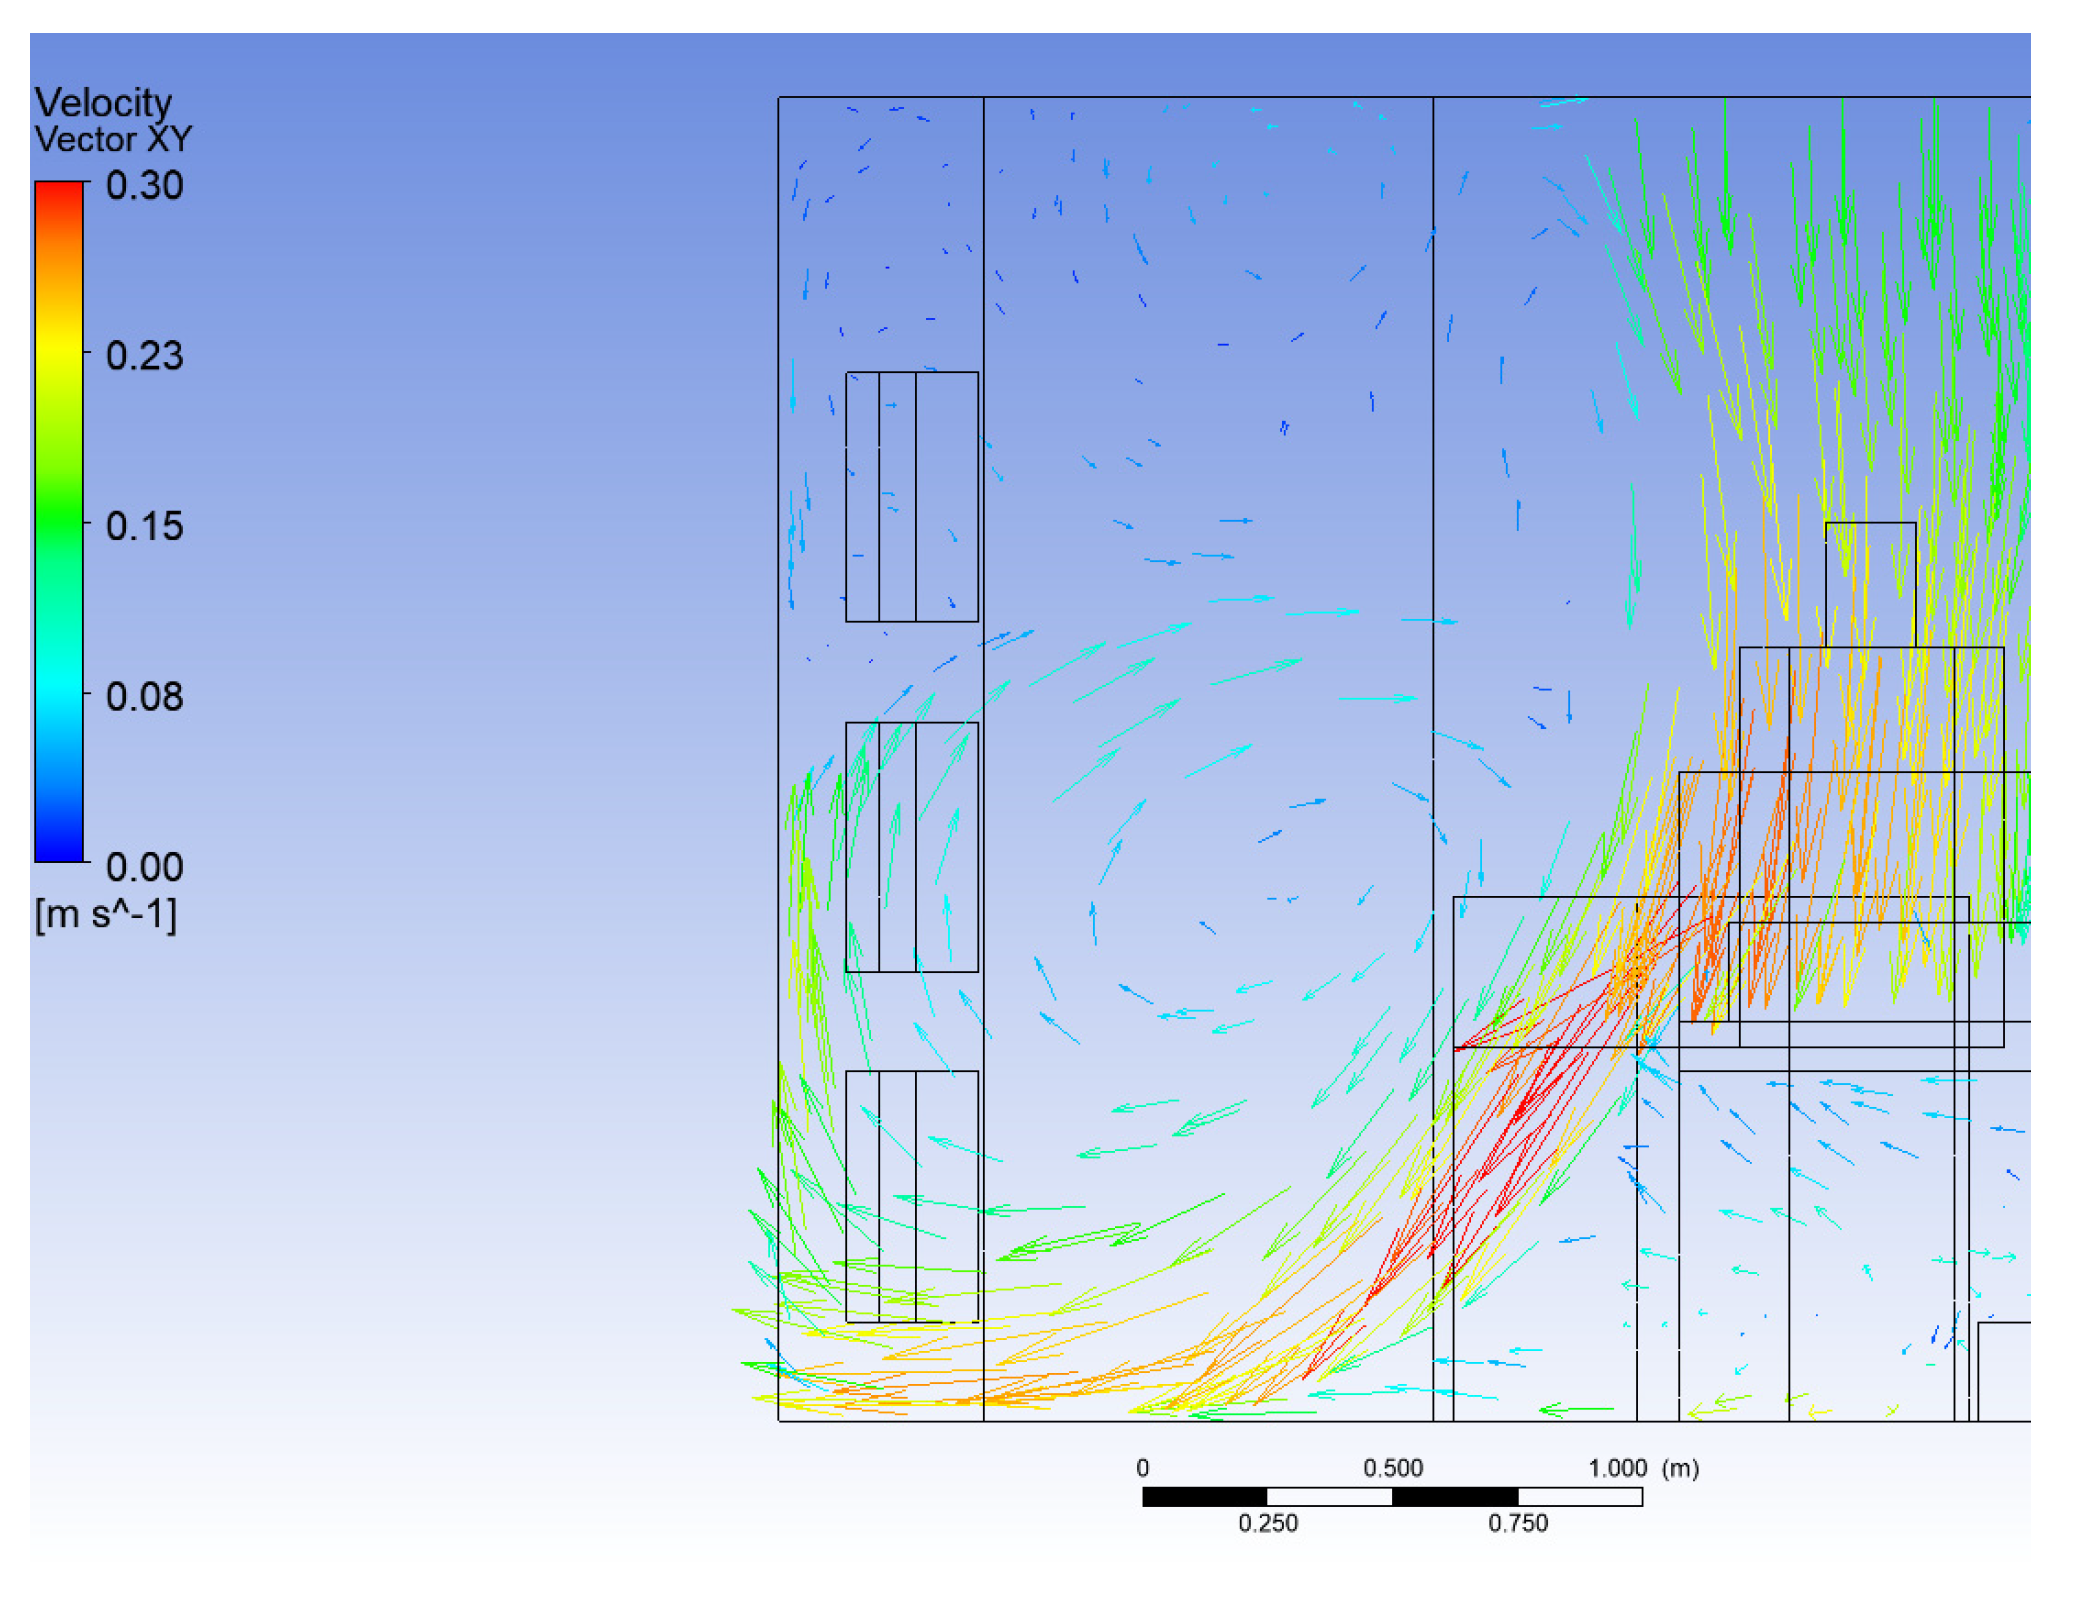
2.1.2. Results
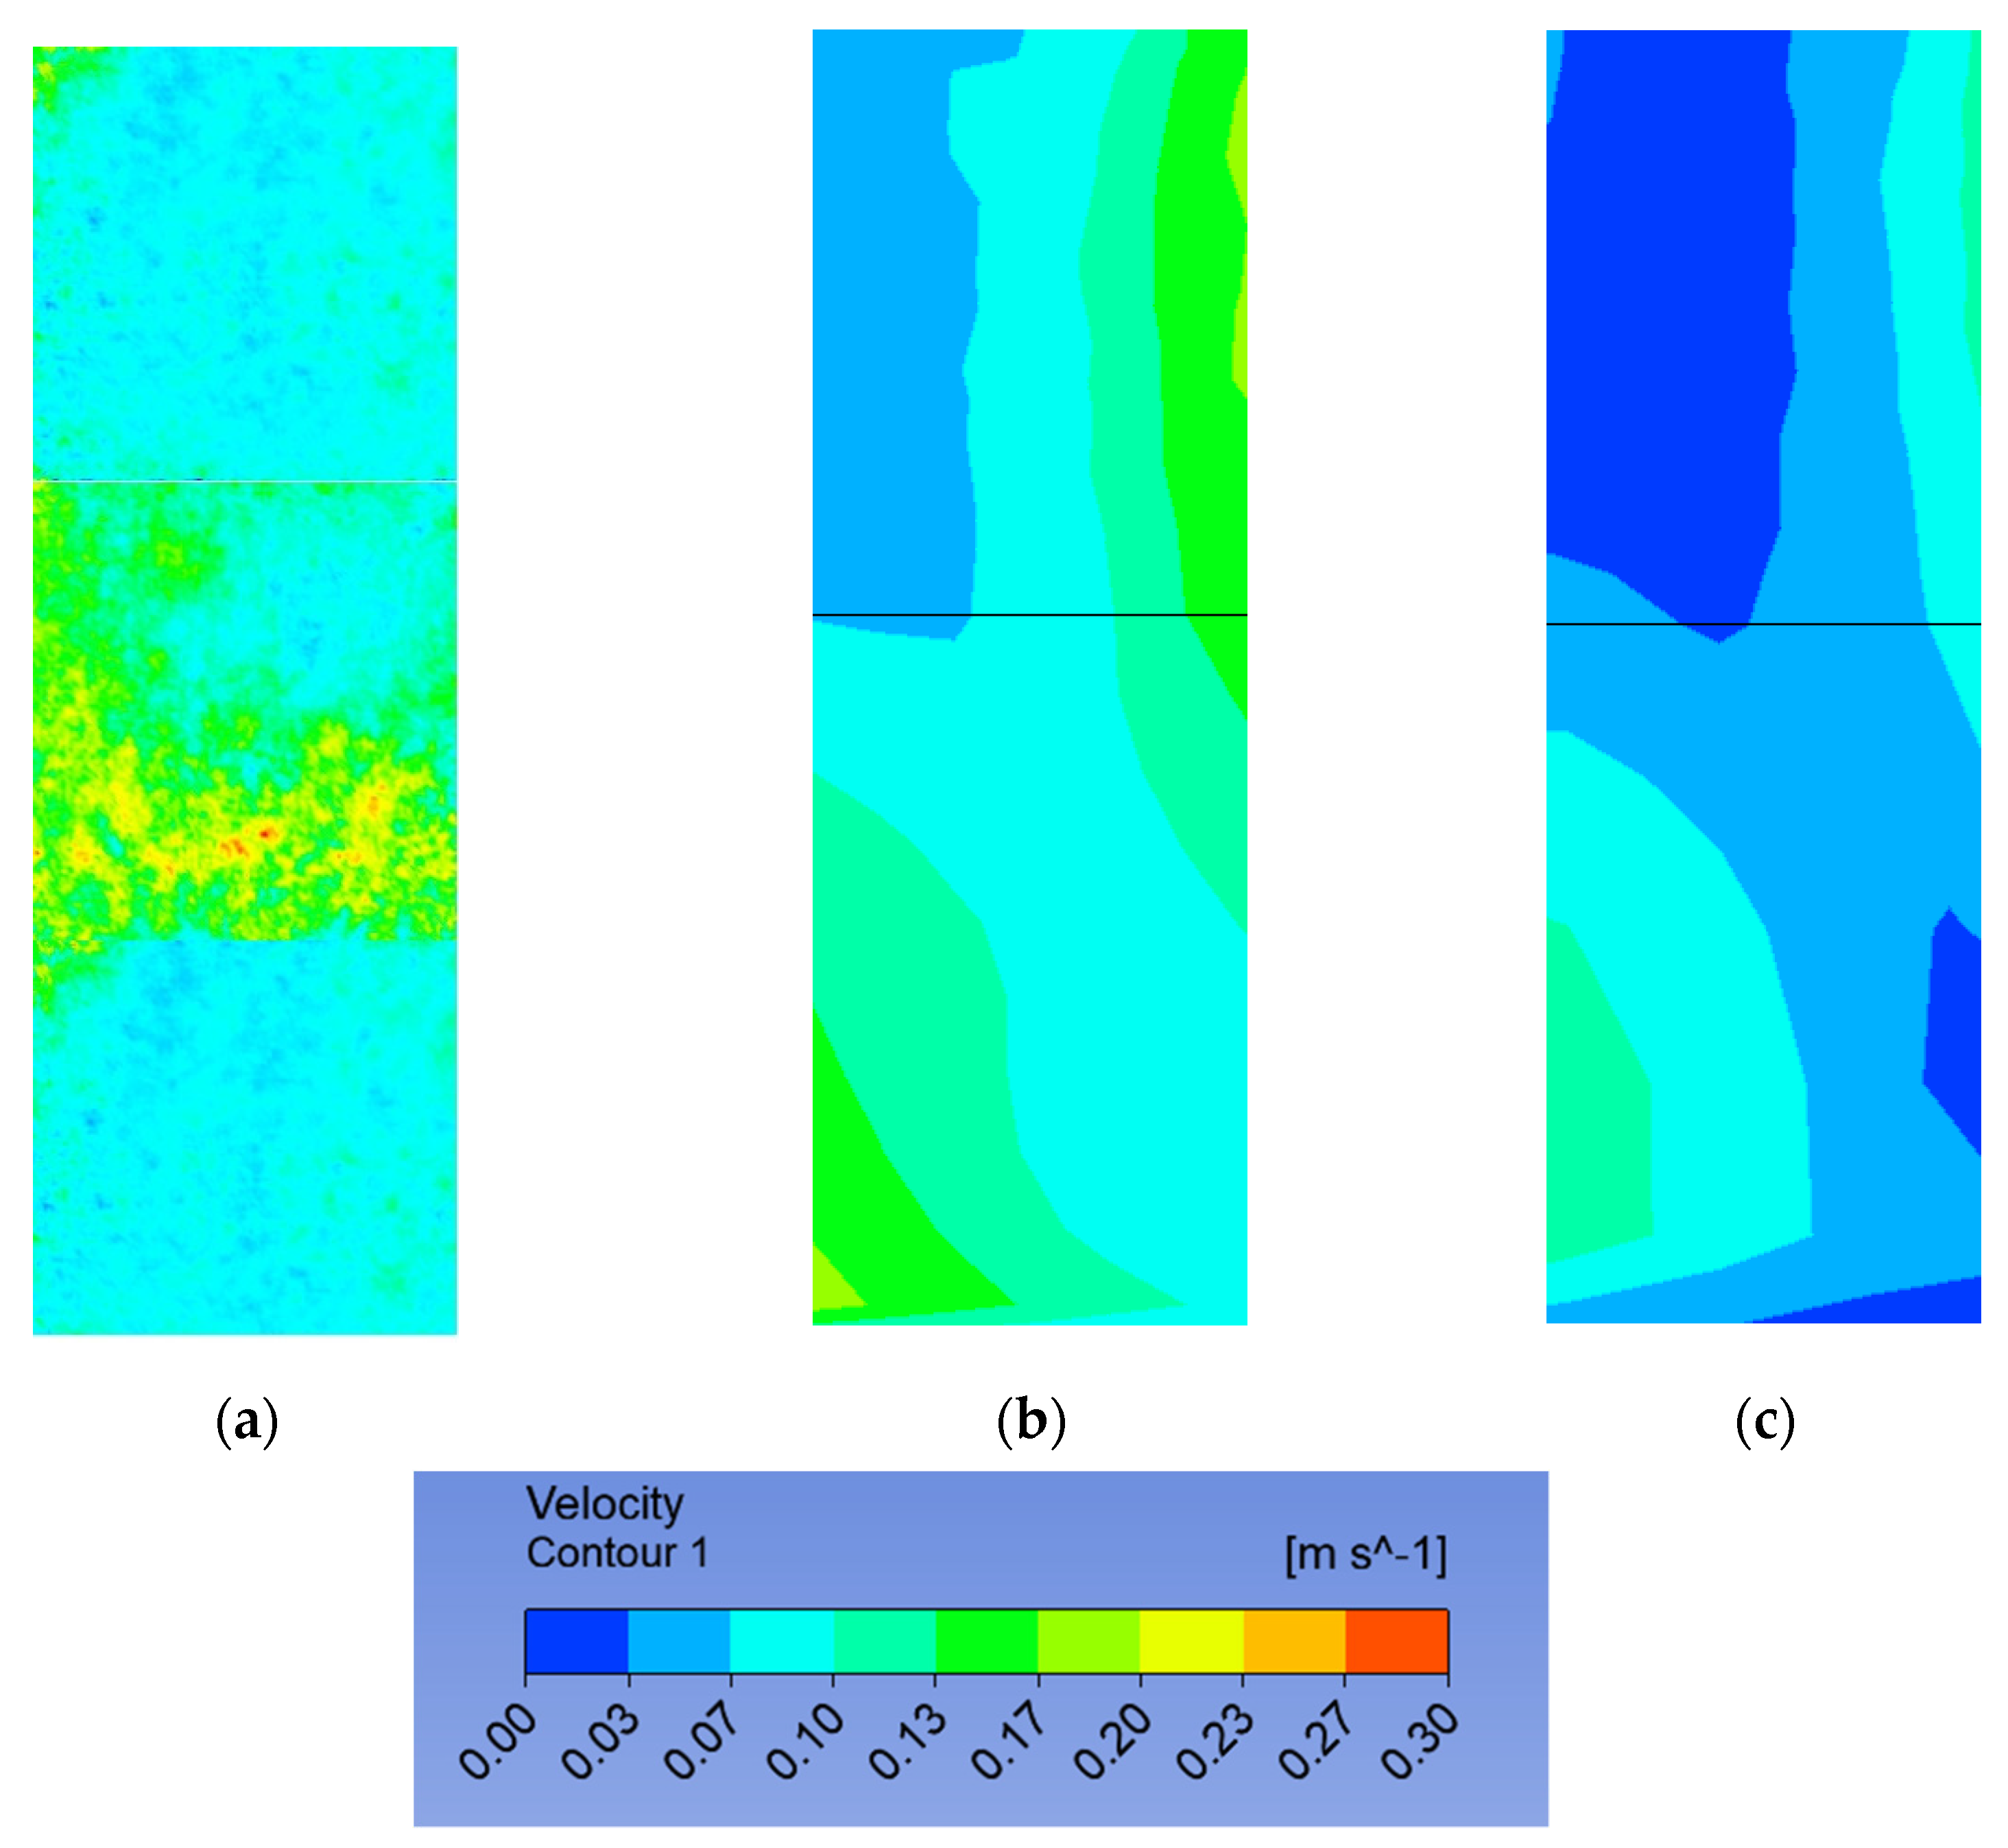
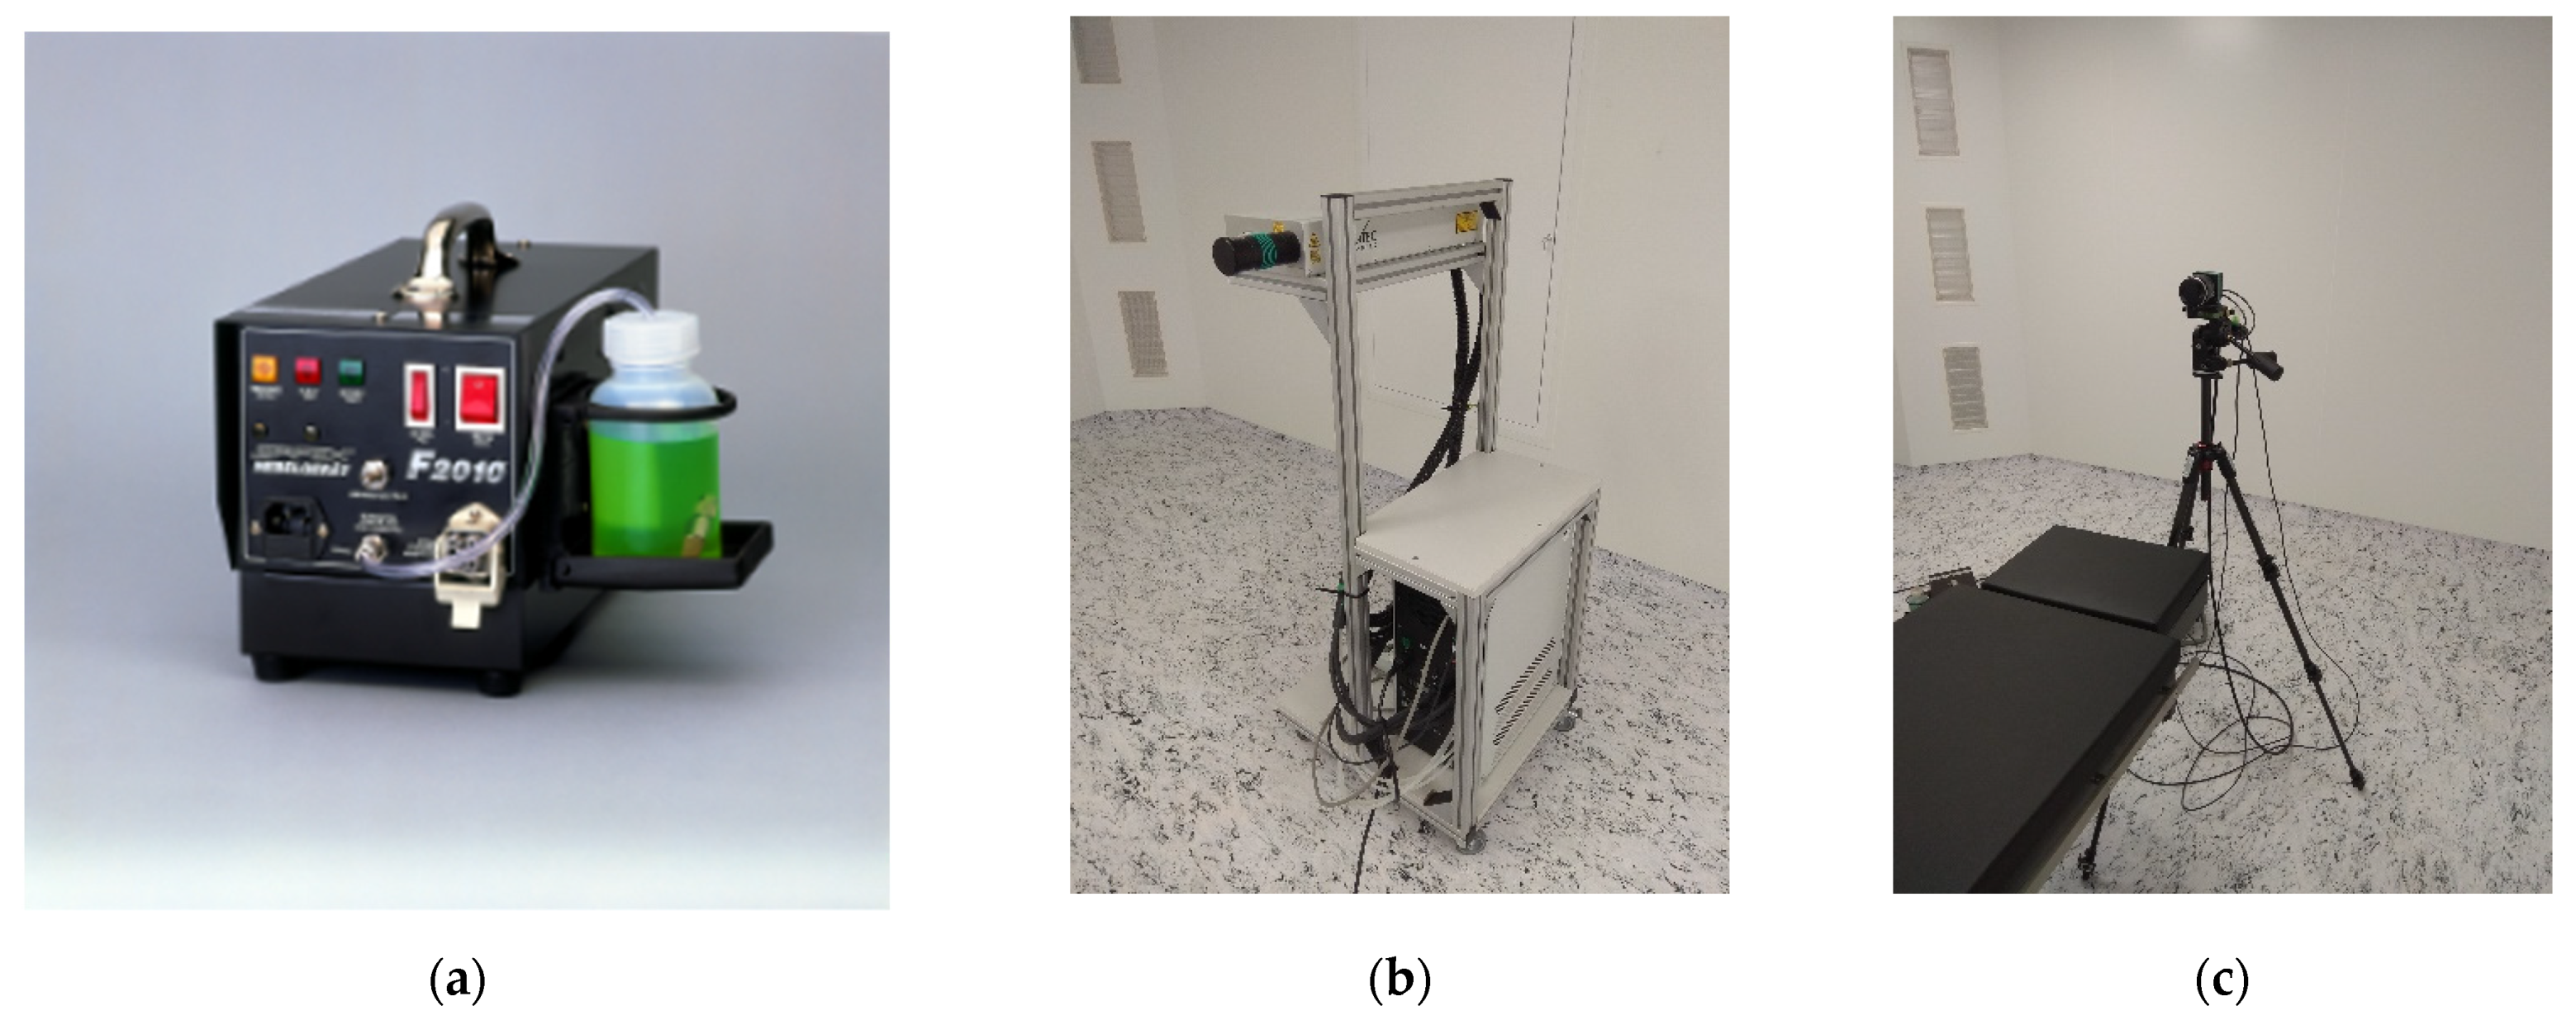
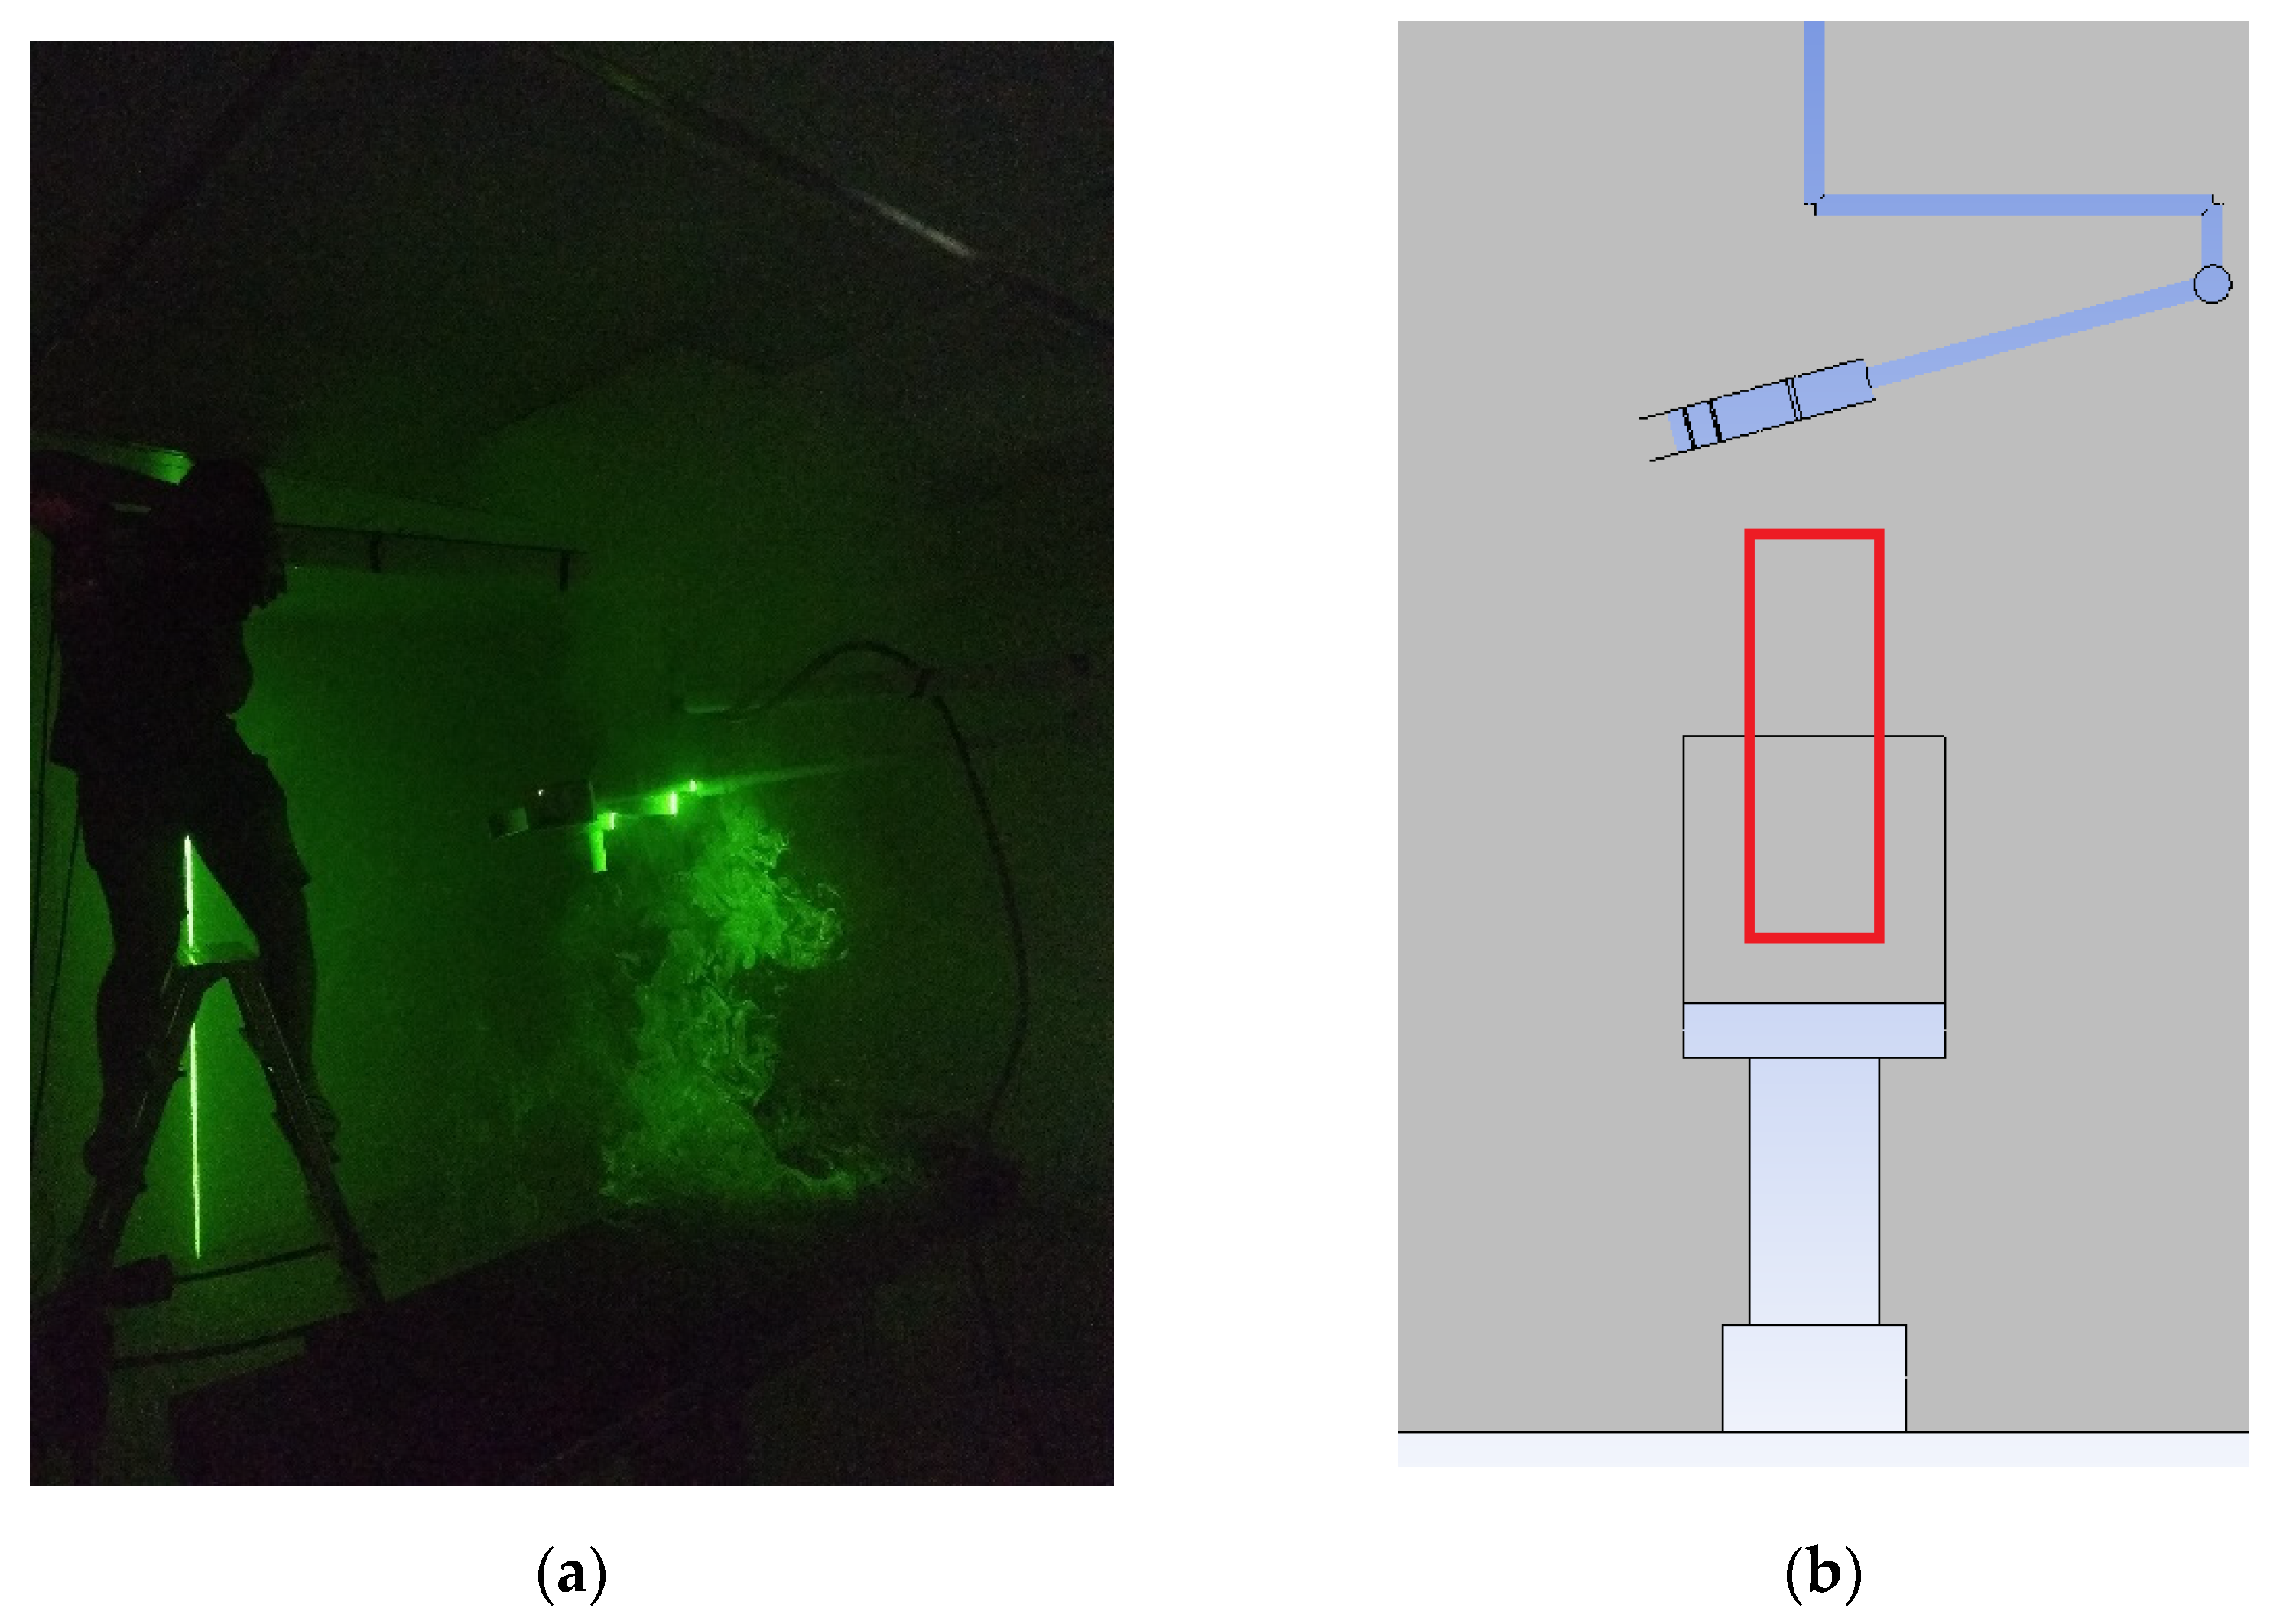
2.2. Verification of Air Flow in CFD Simulation Using the PIV Method
3. Discussion
4. Conclusions
Author Contributions
Funding
Institutional Review Board Statement
Informed Consent Statement
Data Availability Statement
Conflicts of Interest
References
- EU. ANNEX 1 Manufacture of Sterile Medicinal Products; No. November; European Commission: Brussels, Belgium, 2008; Volume 4, pp. 1–16. [Google Scholar]
- Khoo, C.Y.; Lee, C.-C.; Hu, S.-C. An experimental study on the influences of air change rate and free area ratio of raised-floor on cleanroom particle concentrations. Build. Environ. 2012, 48, 84–88. [Google Scholar] [CrossRef]
- Fedotov, A. Saving energy in cleanrooms. Cleanroom Technol. 2014, 22, 14–18. [Google Scholar]
- Tschudi, W.; Xu, T. Cleanroom energy benchmarking results. ASHRAE Trans. 2002, 109, 733–739. [Google Scholar]
- Kircher, K.; Shi, X.; Patil, S.; Zhang, K.M. Cleanroom energy efficiency strategies: Modeling and simulation. Energy Build. 2010, 42, 282–289. [Google Scholar] [CrossRef]
- ISO 14644-1; Cleanrooms and Associated Controlled Environments—Part 1: Classification of Air Cleanliness; ISO: Geneva, Switzerland, 2015.
- Department of Health. Making Best Use of Medicines, Report, UK. 2011. p. 16. Available online: https://assets.publishing.service.gov.uk/government/uploads/system/uploads/attachment_data/file/216705/dh_129216.pdf (accessed on 22 October 2021).
- Birks, S. Opinion ACRs—Time for change? Cosmetics Business. 2013. Available online: https://www.cosmeticsbusiness.com/news/article_page/Opinion_ACRs__Time_for_change/89740 (accessed on 27 October 2021).
- Hu, S.-C.; Chuah, Y. Power consumption of semiconductor fabs in Taiwan. Energy 2003, 28, 895–907. [Google Scholar] [CrossRef]
- Hu, S.; Chuah, Y.; Yen, M. Design and evaluation of a minienvironment for semiconductor manufacture processes. Build. Environ. 2002, 37, 201–208. [Google Scholar] [CrossRef]
- Nada, S.; Elfeky, K. Experimental investigations of thermal managements solutions in data centers buildings for different arrangements of cold aisles containments. J. Build. Eng. 2016, 5, 41–49. [Google Scholar] [CrossRef]
- Sun, W.; Mitchell, J.; Flyzik, K.; Hu, S.C.; Liu, J.; Vijayakumar, R.; Fukuda, H. Development of cleanroom required airflow rate model based on establishment of theoretical basis and lab validation. ASHRAE Trans. 2010, 116, 87–97. [Google Scholar]
- Chuah, Y.; Tsai, C.-H.; Hu, S. Simultaneous control of particle contamination and VOC pollution under different operating conditions of a mini-environment that contains a coating process. Build. Environ. 2000, 35, 91–99. [Google Scholar] [CrossRef]
- Murakami, S.; Kato, S.; Nagano, S.; Tanaka, Y. Diffusion characteristics of airborne particles with gravitational settling in a convection-dominant indoor flow field. ASHRAE Trans. 1992, 98, 82–97. [Google Scholar]
- Zhao, B.; Wu, J. Numerical Investigation of Particle Diffusion in a Clean Room. Indoor Built Environ. 2005, 14, 469–479. [Google Scholar] [CrossRef]
- Sartor, D.; Lowell, C.; Blumstein, C. Cleanrooms and Laboratories for High Tech Industries, Final Report; California Energy Commission: Sacramento, CA, USA, 1999. [Google Scholar]
- Mills, E.; Bell, G.; Sartor, D.; Chen, A.; Avery, D.; Siminovitch, M.; Greenberg, S.; Marton, G.; de Almeida, A.; Lock, L.E. Energy Efficiency in California Laboratory-Type Facilities; LBNL-39061; Lawrence Berkeley National Laboratory: Berkeley, CA, USA, 1996. [Google Scholar]
- Tschudi, W.; Sartor, D.; Mills, E.; Xu, T. High-Performance Laboratories and Cleanrooms; LBNL-50599; Lawrence Berkeley National Laboratory: Berkeley, CA, USA, 2002. [Google Scholar]
- Loomans, M.G.L.C.; Molenaar, P.C.A.; Kort, H.S.M.; Joosten, P.H. Energy demand reduction in pharmaceutical cleanrooms through optimization of ventilation. Energy Build. 2019, 202, 109346. [Google Scholar] [CrossRef]
- Tschudi, W.; Mills, E.; Tenfang, X.; Rumsey, P. Measuring and managing cleanroom energy use. Heat. Pip. Air Cond. Eng. 2005, 77, 29–35. [Google Scholar]
- Faulkner, D.; Fisk, W.J.; Walton, J.T. Energy savings in cleanrooms from demand-controlled filtration. Indoor Environ. 1996, 39, 21–27. [Google Scholar] [CrossRef]
- Faulkner, D.; DiBartolomeo, D.; Wang, D. Demand Controlled Filtration in an Industrial Cleanroom; LBNL-63420; Lawrence Berkeley National Laboratory: Berkeley, CA, USA, 2007; p. 11. [Google Scholar]
- Tschudi, W.; Faulkner, D.; Hebert, A. Energy efficiency strategies for cleanrooms without compromising environmental conditions, Part 2. ASHRAE Trans. 2005, 111, 637–645. [Google Scholar]
- Sharp, G.P. Demand-based control for lab ventilation. Cleanroom Technol. 2013, 21, 29–33. [Google Scholar]
- Hu, S.-C.; Shiue, A. Validation and application of the personnel factor for the garment used in cleanrooms. Build. Environ. 2016, 97, 88–95. [Google Scholar] [CrossRef] [Green Version]
- Xu, T. Efficient Airflow Design for Cleanrooms Improves Business Bottom Lines. In Proceedings of the Efficient Airflow Design for Cleanrooms Improves Business Bottom Lines, Berkeley, CA, USA, 5 January 2003. [Google Scholar]
- U.S. Federal Standard FS209; Clean Room and Work Station Requirements, Controlled Environment; General Services Administration: Washington, DC, USA, 1973.
- IEST-RP-CC012: CONSIDERATIONS IN CLEANROOM DESIGN. Available online: https://www.iest.org/Standards-RPs/Recommended-Practices/IEST-RP-CC012 (accessed on 4 January 2022).
- ISO 14644-4; Cleanrooms and Associated Controlled Environments—Part 4: Design, Construction and Start-Up; ISO: Geneva, Switzerland, 2004.
- Heidrich, T.; Alimi, A.; Grothues, L.; Hesselbach, J.; Wünsch, O. Cross-flowing displacement ventilation system for conveyor belts in the food industry. Energy Build. 2018, 179, 213–222. [Google Scholar] [CrossRef]
- Zhao, F.-Y.; Cheng, J.; Liu, B.; Huang, Z.-R.; Li, X. Indoor airflow and pollutant spread inside the cleanroom with micro-porous supplying panel and different ventilation schemes: Analytical, numerical and experimental investigations. J. Build. Eng. 2020, 31, 101405. [Google Scholar] [CrossRef]
- Zhao, F.-Y.; Cheng, J.; Liu, B.; Huang, Z.-R.; Zhang, Y.-J.; Li, X. Regional flow motion and heat energy balance analysis of a 10,000 class pharmaceutical cleanroom with secondary return air conditioning system. Int. J. Refrig. 2021, 129, 237–249. [Google Scholar] [CrossRef]
- Brown, W.K.; Lynn, C.A. Fundamental clean room concepts. ASHRAE Trans. 1986, 92, 272–287. [Google Scholar]
- Jaisinghani, R.A. Air handling considerations for cleanrooms. In Proceedings of the InterPhex Conference, Philadelphia, PA, USA, 20–22 March 2001; p. 15. [Google Scholar]
- Kozicki, M.; Robinson, P.; Hoenig, S.A. Cleanrooms, Facilities and Practices; Van Nostrand Reinhold: New York, NY, USA, 1991; ISBN 9401179514. [Google Scholar]
- Morrison, P.W. Environmental Control in Electronic Manufacturing; Van Nostrand Reinhold: New York, NY, USA, 1973; ISBN 0442255640. [Google Scholar]
- Villafruela, J.M.; Castro, F.; José, J.F.S.; Saint-Martin, J. Comparison of air change efficiency, contaminant removal effectiveness and infection risk as IAQ indices in isolation rooms. Energy Build. 2013, 57, 210–219. [Google Scholar] [CrossRef]
- Häkkinen, T.; Kuittinen, M.; Ruuska, A.; Jung, N. Reducing embodied carbon during the design process of buildings. J. Build. Eng. 2015, 4, 1–13. [Google Scholar] [CrossRef]
- Zhang, R.; Tu, G.B.; Ling, J.H. Study on biological contaminant control strategies under different ventilation models in hospital operating room. Build. Environ. 2008, 43, 793–803. [Google Scholar]
- Tao, Y.; Gou, Z.; Yu, Z.; Fu, J.; Chen, X. The challenge of creating age-friendly indoor environments in a high-density city: Case study of Hong Kong’s care and attention homes. J. Build. Eng. 2020, 30, 101280. [Google Scholar] [CrossRef]
- Noh, K.C.; Kim, H.S.; Oh, M.D. Study on contamination control in a minienvironment inside clean room for yield enhancement based on particle concentration measurement and airflow CFD simulation. Build. Environ. 2010, 45, 825–831. [Google Scholar] [CrossRef]
- Xu, T. Characterization of minienvironments in a clean room: Design characteristics and environmental performance. Build. Environ. 2007, 42, 2993–3000. [Google Scholar] [CrossRef]
- Cheng, M.; Liu, G.; Cai, K.W.; Lee, E. Approaches for improving airflow uniformity in unidirectional flow cleanrooms. Build. Environ. 1998, 34, 275–284. [Google Scholar] [CrossRef]
- Cleanroom Technology. Study into Human Particle Shedding. 2011. Available online: https://www.cleanroomtechnology.com/news/article_page/Study_into_human_particle_shedding/62768 (accessed on 4 August 2021).
- Kim, C.; Cho, K.; Pui, D.Y.H. Investigation of Airborne Molecular Contamination in Cleanroom Air Environment through Portable Soft X-Ray Radiolysis Detector. Appl. Sci. 2020, 10, 978. [Google Scholar] [CrossRef] [Green Version]
- Chen, Q.; Srebric, J. A Procedure for Verification, Validation, and Reporting of Indoor Environment CFD Analyses. HVAC&R Res. 2002, 8, 201–216. [Google Scholar] [CrossRef]
- Naosungeon, J.; Thongsri, J. Simulation of Airflow in a Cleanroom to Solve Contamination Problem in an HDD Production Line. Int. J. Mech. Eng. Robot. Res. 2018, 7, 41–45. [Google Scholar]
- Novoselac, A.; Srebric, J. Comparison of air exchange efficiency and contaminant removal effectiveness as IAQ indices. ASHRAE Trans. 2003, 109, 339–349. [Google Scholar]
- Li, X.P.; Niu, J.L.; Gao, N.P. Spatial distribution of human respiratory droplet residuals and exposure risk for the co-occupant under different ventilation methods. HVAC&R Res. 2011, 17, 432–455. [Google Scholar]
- Zhang, L.; Li, Y. Dispersion of coughed droplets in a fully-occupied high-speed rail cabin. Build. Environ. 2012, 47, 58–66. [Google Scholar] [CrossRef]
- Lee, I.; Lee, S.; Kim, G.; Sung, J.; Sung, S.; Yoon, Y. Piv verification of greenhouse ventilation air flows to evaluate cfd accuracy. Trans. ASAE 2005, 48, 2277–2288. [Google Scholar] [CrossRef]
- Menter, F.R. Zonal Two Equation k- ω Turbulence Models for Aerodynamic Flows. In Proceedings of the 24th Fluid Dynamics Conference, Orlando, FL, USA, 6–9 July 1993. AIAA Paper 93-2906. [Google Scholar]
- Menter, F.R. Two-equation eddy-viscosity turbulence models for engineering applications. AIAA J. 1994, 32, 1598–1605. [Google Scholar] [CrossRef] [Green Version]
- Pope, S.B. Turbulent Flows; Cambridge University Press: Cambridge, UK, 2000; ISBN 978-0521598866. [Google Scholar]
- Energy management. Available online: https://www.sciencedirect.com/science/article/pii/S0378778819308102 (accessed on 20 January 2022).
- Foarde, K.; Hill, L.; Hanley, J. Measurement and Detection of Cleanroom Fabric Barrier and Shedding Properties. J. IEST 2000, 43, 26–31. [Google Scholar] [CrossRef]
- Whyte, W.; Bailey, P.V. Reduction of microbial dispersion by clothing. PDA J. Pharm. Sci. Technol. 1985, 39, 51–61. [Google Scholar]
- Whyte, W.; Bailey, P. Particle Dispersion in Relation to Clothing. J. IEST 1989, 32, 43–49. [Google Scholar] [CrossRef]
- Ljungqvist, B.; Reinmüller, B. Cleanroom Clothing Systems, Practical Safety Ventilation in Pharmaceutical and Biotech Cleanrooms; Parenteral Drug Association: Bethesda, MD, USA, 2006; pp. 57–76. [Google Scholar]
- Vokac, Z.; Køpke, V.; Keül, P. Assessment and Analysis of the Bellows Ventilation of Clothing. Text. Res. J. 1973, 43, 474–482. [Google Scholar] [CrossRef]
- Klepeis, N.E.; Nelson, W.C.; Ott, W.R.; Robinson, J.P.; Tsang, A.M.; Switzer, P.; Behar, J.V.; Hern, S.C.; Engelmann, W.H. The National Human Activity Pattern Survey (NHAPS): A resource for assessing exposure to environmental pollutants. J. Expo. Sci. Environ. Epidemiol. 2001, 11, 231–252. [Google Scholar] [CrossRef] [PubMed] [Green Version]
- Whyte, W. Cleanroom Design, 2nd ed.; John Wiley & Sons Ltd.: Choichester, UK, 1999; ISBN 0-471-94294-9. [Google Scholar]


Publisher’s Note: MDPI stays neutral with regard to jurisdictional claims in published maps and institutional affiliations. |
© 2022 by the authors. Licensee MDPI, Basel, Switzerland. This article is an open access article distributed under the terms and conditions of the Creative Commons Attribution (CC BY) license (https://creativecommons.org/licenses/by/4.0/).
Share and Cite
Mičko, P.; Hečko, D.; Kapjor, A.; Nosek, R.; Kolková, Z.; Hrabovský, P.; Kantová, N.Č. Impact of the Speed of Airflow in a Cleanroom on the Degree of Air Pollution. Appl. Sci. 2022, 12, 2466. https://doi.org/10.3390/app12052466
Mičko P, Hečko D, Kapjor A, Nosek R, Kolková Z, Hrabovský P, Kantová NČ. Impact of the Speed of Airflow in a Cleanroom on the Degree of Air Pollution. Applied Sciences. 2022; 12(5):2466. https://doi.org/10.3390/app12052466
Chicago/Turabian StyleMičko, Pavol, Dávid Hečko, Andrej Kapjor, Radovan Nosek, Zuzana Kolková, Peter Hrabovský, and Nikola Čajová Kantová. 2022. "Impact of the Speed of Airflow in a Cleanroom on the Degree of Air Pollution" Applied Sciences 12, no. 5: 2466. https://doi.org/10.3390/app12052466
APA StyleMičko, P., Hečko, D., Kapjor, A., Nosek, R., Kolková, Z., Hrabovský, P., & Kantová, N. Č. (2022). Impact of the Speed of Airflow in a Cleanroom on the Degree of Air Pollution. Applied Sciences, 12(5), 2466. https://doi.org/10.3390/app12052466