Article

Potential of Deep Learning Methods for Deep Level Particle Characterization in Crystallization

1
Laboratory of Plant and Process Design, TU Dortmund University, Emil-Figge-Strasse 70, 44227 Dortmund, Germany
2
Chair of Computer Graphics, TU Dortmund University, Otto-Hahn-Straße 16, 44221 Dortmund, Germany
*
Author to whom correspondence should be addressed.
These authors contributed equally to this work.
Appl. Sci. 2022, 12(5), 2465; https://doi.org/10.3390/app12052465
Submission received: 21 January 2022 / Revised: 18 February 2022 / Accepted: 23 February 2022 / Published: 26 February 2022
(This article belongs to the Special Issue Advances in Digital Image Processing)

Abstract

:
Crystalline particle properties, which are defined throughout the crystallization process chain, are strongly tied to the quality of the final product bringing along the need of detailed particle characterization. The most important characteristics are the size, shape and purity, which are influenced by agglomeration. Therefore, a pure size determination is often insufficient and a deep level evaluation regarding agglomerates and primary crystals bound in agglomerates is desirable as basis to increase the quality of crystalline products. We present a promising deep learning approach for particle characterization in crystallization. In an end-to-end fashion, the interactions and processing steps are minimized. Based on instance segmentation, all crystals containing single crystals, agglomerates and primary crystals in agglomerates are detected and classified with pixel-level accuracy. The deep learning approach shows superior performance to previous image analysis methods and reaches a new level of detail. In experimental studies, L-alanine is crystallized from aqueous solution. A detailed description of size and number of all particles including primary crystals is provided and characteristic measures for the level of agglomeration are given. This can lead to a better process understanding and has the potential to serve as cornerstone for kinetic studies.

1. Introduction

Crystallization is extensively used in the fine chemical and pharmaceutical industry and represents a key process step towards the final product [1]. To achieve product characteristics of high purity and reproducible defined particle size, the crystallization phenomena must be understood and the process parameters must be tuned during crystallization based on this knowledge. In addition to the primary crystallization phenomena of nucleation and growth, secondary phenomena such as breakage and agglomeration must also be considered. Agglomeration, which is caused by collision and subsequent cementation by solid bridges [2], can have a significant and irreversible effect on the final product. In some cases, e.g., spherical agglomeration, agglomeration is desired to improve processability [3]. In most cases, however, agglomeration should be prevented. By irreversibly assembling of primary crystals to agglomerates the particle sizes and particle size distribution (PSD) are affected in an undesired manner to larger particles sizes and a broader PSD impacting bio availability and processing [4]. Additionally, by the interaction of different crystals, liquid inclusions such as mother liquor entrapment is inevitable and can reduce purity [5].
Whereas nucleation and growth can be depicted quite well these days, agglomeration is still challenging due to complex interactions [6]. Many influencing factors can impact one of the three main steps of agglomeration, the collision, the formation of aggregates by molecular interactions and finally the cementation by solid bridges. These levers can be influenced by various parameters: process parameters, such as agitation rate, supersaturation, saturation temperature and solid content [6,7,8]; system properties, e.g., particle size [9], solvent and impurities [1,4,7]. For understanding the agglomeration process and dependencies on parameters, first the challenge of measuring agglomeration must be overcome.
Until now, agglomeration kinetics are determined by fitting PSD data without any knowledge about the appearance of agglomerates and single crystals [10,11]. Image analysis is promising to characterize crystals’ shape and size on a microscopic scale. In the literature there already exist publications, which distinguish between single crystals and agglomerates [12,13], but a deeper crystal characterization up to the level of primary crystals is desired to obtain important information for agglomeration behavior and kinetics of a crystallization system. Primary crystals are all crystals that originated from nucleation. So they sum up all single crystals and all primary crystals forming an agglomerate (pcag). The main contribution of this work is that not only the agglomerates (ag) and single crystals (sc) are determined, but also information about primary crystals (pc) are provided for the first time. By recognizing the primary crystals in crystallization, the goal is to better characterize the phenomenon of agglomeration and process parameters influencing agglomeration so that the crystallization process can be optimized later on to gain high-quality, less agglomerated products.
As basis for the detailed product characterization a sophisticated deep learning image analysis is developed based on flow cell microscopy and the Mask-RCNN method [14]. Here, different variants of Mask-RCNN are elaborated and used for instance segmentation identifying ag, sc, pcag on a pixel level. To compare the performance of image segmentation, a comparison with an already existing image processing by Heisel et al. [15] is provided. Only the differentiation between ag and sc are considered because the method of Heisel is not capable of detecting pcag. The developed image analysis with the novelty of characterizing primary crystals in agglomerates is then applied to batch cooling crystallizations of L-alanine in aqueous solution under different process conditions. Images are taken after the process with flow cell microscopy and are evaluated with the developed deep learning approach. Besides the conventional methods of defining particle size and PSD of all crystals, particular attention is paid to the subpopulations. Especially, the subpopulation of agglomerates is characterized in detail with the new opportunity of quantifying the primary crystals. The detected primary crystals are evaluated extensively. Conclusions are drawn about the number and size of primary crystals in agglomerates and new characteristic measures are developed based on these results to characterize the agglomeration behavior of the model system.

2. State of the Art

Image analysis consists of two major coupled steps, the image acquisition as well as the image processing to determine the desired particle attributes. Images can be recorded in various ways. On the one hand, offline measurements are conducted, which are characterized by time- and labor-intensive sample preparation and potential change in particle properties, e.g., size and agglomeration degree due to downstream processes [16,17]. Instead, automated measurements are aimed for fast dynamic image acquisition, which can be implemented in the crystallization process later on. A detailed overview about applications and publications of image acquisition set ups during crystallization is provided by Galata et al. [18] and is out of the scope for this work in such a detailed manner.
In-line set ups record images with a probe directly inside the crystallizer, such as the PVM from Mettler Toledo or from outside the crystallizer, e.g., Chuo et al. [19] and Huo et al. [20]. In-line acquisition is characterized by a very low up to no impact on the crystallization, but often by a reduced image quality as well. High solid concentration, which inevitably occurs in the course of crystallization, out of focus particles as well as inconsistent blurry and noisy background have to be tackled in the image processing, making it challenging [21].
Better-quality images are recorded with flow cell microscopy. Suspension is pumped directly from the crystallizer or storage tank through the flow cell where images are taken. By adjusting the flow cell, e.g., cell depth, and the solid content by dilution, images are acquired with uniform background, good contrast and adapted focus suitable for the investigated crystals. In this way, images can be taken after the process or online during crystallization. Nevertheless, it must be considered that flow cell microscopes coming along with the expense of a periphery that can potentially disturb the process [12]. For cooling crystallization, the periphery can only consist of a tempered sampling loop [7,22,23,24,25,26] or to adjust particle concentration by an additional dilution system [12,13,27].
Image processing is the next inevitable step to obtain the desired quality attributes of the product. It is by far not trivial and still many challenges have to be overcome, especially image processing is limited for high solid concentrations and in the level of detail regarding overlapping and agglomerated particles [28]. By identification of primary crystals in agglomerates instance segmentation is necessary including the steps detection of crystals and subsequent classification of the detected crystals.
To distinguish between objects and background, there are different segmentation approaches, e.g., the simplest methods, thresholding and edge detection [29]. For a more detailed characterization in terms of classification or identification of the crystal habit, machine learning methods including feature extraction, encoding and classification can be implemented. Based on extracted image features and the calculation of image descriptors such as roundness, elongation and many more, discriminant function analysis (DFA) [7,30], principal component analysis (PCA) [4,31,32] shallow neural nets [15,33,34] or support vector machine (SVM) [32,35] can be applied to differentiate between single crystals and non-single crystals. A more in detailed classification to distinguish between agglomerates with different number of bounded primary crystals has been performed by Ålander and Rasmuson [4] and by Ferreira et al. [7] by differentiating between medium and large agglomerates. Frei and Kruis [34] apply neural nets to additionally estimate not only the number but also the size of primary particles in agglomerated nano-particles. Other methods focusing on segmentation to disassemble crystal complexes into primary crystals. Either they are based on geometrical considerations [20,36,37,38,39] or take into account gray values of the image [40]. The mentioned segmentation and classification methods consist of multiple processing steps, many adjustable parameters and calculated features which must be chosen by the operator accordingly.
Deep learning methods are emerging, which are capable of solving all these tasks in a bundled and fast way. Depending on the application goal, different tasks from detection to classification and segmentation can be solved separately or in combined fashion in an end-to-end approach. The performance can often keep up with that of humans and even outperformed them recently on image classification [41]. Convolutional neural networks (CNNs) are on the rise in a wide variety of areas where image analysis is crucial and are also beginning to gain importance in crystallization. In Bruno et al. [42] and Salami et al. [43] images are classified into crystalline and precipitant products or undesired byproducts, respectively. Further, image analysis using CNNs is used to monitor crystal growth during crystallization [19,44,45]. Furthermore, the distinction of different particle shapes can be accomplished by CNNs, no matter if it is a multi component system [46] or different polymorphic forms with the expression of different habiti [45]. Efforts to segment overlapping particles are also being addressed [47]. A similar task of identifying primary crystals in agglomerates has been tackled for sintered and agglomerated silica nano-particles by applying a CNN [48]. It shows promising results and outperforms conventional methods.
In this work, an CNN is applied to investigate agglomeration in cooling crystallization. Detailed information about crystals are provided including primary crystals and agglomerates so that a new level of particle characterization is reached.

3. Material and Methods

In the following sections, the experimental as well as computational methods used in this study are described in detail.

3.1. Experimental Set-Up and Procedure

The batch cooling crystallization experiments were carried out in a 1.2 L double jacket crystallizer with the model system L-alanine (Evonik Industries, purity 99.7 % ) and ultrapure water (Milli-Q Integral System, 0.05 μ Scm 1 ). Experiments with different saturation temperatures ( ϑ s a t = 40   ° C /50 ° C ) were performed in triplicate, respectively. In accordance to the solubility data [49]:
c s a t ( ϑ ) [ g A l a · g s o l 1 ] = 0.11238 · e x p ( 9.0849 · 10 3 · ϑ [ ° C ] )
the components were weighed and transferred to the crystallizer. Then the crystallizer was heated up to 10 K over the saturation temperature of the system and kept at the same temperature for 1 h to ensure identical thermal history for each experiment. Afterwards it was cooled down to 20 ° C with a cooling rate of 0.3 Kmin−1. During the whole experiment the stirring rate was set to 200 rpm.
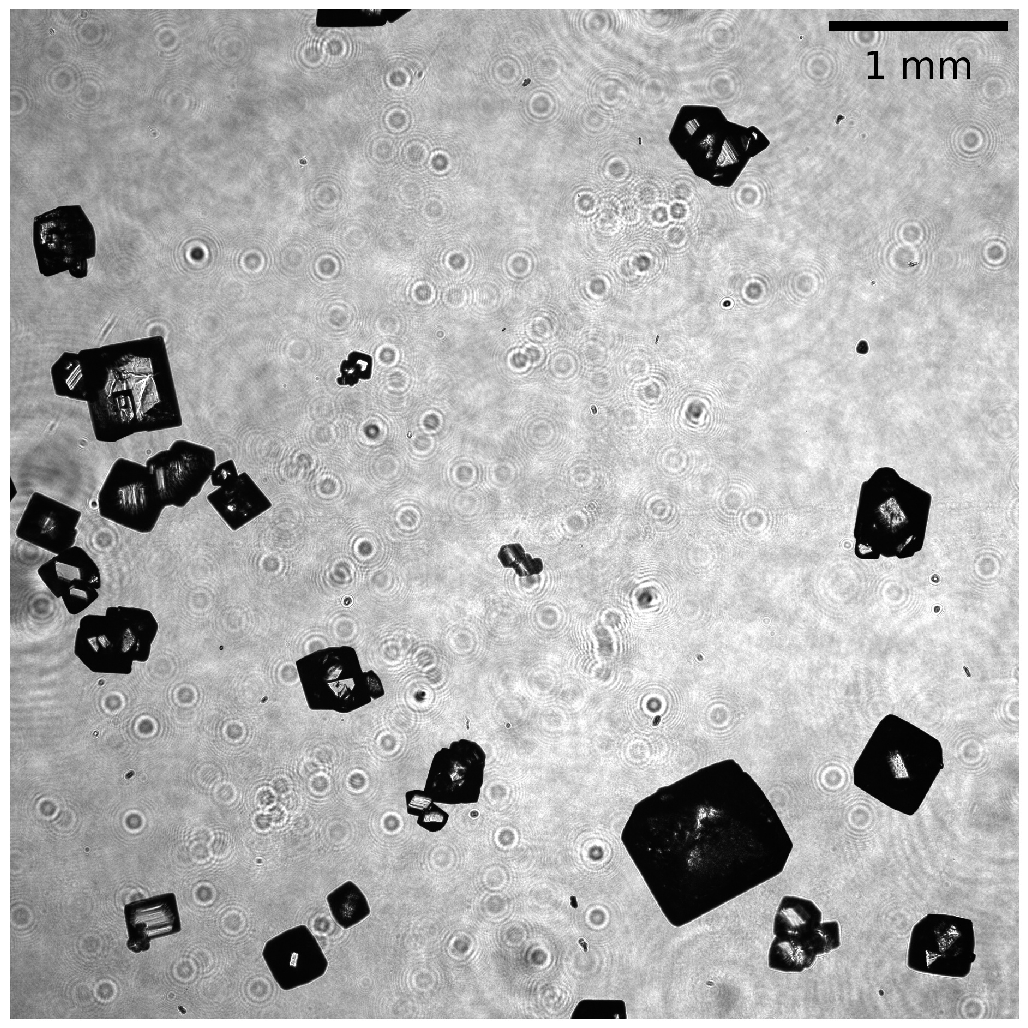
Images were taken after crystallization, when the end temperature of 20 ° C is reached, to determine the product quality. To reduce the influence of downstream processing the suspension was harvested and transferred to a self-constructed filter tower [30]. By starting the vacuum pump (Laborport N 840 G) the mother liquor is removed and the crystals are further humidified for 1 min. After the filtration step, the crystals were resuspended in saturated solution and fractionated in a sample divider (Fritsch, Laborette 27) to obtain representative subsamples. For ϑ s a t = 40   ° C and for ϑ s a t = 50   ° C , amounts of 1 8 and 1 32 of the crystal mass, respectively, are transferred to a collecting vessel. The sample was further diluted to approximately 1 L to obtain an optimal optical density on the image of 2–5% for dynamic image acquistion using the QICPIC equipped with the LIXELL wet dispersing system (Sympatec, QICPIC R02). In this work, grayscale images (camera resolution: 2048 × 2048 pixels; camera pixel size: 5.5 μ m × 5.5 μ m ; measurement module M6: 2:1 magnification) were recorded in a flow cell with cell gap depth 2 mm. An exemplary image is shown in Figure 1. The background is constantly grey and the crystals appear dark with a decisive contrast to the background.

3.2. Image Processing

Image processing is an essential part of characterizing the recorded crystals. In this work, the crystal’s size and class, i.e., whether the crystal is a single crystal (sc), agglomerate (ag) or a primary crystal, which is part of an agglomerate (pcag), is determined. Within this work, this will be referred to as the three-class task. For comparison to previous methods, a restricted variant of this task, differentiating only between single crystals and agglomerates, is considered as well. Consequently, this will be referred to as the two-class task.
In the approach presented, this task is accomplished based on the Mask-RCNN method [14] performing object detection and semantic instance segmentation on the images captured. Object detection denotes the task of locating object instances within a given image. This routinely also includes classification, i.e., assigning a class from a given set of classes to each detected object. Semantic instance segmentation additionally performs pixel-wise classification, aiming to provide pixel-accurate masks of objects.
In detail, a Mask-RCNN [14] with ResNet-50 Backbone [50] and Feature Pyramid Network (FPN) [51] was used. The implementation deployed here was based on Detectron2 [52]. Training was performed with a manually annotated image data set consisting of 80 images with 5034 annotated instances in total (2362 single crystals, 660 agglomerates and 2012 primary crystals in agglomerates). The images are from previous experiments performed according to Section 3.1. The sizes of the crystals in the data set varied in the range of d e q = 7.6 μ m to d e q = 1441.7 μ m where d e q is the equivalent sphere diameter. This broad range of expected crystal sizes led to a diverse data set (Table A1), which is important because it has already been shown that scale variation can lead to a loss of accuracy [47].
The data set was split in a ratio of 0.8 / 0.1 / 0.1 for training, validation and testing, respectively. For reduced effort in computation and training time, while simultaneously increasing detection accuracy, transfer learning was used in the training process. With transfer learning, the network at hand is pre-trained on (usually more general) data from another domain, before it is finally trained on the domain-specific data.
Here, a network pre-trained on the COCO-dataset [53] as provided with the Detectron2 implementation is used as a basis. The actual training was then performed for 30,000 iterations, with a learning rate of η = 4 · 10 4 . To increase the variance of the underlying data set, several augmentations were applied in the training process in a randomized fashion. These augmentations comprise transformations (mirroring), as well as filtering operations, including a change of brightness and contrast. To simulate possible noise in the image acquisition process, Gaussian noise of varying intensity was added to the images. As the particles are not always equally within camera focus, also random blurring and sharpening were applied as part of the augmentation. Further details are given in Table A3.
Based on this method, several Mask-RCNN-based approaches, which are more adapted and refined to the detection task at hand and its application in the process of crystallization, are developed and tested in this study (see Figure 2). For the three-class task, this comprises three different methods. Firstly, a plain Mask-RCNN is trained on the three-class task. This will be referred to as M3_1 in the following. The second variant (M3_2) consists of two separate Mask-RCNNs, the first of them (M2_1) being trained on the two-class task, detecting and differentiating only between single crystals and agglomerates, while the second one being trained for only detecting primary crystals in agglomerates. It is to be noted that the two-class Mask-RCNN M2_1 is also used separately, as detailed below, and thus explicitly labeled, while the other one is not. These two Mask-RCNN are then applied consecutively and the individual results are combined to form a solution to the three-class task. Thirdly, this approach is further complemented by a post-processing step in order to incorporate prior knowledge into the detection process. As pcag are by definition always part of ag, this information is used to improve the detection results further. This method is referred to as M3_2PP. For the two-class task, which mainly serves as a point of direct comparison to the approach of Heisel et al. [15], a Mask-RCNN is directly trained on this task, without any modification. This variant will be referred to as M2_1. In addition to the Mask-RCNN approaches, the method of Heisel et al. that is only applicable to the two-class task is represented in Figure 2 by the box labeled Feature Extraction+ANN. The method of Heisel et al., not being based on deep learning techniques, conceptually differs from the Mask-RCNN approaches. In a first step, crystals are detected on binary images and image descriptors (features) are calculated, which serve as input for an ANN for classification in a second step. To obtain binary images of the recorded grayscale images, a binarization is performed [23]. Reinforced by image enhancement and dynamic background subtraction, differences in contrasts between crystals and background are used by global thresholding (Otsu method [54]). The detected crystals are further processed by morphological closing and region filling, before they are passed to the classification. For classifying single crystals and agglomerates in total 19 different image descriptors, e.g., circularity, convexity and solidity, are calculated and ranked based on proportional similarity identifying the most striking ones to distinguish between single crystals and agglomerates. These image descriptors are the input of a shallow artificial neural net (ANN) capable of classifying the crystals. The detailed inputs and the architecture of the ANN are given in Table A2.
The classical approach is directly compared to the two-class task implementation of the CNN differentiating between single crystals and agglomerates. As a basis of comparison and further evaluation of the developed deep learning approaches, all results are evaluated with respect to the COCO-metrics [53]. The principal measure is the mean average precision, m A P or just A P , for short. This measure is an extension of the precision/recall-scheme of binary classifiers for the task of object detection and semantic instance segmentation [55]. Along with the main A P measure, the A P 50 variant is considered here, as well. In the A P 50 measure, a 50% overlap of detection and ground-truth is sufficient for positive evaluation, meaning that it is usually more tolerant with respect to inaccurate location. Furthermore, COCO-metrics can be evaluated grouped by object size for small, medium-sized and large objects, this leads to A P s , A P m , and A P l for our application. Table 1 gives a more detailed overview of the ranges and associated sizes. Finally, the resulting AP are also given for every class (sc, ag, pcag). All metrics are derived for the pixel-wise segmentation masks (“segm”) of the detected objects.
Besides the COCO-metrics also the target parameters agglomeration degree A g and the average number of primary crystals in agglomerates p c / a g ¯ are evaluated. A g is the ratio of the number of agglomerates to the total number of crystals including agglomerates and single crystals and p c / a g ¯ is the number of primary crystals in agglomerates divided by the number of detected agglomerates. Thus, A g and p c / a g ¯ characterize the material systems in terms of agglomeration.

4. Results

This section is divided into three parts. In Section 4.1, the Mask-RCNN approach is evaluated with respect to the extended three-class task. This comprises all the variants developed and investigated in this study, as described in Section 3.2. The post-processing, which is carried out on the raw output of the Mask-RCNN, is described in detail. This allows for integrating additional theoretical knowledge to avoid false positives.
Following, in Section 4.2 the plain results of the detection with the Mask-RCNN method are evaluated and compared to the results of the approach by Heisel et al. [15] (“the classical pipeline”) by applying both to the two-class task. For all tasks and methods evaluated, also the role of particle size and the impact of applying a threshold of equivalent diameter to detection results is investigated.
In Section 4.3, the image analysis is applied to batch cooling crystallization of L-alanine from aqueous solution as model system. Detailed particle characterization is performed for the product crystals, including information up to the level of primary crystals in agglomerates. On basis of size calculation and characterization of agglomerates insights in the agglomeration behaviour are gained.

4.1. Mask-RCNN Applied to Three-Class Task

The three-class task is addressed by use of the Mask-RCNN method. Since this is a complex semantic segmentation with high demands concerning accuracy, different methods are developed to achieve the best result possible.
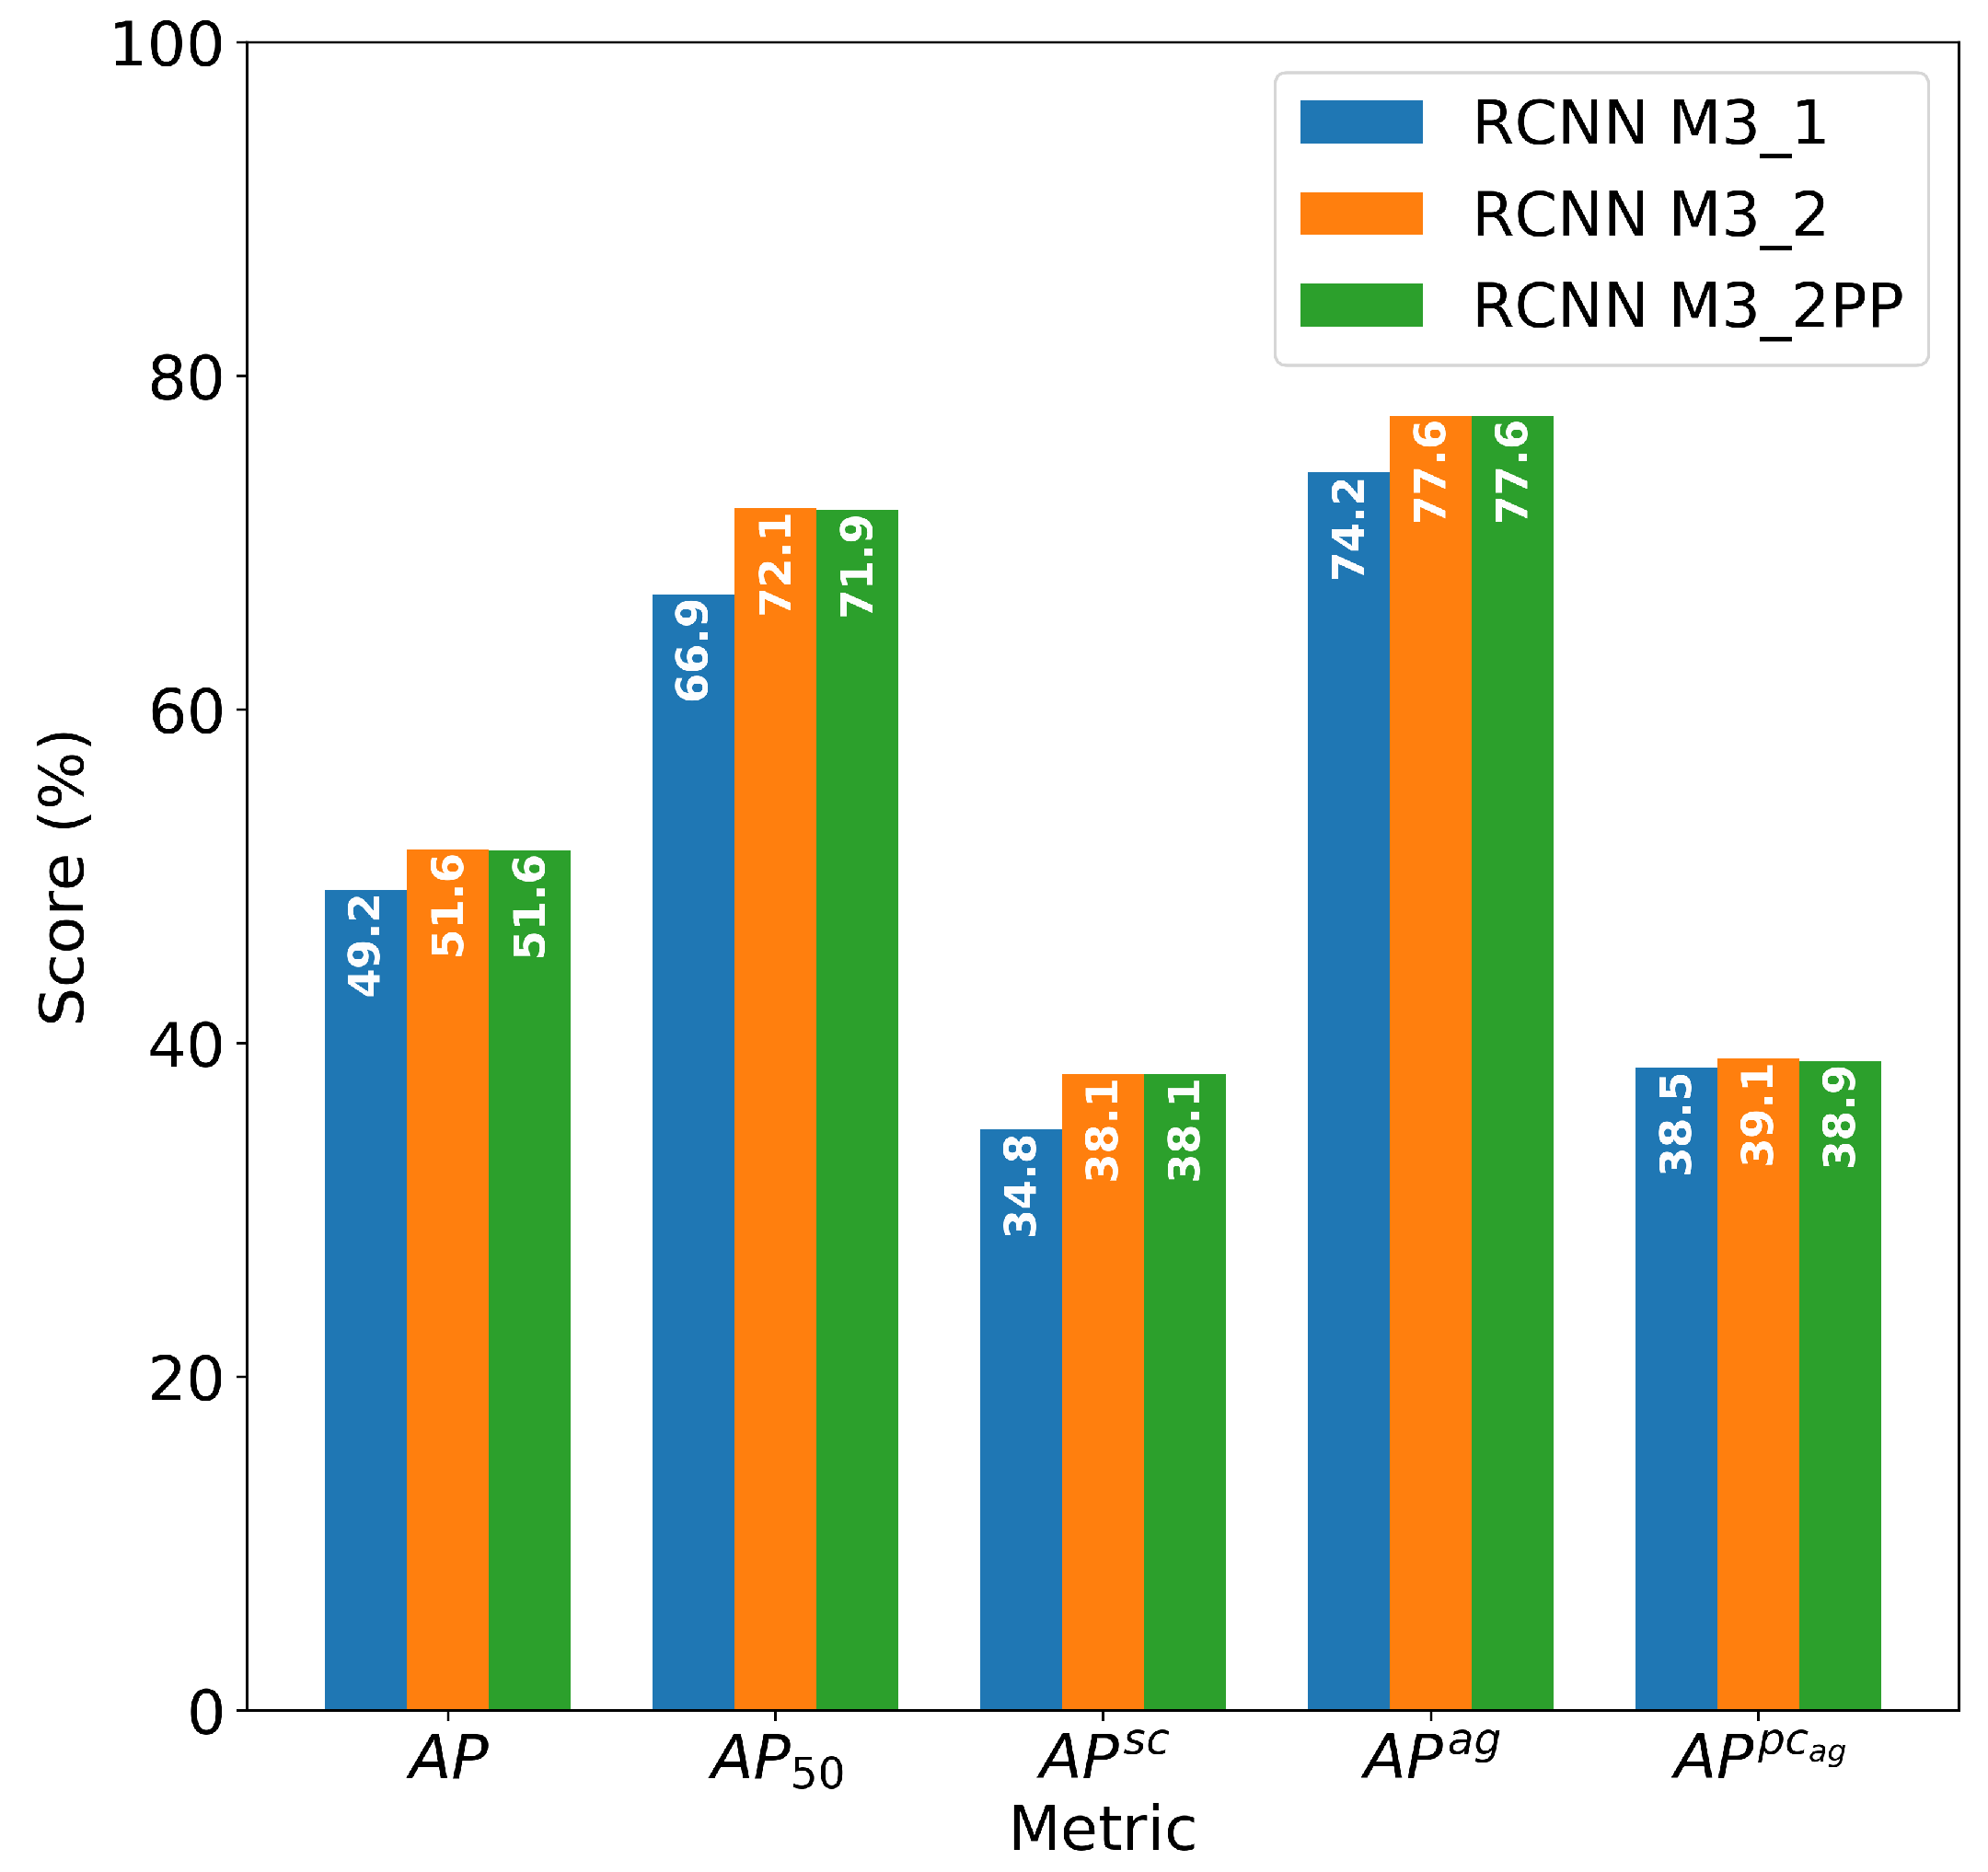
Figure 3 shows a comparison of the resulting COCO metrics of the different Mask-RCNN methods used and developed in this paper: direct application of Mask-RCNN (M3_1), combined use of two Mask-RCNNs, one detecting only ag and sc, and the other one detecting pcag (M3_2), and the latter variant with additional post-processing (M3_2PP). Table 2 evaluates the different methods regarding the target variables of agglomeration.
The plain Mask-RCNN variant (M3_1) achieves detection accuracy of A P = 49.2 and A P 50 = 66.9 . Notable differences can be spotted in per-class AP, with the value of A P a g = 74.2 for ag being significantly higher than both A P p c a g = 38.5 and A P s c = 34.8 for sc and pcag, respectively. This indicates that size distribution across object classes correlates with detection and classification accuracy. Agglomerates are larger on average and score highest in detection accuracy, while the smallest particles are usually single crystals scoring at lower values. Primary crystals in agglomerates achieve low accuracy, which is most likely due to the higher complexity of detection. As primary crystals merge in agglomerates, they overlap or at least touch each other by forming the agglomerate leading to the challenge of identifying the contours even in the annotation phase. Often the details in the images are insufficiently pronounced, so the more detailed the annotations, the more subjective they are.
To further complicate matters, on the one hand, the distinction between single crystals and primary crystals in agglomerates is tricky. Both, sc and pcag, belong to the primary crystals formed by nucleation. The only difference is that sc are free in solution while pcag are bound in agglomerates and therefore touch or overlap with others. On the other hand, primary crystals in agglomerates are always part of the agglomerate, so there is a lot of overlap, ideally even by 100% making it difficult to determine the object borders. This results in a underestimation of p c / a g ¯ whereas single crystals and agglomerates agrees well in terms of A g (see Table 2).
As a first attempt reducing these dependencies, the second variant (M3_2) uses a separate Mask-RCNN network specifically to detect pcag. This network is of course also trained separately on the relevant subset of the original training data.
Evaluation of the second variant shows that the use of two separate Mask-RCNN networks gives an improvement over using only one network. Both, A P = 51.6 and A P 50 = 72.1 , show higher detection accuracy over the first variant, and per-class APs are increased as well, although not uniformly, with A P s c = 38.1 and A P p c a g = 39.1 being increased more significantly than A P a g = 77.6 . Furthermore, p c / a g ¯ of 2.91 approaches the ground truth of 3.08, since more pcag are detected for M3_2PP.
Since the CNN learns on image features and does not recourse to theoretical knowledge, the results can be further improved by the use of post-processing. Analogously, the knowledge about pcag forming agglomerates and consequently having to be part of an agglomerate are implemented separately. For that purpose the pairwise intersection over union (IoU) of all detected pcag and ag is calculated and the sum of all IoUs of one primary crystal is calculated. All pcag with a sum 0 are part of an ag and will be kept, the others are identified as false positives and are withdrawn. Since there is a high semantic similarity of single crystals and primary crystals in agglomerates, false positive primary crystals can be identified and deleted. This additional post-processing step added to the two-network variant M3_2 constitutes the third variant M3_2PP.
Evaluation of the third variant shows that post-processing of the results within M3_2PP does not yield a further improvement in numbers over the variant without post-processing (M3_2). In fact, it is mostly on par (except A P p c a g = 39.1 ). That means, that for A P the false positives are not strongly decisive; however, the p c / a g ¯ decreases to 2.73, indicating that there are false positives. Since the intersections of pcag and ag are needed for later calculation in Section 4.2, the post processing is kept.
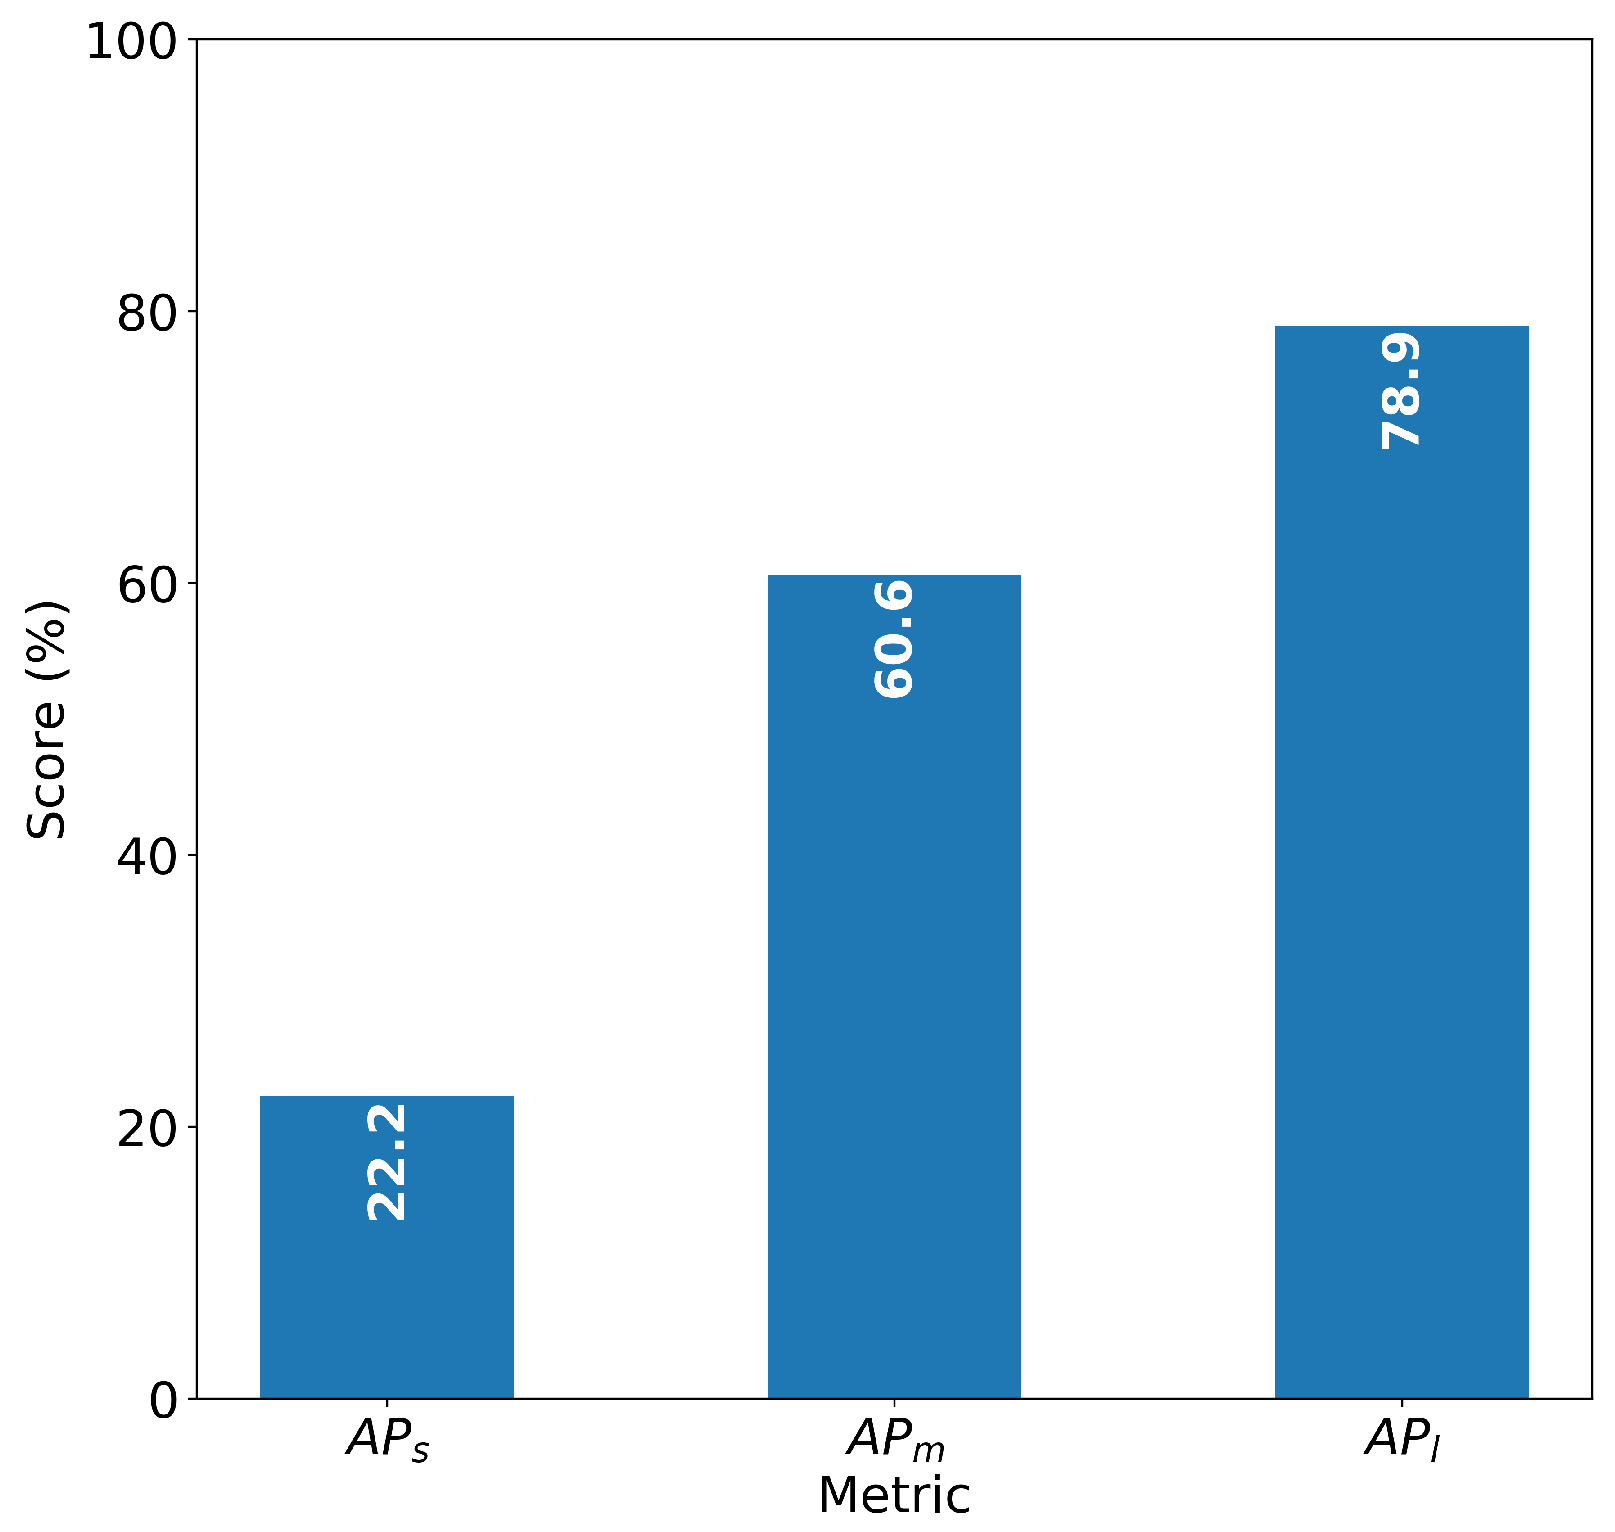
Common to all variants is the dependence of accuracy on particle size. This is reflected in the class-specific values, which are high for agglomerates, i.e., larger particles on average, and lower for pcag and sc. Even more specifically, it also confirmed by size-specific metrics as shown in Figure 4. The larger the particle, the better the shape and further details can be reproduced, which facilitates the classification.
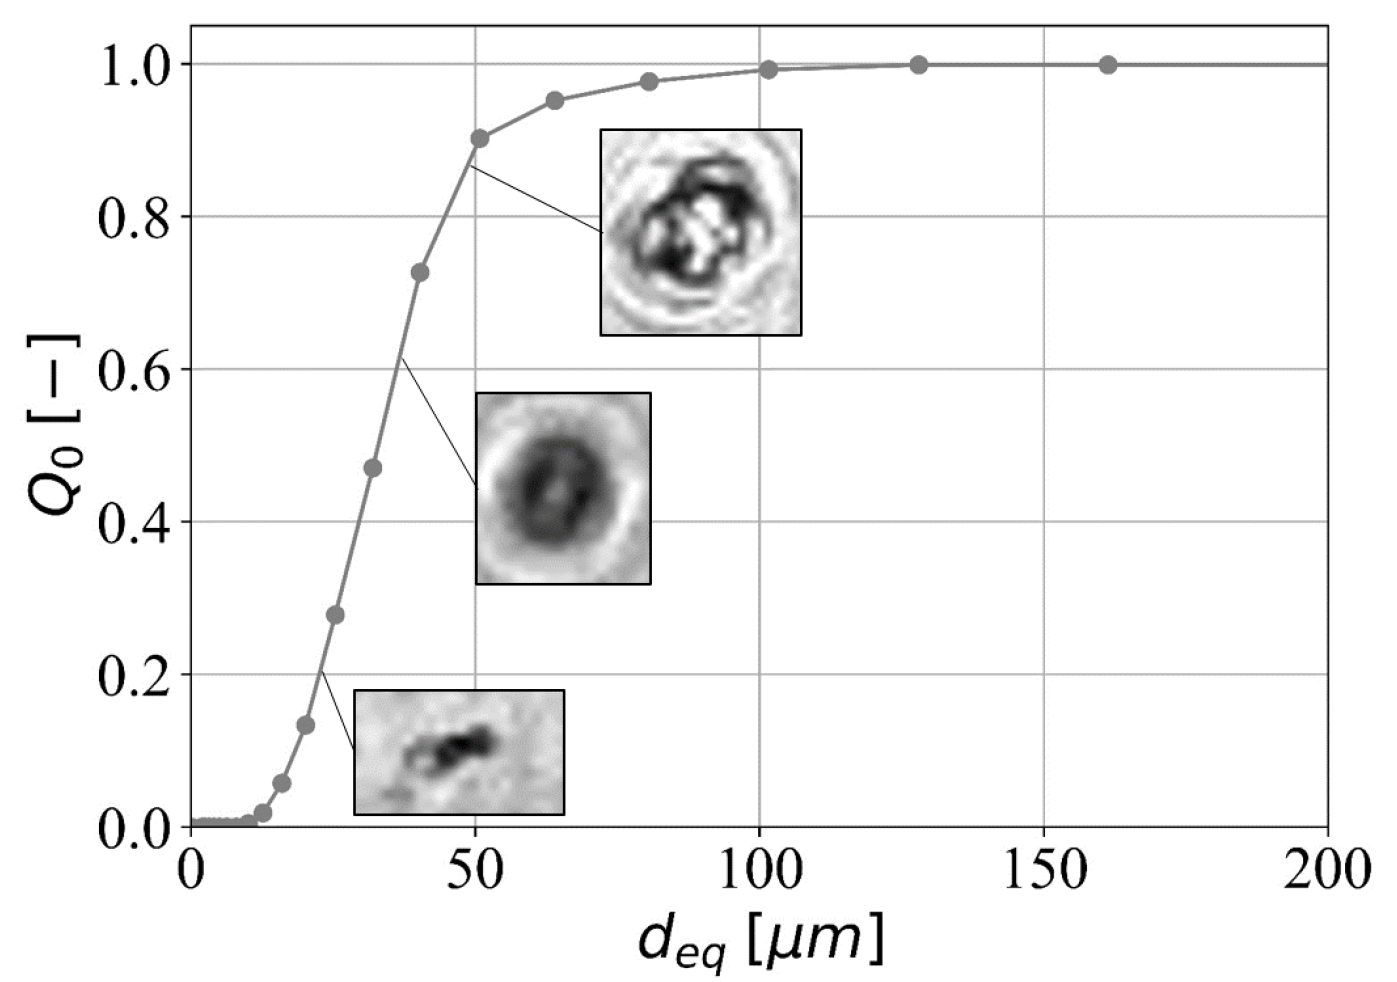
It is essential to mention that all training and evaluation is performed for the original image size ( 2048 × 2048 px). This is in contrast to Mask-RCNN/Detectron2 default settings, which result in a down-scaling of image size, which is usually set to 800 × 800 px. As to be expected, down-scaling of the input images results in a significant drop of detection accuracy ( A P = 37.9 ; A P p c a g = 29.1 ; A P a g = 65.0 ; A P s c = 19.6 ). Especially the small crystals are detected worse due to resizing, since they do not consist of enough pixels to reflect shape accurately. By ISO-13322-1 [56] for the original image size the minimal equivalent diameter must be larger than 25.4 μ m ( d e q , 1 ) for compliant detection. For the resized images, this would be accordingly less. In order to improve the results the size threshold of 25.4 μ m ( d e q , 1 ) is investigated. Additionally a second threshold based on annotated unknown objects is defined. All particles the annotators were not certain whether they were a crystal, dirt or even artifact are subsumed under unknown. By a size analysis of the unknown objects shown in Figure 5, it is highlighted that with 90% of the unknown objects are smaller than the size class of 50.8 μ m . To avoid the influence of particles of an uncertain class, a second size threshold of d e q , 2 = 50.8 μ m is chosen.
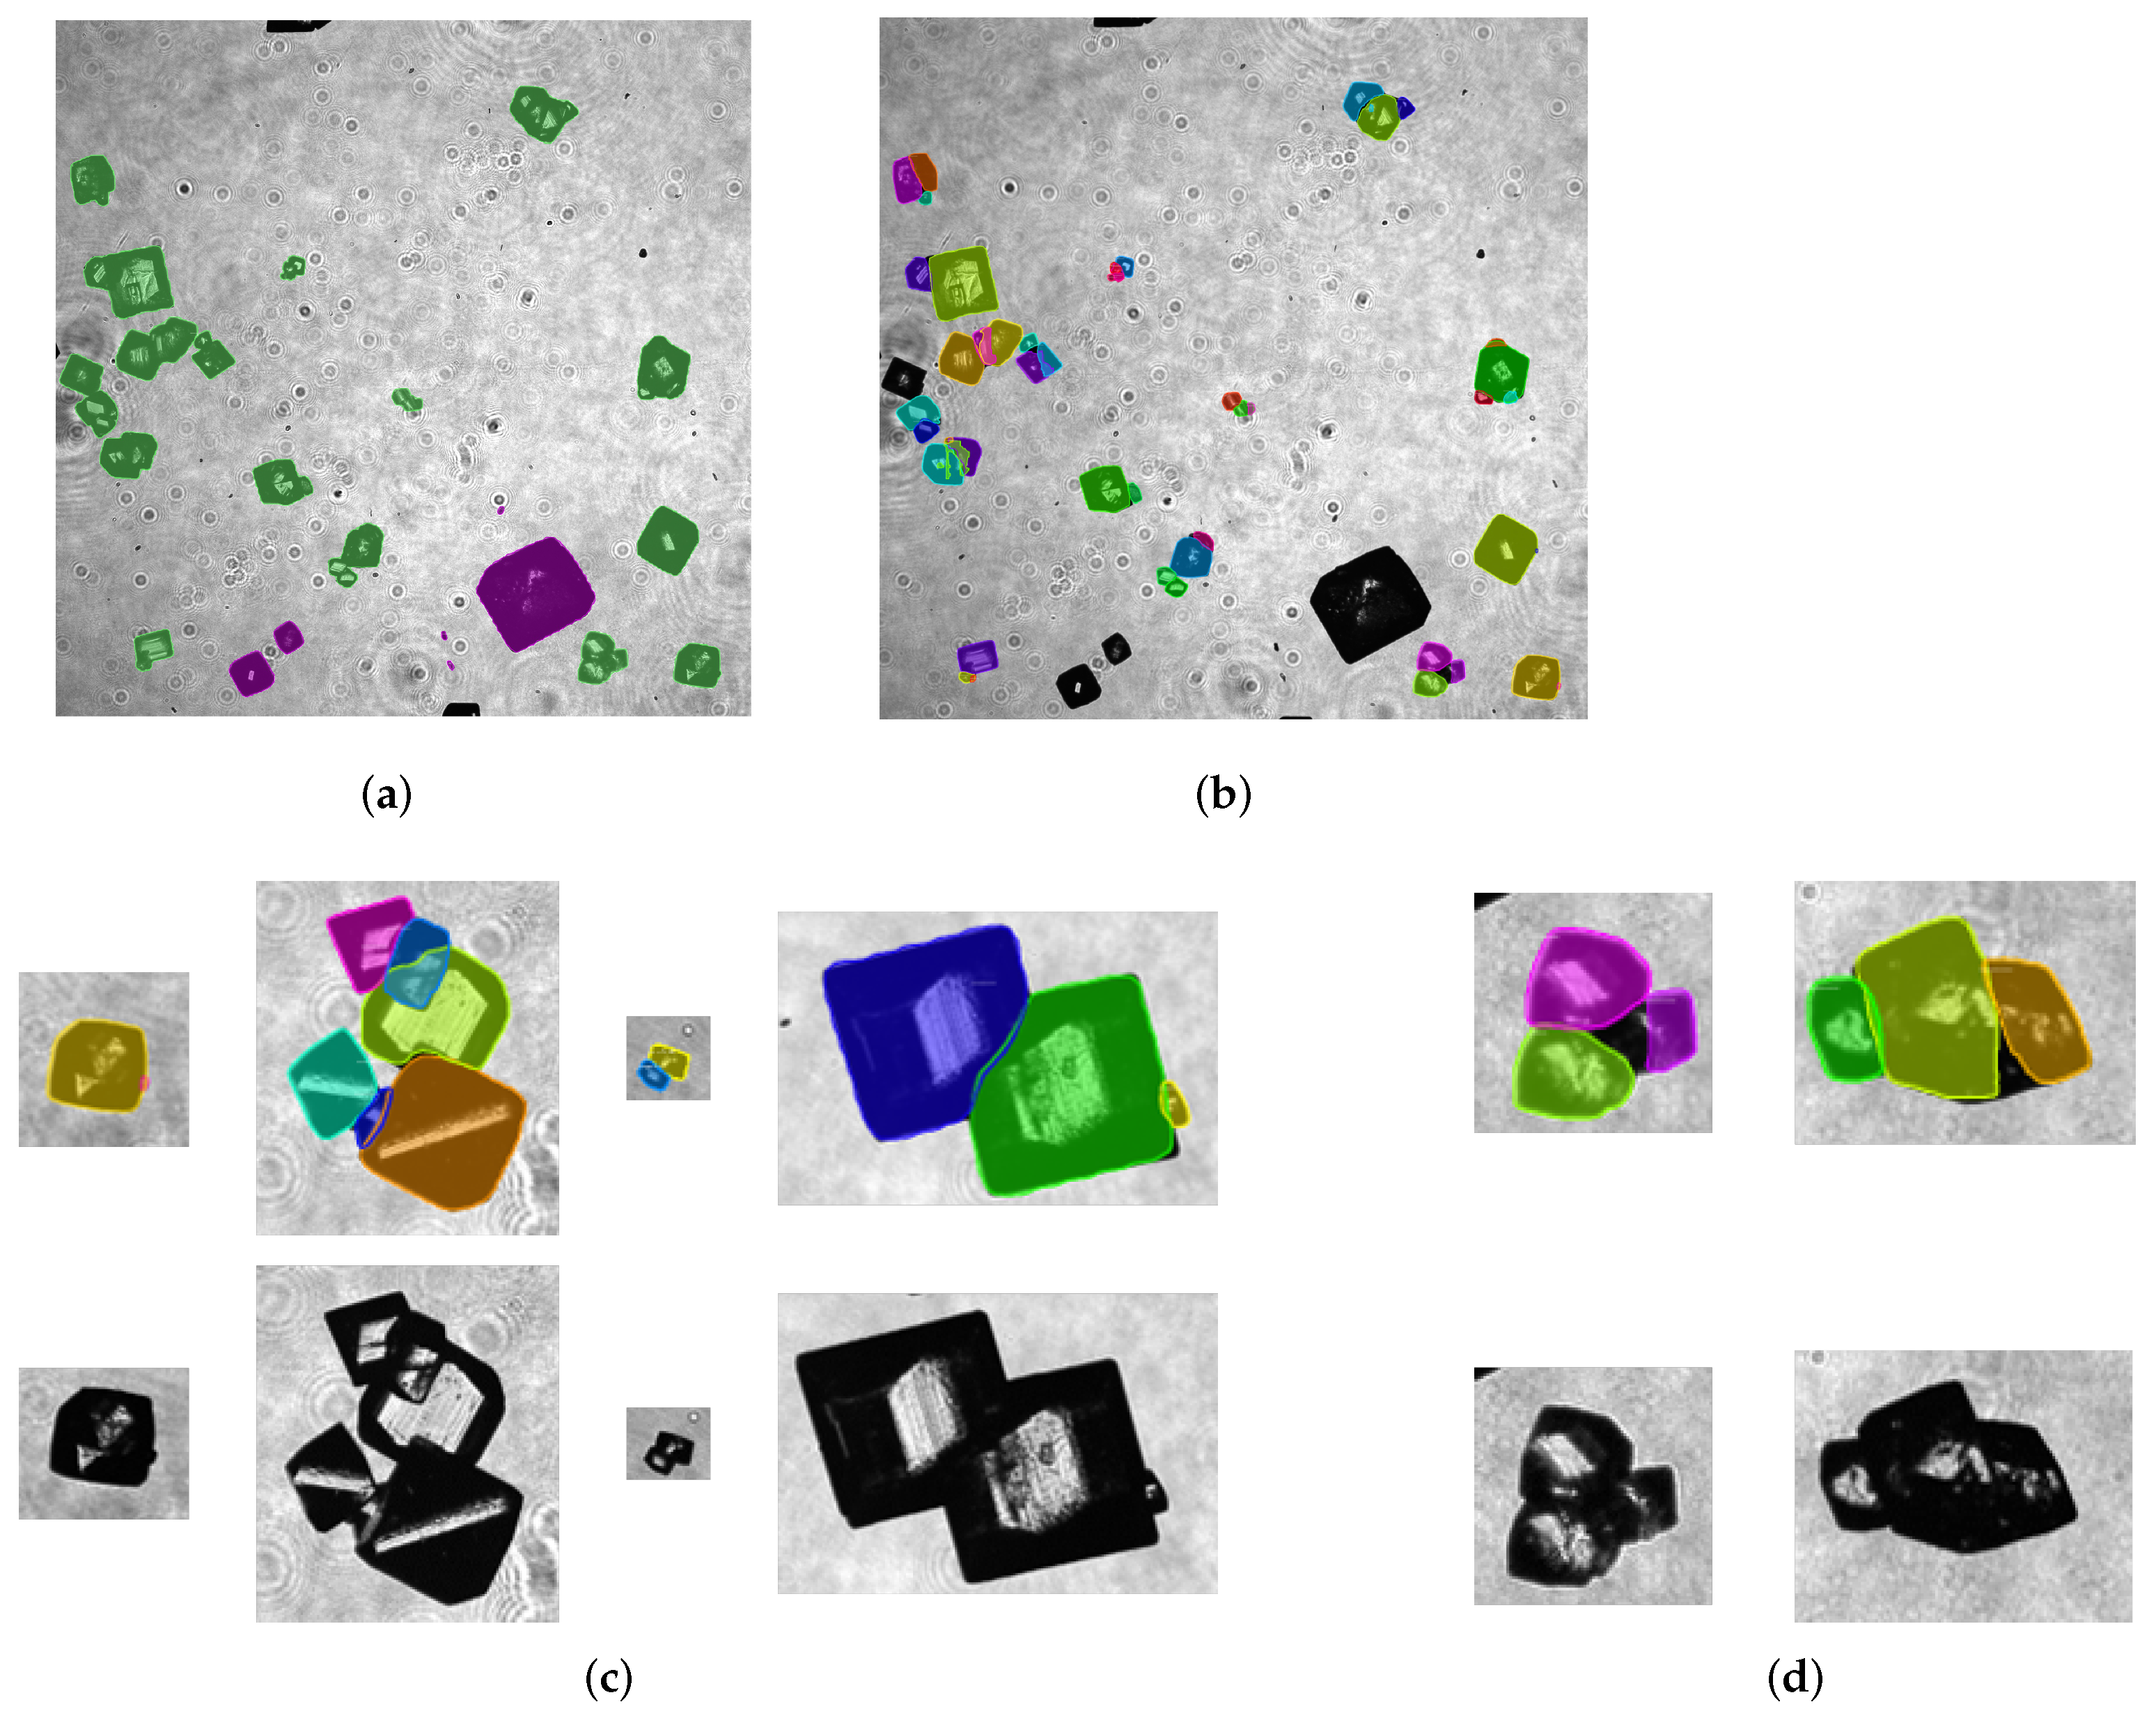
Figure 6 shows results for M3_2PP with the different area thresholds applied. Excluding objects below the chosen threshold further increases detection accuracy, which, for the principal A P -measure, rises from 51.6 without any threshold to 53.4 and 59.3 , for d e q , 1 and d e q , 2 , respectively. Whereas the annotators do not identify many crystals below d e q , 1 manually (see Table A1), an increased accuracy for d e q , 2 is achieved because fewer artifacts and poorly depicted objects are analyzed. Examples for the final results are given in Figure 7. For the exemplary image in Figure 1 the detection of single crystals and agglomerates (see Figure 7a) as well as primary crystals in agglomerates (see Figure 7b) are presented. It can be seen that the differentiation between single crystals and agglomerates is successfully implemented and also the primary crystals can be depicted by segmentation masks. The semantic segmentation is highly sensitive as it can be seen in Figure 7c. The sizes of pcag in one agglomerate can vary significantly, e.g., one big pcag and one very small one forming an a g , which is hardly identified even by the human eye. Furthermore, the contours are sometimes depicted as clearly that overlapping is depicted accurately even for more complex agglomerates. However Figure 7d also illustrates that not all contours of primary crystals in agglomerates are identify exactly. That is why a large difference between the A P and A P 50 is observable for pcag. Further, in accordance to the identified underestimation of pcag it is seen that not all primary crystals in agglomerates are detected.

4.2. Comparison of Mask-RCNN and Classical Approach

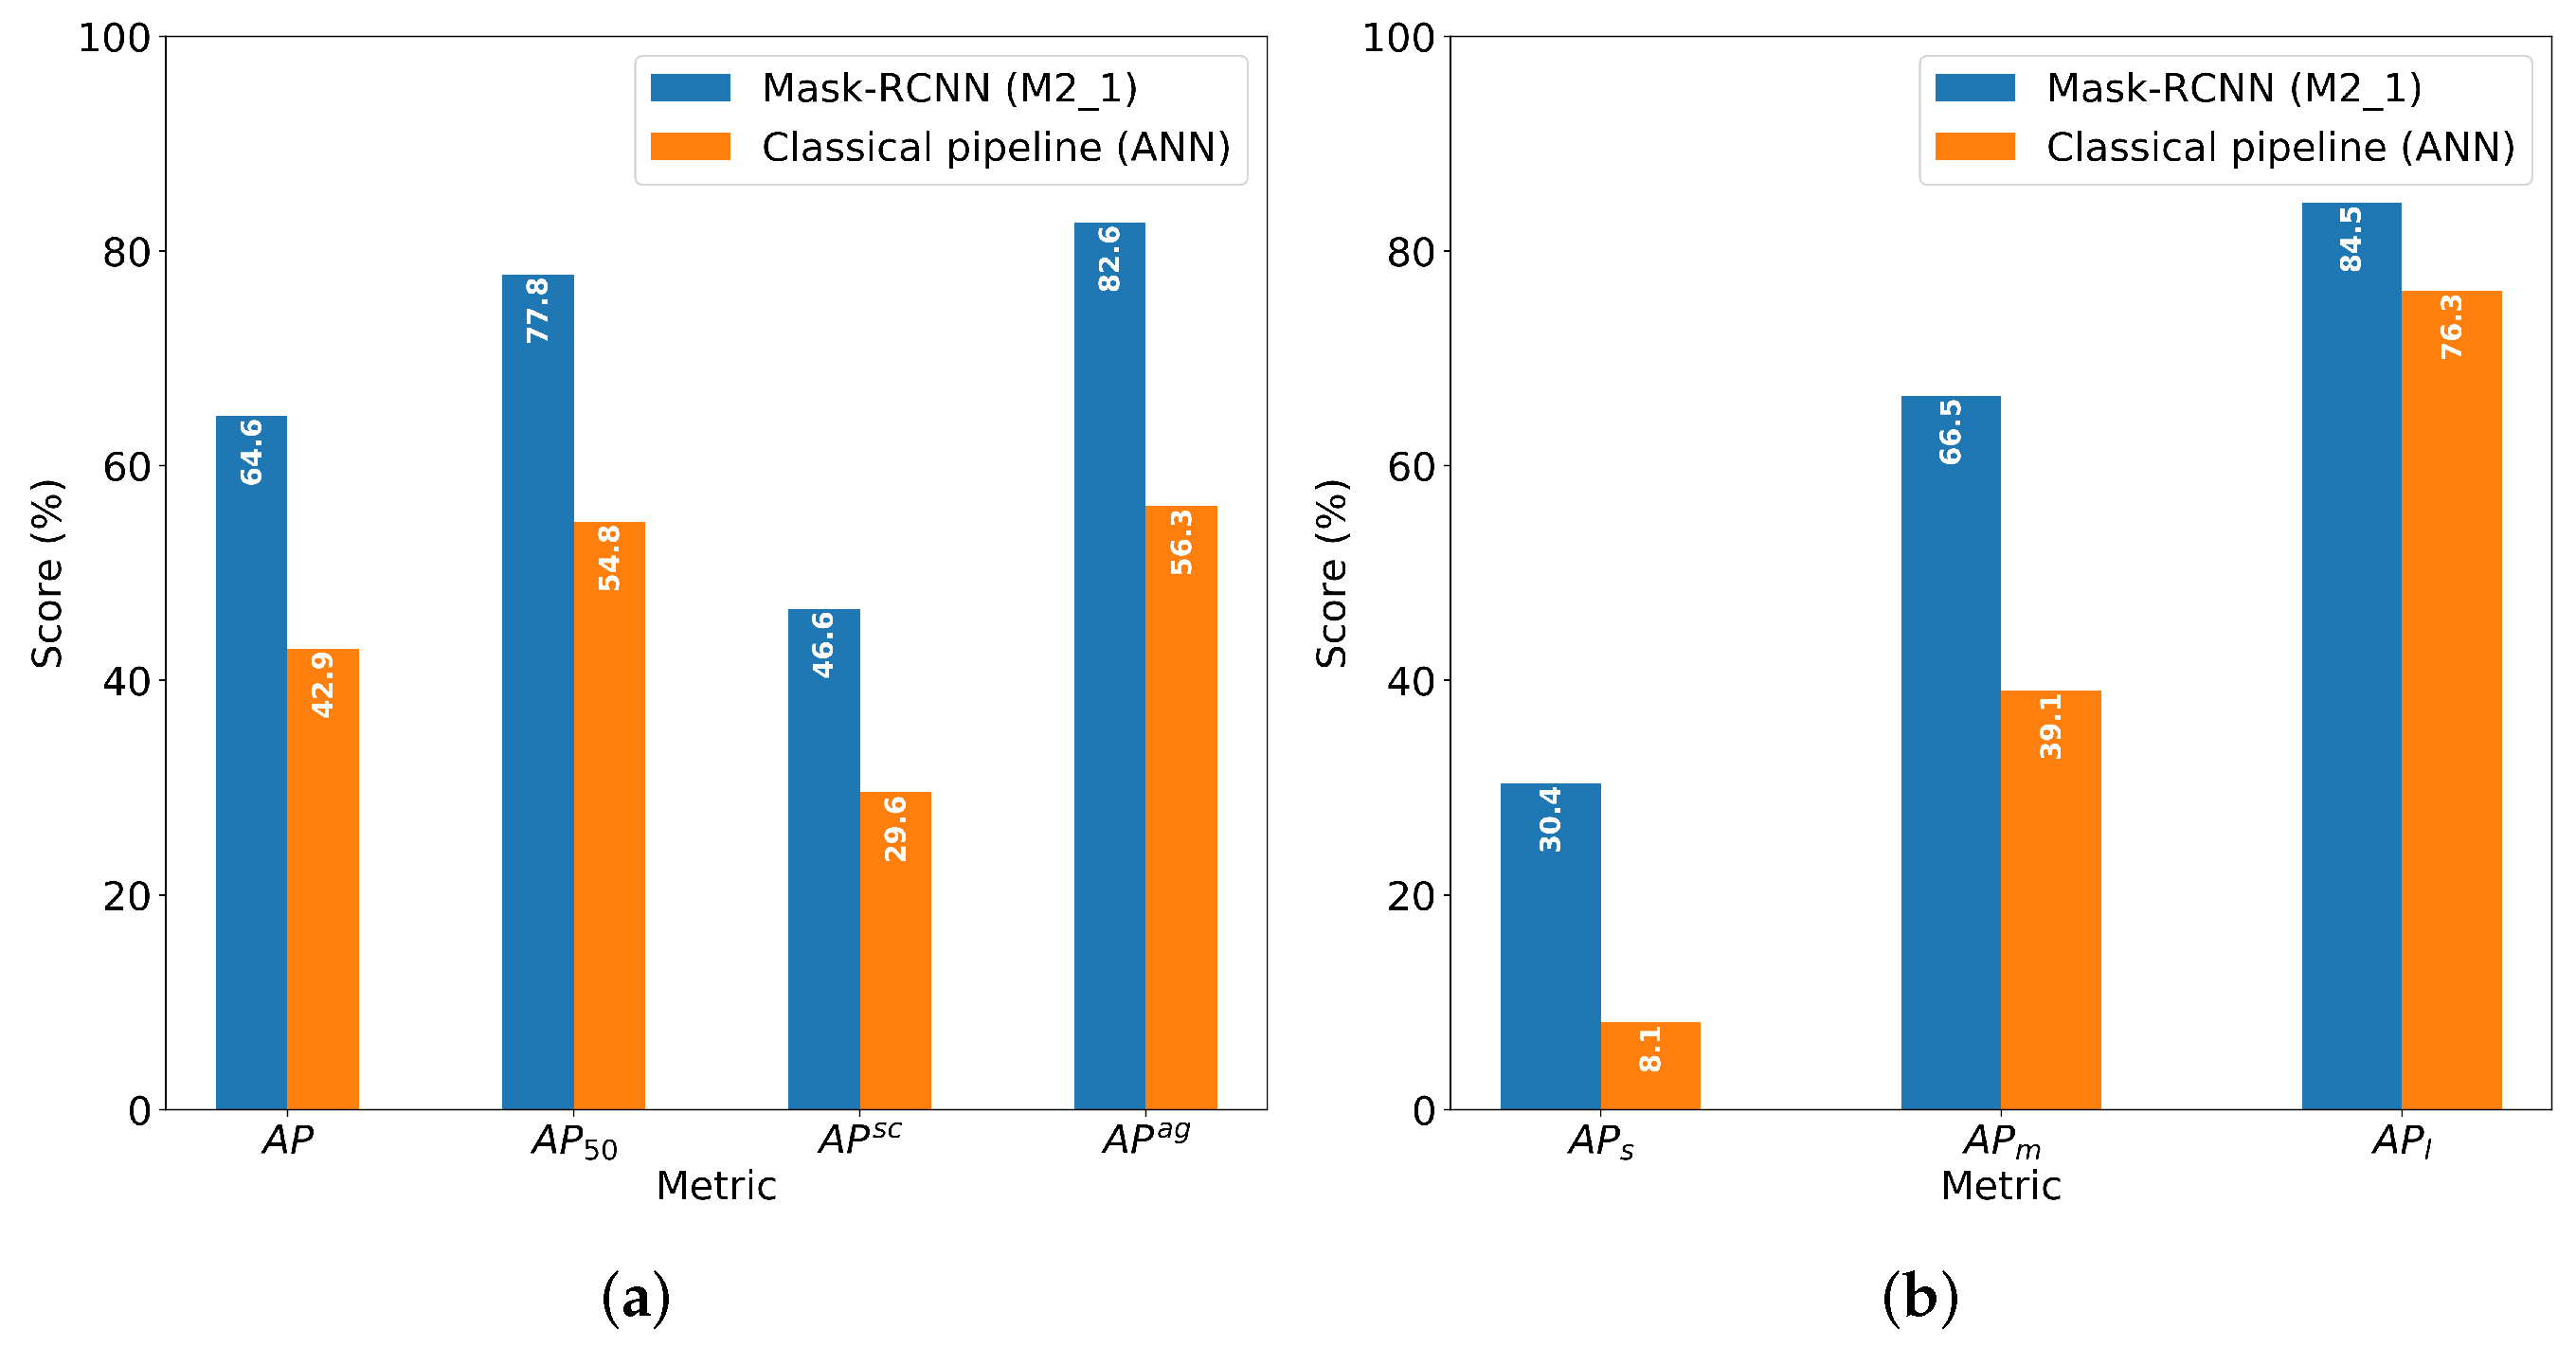
For direct comparison to the classical method of Heisel et al. [15], the plain Mask-RCNN approach and the classical method are both applied to the two-class task and evaluated with respect to the COCO-metrics. The Mask-RCNN is trained directly and without any modifications on the two-class training dataset, i.e., the original dataset reduced to sc and ag. In effect, this is equal to the Mask-RCNN of the M2_1 approach detecting only sc and ag. Figure 8 shows the comparison between Mask-RCNN and the classical pipeline, either one with a threshold of d e q = 50.8 μ m applied. It can be seen that Mask-RCNN outperforms the classical pipeline in overall detection accuracy and in per-class accuracy. As shown in Figure 8a, the Mask-RCNN approach wins by a significant margin in either category.
In both methods, overall accuracy increases with increasing object size, as shown by size-dependent values A P { s , m , l } in Figure 8b, indicating that both detection and discrimination accuracy decrease with decreasing particle size. The detection of agglomerates yields higher AP than single crystal for both methods, with Mask-RCNN being significantly more accurate. For small particles, A P s scores 30.4 for Mask-RCNN and only 8.1 for the classical approach. The gap in accuracy gets smaller for medium-sized particles, with A P m = 66.5 for Mask-RCNN vs. A P m = 39.1 for the classical approach, and more so for large particles (Mask-RCNN: A P l = 84.5 , classical: A P l = 76.3 ). Even though accuracy is dependent on object size for the Mask-RCNN approach as well as the classical one, and though the differences in accuracy become smaller with increasing object size, in summary, the Mask-RCNN approach gives an enormously large improvement over the former method, especially for small- and medium-sized particles.

4.3. Application to Crystallization

As described in Section 3.1 crystallization experiments with different saturation temperatures ( ϑ s a t = 40   ° C/50 ° C) are performed. After crystallization, the product crystals are recorded by dynamic image acquisition and a detailed crystal characterization of the product crystals is performed by image processing. According to the image processing methods developed, the two-net variant consisting of one Mask-RCNN for single crystals and agglomerates and an additional one for primary crystals in agglomerates with post-processing (M3_2PP) is chosen for image processing. Additionally, a size threshold for single crystals and agglomerates of d e q 50.8 μ m is set. Below this size limit, no appropriate differentiation of particle shapes is ensured and artifacts further complicate the analysis (see Figure 5). Nevertheless, no size threshold is assigned for the primary crystals in agglomerates because even an agglomerate of d e q = 50.8 μ m must consist of at least two primary crystals in theory. As the result of image analysis, every crystal on the images is detected pixel-wise and classified into single crystals, agglomerates and primary crystals in agglomerates. This allows for the determination of characteristic measures to describe and quantify agglomeration.
In Figure 9, the particle size distributions (PSD) of the performed experiments with different saturation temperatures are shown. By classifying single crystals and agglomerates, as shown in Figure 7a, besides the overall number density distribution q 0 of all crystals, the total crystals can also be split into the subpopulations of single crystals and agglomerates. When calculating the PSD for the given subpopulation, e.g., single crystals, the single crystals in a given size class are considered in relation to the total crystals. If the subpopulations of the single crystals and the agglomerates are combined, the PSD of the total crystals is obtained again [57].
As expected, the increased saturation temperature shifts the PSD to larger particles. On the one hand, this is due to concentration difference from the beginning to the end of crystallization promoting growth. This is also indicated by the shift of the subpopulation of single crystals to the right. On the other hand, the tailing for bigger crystals is due to the subpopulation of agglomerates. Therefore, the dominant phenomenon for large crystals exceeding 250 μ m is agglomeration.
The probability for agglomeration at the higher saturation temperature is increased because the formed crystals remain longer in the system due to the same end temperature. Thus, by continuing agglomeration, crystals exceed to larger sizes and the A g is increased as well (see Table 3). In addition, the raising solid content promotes the particle collisions. This observation of a higher degree of agglomerated products has also been reported in the literature [7].
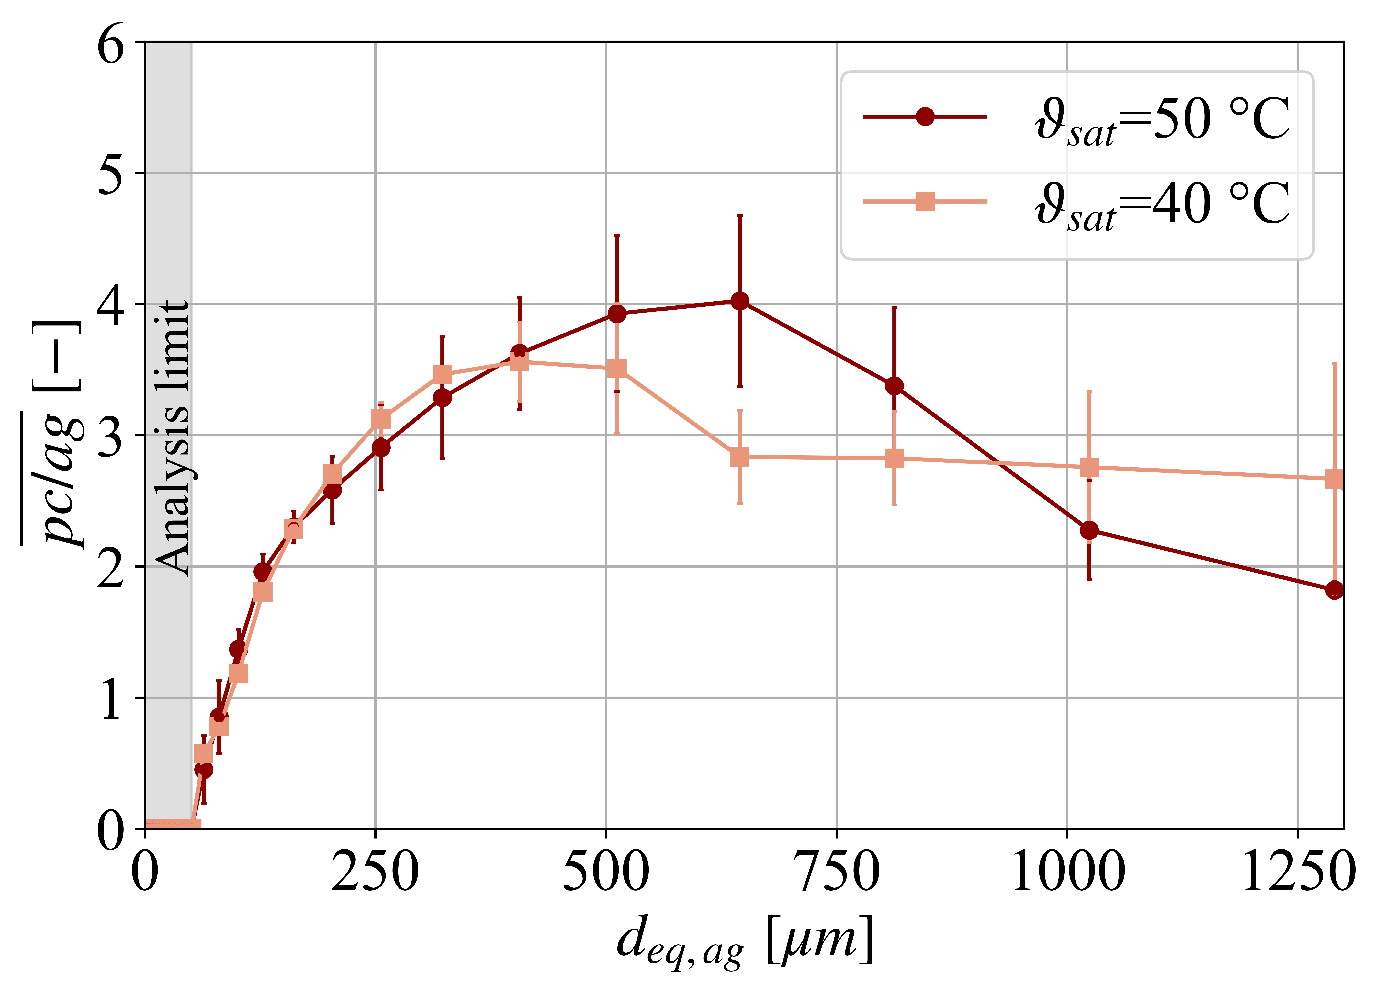
The progression of agglomeration is not only depicted by the agglomeration degree but can also be traced on a more detailed level of primary crystals in agglomerates. A first measure is the average number of primary crystals per agglomerate ( p c / a g ¯ ) in Table 3. For the saturation temperature of ϑ s a t = 40 ° C, p c / a g ¯ slightly exceeds the minimum limit of two and increases to 2.8 for ϑ s a t = 50 ° C. Based on the size-dependent accuracy of the method, but also due to the wide range of agglomerate sizes, a size-dependent evaluation is useful. In Figure 10, the p c / a g ¯ in dependency of the agglomeration size is depicted. In the evaluation of the experiments agglomerates smaller than 161 μ m do not obtain the limit of two p c / a g ¯ which indicates an underestimation for small crystals in particular and also lead to the low overall p c / a g ¯ just above 2.
However, regardless of size the agglomerates rarely consist of more than four p c / a g , showing that the material system tends to agglomerate only moderately with few p c / a g in general. For larger particles, the p c / a g ¯ even starts to decrease again, indicating that larger primary crystals do not form stable aggregates, which reduces the formation of agglomerates.
Generally, the image analysis possibly underestimates the primary crystals due to the reduction of the spatial crystals to a 2D image. Especially, when small primary crystals are attached to large ones, the probability is high that the small primary crystals are obscured by the orientation of the agglomerate on the image and therefore do not appear in the evaluation.
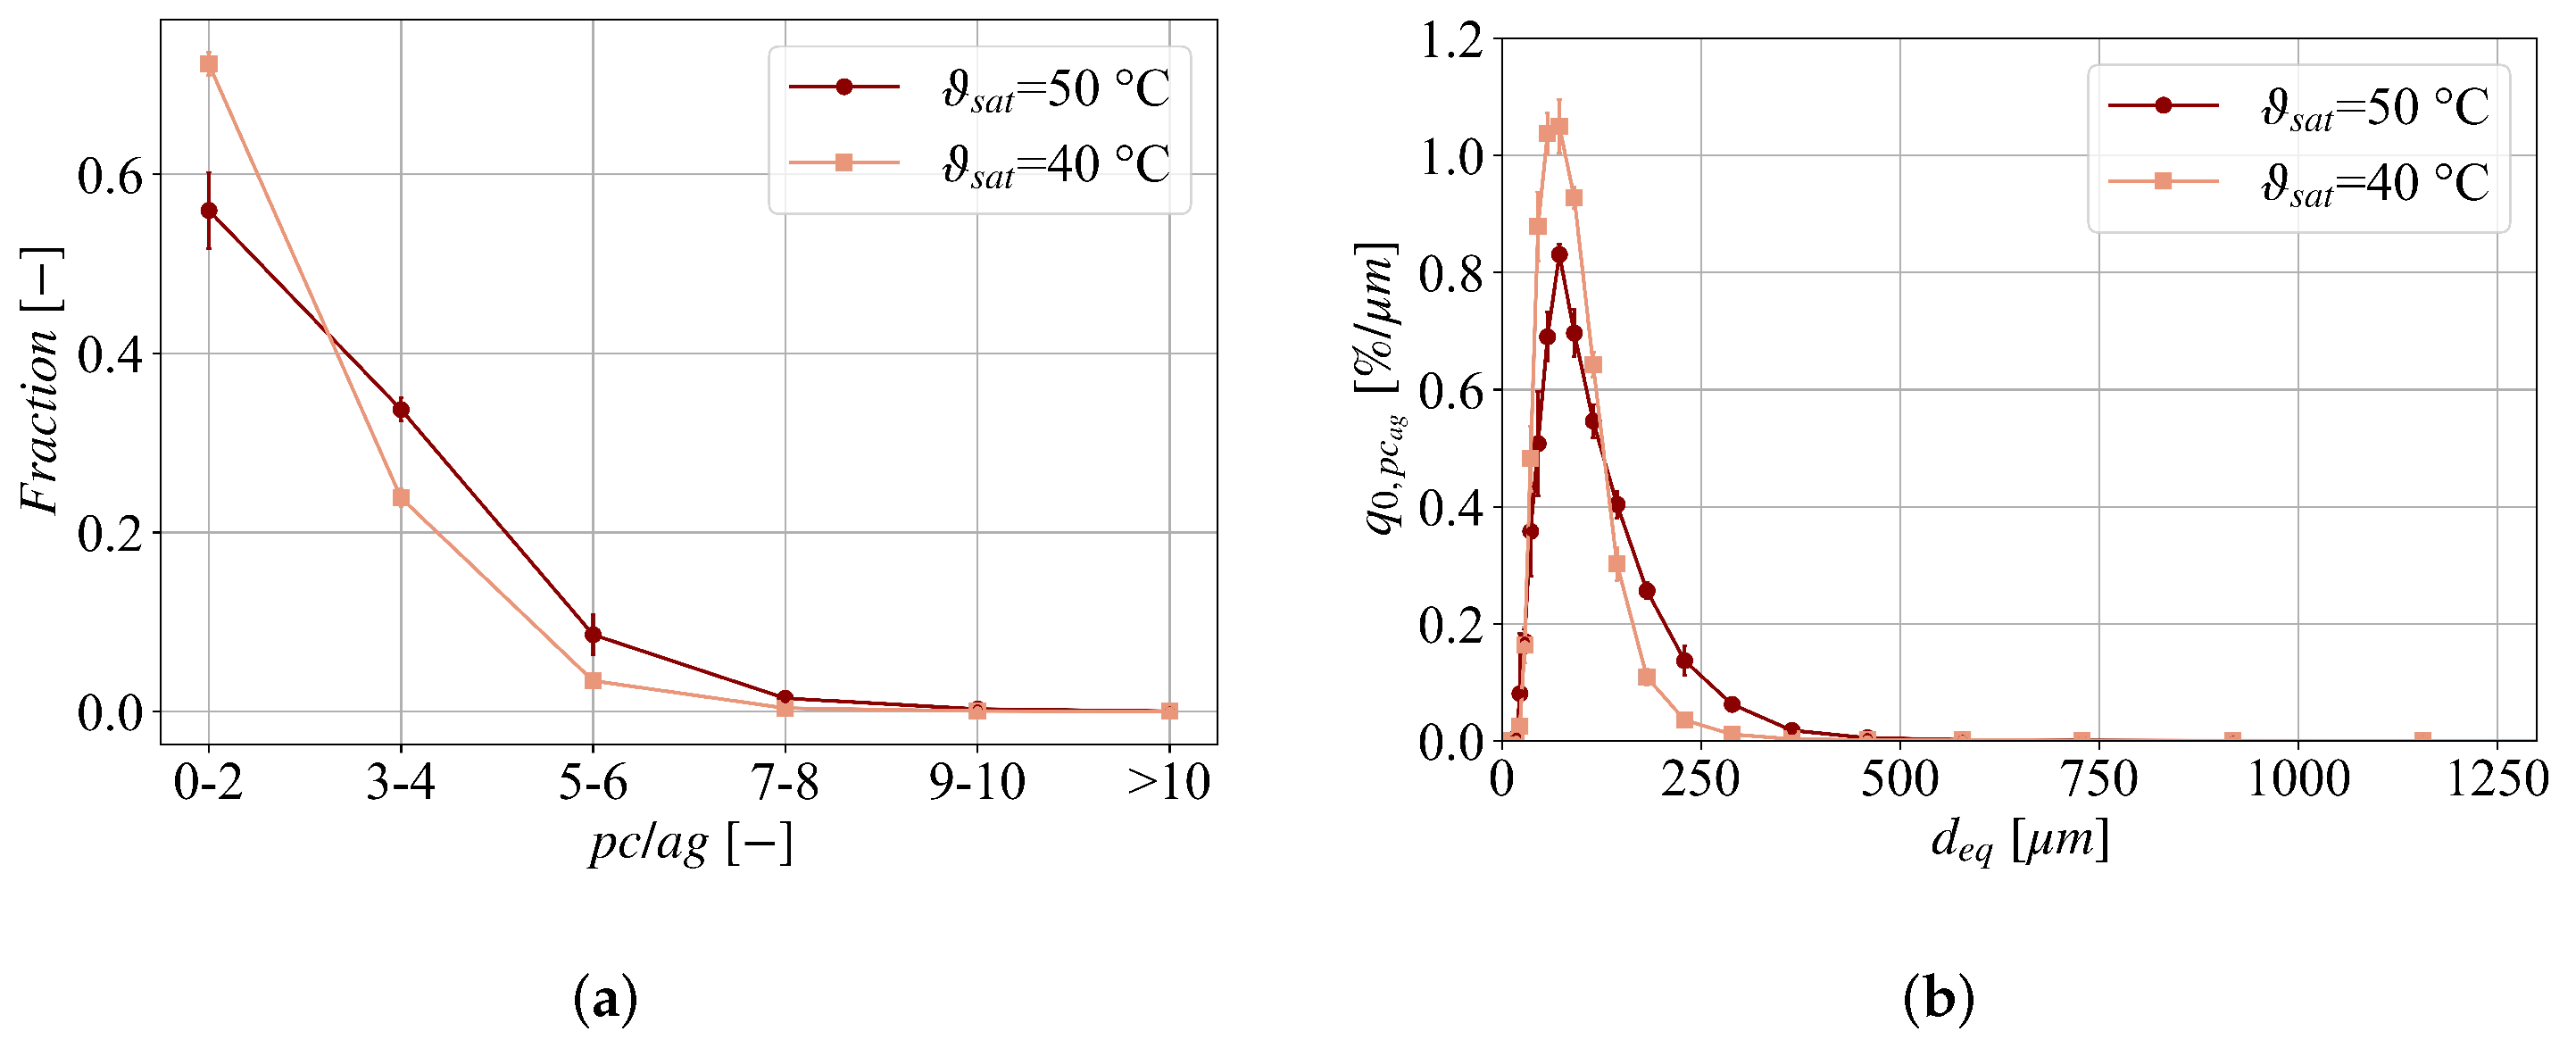
In addition to an averaged number of primary crystals in agglomerates, primary crystals in an agglomerate are characterized in more detail by distributions of size and number of primary crystals in agglomerates (Figure 11). Similar to a PSD, the characteristic value p c / a g instead of the size can be plotted against the fraction of primary crystals within a specified class of p c / a g [4]. In Figure 11a, it is shown that 72% ( ϑ s a t = 40 ° C) and 57% ( ϑ s a t = 50 ° C) of the agglomerates consist of maximally two primary crystals and less than 10% of agglomerates constitute of more than four p c / a g no matter what saturation temperature and agglomerate size. Again, a slight underestimation can be assumed based on the trends shown in Figure 10. However, in connection with Figure 10 and the exemplary images in Figure 7 it is shown that L-alanine crystallized from aqueous solution appears to form agglomerates containing only a few primary crystals per agglomerate and their number does not vary much, mainly between two to four.
Besides number of primary crystals per agglomerate, the size of primary crystals in agglomerates are characterized in Figure 11b. All in all, the primary crystals in agglomerates reflect the subpopulation of single crystals, which means that the primary crystals grow equally in solution and in agglomerates, whereas it is still difficult to identify small primary crystals in agglomerates, larger ones are usually fully imaged. The contours can be estimated successfully so that overlapping does not impact the size calculation. Further, segmentation is facilitated by the moderate agglomeration, since the agglomerates are not very clumpy and mostly they only touch each other without much overlapping.
We conclude that agglomeration takes place during the entire process and no tendencies can be determined whether there are preferred particle sizes that agglomerate with each other. There are agglomerates which consist of primary crystals of the same size as well as those which are composed of primary crystals of different sizes (see also Figure 7). Here a measurement during the process would be helpful to determine the influences regarding time point and particle size of the agglomeration.
5. Summary and Outlook

Deep learning methods show high potential for application in crystallization. They do not only outperform classical image processing methods based on hand-crafted features in connection with machine learning methods, they also enable a more detailed description of the particles. Beside a pixel-wise detection of crystals and classification into single crystals and agglomerates, CNNs also enable the quantification of primary crystals bound in agglomerates. This is not done by a regression or classification task anymore, instead also the primary crystals can be detected and classified on a pixel-level. The characterization of the agglomeration can be extended to a deeper level this way.
For the detection of the three crystal classes, a combination of two Mask-RCNNs has proven to be promising to be able to detect the primary crystals in agglomerates as precisely as possible. Especially big crystals can be evaluated accurately and also the main portion of primary crystals in agglomerates is quantified in a satisfying manner. The limitations of the methods mainly concern strongly agglomerated crystals and small particles in general. These challenges during image processing are not exclusively due to the method itself. After all, it is a very complex task that poses challenges even for the human user. The more detailed the image evaluation is and the more small particles are processed, the more subjective the assessment of the annotation becomes. To counteract the challenges, the image acquisition plays an important role. The particle characterization can be significantly improved by an adapted resolution and a better representation of the crystals where the contours of the individual primary crystals are more clearly visible.
For characterization of agglomeration and quantification of primary crystals in agglomerates the method was applied for L-alanine crystallized from aqueous solution successfully. An increased saturation temperature leads to a longer crystallization time and higher solid content promoting agglomeration throughout the whole crystallization time. This is not only depicted by an increasing agglomeration degree, but also the level of agglomeration by an enhanced number of bounded primary crystals in agglomerates. Especially for bigger agglomerates the bounded primary crystals can be identified pixel-accurately. The primary crystals bound in an agglomerate are predominantly less lumpy and usually consist of fewer than five primary crystals, regardless of size.
As it can be seen, this method can be used to describe the agglomeration behavior in detail and to build up a better understanding. Previously flow cell microscopy has already been integrated in a batch crystallization showing the evolution of crystals in the course of crystallization for a different model system adipic acid/water [12,13]. Difficulties result in the operation, e.g., an influence on nucleation has been observed. Consequently further work will focus on integrating the image analysis into the process without interfering it and incorporating the deeper findings into modeling.

Author Contributions

Conceptualization experiments, J.L. and K.W.; Conceptualization image processing, T.H., F.W. and J.L.; Experimental study and evaluation, J.L.; Set up, training and evaluation CNN, T.H. and J.L.; Data collection, J.L.; writing, J.L. and T.H.; Supervision, administration and review, F.W. and K.W. All authors have read and agreed to the published version of the manuscript.

Funding

This research received no external funding.

Institutional Review Board Statement

Not applicable.

Informed Consent Statement

Not applicable.

Conflicts of Interest

The authors declare no conflict of interest.

Abbreviations

The following abbreviations are used in this manuscript:
AgAgglomeration Degree
agAgglomerate
ANNArtificial Neural Net
APAverage Precision
CNNConvolutional Neural Network
COCOCommon Objects in Context
DFADiscriminant Factor Analysis
FPNFeature Pyramid Network
IoUIntersection over Union
M2_1Method 1 (two-class task)
M3_1Method 1 (three-class task)
M3_2Method 2
M3_2PPMethod 2 with Post-Processing
pcagPrimary Crystals in Agglomerates
PSDParticle Size Distribution
RCNNRegion-based Convolutional Neural Network
scSingle Crystal
SVMSupport Vector Machine

Appendix A

Table A1. Characteristics of dataset.
Data Set (Total)Training SetValidation SetTest Set
N u m b e r [ ] 50343879616539
x 10 , 0 [ μ m]27.928.029.226.1
x 50 , 0 [ μ m]57.257.161.550.8
x 90 , 0 [ μ m]450.2444.9354.9565.2
A g 0.220.220.170.26
Table A2. ANN based on [15]: architecture, training data and performance. The images were taken with QICPIC/LIXELL wet dispersing system (Sympatec, QICPIC R02, camera resolution: 2048 × 2048 pixels; camera pixel size: 5.5 μ m × 5.5 μ m ; measurement module M6: 2:1).
Net architectureMATLAB (R2015a) function patternnet
(one hidden layer with 10 neurons,
2 outputs: Single Crystal/Agglomerate)
Image descriptors usedScaled maximum concavity depth, solidity,
equivalent diameter, circularity
Particle sizes for Training d e q = 11.6 to 234.5 px ( 32.4 to 645   μ m)
Training set size650
Performance Index 0.92 ± 0.03
Table A3. Augmentation methods used and their respective parameters. All values are sampled uniformly within their respective ranges in each training iteration.
AugmentationParameterRangeRemarks
brightnessintensity [ 0.5 , 1.2 ] <1: reduce; =1: preserve; >1: increase
contrastintensity [ 0.5 , 1.2 ] <1: reduce; =1: preserve; >1: increase
mirroringapply { y e s , n o }
blur/sharpenmethod { b , s } Either Gaussian-based blur (b)
σ (intensity) [ 0.8 , 2.9 ] or sharpening (s) is applied
noiseper-channel { y e s , n o } Additive Gaussian noise is applied either
σ (intensity) [ 0 , 50 ] individually or uniformly across channels

References

  1. Brown, C.J.; Mcglone, T.; Yerdelen, S.; Srirambhatla, V.; Mabbott, F.; Gurung, R.; Briuglia, M.L.; Ahmed, B.; Polyzois, H.; Mcginty, J.; et al. Enabling precision manufacturing of active pharmaceutical ingredients: Workflow for seeded cooling continuous crystallisations. Mol. Syst. Des. Eng. 2018, 3, 518–549. [Google Scholar] [CrossRef] [Green Version]
  2. Nichols, G.; Byard, S.; Bloxham, M.J.; Botterill, J.; Dawson, N.J.; Dennis, A.; Diart, V.; North, N.C.; Sherwood, J.D. A review of the terms agglomerate and aggregate with a recommendation for nomenclature used in powder and particle characterization. J. Pharm. Sci. 2002, 91, 2103–2109. [Google Scholar] [CrossRef]
  3. Pitt, K.; Peña, R.; Tew, J.D.; Pal, K.; Smith, R.; Nagy, Z.K.; Litster, J.D. Particle design via spherical agglomeration: A critical review of controlling parameters, rate processes and modelling. Powder Technol. 2018, 326, 327–343. [Google Scholar] [CrossRef]
  4. Ålander, E.M.; Uusi-Penttilä, M.S.; Rasmuson, Å.C. Agglomeration of Paracetamol during Crystallization in Pure and Mixed Solvents. Ind. Eng. Chem. Res. 2004, 43, 629–637. [Google Scholar] [CrossRef]
  5. Kramer, H.J.M.; van Rosmalen, G.M. Crystallization; Academic Press: London, UK, 2000. [Google Scholar]
  6. Brunsteiner, M.; Jones, A.G.; Pratola, F.; Price, S.L.; Simons, S.J. Toward a molecular understanding of crystal agglomeration. Cryst. Growth Des. 2005, 5, 3–16. [Google Scholar] [CrossRef]
  7. Ferreira, A.; Faria, N.; Rocha, F.; Teixeira, J.A. Using an online image analysis technique to characterize sucrose crystal morphology during a crystallization run. Ind. Eng. Chem. Res. 2011, 50, 6990–7002. [Google Scholar] [CrossRef] [Green Version]
  8. Mumtaz, H.S.; Hounslow, M.J. Aggregation during precipitation from solution: An experimental investigation using Poiseuille flow. Chem. Eng. Sci. 2000, 55, 5671–5681. [Google Scholar] [CrossRef]
  9. Papageorgiou, C.D.; Langston, M.; Hicks, F.; Am Ende, D.; Martin, E.; Rothstein, S.; Salan, J.; Muir, R. Development of Screening Methodology for the Assessment of the Agglomeration Potential of APIs. Org. Process Res. Dev. 2016, 20, 1500–1508. [Google Scholar] [CrossRef]
  10. Bari, A.H.; Pandit, A.B. Sequential Crystallization Parameter Estimation Method for Determination of Nucleation, Growth, Breakage, and Agglomeration Kinetics. Ind. Eng. Chem. Res. 2018, 57, 1370–1379. [Google Scholar] [CrossRef]
  11. Wohlgemuth, K.; Schembecker, G. Modeling induced nucleation processes during batch cooling crystallization: A sequential parameter determination procedure. Comput. Chem. Eng. 2013, 52, 216–229. [Google Scholar] [CrossRef]
  12. Heisel, S.; Rolfes, M.; Wohlgemuth, K. Discrimination between Single Crystals and Agglomerates during the Crystallization Process. Chem. Eng. Technol. 2018, 41, 1218–1225. [Google Scholar] [CrossRef]
  13. Heisel, S.; Holtkötter, J.; Wohlgemuth, K. Measurement of agglomeration during crystallization: Is the differentiation of aggregates and agglomerates via ultrasonic irradiation possible? Chem. Eng. Sci. 2019, 210, 115–214. [Google Scholar] [CrossRef]
  14. He, K.; Gkioxari, G.; Dollár, P.; Girshick, R. Mask R-CNN. IEEE Trans. Pattern Anal. Mach. Intell. 2017, 42, 386–397. [Google Scholar] [CrossRef] [PubMed]
  15. Heisel, S.; Ernst, J.; Emshoff, A.; Schembecker, G.; Wohlgemuth, K. Shape-independent particle classification for discrimination of single crystals and agglomerates. Powder Technol. 2019, 345, 425–437. [Google Scholar] [CrossRef]
  16. Kacker, R.; Maaß, S.; Emmerich, J.; Kramer, H. Application of inline imaging for monitoring crystallization process in a continuous oscillatory baffled crystallizer. AIChE J. 2018, 64, 2450–2461. [Google Scholar] [CrossRef]
  17. Terdenge, L.M.; Wohlgemuth, K. Impact of agglomeration on crystalline product quality within the crystallization process chain. Cryst. Res. Technol. 2016, 51, 513–523. [Google Scholar] [CrossRef]
  18. Galata, D.L.; Mészáros, L.A.; Kállai-Szabó, N.; Szabó, E.; Pataki, H.; Marosi, G.; Nagy, Z.K. Applications of machine vision in pharmaceutical technology: A review. Eur. J. Pharm. Sci. 2021, 159, 105717. [Google Scholar] [CrossRef]
  19. Chen, S.; Liu, T.; Xu, D.; Huo, Y.; Yang, Y. Image based measurement of population growth rate for l-glutamic acid crystallization. In Proceedings of the 2019 Chinese Control Conference (CCC), Guangzhou, China, 27–30 July 2019; pp. 7933–7938. [Google Scholar] [CrossRef]
  20. Huo, Y.; Liu, T.; Wang, X.Z.; Ma, C.Y.; Ni, X. Online detection of particle agglomeration during solution crystallization by microscopic double-view image analysis. Ind. Eng. Chem. Res. 2017, 56, 11257–11269. [Google Scholar] [CrossRef]
  21. Cardona, J.; Ferreira, C.; McGinty, J.; Hamilton, A.; Agimelen, O.S.; Cleary, A.; Atkinson, R.; Michie, C.; Marshall, S.; Chen, Y.C.; et al. Image analysis framework with focus evaluation for in situ characterisation of particle size and shape attributes. Chem. Eng. Sci. 2018, 191, 208–231. [Google Scholar] [CrossRef]
  22. Rajagopalan, A.K.; Schneeberger, J.; Salvatori, F.; Bötschi, S.; Ochsenbein, D.R.; Oswald, M.R.; Pollefeys, M.; Mazzotti, M. A comprehensive shape analysis pipeline for stereoscopic measurements of particulate populations in suspension. Powder Technol. 2017, 321, 479–493. [Google Scholar] [CrossRef]
  23. Borchert, C.; Sundmacher, K. Crystal aggregation in a flow tube: Image-based observation. Chem. Eng. Technol. 2011, 34, 545–556. [Google Scholar] [CrossRef]
  24. Borchert, C.; Temmel, E.; Eisenschmidt, H.; Lorenz, H.; Seidel-Morgenstern, A.; Sundmacher, K. Image-based in situ identification of face specific crystal growth rates from crystal populations. Cryst. Growth Des. 2014, 14, 952–971. [Google Scholar] [CrossRef]
  25. Temmel, E.; Eicke, M.; Lorenz, H.; Seidel-Morgenstern, A. A Short-Cut Method for the Quantification of Crystallization Kinetics. 2. Experimental Application. Cryst. Growth Des. 2016, 16, 6756–6768. [Google Scholar] [CrossRef] [Green Version]
  26. Temmel, E.; Gänsch, J.; Lorenz, H.; Seidel-Morgenstern, A. Measurement and Evaluation of the Crystallization Kinetics of l -Asparagine Monohydrate in the Ternary l-/d-Asparagine/Water System. Cryst. Growth Des. 2018, 18, 7504–7517. [Google Scholar] [CrossRef] [Green Version]
  27. Schorsch, S.; Vetter, T.; Mazzotti, M. Measuring multidimensional particle size distributions during crystallization. Chem. Eng. Sci. 2012, 77, 130–142. [Google Scholar] [CrossRef]
  28. Cote, A.; Erdemir, D.; Girard, K.P.; Green, D.A.; Lovette, M.A.; Sirota, E.; Nere, N.K. Perspectives on the Current State, Challenges, and Opportunities in Pharmaceutical Crystallization Process Development. Cryst. Growth Des. 2020, 20, 7568–7581. [Google Scholar] [CrossRef]
  29. Kaur, D.; Kaur, Y. International Journal of Computer Science and Mobile Computing Various Image Segmentation Techniques: A Review. Int. J. Comput. Sci. Mob. Comput. 2014, 3, 809–814. [Google Scholar]
  30. Terdenge, L.M.; Heisel, S.; Schembecker, G.; Wohlgemuth, K. Agglomeration degree distribution as quality criterion to evaluate crystalline products. Chem. Eng. Sci. 2015, 133, 157–169. [Google Scholar] [CrossRef]
  31. Ålander, E.M.; Uusi-Penttilä, M.S.; Rasmuson, Å.C. Characterization of paracetamol agglomerates by image analysis and strength measurement. Powder Technol. 2003, 130, 298–306. [Google Scholar] [CrossRef]
  32. Löbnitz, L.; Böser, M.; Nirschl, H. Influence of Filtration on the Agglomeration Degree of Two Crystalline Amino Acids. Chemie-Ingenieur-Technik 2018, 90, 464–471. [Google Scholar] [CrossRef]
  33. Heisel, S.; Kovačević, T.; Briesen, H.; Schembecker, G.; Wohlgemuth, K. Variable selection and training set design for particle classification using a linear and a non-linear classifier. Chem. Eng. Sci. 2017, 173, 131–144. [Google Scholar] [CrossRef]
  34. Frei, M.; Kruis, F.E. Fully automated primary particle size analysis of agglomerates on transmission electron microscopy images via artificial neural networks. Powder Technol. 2018, 332, 120–130. [Google Scholar] [CrossRef] [Green Version]
  35. Ochsenbein, D.R.; Vetter, T.; Schorsch, S.; Morari, M.; Mazzotti, M. Agglomeration of needle-like crystals in suspension: I. Measurements. Cryst. Growth Des. 2015, 15, 1923–1933. [Google Scholar] [CrossRef]
  36. Suleiman Ahmad, O.; Debayle, J.; Pinoli, J.C. A geometric-based method for recognizing overlapping polygonal-shaped and semi-transparent particles in gray tone images. Pattern Recognit. Lett. 2011, 32, 2068–2079. [Google Scholar] [CrossRef] [Green Version]
  37. Lins, J.; Heisel, S.; Wohlgemuth, K. Quantification of internal crystal defects using image analysis. Powder Technol. 2021, 377, 733–738. [Google Scholar] [CrossRef]
  38. Wan, J.; Ma, C.Y.; Wang, X.Z. A method for analyzing on-line video images of crystallization at high-solid concentrations. Particuology 2008, 6, 9–15. [Google Scholar] [CrossRef]
  39. Neoptolemou, P.; Goyal, N.; Cruz-Cabeza, A.J.; Kiss, A.A.; Milne, D.J.; Vetter, T. A novel image analysis technique for 2D characterization of overlapping needle-like crystals. Powder Technol. 2021, 399, 116827. [Google Scholar] [CrossRef]
  40. Lu, Z.M.; Zhang, L.; Fan, D.M.; Yao, N.M.; Zhang, C.X. Crystal texture recognition system based on image analysis for the analysis of agglomerates. Chemom. Intell. Lab. Syst. 2020, 200, 103985. [Google Scholar] [CrossRef]
  41. Alzubaidi, L.; Zhang, J.; Humaidi, A.J.; Al-Dujaili, A.; Duan, Y.; Al-Shamma, O.; Santamaría, J.; Fadhel, M.A.; Al-Amidie, M.; Farhan, L. Review of deep learning: Concepts, CNN architectures, challenges, applications, future directions. J. Big Data 2021, 8, 53. [Google Scholar] [CrossRef]
  42. Bruno, A.E.; Charbonneau, P.; Newman, J.; Snell, E.H.; So, D.R.; Vanhoucke, V.; Watkins, C.J.; Williams, S.; Wilson, J. Classification of crystallization outcomes using deep convolutional neural networks. PLoS ONE 2018, 13, e0198883. [Google Scholar] [CrossRef] [Green Version]
  43. Salami, H.; McDonald, M.A.; Bommarius, A.S.; Rousseau, R.W.; Grover, M.A. In Situ Imaging Combined with Deep Learning for Crystallization Process Monitoring: Application to Cephalexin Production. Org. Process Res. Dev. 2021, 25, 1670–1679. [Google Scholar] [CrossRef]
  44. Manee, V.; Zhu, W.; Romagnoli, J.A. A Deep Learning Image-Based Sensor for Real-Time Crystal Size Distribution Characterization. Ind. Eng. Chem. Res. 2019, 58, 23175–23186. [Google Scholar] [CrossRef]
  45. Gao, Z.; Wu, Y.; Bao, Y.; Gong, J.; Wang, J.; Rohani, S. Image Analysis for In-line Measurement of Multidimensional Size, Shape, and Polymorphic Transformation of l -Glutamic Acid Using Deep Learning-Based Image Segmentation and Classification. Cryst. Growth Des. 2018, 18, 4275–4281. [Google Scholar] [CrossRef]
  46. Tian, C.; Cai, Y.; Yang, H.; Su, M. Investigation on mixed particle classification based on imaging processing with convolutional neural network. Powder Technol. 2021, 391, 267–274. [Google Scholar] [CrossRef]
  47. Wu, Y.; Lin, M.; Rohani, S. Particle characterization with on-line imaging and neural network image analysis. Chem. Eng. Res. Des. 2020, 157, 114–125. [Google Scholar] [CrossRef]
  48. Frei, M.; Kruis, F.E. Image-based size analysis of agglomerated and partially sintered particles via convolutional neural networks. Powder Technol. 2020, 360, 324–336. [Google Scholar] [CrossRef] [Green Version]
  49. Wohlgemuth, K. Induced Nucleation Processes during Batch Cooling Crystallization. Ph.D. Thesis, Dr. Hut, Dortmund, Germany, 2012; p. 175. [Google Scholar]
  50. He, K.; Zhang, X.; Ren, S.; Sun, J. Deep Residual Learning for Image Recognition. In Proceedings of the 2016 IEEE Conference on Computer Vision and Pattern Recognition (CVPR), Las Vegas, NV, USA, 27–30 June 2016; pp. 770–778. [Google Scholar]
  51. Lin, T.; Dollár, P.; Girshick, R.; He, K.; Hariharan, B.; Belongie, S. Feature Pyramid Networks for Object Detection. In Proceedings of the 2017 IEEE Conference on Computer Vision and Pattern Recognition (CVPR), Honolulu, HI, USA, 21–26 July 2017; pp. 936–944. [Google Scholar] [CrossRef] [Green Version]
  52. Wu, Y.; Kirillov, A.; Massa, F.; Lo, W.Y.; Girshick, R. Detectron2. 2019. Available online: https://github.com/facebookresearch/detectron2 (accessed on 15 September 2021).
  53. Lin, T.Y.; Maire, M.; Belongie, S.; Hays, J.; Perona, P.; Ramanan, D.; Dollar, P.; Zitnick, L. Microsoft COCO: Common Objects in Context. In European Conference on Computer Vision; ECCV, Ed.; Springer: Cham, Switzerland, 2014. [Google Scholar]
  54. Otsu, N. A Threshold Selection Method from Gray-Level Histograms. IEEE Trans. Syst. Man Cybern. 1979, 20, 62–66. [Google Scholar] [CrossRef] [Green Version]
  55. Everingham, M.; Van Gool, L.; Williams, C.K.I.; Winn, J.; Zisserman, A. The Pascal Visual Object Classes (VOC) Challenge. Int. J. Comput. Vis. 2010, 88, 303–338. [Google Scholar] [CrossRef] [Green Version]
  56. International Organization for Standardization. International Standard Particle Size Analysis—Image Analysis Methods; International Organization for Standardization: Geneva, Switzerland, 2014. [Google Scholar]
  57. Terdenge, L.M.; Kossuch, J.A.; Schembecker, G.; Wohlgemuth, K. Potential of gassing crystallization to control the agglomeration degree of crystalline products. Powder Technol. 2017, 320, 386–396. [Google Scholar] [CrossRef]
Figure 1. Exemplary image taken with the QICPIC equipped with LIXELL wet dispersing system of the model system L-alanine/water.
Applsci 12 02465 g001
Figure 2. Overview and systematics of methods developed or evaluated in this study.
Applsci 12 02465 g002
Figure 3. Comparison between Mask-RCNN-based methods developed in this paper.
Applsci 12 02465 g003
Figure 4. Size-dependent AP for M3_2PP.
Applsci 12 02465 g004
Figure 5. Class unknown (644 labeled objects): example images and size characterization.
Applsci 12 02465 g005
Figure 6. Comparison of different size thresholds for Mask-RCNN M3_2PP.
Applsci 12 02465 g006
Figure 7. Visualization of the three-class task using M3_2PP. (a) Single crystals (purple) and agglomerates (green) detected from Figure 1, (b) Primary crystals in agglomerates (random color for each) detected from Figure 1, (c) Exemplary agglomerates: Selected segmented agglomerates (random color for each primary crystal in agglomerate) at the top and the corresponding cropped original agglomerates at the bottom, (d) Insufficiently detected contours of primary crystals in agglomerates.
Applsci 12 02465 g007
Figure 8. Comparison of results for Mask-RCNN and classical approach. (a) Default AP, (b) Size-dependent AP.
Applsci 12 02465 g008
Figure 9. PSD including total crystals (black) and subpopulations of single crystals (green) and agglomerates (magenta) after crystallization for ϑ s a t = 40 ° C on the left (a) and ϑ s a t = 50 ° C on the right (b). The error bars are calculated according to the three replicated crystallizations for each saturation temperature.
Applsci 12 02465 g009
Figure 10. The average number of primary crystals per agglomerate ( p c / a g ¯ ) as function of agglomerate size for ϑ s a t = 40 ° C in bright and ϑ s a t = 50 ° C in dark red. The error bars are calculated according to the three replicated crystallizations for each saturation temperature.
Applsci 12 02465 g010
Figure 11. Number based and particle size distribution of primary crystals in agglomerates for ϑ s a t = 40 ° C in bright and ϑ s a t = 50 ° C in dark red. (a) Number distribution of primary crystals per agglomerate, (b) Particle size distribution of primary crystals in agglomerates.
Applsci 12 02465 g011
Table 1. Size categories of COCO-AP-metric and corresponding actual sizes.
Size (px)Size ( μ m 2 ) d eq ( μ m )
A P s <32 2 <7744<99.3
A P m 32 2 to 96 2 7744 to 69,696 99.3 to 297.9
A P l >96 2 >69,696>297.9
Table 2. Agglomeration degree ( A g ) and number of primary crystals per agglomerate ( p c / a g ¯ ) for the test set; manual annotations compared to the results of different Mask-RCNN approaches.
Ag pc / ag ¯
Annotations0.273.08  
Mask-RCNN M3_10.282.42  
Mask-RCNN M3_20.282.91  
Mask-RCNN M3_2PP0.282.73  
Table 3. Agglomeration degree ( A g ) and number of primary crystals per agglomerate ( p c / a g ¯ ) for different saturation temperatures in batch cooling crystallization. The end temperature is 20 ° C each. The error bars are calculated according to the three replicated crystallizations for each saturation temperature.
Ag pc / ag ¯
ϑ s a t = 50 ° C 0.697 ± 0.016 2.78 ± 0.15  
ϑ s a t = 40 ° C 0.666 ± 0.009 2.11 ± 0.04  
Publisher’s Note: MDPI stays neutral with regard to jurisdictional claims in published maps and institutional affiliations.