Abstract
The bogie is a critical component of a train set. Any failure in the bogies’ structure/mechanism transmission will result in a derailment in the revenue operation. In order to prevent derailment due to bogie failures, the Bogie Instability Detection System (BIDS) is installed on high-speed trains, which provides alarms when abnormality is detected so that appropriate action can be taken. Taking the Taiwan High Speed Rail Corporation (THSRC) as an example, there have been ongoing reports of BIDS alarms since its launch. In almost every case, intermittent warnings are generated when wheel/rail interface faults occur, but no hard fault is found in the bogie’s structure or mechanism. While these reports do not constitute hard faults, corresponding operation actions and inspections are necessary nonetheless. As a result, delays and additional maintenance costs are incurred. In order to save maintenance costs and reduce delays, a decision tree algorithmic approach is proposed to study the potential factors of wheel/rail interface concerns, discover relationships between potential factors, and set up rules for BIDS alarms. In this case study, we found that temperature is the main factor for BIDS alarms; train speed, accumulated mileage, and location are subordinate factors. The proposed decision tree approach can lead to some improvements in preventive maintenance. It also suggests embedding such an intelligent algorithm into BIDS control units for drivers to avoid BIDS alarms.
1. Introduction
1.1. What Is Bogie and the Stability of Bogies
The bogies on rail trains are usually not noticed by rail passengers, but their importance in safe railway operations cannot be overstated since they perform the following functions: (1) support rail train body firmly, (2) run stably on both straight and curved track, (3) ensure good ride comfort by absorbing vibration generated by track irregularities and minimizing impact of centrifugal forces when train runs on curves at high speed, and (4) minimize generation of track irregularities and rail abrasion [1].
1.2. Instability Issues and the Stability Alarm System
When trainset speed is increased, the track shaking degree will also increase, as a result of trainset stability being affected [2]. In order to maintain stability while speeding, components such as rail transmission and related components, for example, damping and brake, should be designed for the trainset to inhibit the hunting movement that may cause rail/wheel to be worn out, therefore increasing the risk of accidents. The hunting movement and rail stability of a trainset is managed by damping systems, air springs and vertical dampers [3], whose positions are shown in Figure 1.
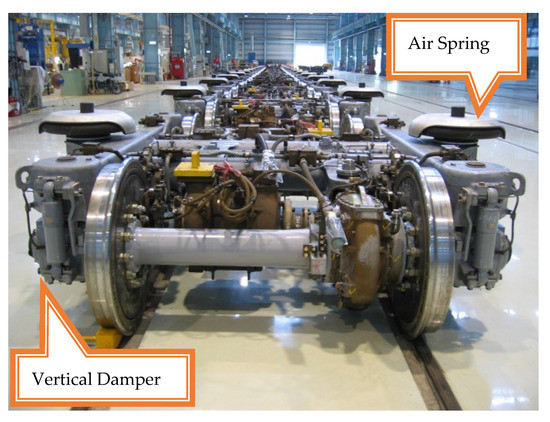
Figure 1.
Positions of air spring and vertical damper systems.
The Bogie Instability Detection System (BIDS) is a physical system designed to detect (1) bogie shaking, and (2) bogie mechanical transmission malfunction. The system will immediately contact the train driver if the predefined value is exceeded, so that they can take appropriate action to avoid a possible train derailment. Further, an onboard computer will display the location of the malfunctioning component or abnormality.
In response to an activated hunting alarm (please refer to Hunting Alarm Standards in [4]), the braking system is activated, and the wheels, tracks, and suspension are inspected after operation [5].
Generally, the alarm is raised if the statistical value of filtered lateral acceleration exceeds the threshold. The main drawbacks are the possibility of false positives and false negatives [6]; the first happens when irregularity disturbances like crosswinds occur, and the latter happens when a motion with small amplitude occurs [7], especially for a supercritical bifurcation. Recently, some new strategies for dynamics monitoring have been proposed, including autocorrelation function separation by Bruni [8], and time-frequency analysis by Bleakley [9]. The goal of the study is to develop a method that is more rational for detecting the hunting motion and assessing the stability performance.
1.3. Bogie Stability Issues Related to the Localization and Management
As the trains run at high performance, maintenance and energy play a major role in the total life costs. Various bogie design features (please refer to bogie parameters, their nominal values, and meanings in [10]) include minimum weights, wears, and specific features for reduced maintenance and energy consumption. Many factors can cause bogie to shake, but we can divide them into two main categories:
- (1)
- A bogie transmission fails due to its structure or its mechanism.
- (2)
- Wheel and rail interface issues [5] occur occasionally.
For the first category of factors, engineers and researchers continually try to determine how failures may occur. There are four possible failure modes [11]: complete air spring failure, complete anti-yaw failure, complete lateral failure, and complete normal failure. Stability and safety of the train are directly affected by the performance of air springs, lateral dampers, and anti-yaw dampers. If the performance of some of the springs has changed or they have failed completely, there will be an abnormal vibration which could possibly cause a serious accident [12].
In the second category of factors, those occasional wheel and rail interface issues are normally unknown. This is because, when identifying out-of-specifications and abnormalities, there are usually unexpected changes in equipment condition. There is also the issue of periodic inspection, which can make it difficult to respond to abnormalities in the process since the inspection tool and the processing equipment are separated by a time delay.
1.4. The Research Gap
Kim [13], pointed out that in addition to bogie transmissions failing due to defects in their structure or mechanisms, or due to wheel and rail interface issues, train vibrations can also be caused by running line restrictions (such as the number of stops, speed limits, etc.). BIDS alarms would also be triggered by such undecided vibrations. However, maintenance is not required following the inspection. An intelligent algorithm that is embedded in BIDS for detecting those alarms that do or do not require maintenance operations is therefore lacking and necessary.
1.5. The Idea behind the Propose Approach
By measuring the technological development on-orbit rate and mapping the stages of technological development as well as its regional diffusion, Gui [14] measure the development of bogie technology. The results indicate that bogie technologies are experiencing sustained growth, and the trend is expected to continue. In terms of scope and speed, however, technological development is accelerating and will continue to accelerate, while global dispersion lags behind.
We have therefore attempted to look at this problem with the help of a data-driven approach [3,6,15], rather than by using a more sophisticated technological approach [16]. BIDS alarms can have a significant impact on the whole system. Since its launch, for instance, the Taiwan High Speed Rail Corporation (THSRC) has reported several problems with BIDS alarms that send intermittently. To find out the main causes, as well as solutions for these failures, several studies are carried out. According to the results, the majority of the failures are caused by problems with the wheel/rail interface.
The purpose of this study is to apply a data mining technique to identify the main factors causing BIDS alarms and the order of factors. In this study, the experimental data can only be accessed by using runtime due to technical and experimental platform reasons [12], and there are no linear or stationary characteristics anywhere in the data collection process. Historically, traditional data processing methods have had difficulty finding the possible link between failure patterns and complex data. The main idea of this study is to use a large amount of data to train a decision tree model. In parallel, the model can be iterated continuously to modify the stored information. The study will also propose possible preventions and suggestions for this problem based on the results of the research, in an effort to reduce unnecessary operation costs and maintenance costs. To validate the proposed framework for fault detection and diagnosis, an empirical study is conducted.
2. Literature Reviews
2.1. Fault Detection and Diagnosis Models
Generally, fault detection and diagnosis models can be divided into model-based, knowledge-based, and data-driven approaches [6]. The model-based and knowledge-based methods [16,17,18,19,20] are usually based on domain knowledge of the physical process and an understanding of the mathematical functional relationships between inputs and outputs for a specific process. Modelling-based methods, however, require extensive parameter setups [21], so they are not easily implemented as comprehensively as they could be for fault detection in real manufacturing systems. For knowledge-based methods to be successful, experts and domain expertise are critical. For the purpose of fault detection and diagnosis, data-driven methods [6,15] are commonly used to choose features from historical data and utilized to facilitate the fault detection process. Data-driven methods utilize statistical analysis, data mining, and machine learning techniques, which allow for the learning of the process and equipment condition from historical data.
Data-driven methods are more appropriate for fault detection and diagnosis in semiconductor manufacturing, due to the complex, interrelated structure of process steps and the complexity of the fault model, when compared to model-based and knowledge-based methods, which both rely on rigorous modeling techniques and domain expertise [22,23,24,25]. For example, when using model-based methods to analyze different process variation and equipment condition due to different recipes for setting the process parameters, different models are required to be used. It is difficult to identify all the variations in a process by using a single mathematical or physical model [26].
2.2. Bogie Instability Detection Systems of High-Speed Rail Trains
As an example, the safety requirements of THSR are consistent with European standards. The operation, in addition to developing and manufacturing 700 train sets based on Japanese technology, has also embedded several additional security systems, including Bogie Instability Detection System (BIDS).
When running, BIDS is used to detect the shaking degree of the bogie. In the event that the set value is exceeded, the system will immediately send an alarm to the train driver with a description of the action to take to avoid possible train derailments.
When BIDS send out an alarm, it will cause the following effects:
- (1)
- Deceleration causes train delays:
To ensure operational safety, trains that share the same rails should maintain a specified distance from each other; this means that when a train decelerates, the following train may also have to decelerate in order to maintain a safe distance. These changes will significantly impact the operating performance of the company.
- (2)
- Alarm causes train to be unserviceable:Unserviceable trains must go through several steps of testing at a maintenance base [27], described as follow:
- Equipment installation status under unserviceable trains
- Bogies and train wheels
- Rail map system
- Onboard recording confirmation
There are several reasons why the bogie shakes; among them, two main factors can be identified:
- (1)
- Structure/mechanism transmission causes failures.
- (2)
- If the set values of other parts are within standard values, it is the failure of the wheel/rail interface that occurs.
2.3. Trainset Stability and BIDS
Zhang Shuguang (2009) stated that, supposing all are in the same rail condition, when trainset speed increases, it also increases the shaking degree of the train rail; therefore, trainset stability is also affected.
To maintain stability while speeding, trainset components including rail transmission and related components such as damping and brake should be designed to inhibit the action of Hunting that may cause the rail/wheel to be worn out and therefore increase the risk of operation caused by the rail/wheel. Therefore, hunting action and rail instability of traditional trains are handled by damping systems, air springs, and vertical damper systems; their positions are shown in Figure 1.
Despite the fact that the high-speed rail system has a similar system of instabilities, the factors affecting trainset instability are extremely complex and numerous. The subject of trainset instability [28], therefore, has been a popular research subject among manufacturers and experts.
The original structure or mechanical transmission mechanism of a BIDS or transmission detection system is designed in such a way that when any abnormal motions occur [29,30], alarms will be automatically sent to the train driver so that he/she can deal with problems quickly.
2.4. Decision Tree
Decision tree is both a powerful and popular algorithm for data classification and prediction. The output of this algorithm is a tree-like graph whose rules can be systematized for humans to understand, or be transformed into a database language like SQL so that any data record can be searched.
The basic concept of decision tree is to input data into the tree through a root node. At this root node, a test is implemented to see which of the next nodes data is classified into. Basically, there are different testing methods at the beginning; however, there is only one goal. This testing process is repeated until all data flows through branch nodes and reaches leaf nodes. Through this testing process, we can see a group of unique paths starting from root nodes and ending at leaf nodes. These paths represent data classification rules that has a well-organized order.
Han and Kamber [31] also explained that the formation of a decision tree does not need any specified knowledge or parameter settings, therefore it is genuinely suitable to look into a knowledge field or to handle with high-dimensional kind of data. Likewise, decision tree can be easily-interpreted by users; this explains the reason why it is very fast and easy for humans to learn and analyze its concept. Currently, decision tree is widely used in several fields, such as medical, manufacturing, operation, finance analysis, astronomy, and molecular biology applications, and so on. The concept of decision tree is shown in Figure 2:
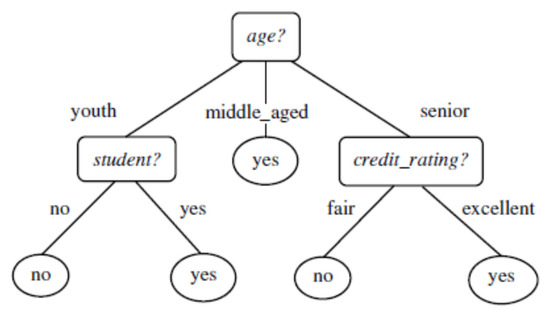
Figure 2.
The concept of decision tree.
In 1970, J. Ross Quinlan proposed a decision tree algorithm called ID3 (Iterative Dichotomiser). ID3 is developed from concept learning systems described by E.B. Hunt, J. Marin and P.T. Stone. Thereafter, Quinlan evolved ID3 into C4.5.
In 1984, Breiman, J. Friedman, R. Olshen, and C. Stone, together with other statisticians, published Classification and Regression Trees (CART), which is a binary decision tree.
It can be said that ID3 and CART were developed in the same period of time. Therefore, learning from the algorithms of both ID3 and CART can be used to expand to different research regarding decision tree.
Han and Kamber [31] indicated that ID3, C4.5 and CART all use the greedy method, whose decision tree is formed by the top-down recursive method and the divide-and-conquer method. Most decision trees are formed by the top-down method, first starting up with data training, following with data division into a small dataset, which makes decision trees keep growing.
Attribute selection is picking out one attribute (field) among already classified labeled groups of data, which is also called segmentation.
In the most ideal situation, all selected attributes can contribute to classification (segmentation) results that each group of data has the same category and high homogeneity. Therefore, the attribute selection indicator is also called the segmentation condition.
Han and Kamber [31] expressed that segmentation condition determines a group of a specific node and how it is classified. Inside these groups, attribute selection indicators have an evaluation standard for each attribute. When determining attribute selection indicators, attributes with the highest standard of measurement are classified attributes.
Basically, commonly used attribute selection indicators are created from different decision tree algorithms, therefore attribute selection indicators are different from each other, as shown in Table 1.

Table 1.
Attribute selection indicators.
Regarding Information Gain, the evaluation standard uses the most valuable information as the classifying attribute whose calculation is based on entropy. Entropy is also known as the degree of disorder. It can be used as an information disorder/instability indicator; the greater entropy is, the higher information instability gets.
Information Gain can be defined as follows:
Info(D) is used to determine all average messages of classified groups in D, which is called entropy of information.
The greater the value of Gain(A), the smaller the degree of disorder that information in A has. This is commonly used to classified information more effectively.
2.5. Summary
BIDS detects the degree of shaking the bogie experiences when it is running. When the set value is exceeded, the system immediately sends an alarm to the train driver describing what action needs to be taken to prevent a possible derailment. BIDS alarms, however, can also be triggered by uncertain vibrations and maintenance is not always required following an inspection. There is a need for an intelligent algorithm for detecting alarms that do not require maintenance. According to [32], in comparison to other algorithms, decision trees require less effort for pre-processing data, and do not require normalization or scaling of data. Additionally, missing values in the data have no impact on the process of building a decision tree [33]. Hence, decision tree algorithms can be a good solution for developing an intelligent algorithm for detecting alarms.
3. Proposed Approach
This research collects all information regarding intermittent alarms caused by bogies instability since 2007.
- (1)
- Information content:
From all the “Trainset failure record” data collected since 2007, this study selected only interval alarms triggered by bogies instability and requested maintenance division to verify its results. Once train sets are tested, if the alarms do not appear to be caused by either bogie instability or data failure, it must be concluded that wheel/rail interface problems are the main cause.
- (2)
- Potential factors for alarms caused by bogie instability:
Bogie transmission failures can be caused by several factors. Apart from trainset problems themselves, other causes of problems include routing conditions, operating conditions, weather conditions, and so on. This study will identify and investigate the key factor that contributes to wheel/rail interface problems.
3.1. Data Collection
A “Trainset Failure Record” and the Maintenance Management Information System (MMIS) are the sources for data for this study. The trainset record failure is a text description of trainset failure, which is shown in Table 2.
Table 2.
Sample of a Trainset Failure Record.
3.2. Data Cleaning and Data Transformation
The purpose of this study is to collect failure record history data on intermittent alarms and to use text descriptions to identify potential factors. Additionally, in order to make sense of the data using a model, it is best to include factors that are not correlated. To identify potential factors from the text description (Table 2), we must also check for under-fitting or over-fitting issues, look for additional features if it is biased, add a regularization term if it is over-fitting. This study identifies three major factors that contribute to trainset instability, which are trainset original problems, rail condition, and operating conditions. It then adds three atmospheric variables [3] to these factors, forming seven major potential factors, which are discussed below:
- (1)
- Factors for trainset original problems are “Trainset accumulated mileages” and “Occurring time”.
- (2)
- Factor for rail condition is “Alarming location”.
- (3)
- Factor for operating condition is “Train speed”.
- (4)
- Factors for atmospheric condition are “Temperature”, “Humidity” and “Rainfall”.
The seven factors mentioned above and their ranking levels are described in more detail as follows:
- (1)
- Alarming location:
If a railway line fails to meet the standard for rail lines (rail lines fail to meet the standard for train wheel roundness), although both of them are within the standard value, intermittent alarms can occur easily due to rail/wheel interface problems, leading to the activation of BIDS. Hence, this factor is used to determine if BIDS alarms usually occur at a specific location.
The following data was collected from the “Trainset failure record”, and these records have been divided into six groups (i.e., L1 to L6, where L1 might represent location between Taipei to Taoyuan, for example), as shown in Table 3. To prevent a public panic, we deidentified the data.
Table 3.
Alarm location groups.
- (2)
- Temperature
We will attempt to determine whether BIDS alarms and temperature are related. The following data are collected from the Central Weather Bureau and categorized from low air group (T1) to high air group (T4), as shown in Table 4.
Table 4.
Temperature groups.
- (3)
- Occurring time
In this trial, we will attempt to determine if BIDS alarms commonly occur in the morning or afternoon and late evening. As shown in Table 5, the following data were collected from “Trainset failure records”, classified into two groups. Again, to prevent a public panic, we deidentified the data.
Table 5.
Occurring time groups.
- (4)
- Train speed
As we already know, increasing trainset speed also increases the shaking degree of train rail, affecting trainset stability. We will determine if BIDS alarms are usually triggered by speeding-up trainsets in this study. Data is collected from trainset speed of the “Trainset failure record”, classified from low speed (S1) to high speed (S4). There are four groups, as shown in Table 6.
Table 6.
Train speed groups.
- (5)
- Trainset accumulated mileages
After mileage accumulates to a certain level, train sets’ wheel interfaces will be less standard. As a result, trainset instability is very likely to occur. It is therefore necessary to carry out periodic wheel inspections and repairs to maintain the roundness of the wheels. In order to discover if there is a connection between BIDS alarms and trainset mileage, this study also focuses on trainset mileage. We categorize the data from low accumulated mileages (M1) to high accumulated mileages (M5). The total number of groups is five, as shown in Table 7.
Table 7.
Trainset accumulated mileage groups.
- (6)
- Humidity
To find out whether BIDS alarm and humidity are related, these data are collected from the Central Weather Bureau and they are divided into two groups, as shown in Table 8.
Table 8.
Humidity groups.
- (7)
- Rainfall
This is an attempt to determine if BIDS alarms correlate with rainfall. The following data are collected from the Central Weather Bureau and there are a total of two groups of data, as shown in Table 9.
Table 9.
Rainfall groups.
Although decision trees can handle categorical variables, it is intended that the higher levels of category be the nodes of the tree. Due to this, we only pre-processed those attributes into two to six levels in this study. Data transformation intensity can be measured by several metrics. Parisot [34] introduced the idea of a data completeness ratio (DCR) to reflect the loss of information due to preprocessing methods (e.g., deletion of records, loss of precision during discretization). The data completeness ratio (DCR) is used in this study. More specifically, the DCR of a modified dataset is obtained by computing the ratio of values that remain unchanged during pre-processing. In this sense, a DCR near 100% represents a slight transformation (and a DCR near 0% represents a considerable transformation). Following data pre-processing, we can obtain the following data format, as shown in Table 10.
Table 10.
Data pre-processing data format.
3.3. Decision Tree Analysis
Data for this study were collected from “Trainset failure records”. Information sources emphasize intermittent BIDS alarms due to wheel and rail interface problems. Furthermore, this study also collects data randomly regarding BIDS alarms for comparison purposes. A total of 320 sets of data are collected, 158 sets are collected from BIDS alarms, and 162 sets are collected from comparison tasks.
These 320 sets of data are divided into two parts in this study. There are 256 training data sets (i.e., 80%) in Part 1, and 64 test data sets (i.e., 20%) in Part 2. For results to be observed, all data needs to be randomly divided, trained, and tested ten times. A partial set of original data is shown in Table 11.
Table 11.
Partial sample set of original data.
In Figure 3, we can see how the decision tree properties are set in PolyAnalyst 6.5. As can be seen from Figure 4, PolyAnalyst 6.5 displays the decision tree analysis results. Figure 4 can be transformed into Figure 5 as follows.
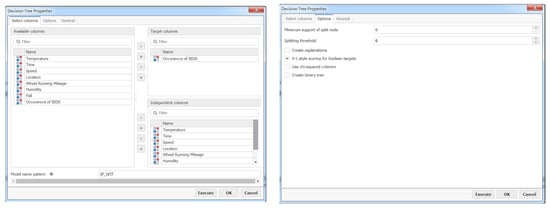
Figure 3.
Screenshots of the PolyAnalyst 6.5 decision tree properties settings.
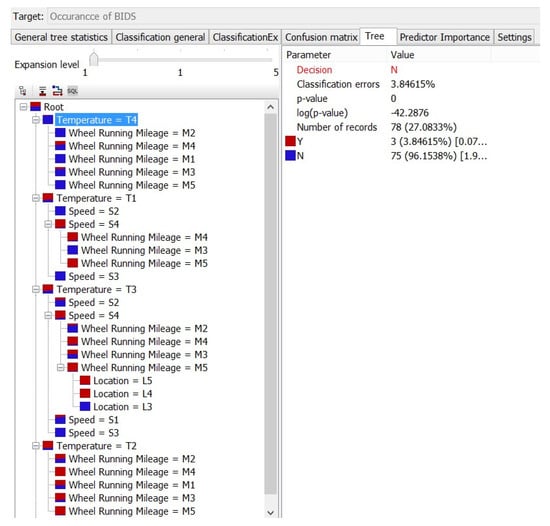
Figure 4.
A screenshot of the decision tree to determine whether maintenance is needed following a BIDS alarm.
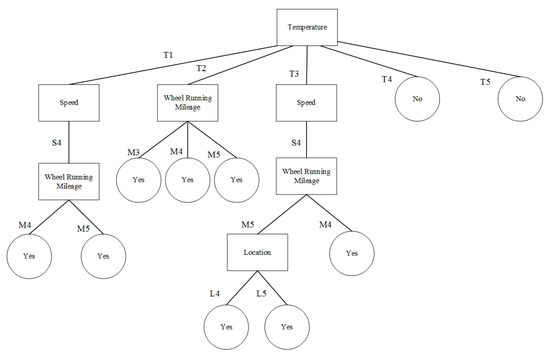
Figure 5.
A decision tree to determine whether maintenance is needed following a BIDS alarm.
According to Figure 5, temperature is the primary cause of BIDS alarms. Train sets do not send out BIDS alarms when temperatures drop in the T4 group and the T5 group. Train speed and trainset accumulated mileages can be classified as subordinate factors when temperature drops from T1 to T3 groups. In general, the higher the train speed and mileage, the more frequently BIDS alarms occur. A higher occurrence rate of L5 and L6 is seen when the temperature falls in the T3 group, train speed is lower in the S4 group, and accumulated mileage is lower in the M5 group. As a rule, an analysis must follow the following:
- (1)
- If temperature = T1 and speed = S4 and accumulated mileages = M4 or M5, BIDS alarm is activated and maintenance is needed after an inspection.
- (2)
- If temperature = T2 and accumulated mileages = M3 or M4 or M5, BIDS alarm is activated and maintenance is needed after an inspection.
- (3)
- If temperature = T3 and speed = S4 and accumulated mileages M4, BIDS alarm is activated and maintenance is needed after an inspection.
- (4)
- If temperature = T3 and speed = S4 and accumulated mileages = M5 and location = L4 or L5, BIDS alarm is activated and maintenance is needed after an inspection.
- (5)
- If temperature = T4 or T5, BIDS alarm is activated and maintenance is not needed after an inspection.
3.4. Management Rules Generation
In order to this study to have higher accuracy, numerous decision methods must be used to forecast unknown data groups, based on [Han and Kamber, 2006]. Figure 6 shows a diagram related to the above.
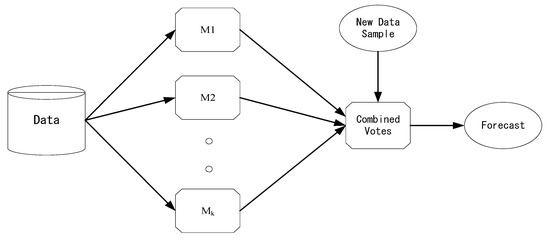
Figure 6.
Increased model accuracy methodology.
This study follows this principle by conducting 10 experiments and counting the number of times each rule occurs.
For this rule “If temperature = T1 and speed = S4 and accumulated mileages = M4 or M5, BIDS alarms are activated and maintenance is needed after an inspection”. It appears in five out of ten experiments, so it is labeled “5 times”. From this figure, we can also obtain the rules and their number of occurrences generated by ten experiments.
As explained by numerous decisions theory, Figure 7 could be processed n more times. The most frequent groups among the experiments were groups M3, M4 and M5. This means that these three groups also need to be further studied.
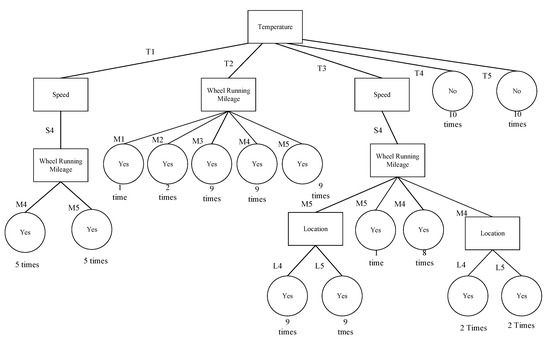
Figure 7.
Ten analysis results of decision tree.
In this study, there are five categories of accumulated mileage factor, as can be seen from Figure 8. Group M1 represents train sets with the lowest accumulated mileage, while group M5 represents train sets with the highest accumulated mileage. In light of wheel roundness and accumulated mileage, it can be concluded that M3 and M5 have the best wheel roundness. This concept states that since the roundness of the wheels on M4/M5 is better than the ones on M3, M3 is more likely to send out BIDS alarms. By taking wheel roundness into account, rules of train set with low accumulated mileage already contain rules of train sets with high accumulated mileage.
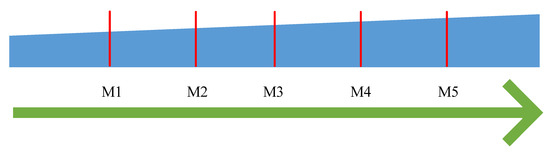
Figure 8.
Trainset accumulated mileage factor.
With respect to train sets belonging to T1, train sets with accumulated mileages of M4 and M5 each occur five times, but rules of M4 already contain rules of M5; therefore, all can be expressed by M4. With the same concept, accumulated mileage rules of train sets belonging to T1 can all be expressed by M3. The decision tree is thus pruned as illustrated in Figure 9.
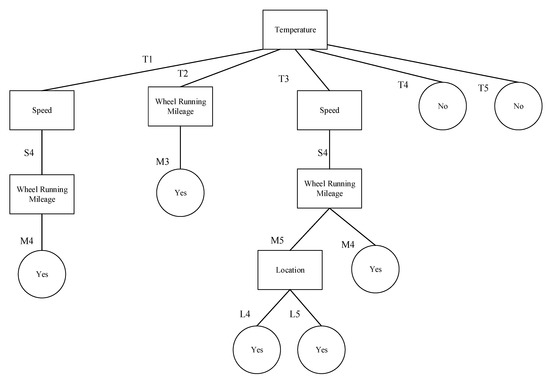
Figure 9.
A decision tree for predict BIDS alarms with or without maintenances.
In analyzing Figure 9, it can be seen that temperature is the main factor for BIDS alarms; train speed and accumulated miles are subordinate factors, as the following rules imply:
- (1)
- If temperature = T1 and speed = S4 and accumulated mileages is M4, BIDS alarm is activated and maintenance is needed after an inspection.
- (2)
- If temperature = T2 and accumulated mileages is M3, BIDS alarm is activated and maintenance is needed after an inspection.
- (3)
- If temperature = T3 and speed = S4 and accumulated mileages is M4, BIDS alarm is activated and maintenance is needed after an inspection.
- (4)
- If temperature = T3 and speed = S4, accumulated mileages is M5 and location is L4 or L5, BIDS alarm is activated and maintenance is needed after an inspection.
- (5)
- If temperature =T4 or T5, BIDS alarm is activated and maintenance is NOT needed after an inspection.
4. Conclusions and Recommendation
4.1. Conclusions
The purpose of this research was to find out potential factors for Bogie Instability Detection System (BIDS) alarms and possible solutions to reduce wheel/rail interface concerns subject to BIDS alarms, so that operating costs and maintenance costs can be reduced.
Based on experiment results in this study, it can be inferred that temperature change is the main factor. However, the rules for this factor can vary from T1 to T4.
According to decision trees, all generated rules have their own forming orders. Hence, aside from temperature as the main factor for BIDS alarms, train speed, accumulated mileage and location are subordinate factors. As to reduce the number of BIDS alarms, there are some improvements that can be made which are described in detail in the following:
- (1)
- Temperature
From experiment results, when temperature falls from group T1 to T3, the number of BIDS alarms increases. However, temperature is a factor that is difficult to control. Moreover, THSR cannot plan its schedules due to temperature change. Therefore, there are no possible improvements that can be made to temperature.
- (2)
- Train speed
From experimental results, when temperature falls from group T1 to T3, it is very likely that alarms occur due to train sets belonging to group S4; therefore; reducing train speed can improve the number of BIDS alarm occurrences. However, it must also be considered that reducing train speed can possibly lead to trainset errors and also reducing train services. Therefore, although it is an effective factor to reduce BIDS alarms, it can lead to serious problems for THSR operation. As a result, improvements by reducing train speed are not feasible.
- (3)
- Trainset accumulated mileages
From experimental results, when temperature falls from group T1 to T3, it is very likely that alarms occur due to train sets belonging to group M3, M4 and M5. Therefore, when trainset accumulated mileages reach near M3, whirling can be implemented to maintain wheel roundness and improve the number of BIDS alarms.
- (4)
- Alarming location
From experimental results, when temperature falls in group T3, it is very likely that alarms occur due to train sets belonging to group L4 and L5. Therefore, due to maintenance on railroad in specific locations, improvement can be made. However, improvement implementation can be made for group T3 only. When temperature falls in group T1 and T2, it is impossible to reduce the number of BIDS alarms. As a result, improvement for alarming location is still very limited.
Based on the above analysis, it can be inferred that when train accumulated mileages reaches near M3, whirling operation can be implemented to reduce BIDS alarms. On the other hand, this takes only maintenance into consideration. Timing of whirling operation can also be a new study topic. Based on experiment results, when temperature falls in group T4 and T5, it is very unlikely for BIDS alarms to occur. Therefore, whirling operation implemented in these periods of time does not only benefit THSR much but is also a waste of maintenance workforce and costs. Note that when temperature reaches near group T3 to group T1, the number of BIDS alarms increases; as a result, timing of whirling operation can be made set to when temperature falls within these three groups.
Based on this study, it can be inferred that when temperature falls from group T1 to group T3, and accumulated mileages reach near M3 where trainset wheels can be whirled, the number of BIDS alarms is reduced.
4.2. Recommendations
This study applies a data mining technique to identify potential factors for BIDS alarms. When temperature falls from group T1 to group T3, and accumulated mileages reach near M3 where trainset wheels can be whirled, the number of BIDS alarms is reduced. Figure 10 shows a BIDS control unit, which also recommends that our proposed decision tree algorithm be embedded into the unit to predict BIDS alarms and to advise drivers on how to avoid them.
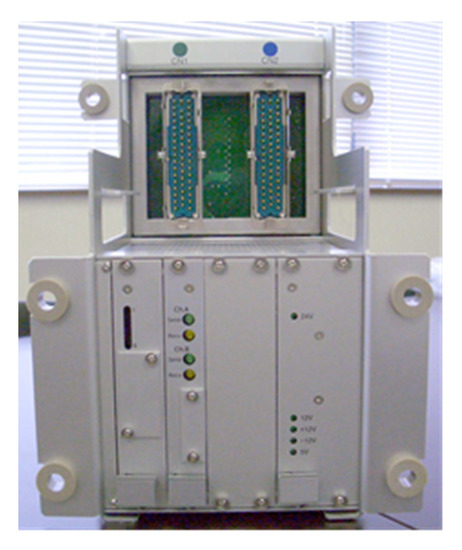
Figure 10.
Control unit for the Bogie Abnormal Swing Detection System.
For improvement and recommendation, data collected from regular maintenance records and failures data from test data can be used for analysis and comparison operations, to figure out if there are any deficiencies from original test data, and also to enhance specification of related operations when adopting in THSR. Before train set maintenance is implemented, this approach can help avoid BIDS alarms occurring again, causing train sets to re-schedule their maintenance operation; therefore, train utilization and additional maintenance costs can be reduced.
Author Contributions
Conceptualization, J.-Y.S.; resources, J.-Y.S.; methodology, S.-T.W.; formal analysis, S.-T.W.; writing—original draft preparation, S.-T.W.; writing—review and editing, J.-Y.S.; supervision, J.-Y.S.; funding acquisition, J.-Y.S. All authors have read and agreed to the published version of the manuscript.
Funding
This research is partially supported by the Ministry of Science and Technology, Taiwan, under the grant MOST 110-2637-E-992-012.
Conflicts of Interest
The authors declare no conflict of interest.
References
- Okamoto, I. How Bogies Work. Jpn. Railw. Transp. Rev. 1998, 18, 52–61. [Google Scholar]
- Andersson, E.; Carlsson, U.; Lukaszewicz, P.; Leth, S. On the environmental performance of a high-speed train. Int. J. Rail Transp. 2014, 2, 59–66. [Google Scholar] [CrossRef]
- Shi, H.; Guo, J.; Zhu, H.; Deng, X. European high-speed bogie technology review. Int. J. Veh. Des. 2019, 79, 43. [Google Scholar] [CrossRef]
- Zeng, Y.; Zhang, W.; Song, D. A new strategy for hunting alarm and stability evaluation for railway vehicles based on nonlinear dynamics analysis. Proc. Inst. Mech. Eng. Part F J. Rail Rapid Transit. 2019, 234, 54–64. [Google Scholar] [CrossRef]
- Yao, Y.; Li, G.; Wu, G.; Zhang, Z.; Tang, J. Suspension parameters optimum of high-speed train bogie for hunting stability robustness. Int. J. Rail Transp. 2020, 8, 195–214. [Google Scholar] [CrossRef]
- Gasparetto, L.; Alfi, S.; Bruni, S. Data-driven condition-based monitoring of high-speed railway bogies. Int. J. Rail Transp. 2013, 1, 42–56. [Google Scholar] [CrossRef] [Green Version]
- Zhang, X.; Wu, G.; Li, G.; Yao, Y. Actuator optimal placement studies of high-speed power bogie for active hunting stability. Veh. Syst. Dyn. 2020, 58, 108–122. [Google Scholar] [CrossRef]
- Bruni, S.; Cheli, F.; Collina, A.; Resta, F. Road Test Data Procedures for Evaluating the Hunting Instability Threshold of a Railway Vehicle from On Board Measurements. Veh. Syst. Dyn. 2000, 33, 168–179. [Google Scholar] [CrossRef]
- Bleakley, S.S. Time Frequency Analysis of Railway Wagon Body Accelerations for a Low-Power Autonomous Device. Master’s Thesis, Central Queensland University, Rockhampton, Australia, 2006. [Google Scholar]
- Gao, X.-J.; True, H.; Li, Y. Sensitivity analysis of the critical speed in a railway bogie system with uncertain parameters. Veh. Syst. Dyn. 2019, 59, 224–244. [Google Scholar] [CrossRef]
- Qin, N.; Jin, W.D.; Huang, J.; Jiang, P.; Li, Z.M. High Speed Train Bogie Fault Signal Analysis Based on Wavelet Entropy Feature. Adv. Mater. Res. 2013, 753–755, 2286–2289. [Google Scholar] [CrossRef]
- Zhang, Y.; Qin, N.; Huang, D.; Liang, K. Fault Diagnosis of High-speed Train Bogie Based on Deep Neural Network. IFAC-PapersOnLine 2019, 52, 135–139. [Google Scholar] [CrossRef]
- Kim, Y.G.; Choi, S.; Kim, S.W.; Kim, Y.M.; Park, T.W. An experimental study on the ride comfort of the Korean high-speed train. Exp. Tech. 2009, 33, 30–37. [Google Scholar] [CrossRef]
- Gui, B.; Ju, Y.; Liu, Y. Mapping technological development using patent citation trees: An analysis of bogie technology. Technol. Anal. Strat. Manag. 2019, 31, 213–226. [Google Scholar] [CrossRef]
- Geng, Y.; Wang, Z.; Jia, L.; Qin, Y.; Chen, X. Bogie fault diagnosis under variable operating conditions based on fast kurtogram and deep residual learning towards imbalanced data. Measurement 2020, 166, 108191. [Google Scholar] [CrossRef]
- Iglesias, E.L.; Thompson, D.J.; Smith, M.; Kitagawa, T.; Yamazaki, N. Anechoic wind tunnel tests on high-speed train bogie aerodynamic noise. Int. J. Rail Transp. 2017, 5, 87–109. [Google Scholar] [CrossRef] [Green Version]
- Li, Y.; Wang, Y.; Zhao, W. Bogie Failure Mode Analysis for Railway Freight Car based on FMECA. In Proceedings of the 2009 8th International Conference on Reliability, Maintainability and Safety, Chengdu, China, 20–24 July 2009. [Google Scholar]
- Bideleh, S.M.M. Robustness analysis of bogie suspension components Pareto optimised values. Veh. Syst. Dyn. 2017, 55, 1189–1205. [Google Scholar] [CrossRef]
- Niu, J.; Wang, Y.; Liu, F.; Li, R. Numerical study on comparison of detailed flow field and aerodynamic performance of bogies of sta-tionary train and moving train. Veh. Syst. Dyn. 2020, 59, 1844–1866. [Google Scholar] [CrossRef]
- Qu, S.; Zhu, B.; Zeng, J.; Dai, H.; Wu, P. Experimental investigation for wheel polygonisation of high-speed trains. Veh. Syst. Dyn. 2020, 59, 1573–1586. [Google Scholar] [CrossRef]
- Zhi, P.; Li, Y.; Chen, B.; Shi, S. Bounds-based structure reliability analysis of bogie frame under variable load cases. Eng. Fail. Anal. 2020, 114, 104541. [Google Scholar] [CrossRef]
- Wu, X.; Cai, W.; Chi, M.; Wei, L.; Shi, H.; Zhu, M. Investigation of the effects of sleeper-passing impacts on the high-speed train. Veh. Syst. Dyn. 2015, 53, 1902–1917. [Google Scholar] [CrossRef]
- Wang, C.; Luo, S.; Xu, Z.; Gao, C.; Ma, W. Research on Bogie Frame Lateral Instability of High-Speed Railway Vehicle. Shock Vib. 2018, 2018, 1–13. [Google Scholar] [CrossRef]
- Yao, Y.; Li, G.; Sardahi, Y.; Sun, J.-Q. Stability enhancement of a high-speed train bogie using active mass inertial actuators. Veh. Syst. Dyn. 2018, 57, 389–407. [Google Scholar] [CrossRef]
- Wang, J.; Gao, G.; Li, X.; Liang, X.; Zhang, J. Effect of bogie fairings on the flow behaviours and aerodynamic performance of a high-speed train. Veh. Syst. Dyn. 2019, 58, 890–910. [Google Scholar] [CrossRef]
- Xiu, R.; Spiryagin, M.; Wu, Q.; Yang, S.; Liu, Y. Fatigue life assessment methods for railway vehicle bogie frames. Eng. Fail. Anal. 2020, 116, 104725. [Google Scholar] [CrossRef]
- Trilla, A.; Gratacòs, P. Maintenance of bogie components through vibration inspection with intelligent wireless sensors: A case study on axle-boxes and wheel-sets using the empirical mode decomposition technique. Proc. Inst. Mech. Eng. Part F J. Rail Rapid Transit. 2016, 230, 1408–1414. [Google Scholar] [CrossRef]
- Sun, Z.; Dai, H.; Gao, H.; Li, T.; Song, C. Dynamic performance of high-speed train passing windbreak breach under unsteady crosswind. Veh. Syst. Dyn. 2018, 57, 408–424. [Google Scholar] [CrossRef]
- Singh, S.; Kumar, R. Evaluation of Human Error Probability of Disc Brake Unit Assembly and Wheel Set Mainte-nance of Railway Bogie. Procedia Manuf. 2015, 3, 3041–3048. [Google Scholar] [CrossRef] [Green Version]
- Zhu, J.; Hu, Z.; Thompson, D. Dataset for The effect of a moving ground on the flow and aerodynamic noise behaviour of a simplified high-speed train bogie. Int. J. Rail Transp. 2017, 5, 110–125. [Google Scholar] [CrossRef] [Green Version]
- Han, J.; Kamber, M. Data Mining: Concepts and Techniques; Morgan Kaufmann Publishers: Burlington, MA, USA, 2006. [Google Scholar]
- Navada, A.; Ansari, A.N.; Patil, S.; Sonkamble, B.A. Overview of Use of Decision Tree Algorithms in Machine Learning. In Proceedings of the 2011 IEEE Control and System Graduate Research Colloquium, Shah Alam, Malaysia, 27–28 June 2011. [Google Scholar]
- Shiau, J.-Y. A semi-automatic planning BOM generator based on VMI forecasting. Int. J. Syst. Sci. Oper. Logist. 2020, 7, 121–132. [Google Scholar] [CrossRef]
- Parisot, O.; Ghoniem, M.; Otjacques, B. Decision Trees and Data Preprocessing to Help Clustering Interpretation. In Proceedings of the 3rd International Conference on Data Management Technologies and Applications—DATA, Vienna, Austria, 29–31 August 2014; pp. 48–55, ISBN 978-989-758-035-2. [Google Scholar]
Publisher’s Note: MDPI stays neutral with regard to jurisdictional claims in published maps and institutional affiliations. |
© 2022 by the authors. Licensee MDPI, Basel, Switzerland. This article is an open access article distributed under the terms and conditions of the Creative Commons Attribution (CC BY) license (https://creativecommons.org/licenses/by/4.0/).