Review

The Effect of Dynamic Lighting for Working Shift People on Clinical Heart Rate Variability and Human Slow Wave Sleep

Graduate Institute of Colour & Illumination Technology, National Taiwan University of Science and Technology, Taipei City 106335, Taiwan
*
Author to whom correspondence should be addressed.
Appl. Sci. 2022, 12(5), 2284; https://doi.org/10.3390/app12052284
Submission received: 31 December 2021 / Revised: 14 February 2022 / Accepted: 16 February 2022 / Published: 22 February 2022
(This article belongs to the Special Issue Advances in Human-Centric Lighting)

Abstract

:

Featured Application

Autonomic Nervous System under Dynamic Lighting Sleep Environment.

Abstract

The quality of sleep during lunch breaks will affect the work efficiency, concentration, and mood of workers, and then increase the performance of workers. In this study, Dynamic CCT lighting is proposed as a method to control sleep quality, and a novel hypnotic lighting system is developed according to the experimental design. Pulse width modulation(PWM) is used for controlling sleep lights and adjusting and controlling the spectrum intensity of polychromatic LED to realize the color mixing, which conforms to CCT, illumination, uniformity, and other parameters in the experimental design. The control group of this study is in a dark room, and the experimental group is given dim light and Dynamic CCT lighting. Through volunteer psychological questionnaire evaluation, objective Sleep Wrist Actigraphy and Heart Rate Variability (HRV) are used analyzing sleep quality and Autonomic Nervous System (ANS). The result is found that the sleep environment with Dynamic CCT lighting is better than that with Dim light in three kinds of sleep lighting environments, while the sleep environment of Dynamic CCT lighting is very similar to that of a dark room. In terms of work efficiency after sleep, Dynamic CCT used in the sleep environment of lighting and Dim light is significantly better than that in a dark room.

1. Introduction

Office workers in Taiwan, under the pressure of long working hours and heavy workload, are seriously troubled by sleep. Research and development personnel and shift workers, with long working hours, frequent business trips, and theier role in decision making, have to suffer from high responsibilities and pressure, so the insomnia conditions might be worse than general laborers [1]. Insomnia is a common problem nowadays that affects people’s health, spirit, emotion, and behavior. Chronic insomnia could even result in serious problems. In adequate rest can worsen physical conditions and result in more diseases. A lot of people try medication but it induces lots of bad side effects [2,3].
Work stress results in increasing risks of cardiovascular problems. Meta-analysis in literatures revealed the correlations between stress models and coronary artery disease [1,2,3]. Research through volunteersive sleep quality questionnaire also found the positive correlation between different work stress models and insomnia [4,5,6,7,8]. Collins et al. studied laborers in electronics factories (including supervisors, professionals, and technicians) with volunteersive sleep quality questionnaire and discovered that workplace atmosphere and social support influenced different insomnia symptoms, such as difficulty initiating sleep (DIS), difficulty in maintaining sleep (DMS), and early morning awakening (EMA) [5]. Over commitment to work and job strain can result in insomnia, and effort-reward imbalance could continue the symptoms [7]. If the long-time insomnia condition is not improved, it might result in three hyper chronic diseases, cardiovascular symptoms, and mental problems. In the 2009 national sleep survey, it was discovered that insomnia seriously appeared to be a “comorbidity” with hypertension, cardiovascular disease, and diabetes, and one out of four chronic insomnia sufferers suffered from three-hypers. The effect of work stress on cardiovascular health and sleep quality was apparent.
In the research on the correlation between heart rate variability (HRV) and sleep problems of workers on workdays, Jackowska et al. indicated that root mean square of the successive differences (R-MSSD) for time-domain HRV was inversely proportional to the seriousness of insomnia [9]. Aiming at the research on healthy adults in 1997, Bonnet and Arand [10] found increasing high frequency (HF) and decreasing low frequency (LF) during non-rapid eye movement (NREM), while the change in chronic insomnia sufferers was small. Successive studies also pointed out the relationship between other HRV indicators, e.g., heart rate (HR) or standard deviation of normal-to-normal interval (SDNN), and sleep [11,12]. During non-rapid eye movement (NREM), both HR and SDNN would decrease, while they would increase during rapid eye movement (REM) and being awake. In comparison with normal people, the change in insomnia sufferers was small [13,14].
Furthermore, other sleep disorders are related to autonomic nervous activity. In the research of Shinar [15,16], people with obstructive sleep apnea (OSA) or sleep disorders showed the higher LF/HF ratio than normal people during sleep onset (SO). In this case, LF/HF of HRV could be used as the reference for obstructive sleep apnea. Summing up the above studies, the measurement and analyses of HRV could be applied to evaluate supervisors’ autonomic nervous and insomnia problems caused by work stress [17].
In past studies, it was discovered that the use of short-wavelength light during the day or before sleep would inhibit melatonin and affect human circadian rhythms [18,19]. Accordingly, a novel hypnotic lighting system is proposed in this study. With volunteersive psychological questionnaire evaluation, objective HRV is used for analyzing sleep quality and ANS for midday lighting human factors experiments. Norton et al. (2017) revealed that the volunteerss’ brains would appear steady state visually evoked potential (SSVEP) under the radiation of constant frequency flash during the sleep [1,20]. The brain slow-wave activities would be enhanced through slow color temperature changes. The research proved that the increase in brain slow-wave δ stood for getting into deep sleep, which was different from inhibiting melatonin with high-intensity white light [15,16]. It is expected to prove the assistance of the novel hypnotic lighting system in sleep through experimental data.

2. Materials and Methods

The experimental method is divided into three parts, namely the novel hypnotic lighting system, and the design and application of three experimental light sources. The second part is the description of experimental limitations and planning, and the third part is the design and planning of the entire experimental process.

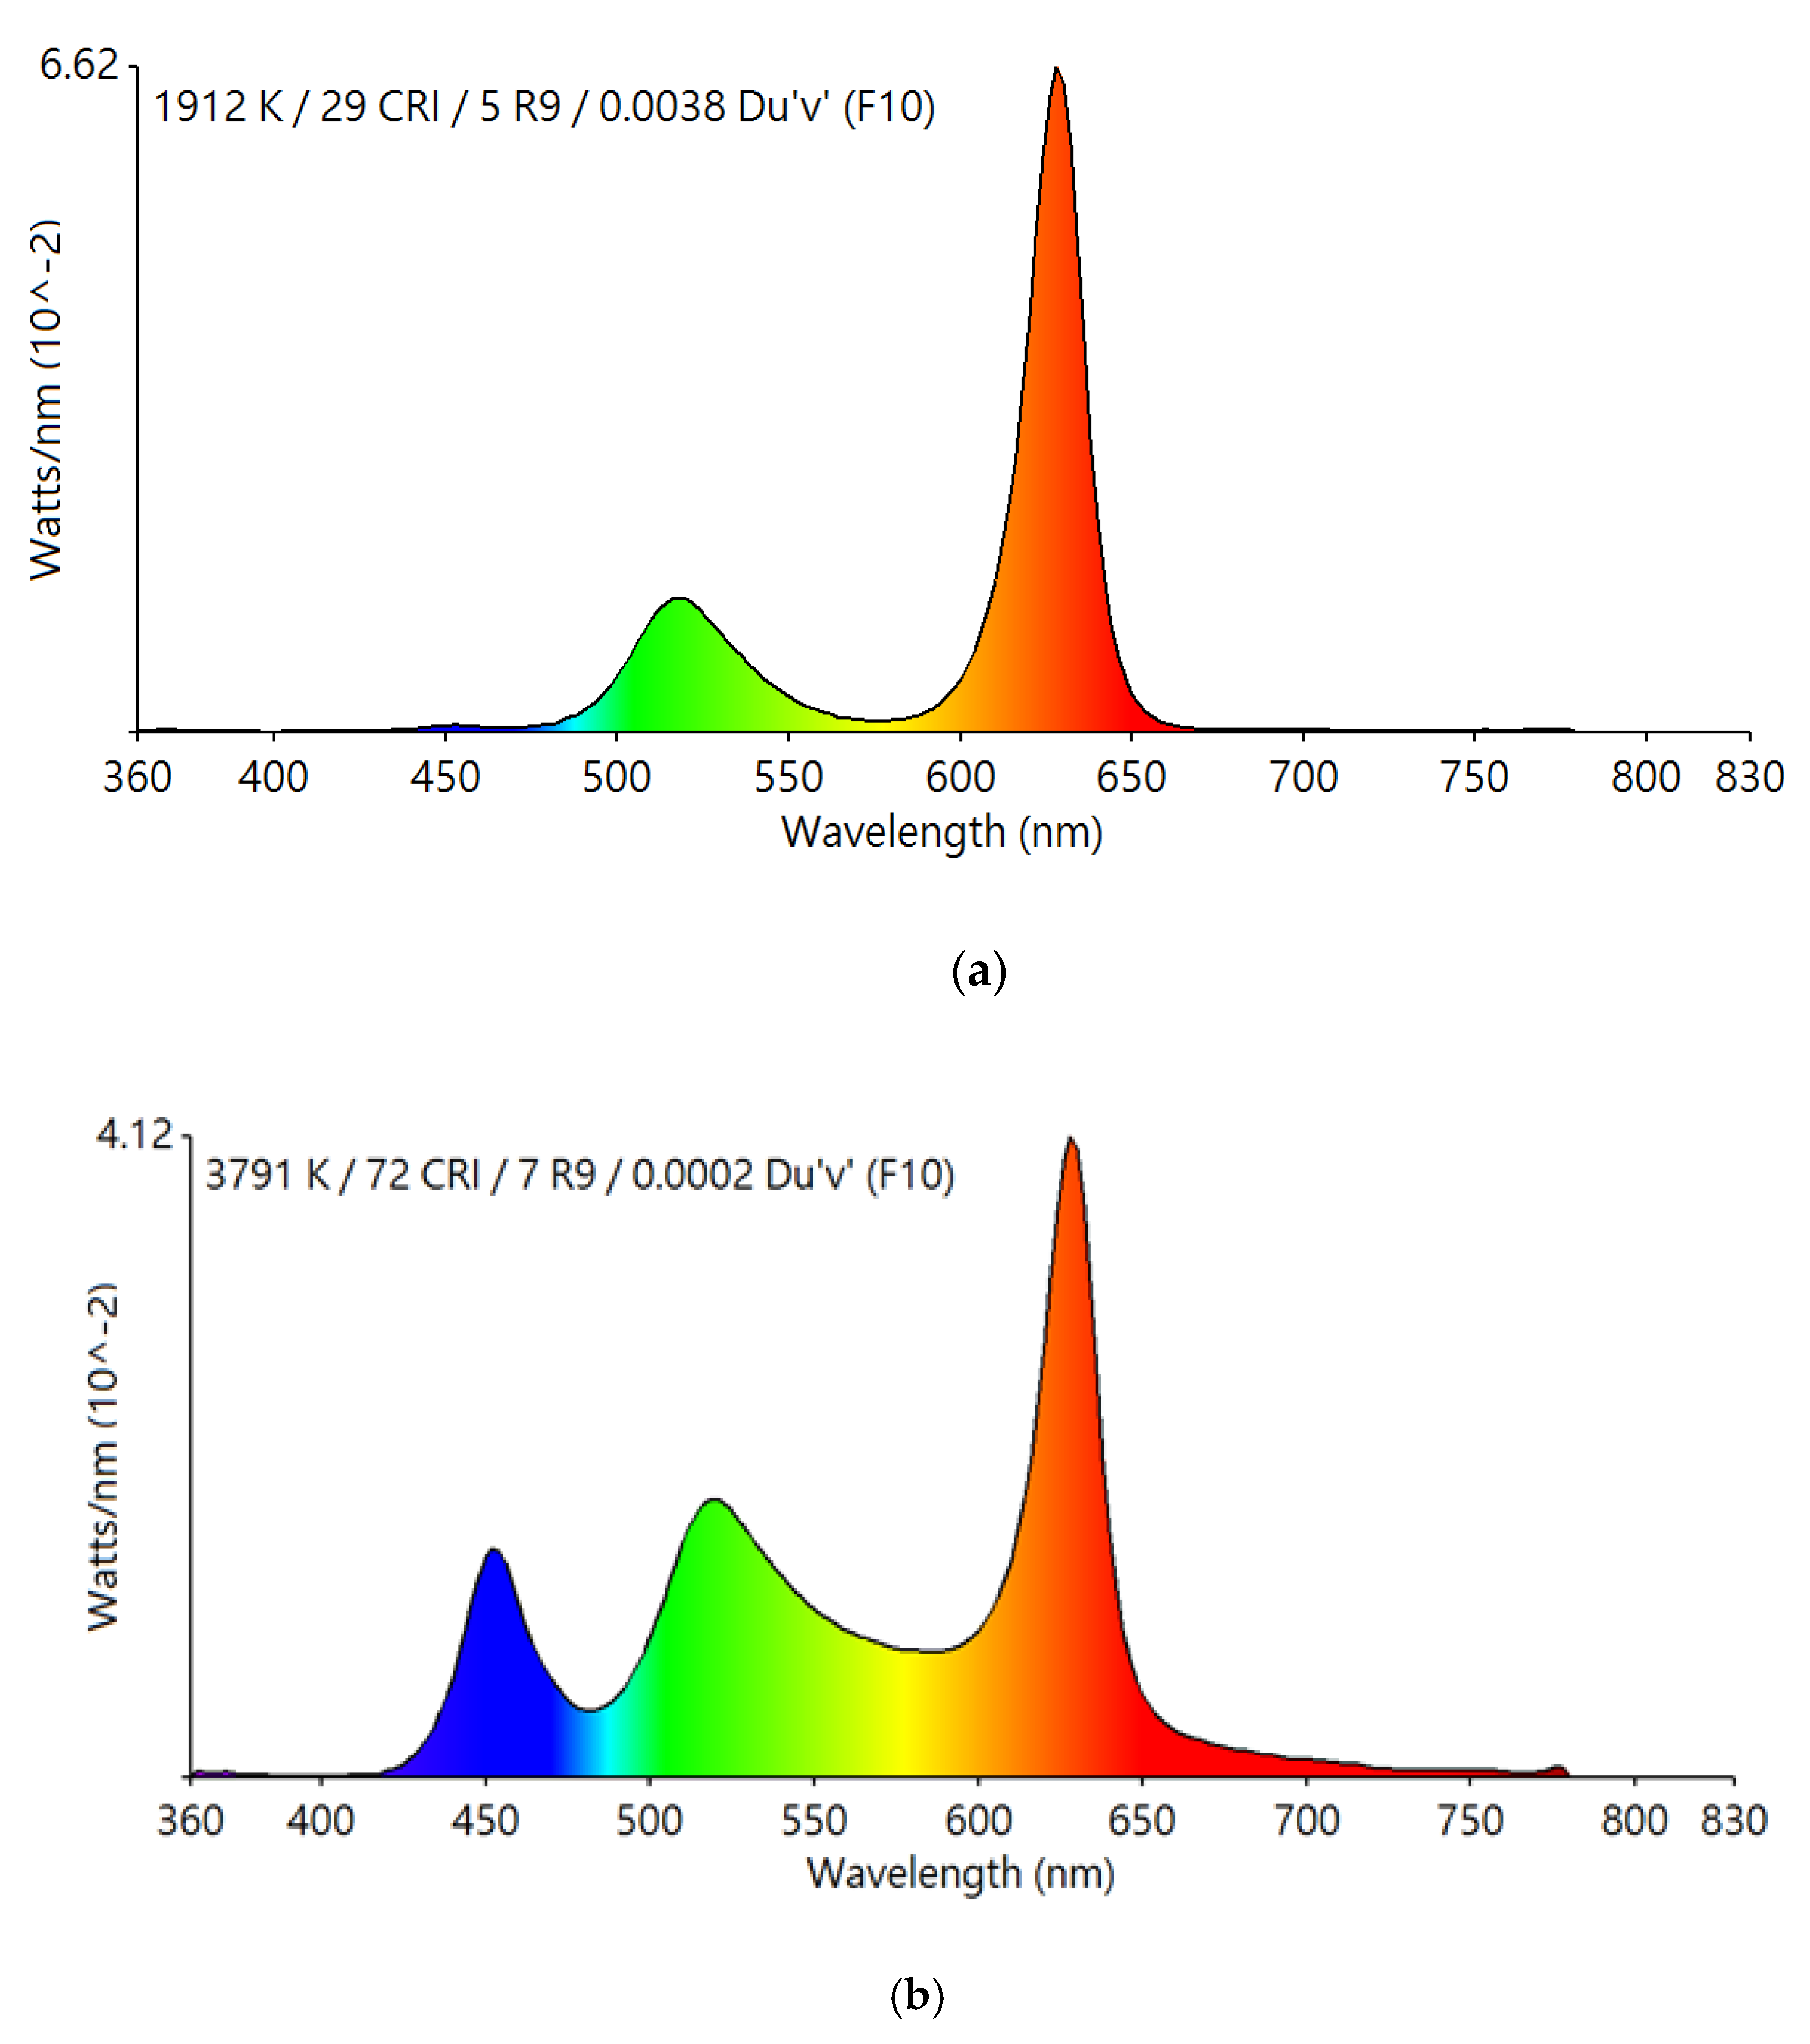
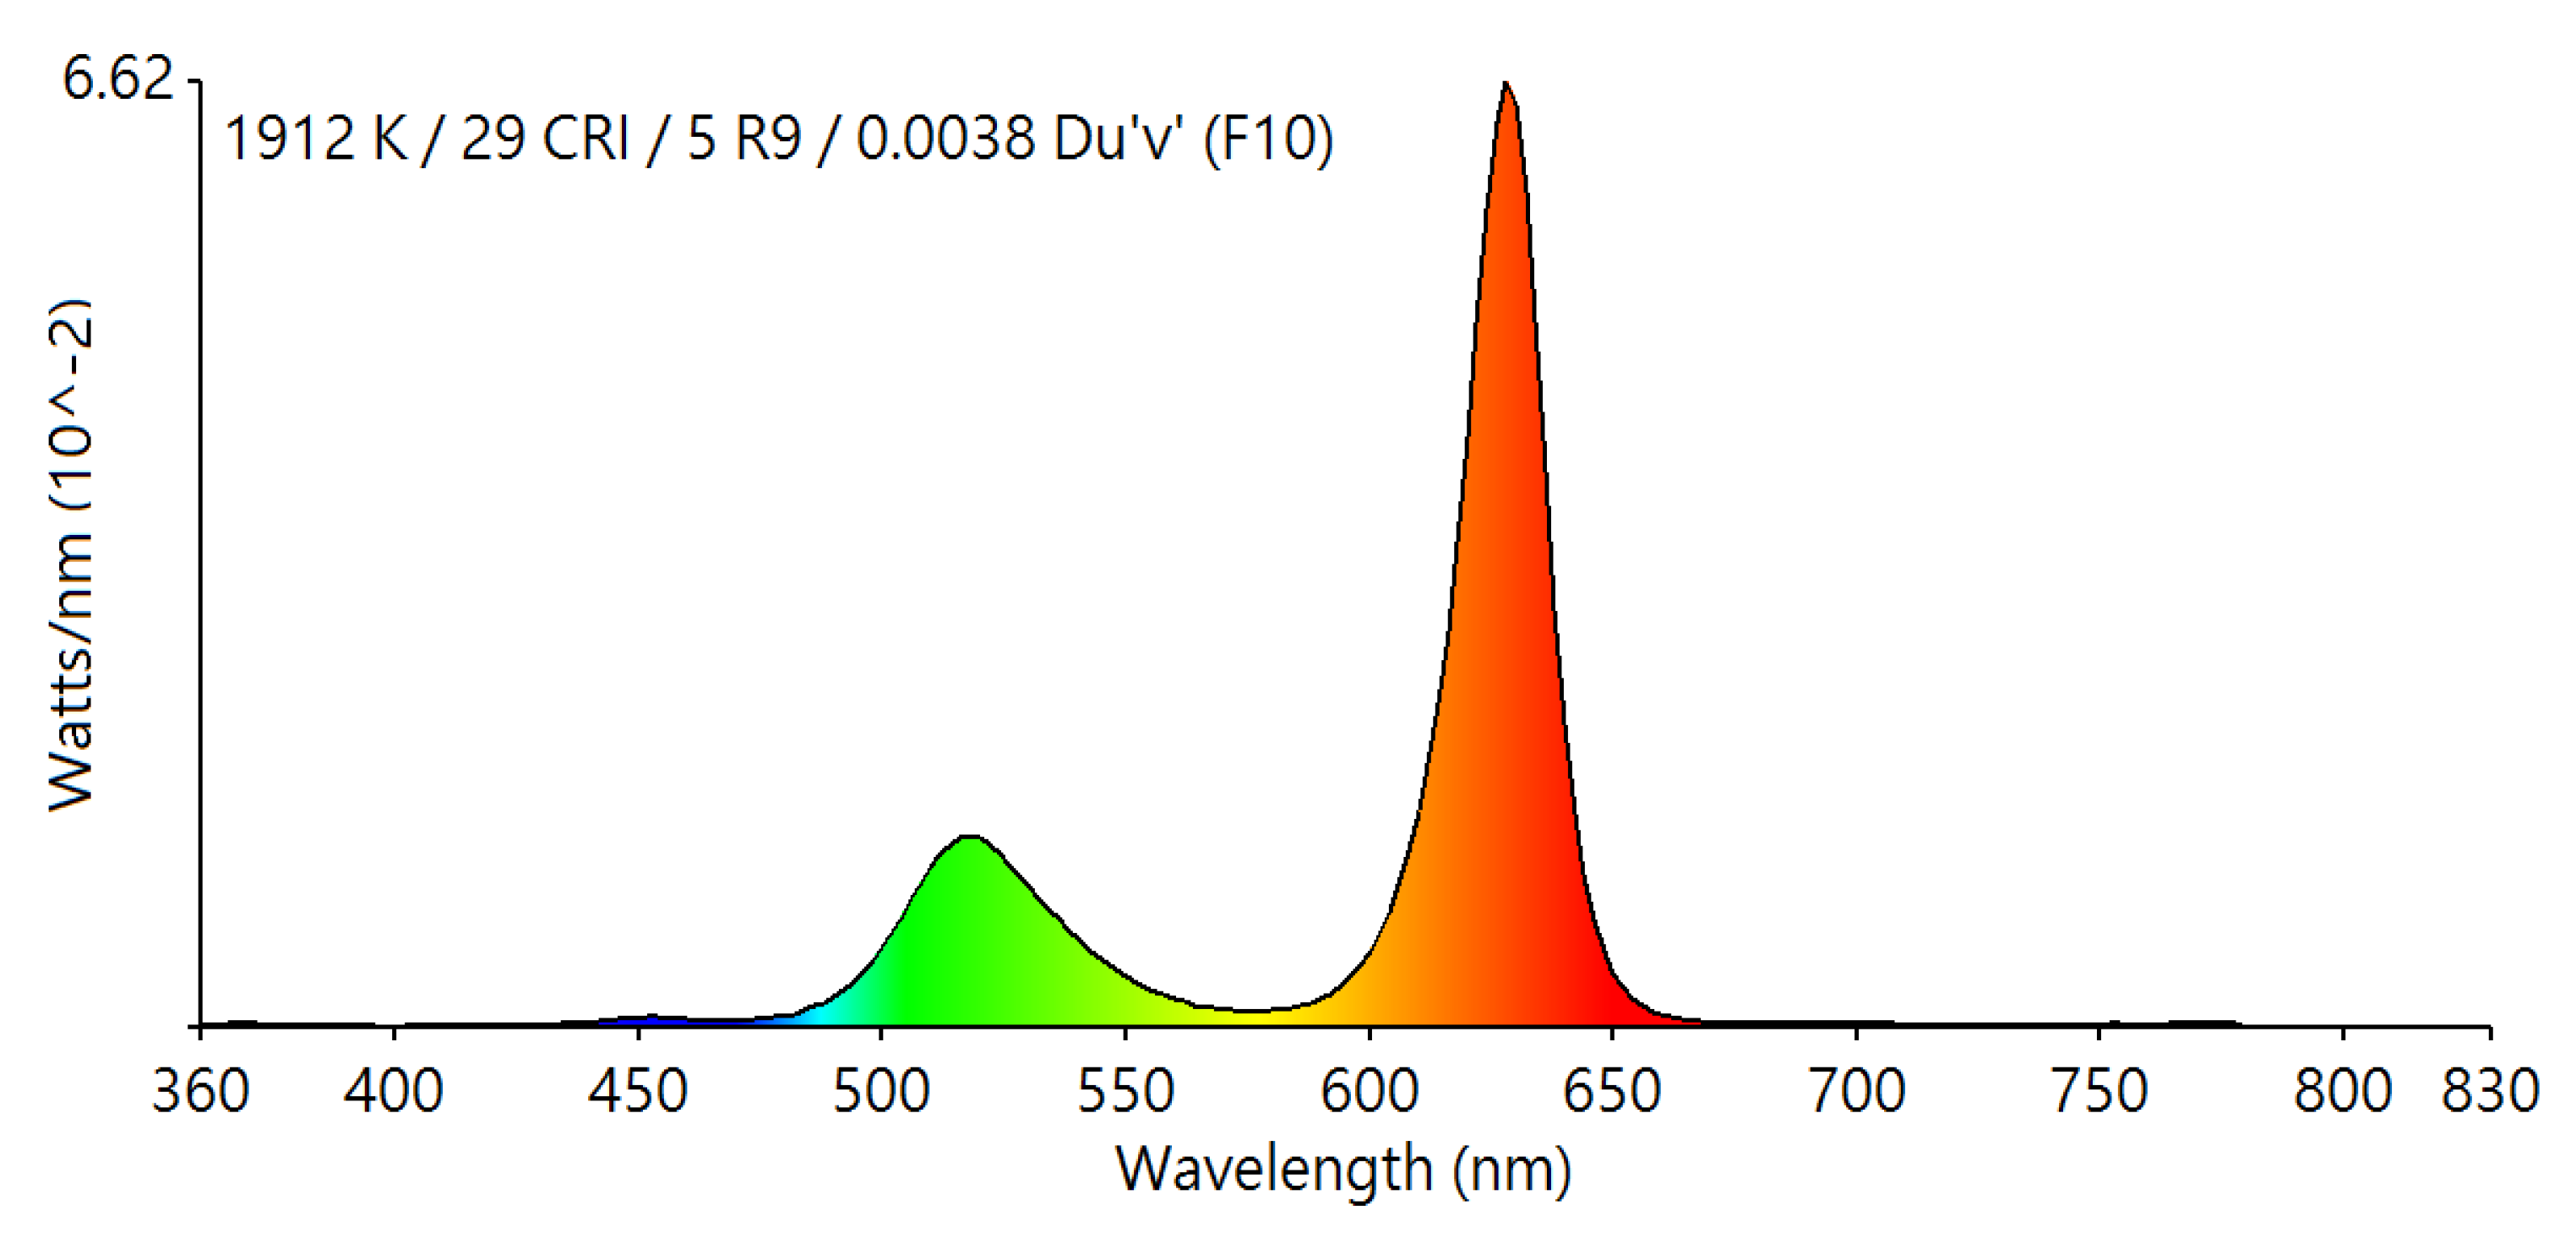
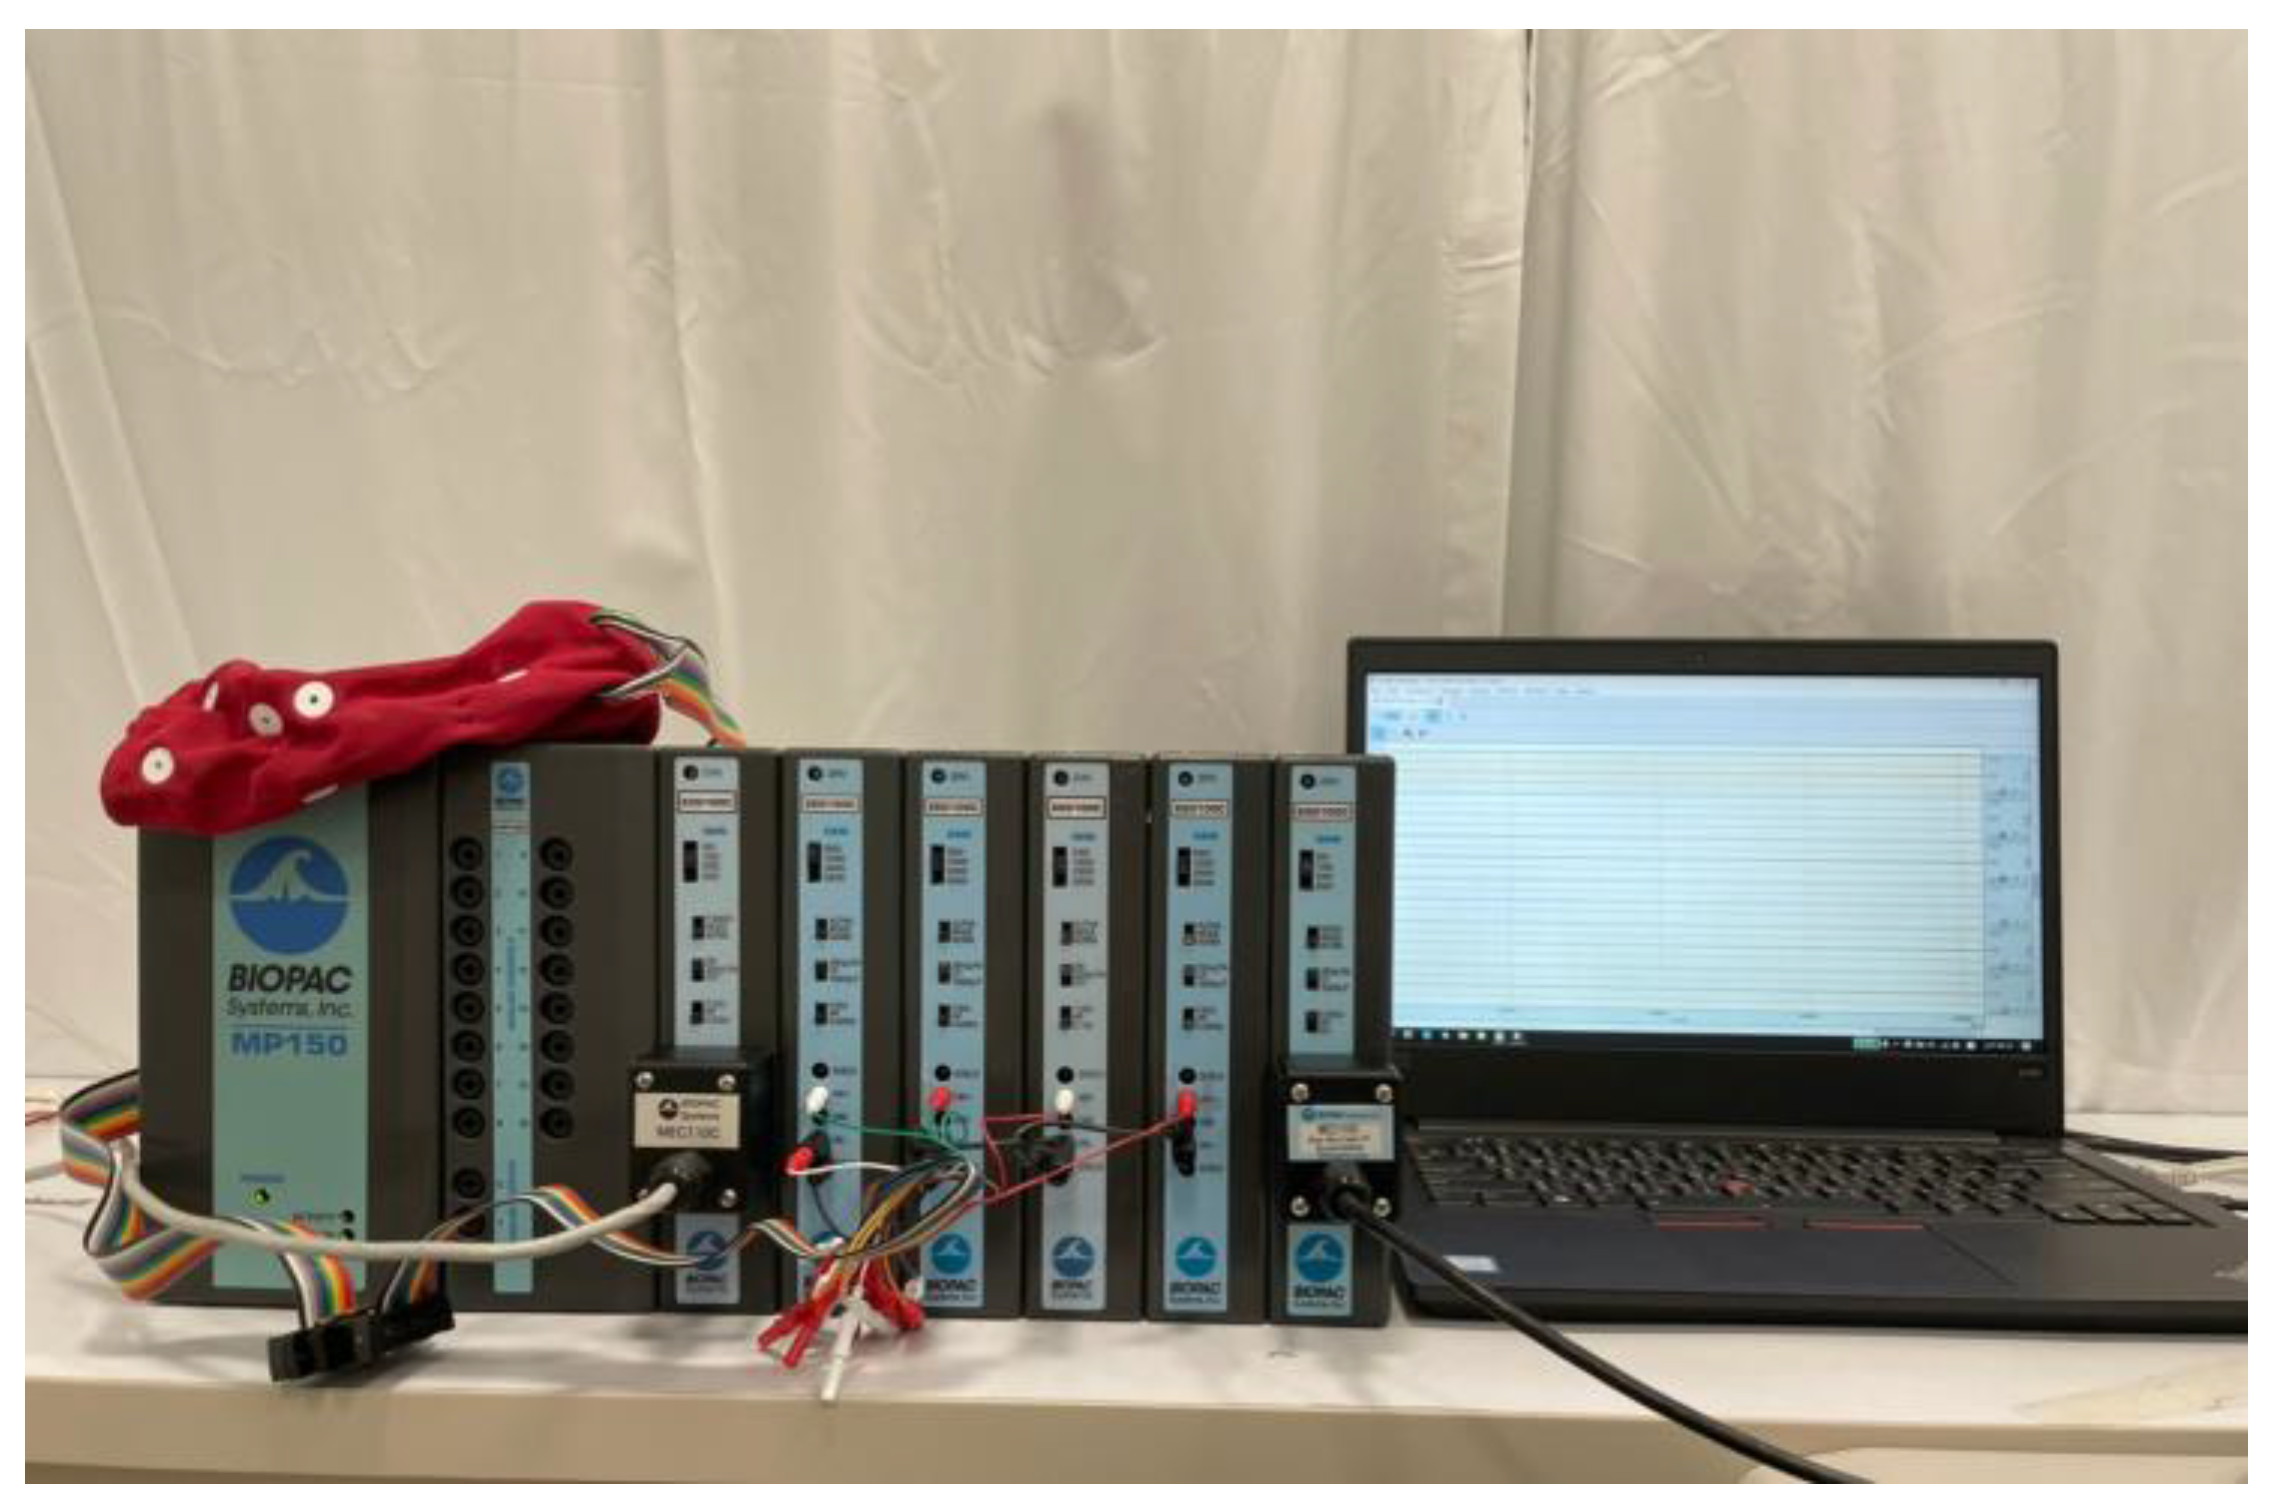
2.1. Development of Novel Hypnotic Lighting System

According to the research of Kathleen E. West et al. [21] and the results of CIE, Photobiology Safety Technical Manual, when the Correlated Color Temperature (CCT) exceeds 4000 K, it can significantly inhibit the secretion of melatonin in the human body, 4000 K. There is no obvious inhibition in the following [21], and the human eye has a significant inhibition of melatonin in the 460–480 nm band of blue light and achieves the peak effect [22]. In this study, the design of light source parameters refers to the past research results of our team [23,24,25] to design the dynamic lighting as the experimental light source.
Therefore, this experiment designed three light environments for sleep experiments. The three experimental light sources all use our self-designed novel hypnotic lighting system to simulate the required light sources. Figure 1 is the control and correction flow chart of the novel hypnotic lighting system control and correction. The first light environment has a dark room, and no lights are turned on in a completely dark environment. The second is Dynamic CCT lighting, which changes back and forth from CCT 1900 K to 3800 K, as shown in Figure 2 and Figure 3. The third light environment is Dim light, referring to the light source parameters of night lights on the market, the CCT is 1900 K, as shown in the light source spectrum in Figure 4.

2.2. Experimental Limits and Regulations

Forty office workers (age 20–40), including 21 males (29.54 ± 1.85 years old) and 19 females (28.00 ± 1.42 years old), participate in this study. The entire typing task and sleep experiment are performed in room that is not disturbed by outside light is performed, as shown in Figure 5. The temperature of the whole room was maintained at 25 ± 1°, there was a desk and chair, volunteers were provided to perform the typing task, and a psychological questionnaire was filled out; a simple bed was provided to perform the sleep experiment task.
The volunteers are required to have normal sleep schedules and are prohibited from consuming any substances that contain caffeine or alcohol 8 h before the experiment. The volunteers, without visual dysfunction or cardiovascular diseases, are required to sleep for 8 h the night before the experiment. The volunteers adapt to the lighting conditions for 5 min before sleeping for an hour. Their sleep is monitored by ECG monitoring for the entire duration. The actual experimental environment is shown in Figure 6; the volunteers are asked to adopt a reclining sleep position.
We used the wrist sleep actigraph (ActiGraph wGT3X-BT) to monitor in order to ensure that the volunteers slept for eight hours the night before the experiment. This wrist sleep actigraph standby is quite long lasting (25 days). When setting the wrist sleep actigraph, you can turn on the execution flashing light reminder and pay attention to the wrist sleep actigraph power and record execution at any time. The day before the experiment, the volunteers will be invited to come and wear the wrist sleep actigraph after work, and they will not need to take off the wrist sleep actigraph all night. The wrist sleep actigraph analysis (ActiLife’s) software algorithm can directly distinguish whether it has not been worn for a long time and whether it has been idle for a long time on the table. The wrist sleep actigraph has a 3-axis accelerometer and digital filtering technology, so it can clearly record the wearer’s activity history. Figure 7 shows that after a long period of demonstration, the software directly shows that the wrist sleep actigraphhas not captured the volunteers data at all.

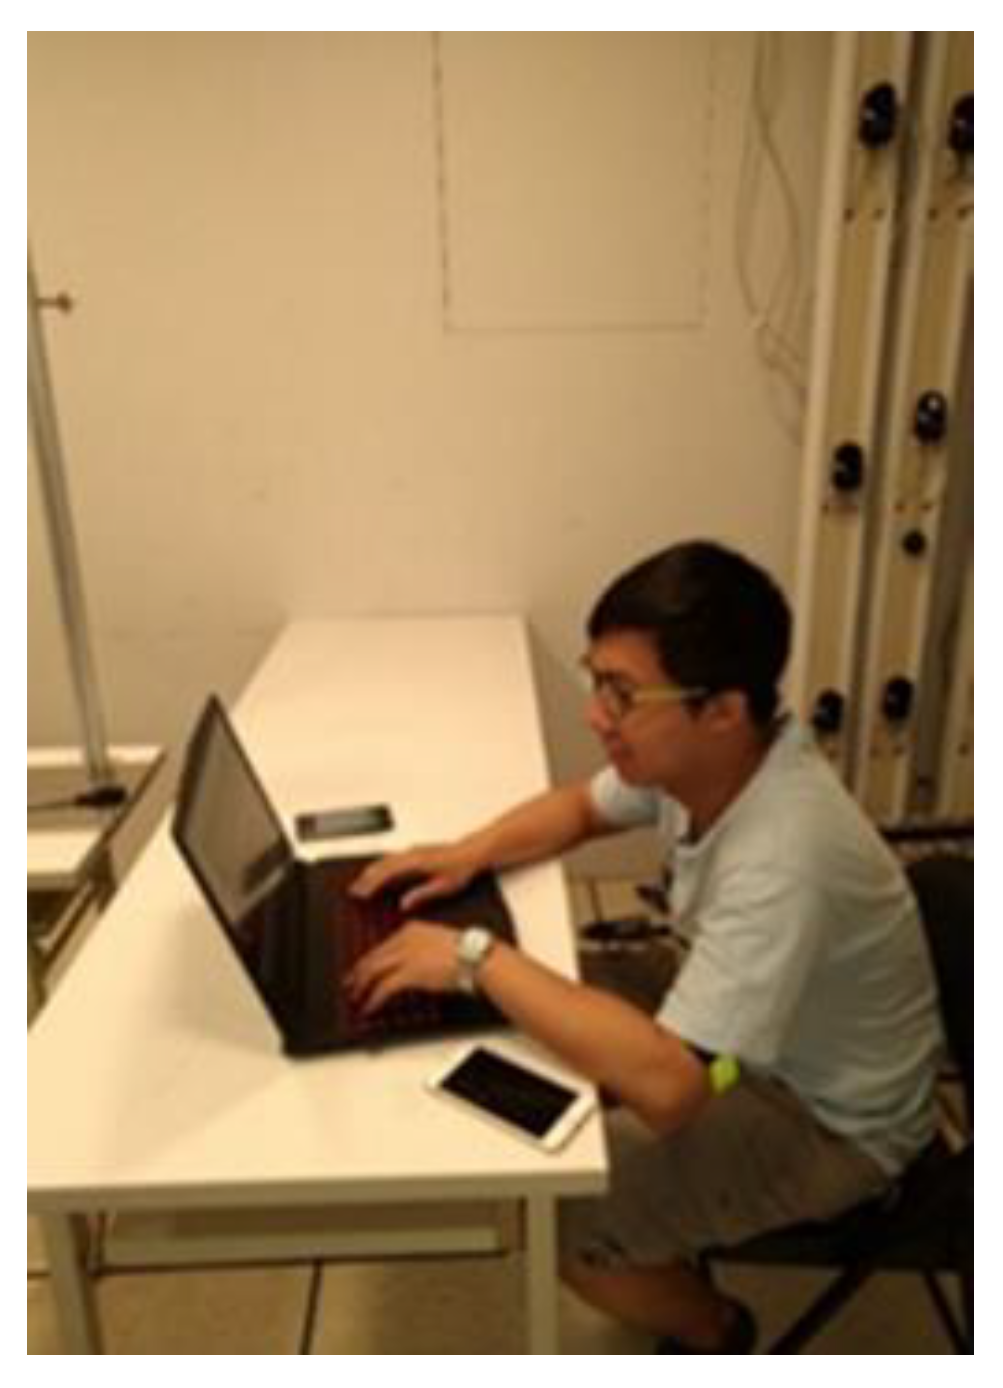
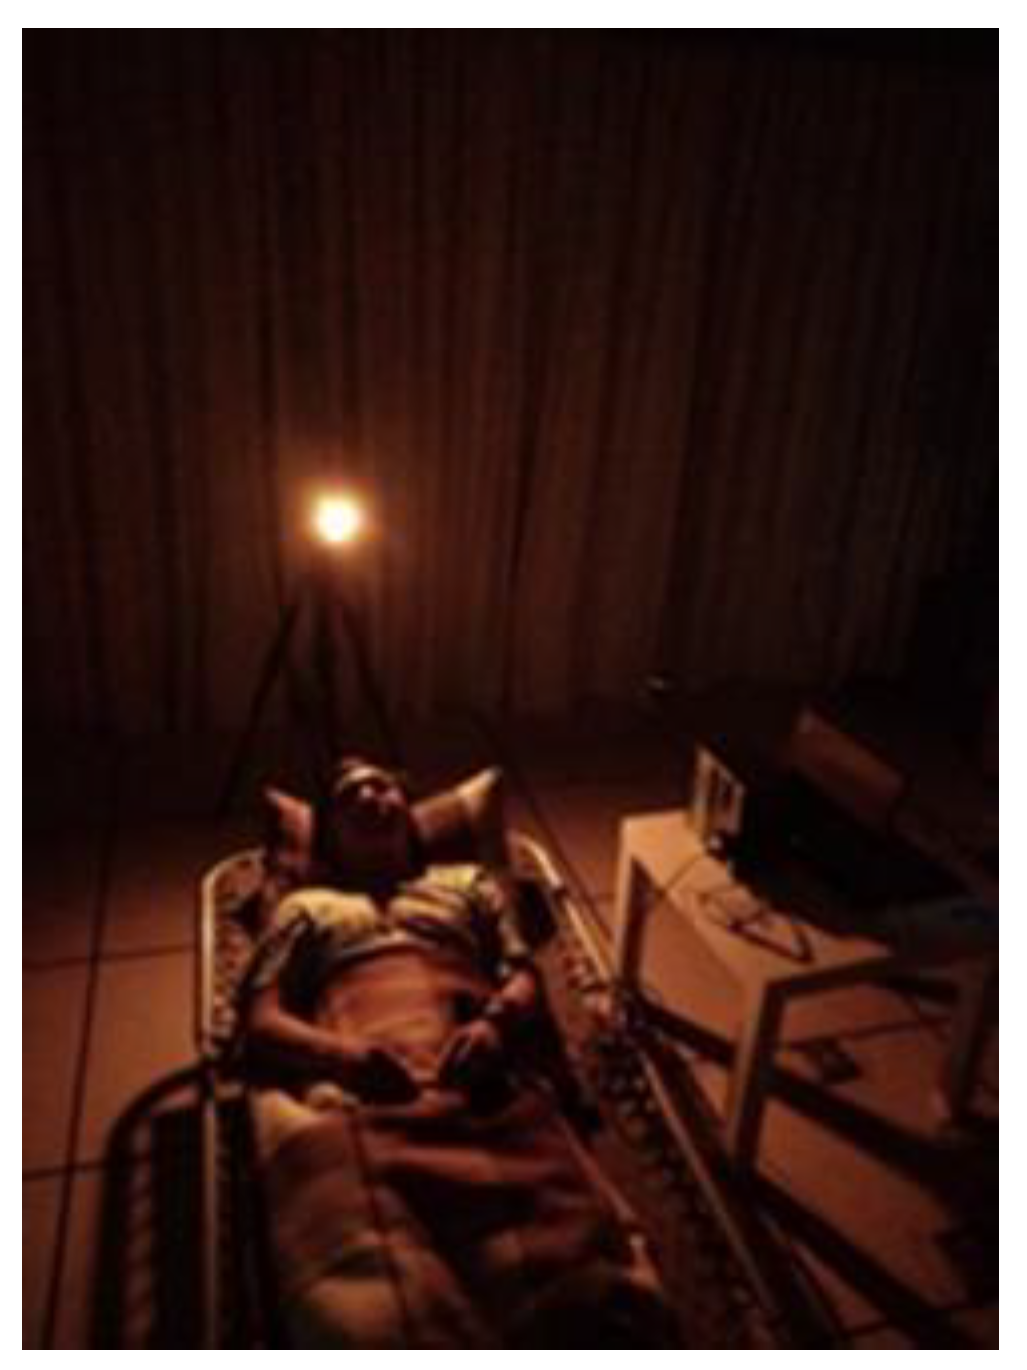
2.3. Experimental Design

In this study, the entire experimental flow is divided into five parts(experimental planning shown in Table 1), including the typing test before and after the experiment, the sleep experiment, and the psychological questionnaire(Table 2). The main purpose of all prohibited behaviors before the experiment is to reduce the interference of external factors and reduce the influence of factors such as tea, coffee and lack of sleep the day before. Each tested lunch was provided by the research team, with the same amount and style of meals, and the volunteers were invited to come over in advance to adapt to the environment and meals. There are three sleep experiment light sources (dark room, Dim light, Dynamic CCT lighting) in this experiment. Each volunteer will participate in three sleep experiments.
The polysomnography used in this study was MP150 (Bipac system) in Figure 8. The ECG of the volunteers was measured, and the sleep status of the volunteers was observed and monitored using the wrist sleep actigraph (ActiGraph wGT3X-BT) in Figure 9. HRV analysis can be divided into time domain and frequency domain; this study uses frequency do-main. In HRV analysis, one can use Matlab software(V.7.0, mathwork) to capture the RR interval of the recorded ECG signal, and then select the most stable 512 RR waves Perform spectral analysis [26].
Frequency domain analysis converts signals changing with time in RR interval into signals changing with frequency by decomposing RR interval fluctuation into several sine waves with distinct frequency and amplitude for the HRV spectrum. The spectrum acquired with fast Fourier transformation (FFT) is the peak chart at different frequency. Several major peaks could be found in the NN interval spectrum diagram ranging 0–0.4 Hz, and the boundary of each frequency region is separately defined by researchers. Major frequency regions contain one high frequency region (0.15–0.40 Hz), which usually reflects parasympathetic activities, and a low frequency region (0.04–0.15 Hz), which is simultaneously modulated by sympathetic and parasympathetic nervous systems (Bernardi et al., 1990; Sands et al., 1989; Fallen, Kamath, Ghista, and Fitchett, 1988). The total area below the power spectrum curve is total power (TP), and the area in individual frequency region is the power of individual frequency region. As the example of high frequency power (HFP) and low frequency power (LFP), HFP/TP is generally regarded as the indicator of parasympathetic activities, LFP/TP is the indicator of sympathetic activities, and LFP/HFP is the indicator of balanced sympathetic-parasympathetic activities.
The experiment measures the resting heart rate (RHR) for 60 min. Based on heart rate variability (HRV) of RHR and the questionnaire result, the correlation between volunteers’ sleep quality and HRV is analyzed. The experiment contains the experimental group-dark room and the experimental group-dim light with dynamic CCT lighting. The volunteersive psychological questionnaire is further preceded after the experiment to evaluate the improvement of sleep quality. At the same time, the cross-comparison of the three lightings is performed to observe whether there are statistical differences between the groups.
There are currently a variety of volunteersive sleepiness scales: the Stanford Sleepiness Scale (SSS) and Epworth Sleepiness Scale (ESS), as well as the Karolinska Sleepiness Scale (KSS), the three most commonly used and well known. Among them, SSS describes the current level of sleepiness with seven self-feeling states, and 1 to 7 indicate its state. ESS is mainly used to investigate the volunteers’ sleepiness during the day. ESS is set up to 8 activity scenarios; and the volunteers are allowed to self-evaluate the possibility of dozing off in the situation with a score of 0 to 3 based on life experience in the past month. KSS describes the mental state of ordinary people, with a total of 9 state descriptions, and the circle selection is most in line with the current mental state. In this study, the ESS scale was used to set the activity situation and evaluate the current mental state of the experiment. Five activity scenarios were adopted in the form of simple questionnaires.

3. Results

HRV analysis mainly analyzes the function of sympathetic activities and parasympathetic activities in the human autonomic nervous system, which are the important indicators to control people’s tension and relaxation [11].
In the part of HRV analysis [14], because the spectrum related to the autonomic nervous system mainly falls in high frequency power (HFP) and low frequency power (LFP), the normalized low frequency power (nLFP) and normalized high frequency power (nHFP) in this experiment are taken as the analysis standard, and low frequency to high frequency ratio (L/H) usually represents the balance of sympathetic/parasympathetic activities, as a reference index to observe the relaxation and hyperactivity of the autonomic nervous system.

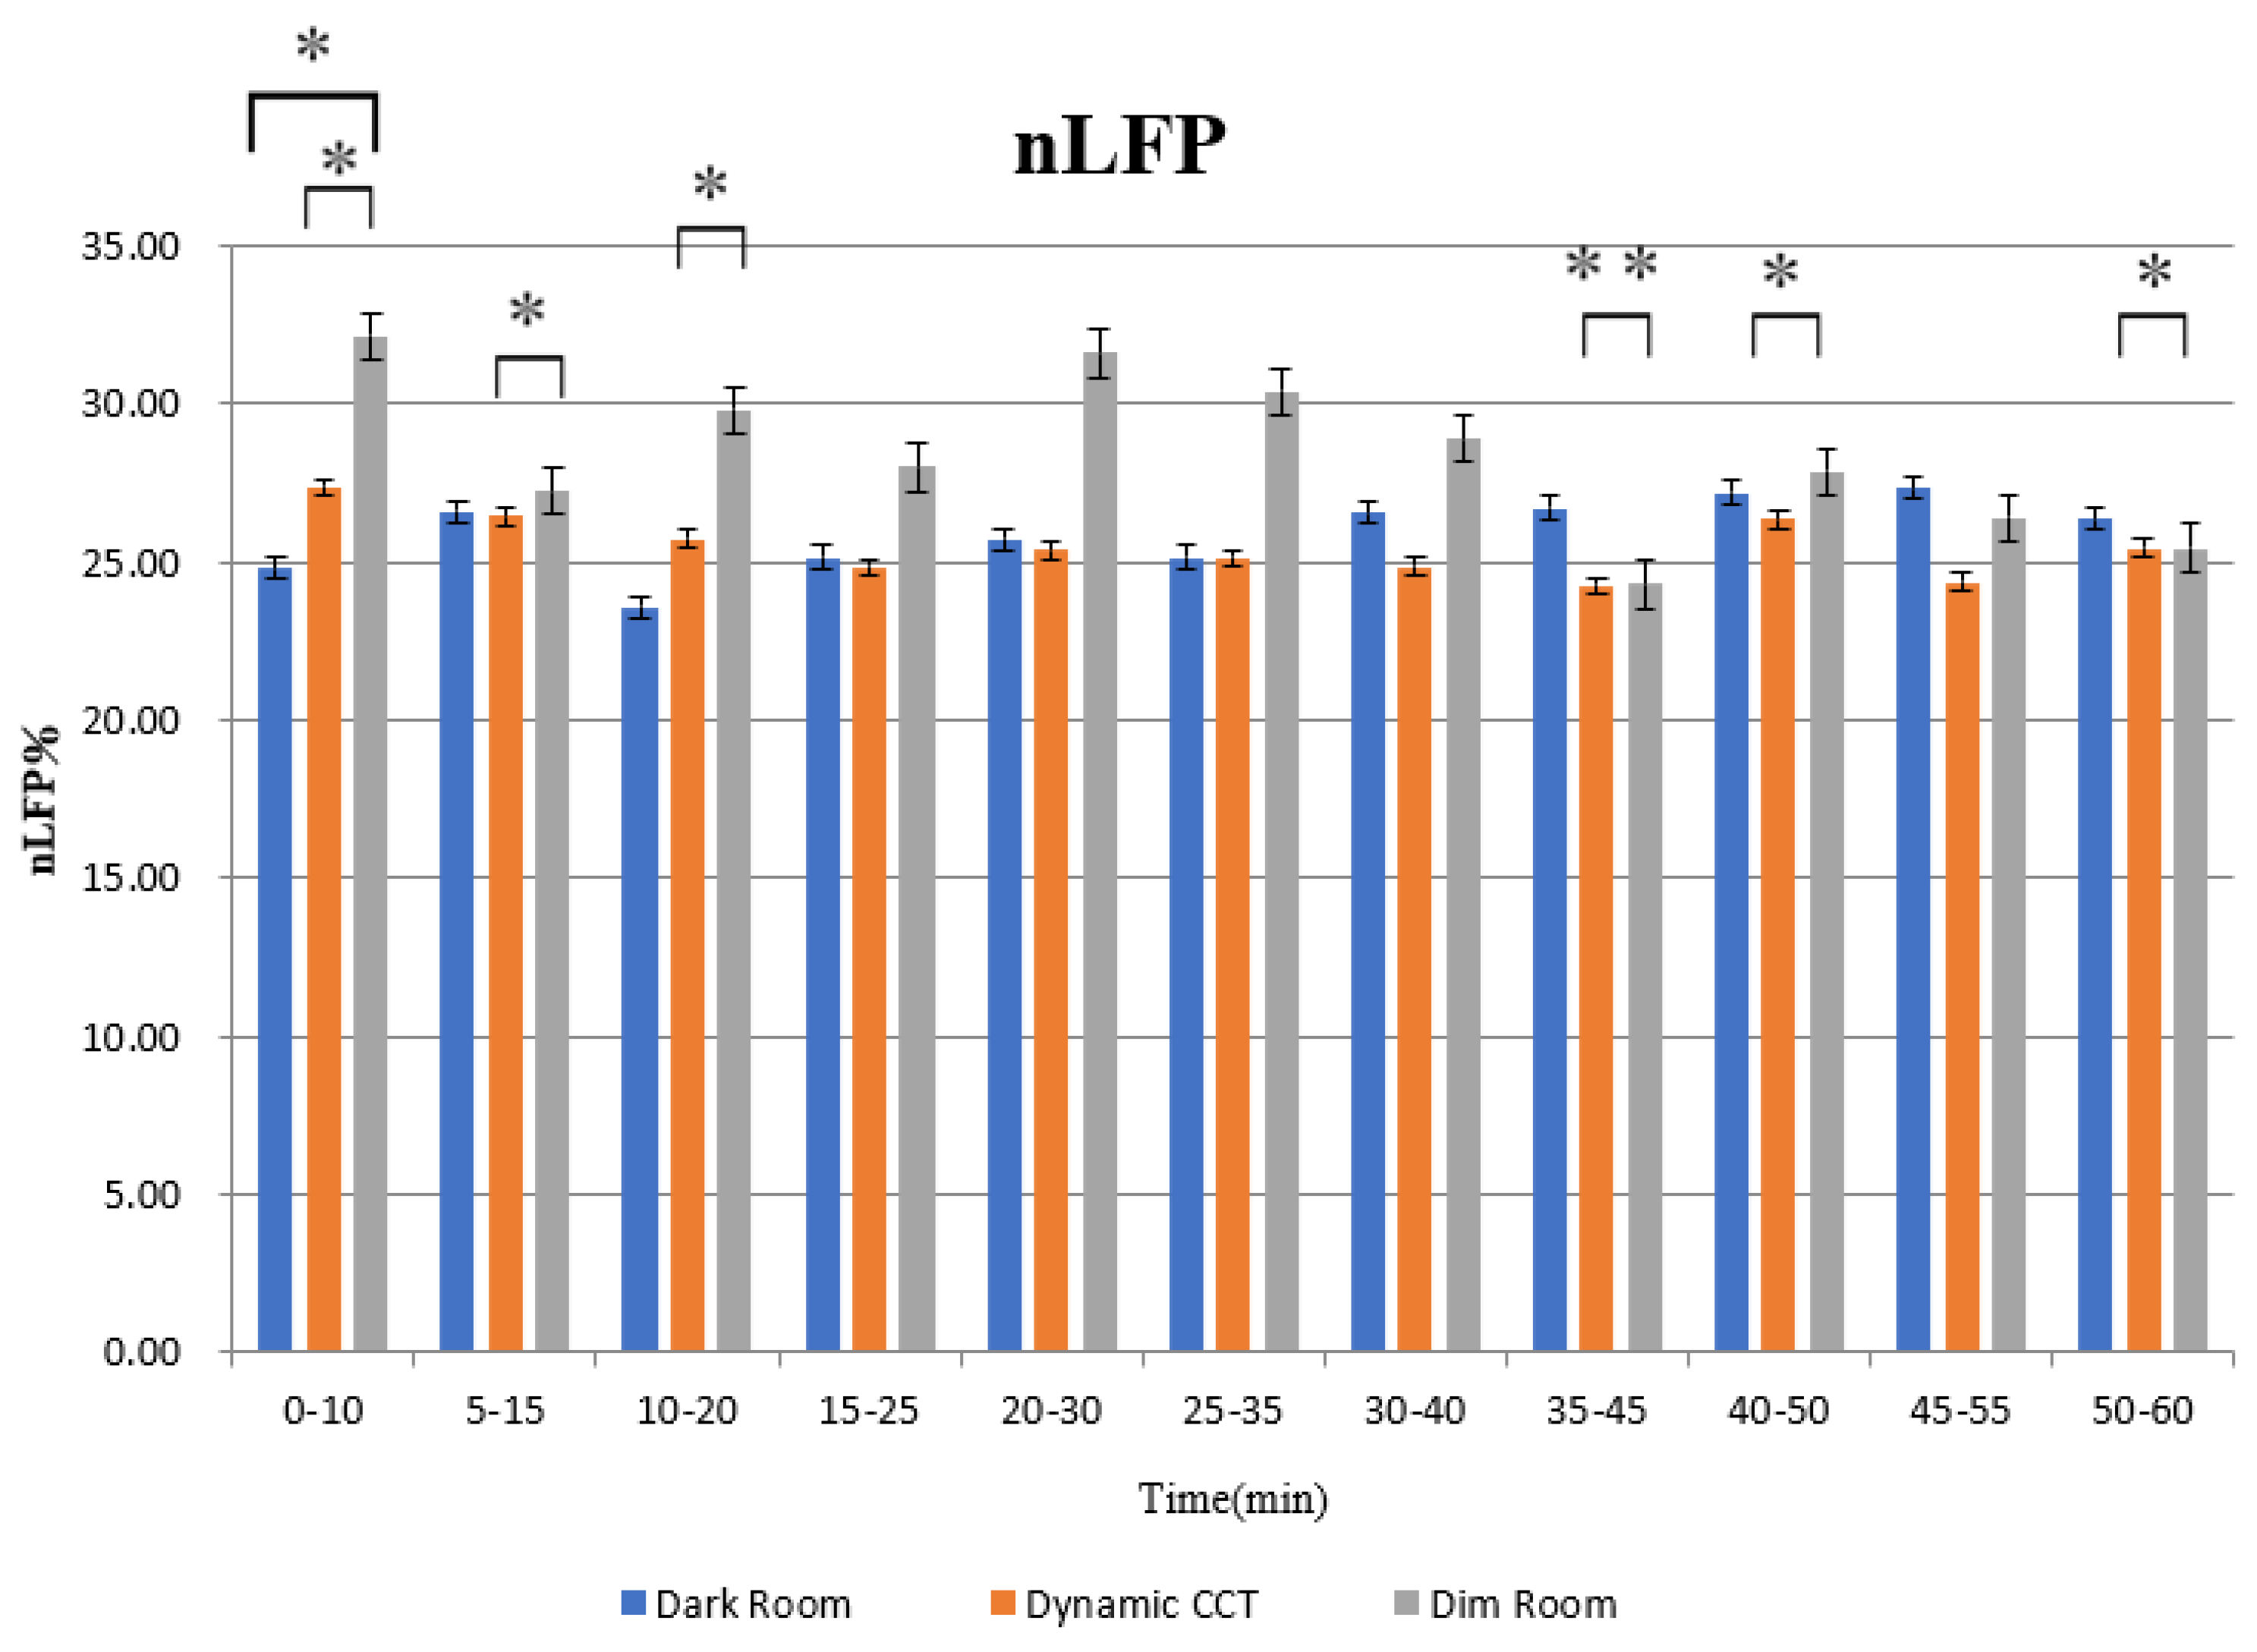
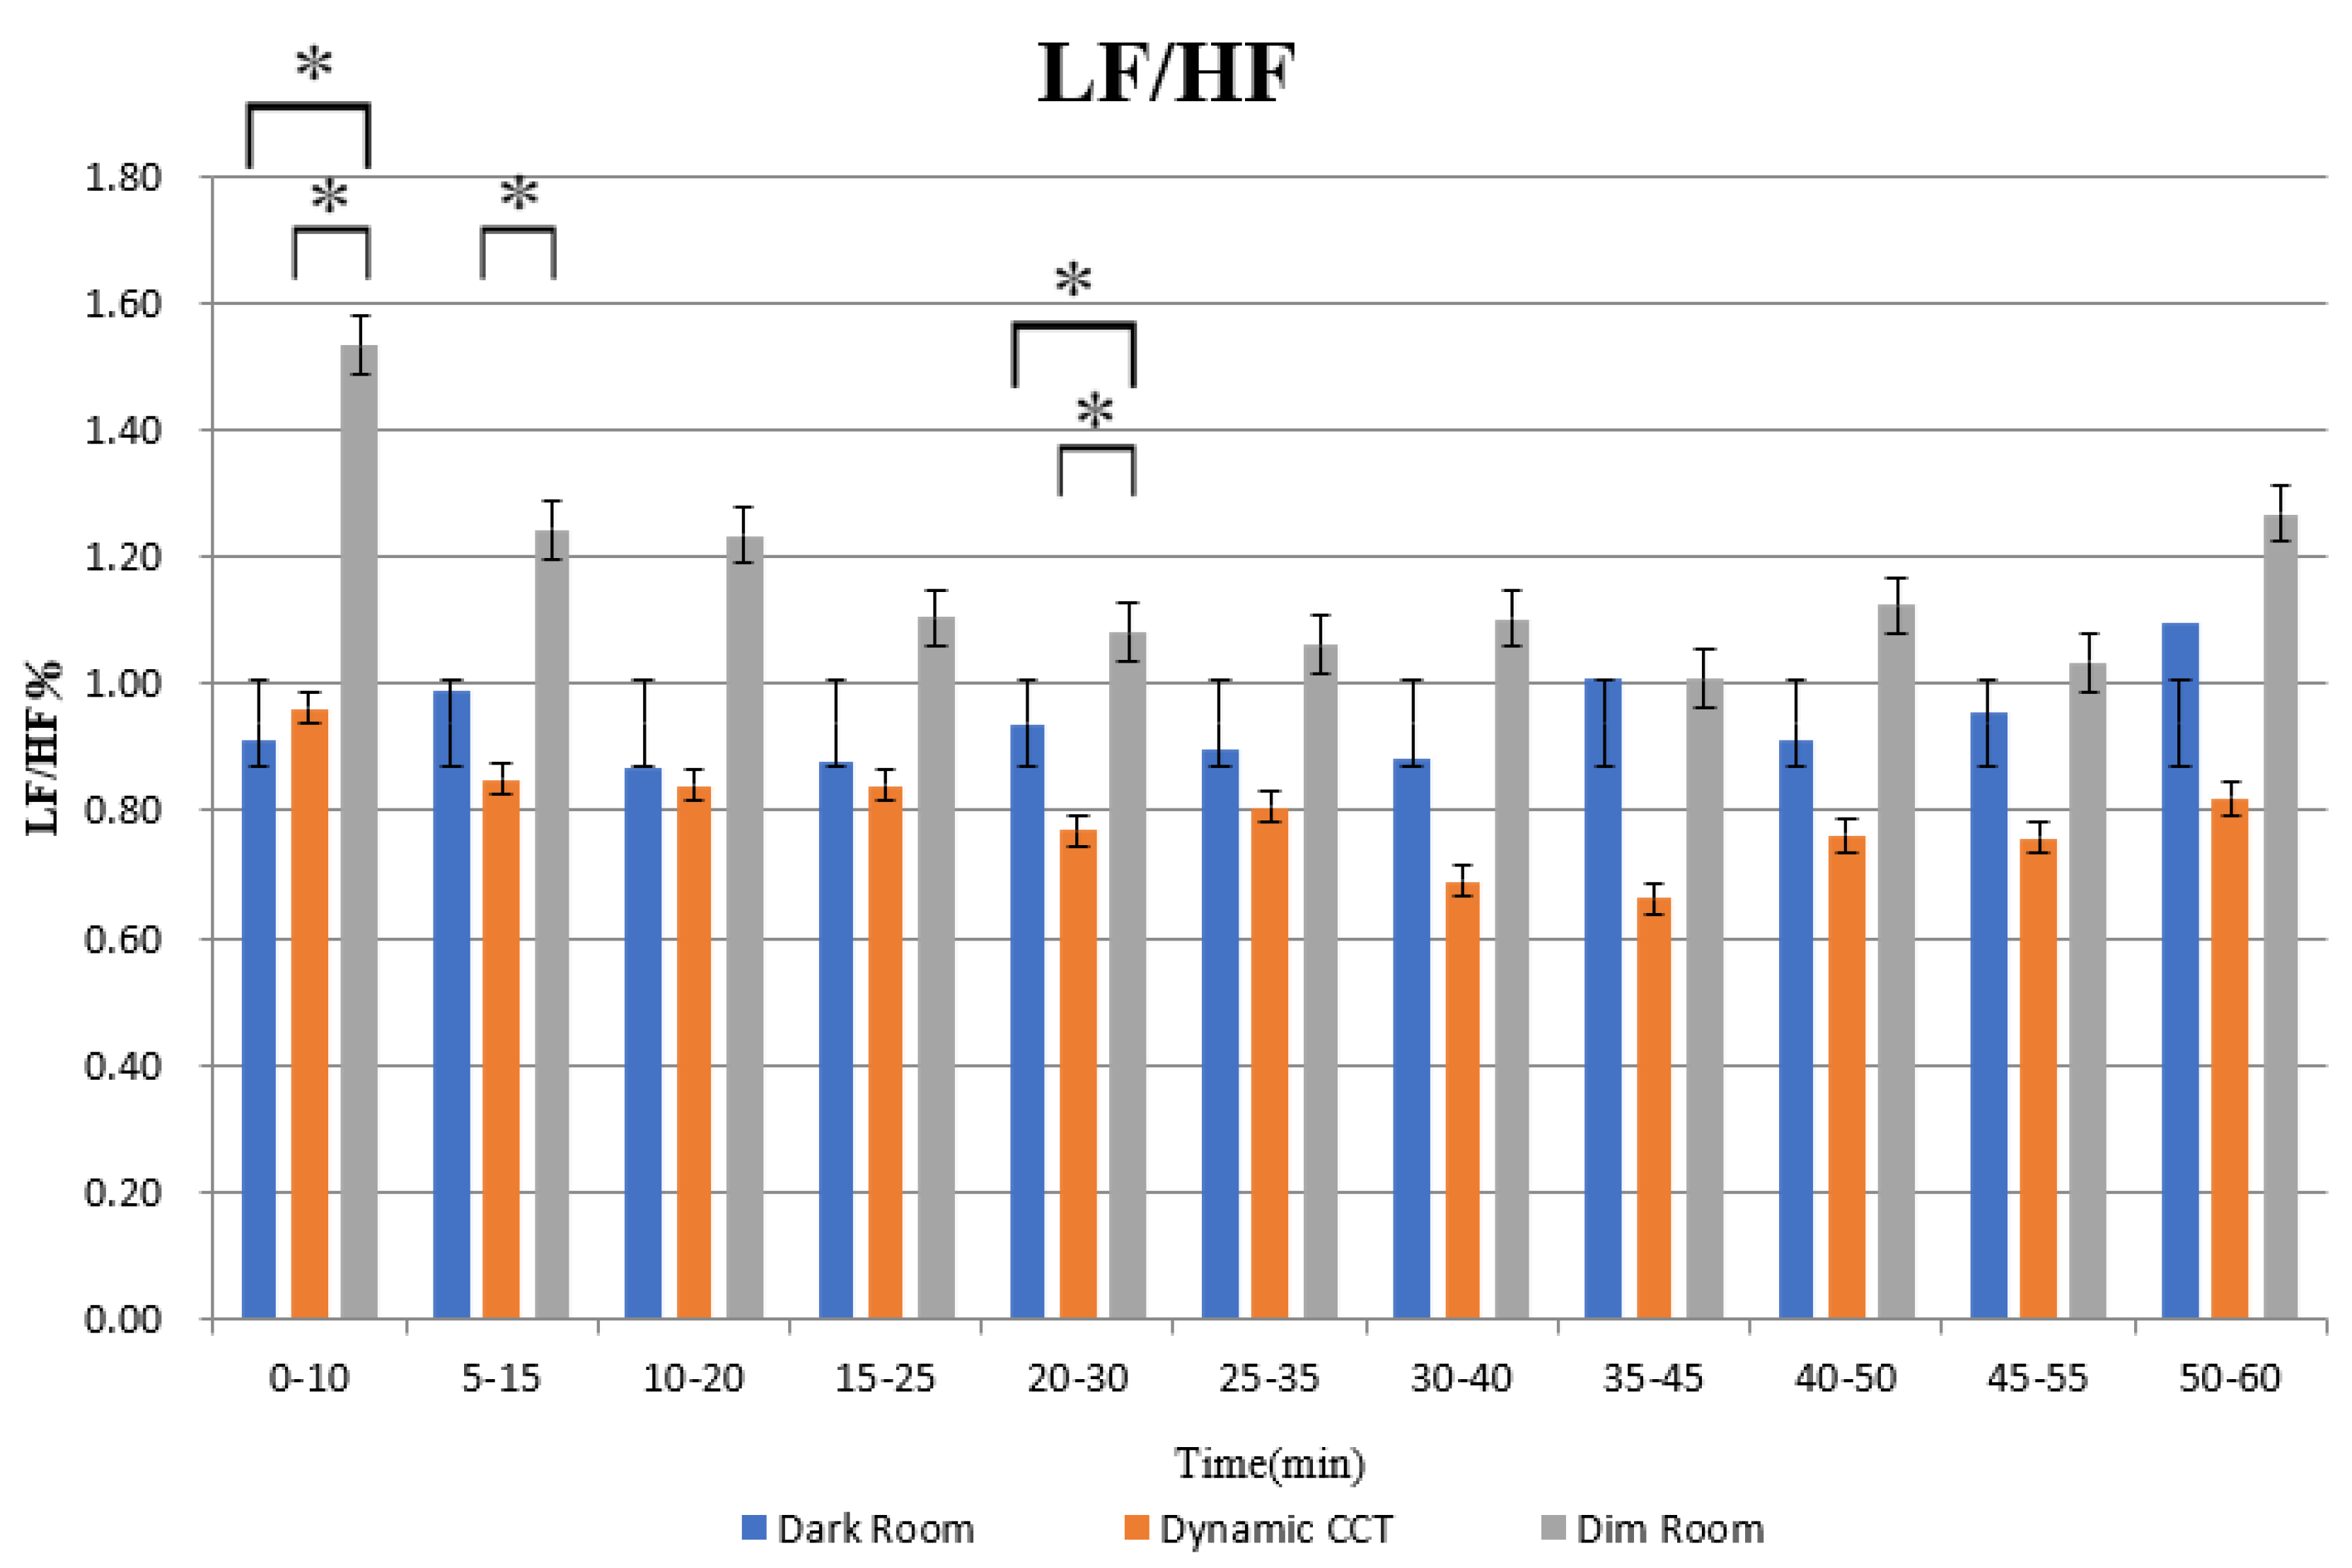
3.1. Heart Rate Variability (HRV) Data

Figure 10 is the result of parasympathetic activities, using the “moving window” monitoring and analysis method, through 0–10, 5–15, 10–20, etc., 11 time periods, dynamic capture and analysis of 60 min nHFP. The analysis results show that the degree of relaxation in the Dynamic CCT lighting sleep environment is the same as that in the dark room sleep environment, but there are statistically significant differences between the Dynamic CCT lighting sleep environment and the Dim light sleep environment, indicating that the relaxation in the Dynamic CCT lighting is greater than that in the Dim light sleep environment. We can see from Figure 8 that the statistical results of Dynamic CCT lighting from 15 to 25 min are better than dark room and dim light, 15–25 min, 30–40 min, 50–60 min, and all results are better than dim light. Compared with the Dynamic CCT lighting environment and the dim light environment, the nHFP One-Way ANOVA statistics show that the p-value of 15–25 min is 0.006, the p-value of 30–40 min is 0.007, and the p-value of 50–60 min is 0.02. the statistical results of all p-values were less than the significance level of α = 0.05. Comparing the dark room environment and the dim light environment, the statistical results of nHFP One-Way ANOVA show that the p-value of 15–25 min is 0.034, the p-value of 30–40 min is 0.045, and the p-value of 50–60 min is 0.046. Results of all p-values were less than the significance level of α = 0.05.
Figure 11 is the result chart of sympathetic activity and parasympathetic activity (nLFP), and Figure 12 is the result chart of sympathetic activity parasympathetic activity balance index (LF/HF). In nLFP, parasympathetic activity has activity, so it is necessary to observe the balance index of LF/HF at the same time [11]. The results show that the nlfp and LF/HF results in 0–10 min and 5–15 min are consistent, and Dynamic CCT lighting environment and dim light environment comparison, nLFP One-Way ANOVA statistical results show that 0–10 min p-value is 0.007, 5–15 min p-value is 0.023. LF/HF One-Way ANOVA statistical results show 0–10 min p-value is 0.007 and 5–15 min p-value is 0.022. In dark room environment and dim light environment, nLFP One-Way ANOVA statistics show that 0–10 min p-value is 0.016. The statistical results of LF/HF One-Way ANOVA showed that the p-value of 0–10 min was 0.001; the statistical results of all p-values were less than the significance level of α = 0.05. Dynamic CCT lighting and dark room are significantly better than Dim light. In addition the mood is more relaxed to enter the sleep stage (the higher the nHFP, the lower the nLFP, and the lower the L/H), indicating the quality of sleep to be better [27].

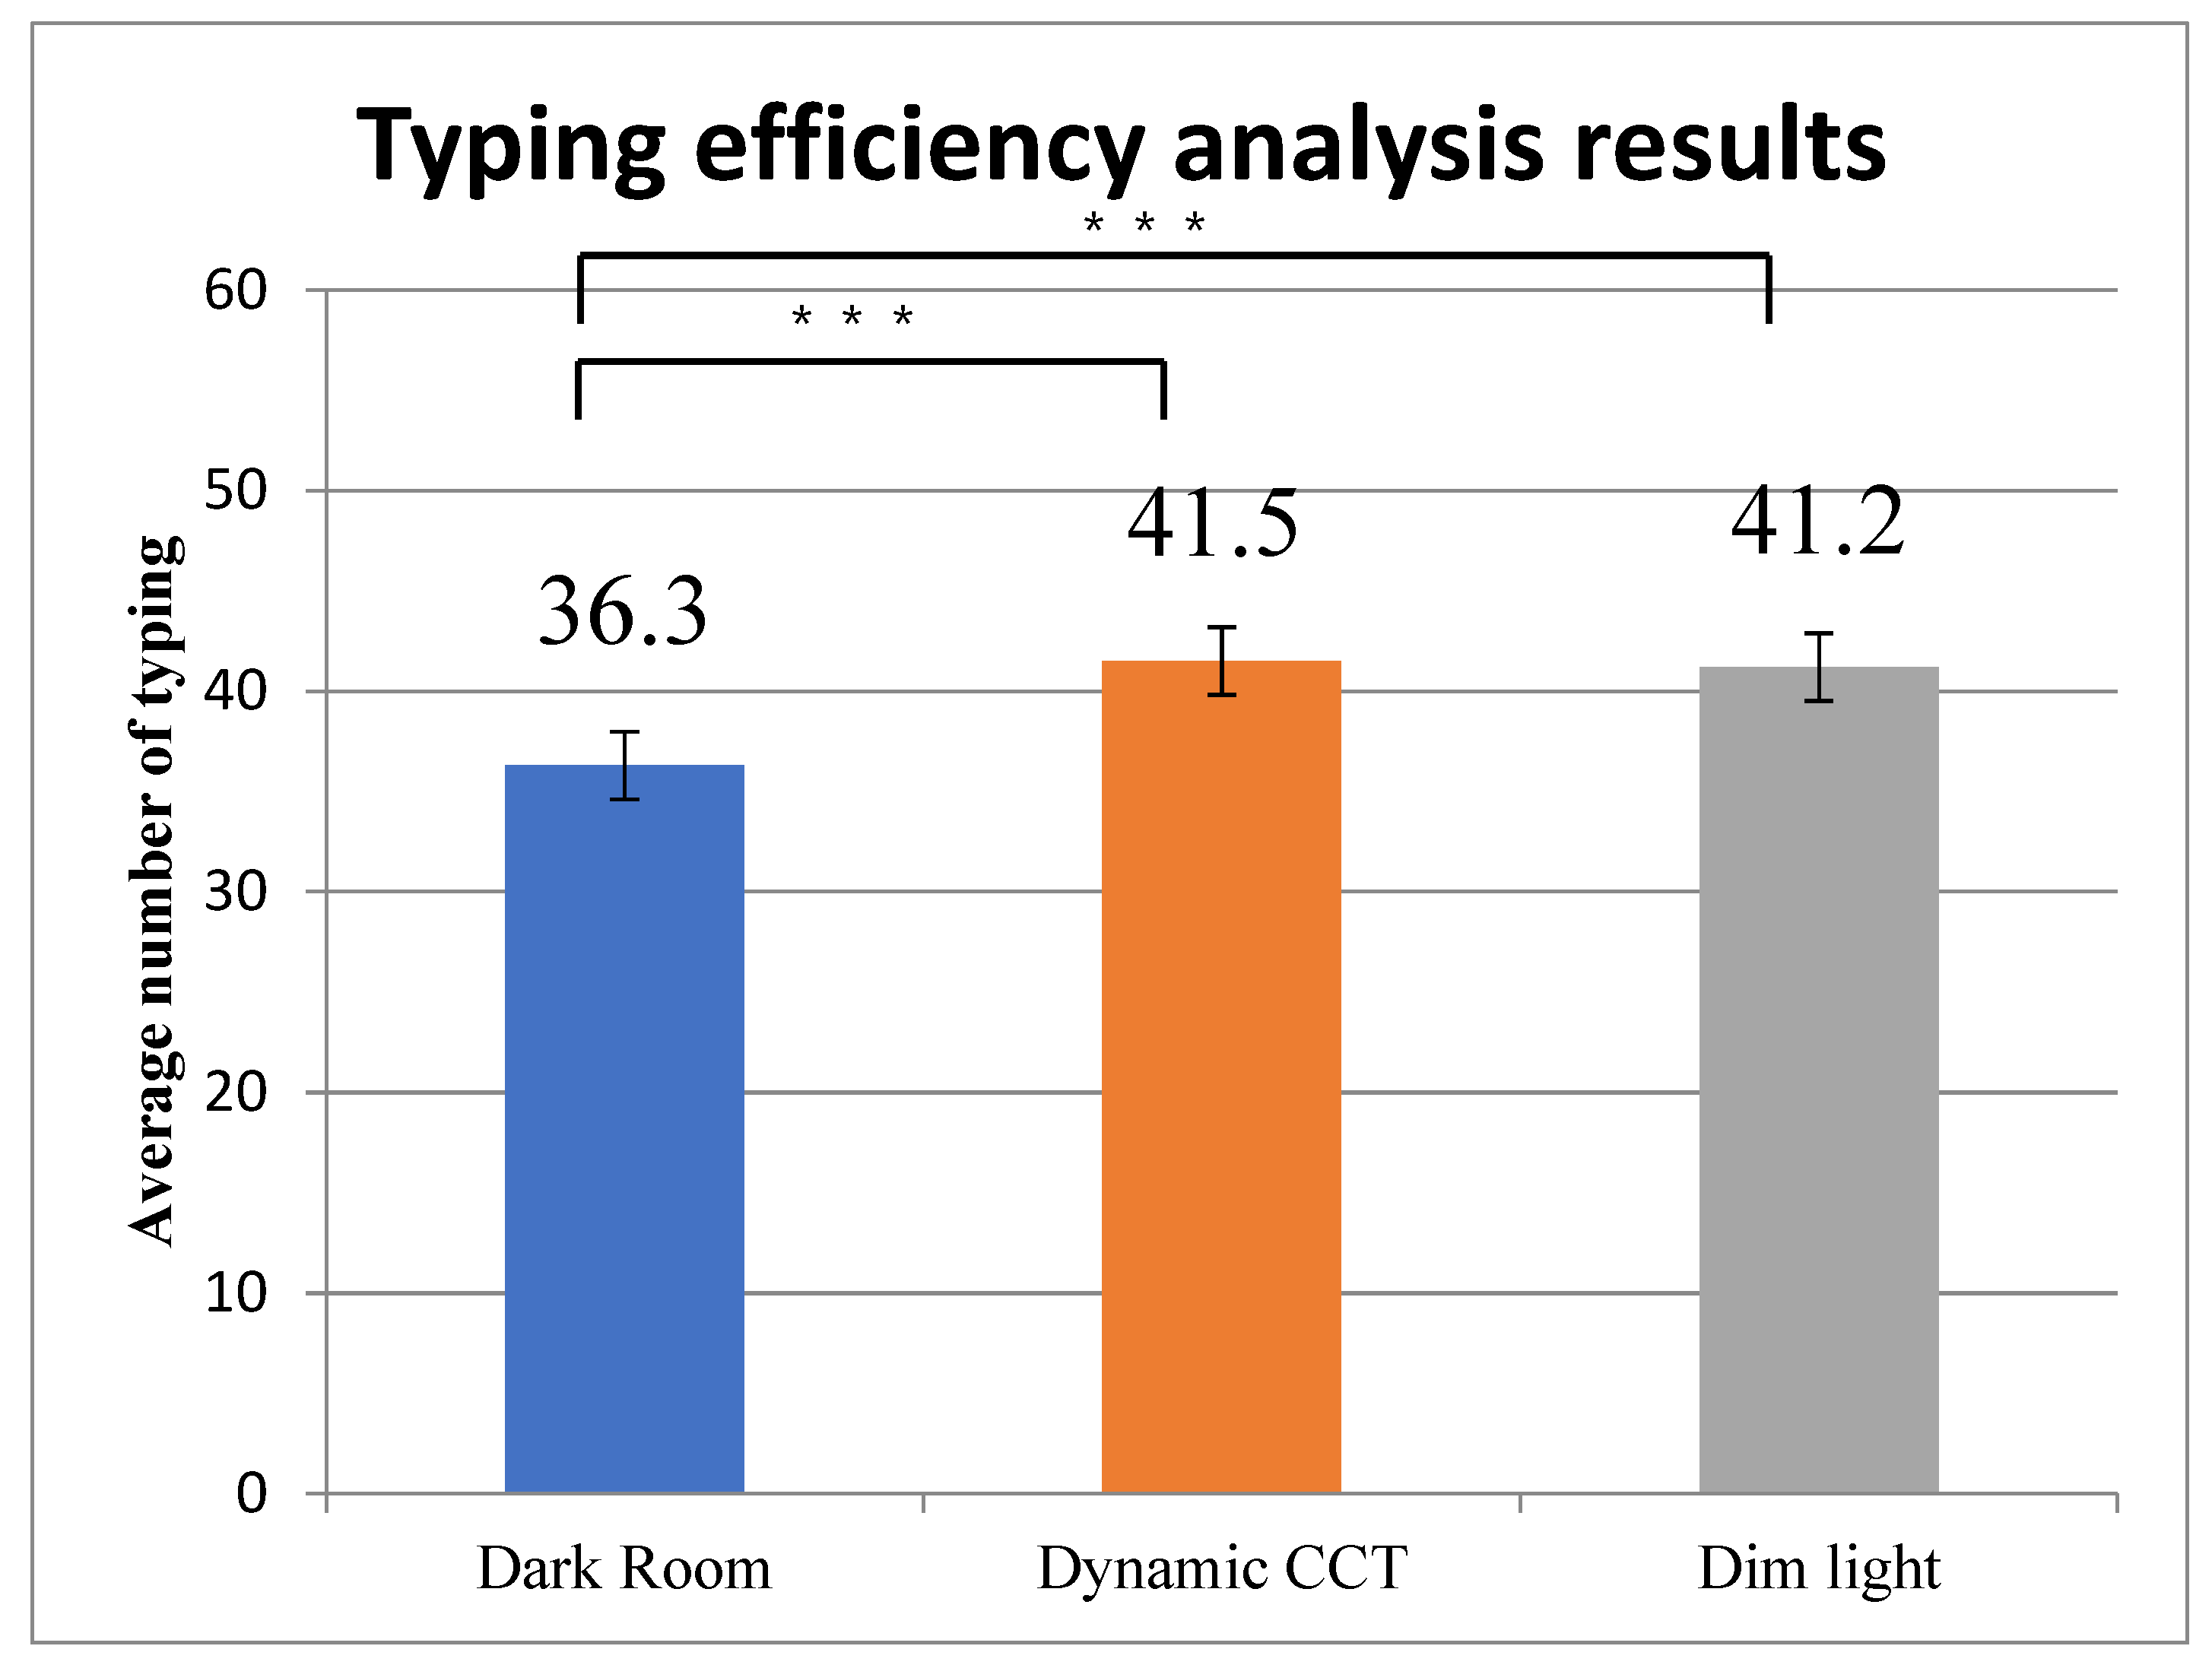
3.2. Work-Efficient Data

Figure 13 shows the test results of the average amount of typing in the work effi-ciency. The amount of typing in Dynamic CCT lighting environment is significantly higher than that in dark room environment, and the amount of typing in Dim light environ-ment is significantly higher than that in dark room environment. The results show that the average amount of typing in the Dynamic CCT light-ing and Dim light sleep environment is higher than that in the dark room sleep envi-ronment.

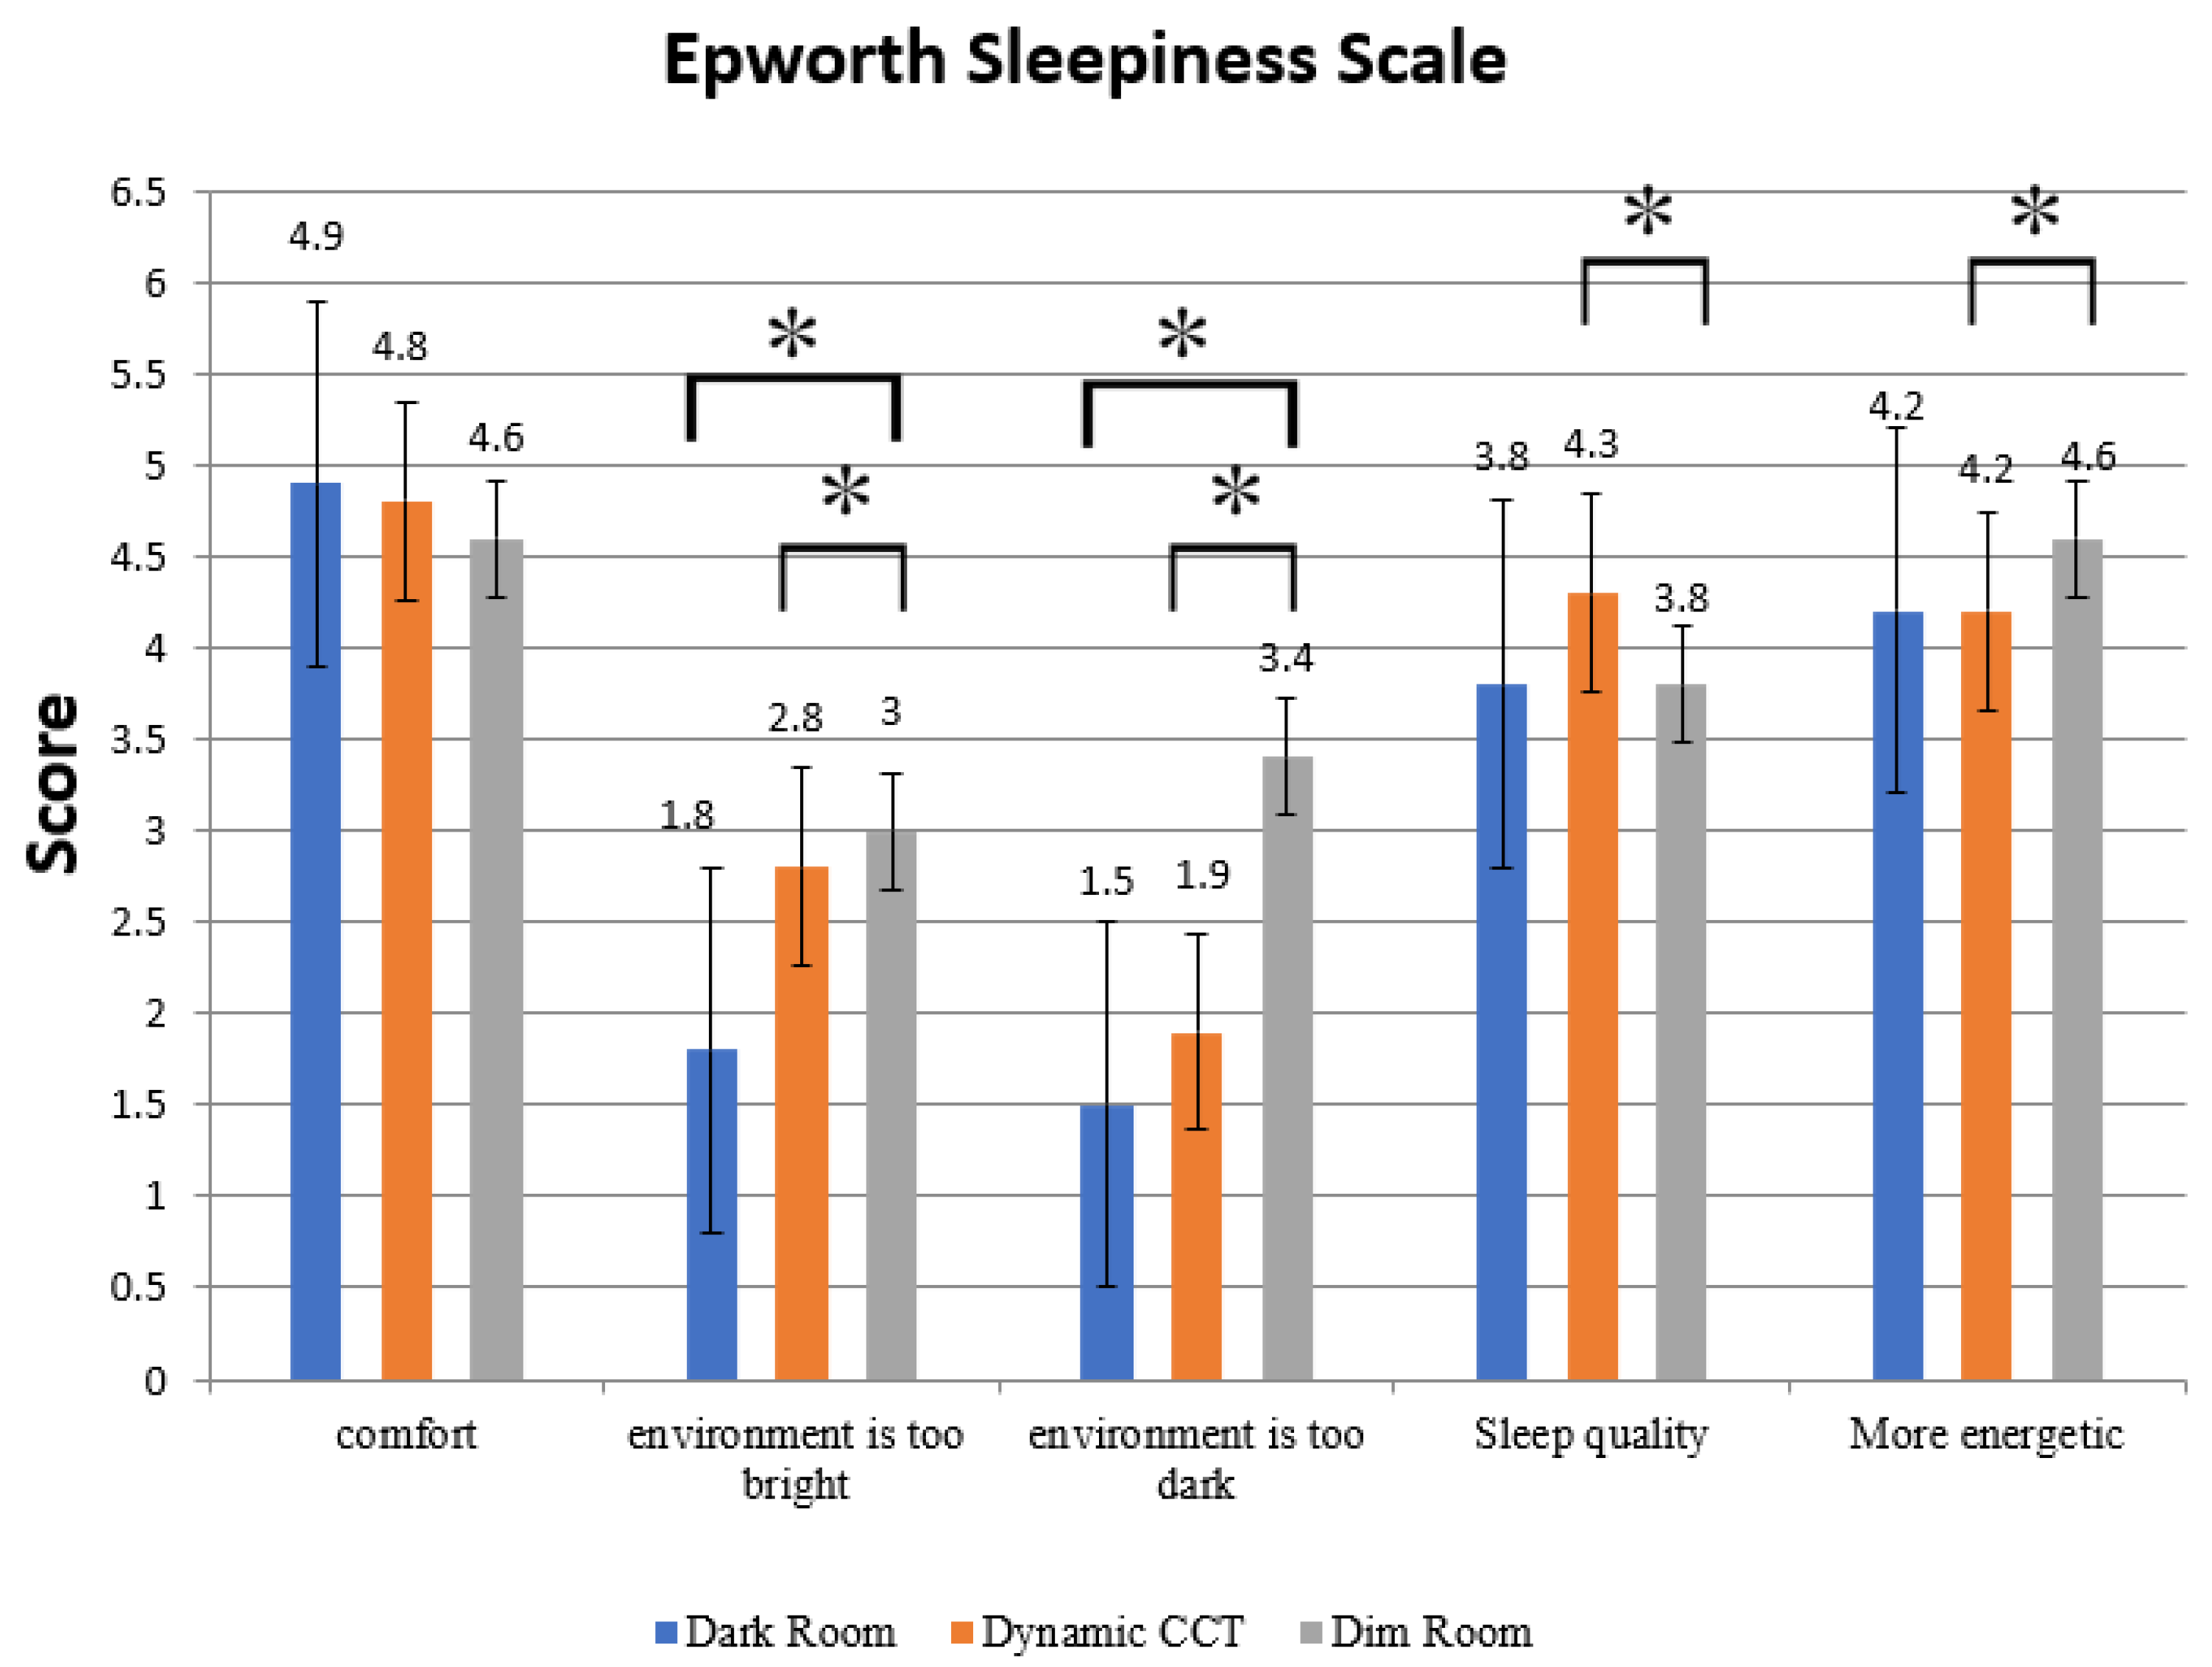
3.3. Questionnaire Data

Figure 14 shows the results of self-psychological state after sleep. The results show that under the three sleeping environments, all the volunteers feel comfortable in the darkened room, and the comparative part will be affected by the Dynamic CCT and the darkened sleeping environment. However, in terms of sleep quality, survival is the best Dynamic CCT sleep environment. Comparing the Dynamic CCT lighting environment and the dim lighting environment, the sleep quality T-TEST statistical results show that the p value is 0.047, and the statistical results are all with a p-value less than α = 0.05 significance level.

4. Discussion

4.1. The Effect of Different Sleeping Environment on Heart Rate Variability

As mentioned in the preceding paragraph, the rising parasympathetic activities (nHFP) mean that the volunteers are in a relaxed state. When analyzing sympathetic activities (nLFP), due to the interference of parasympathetic activities, they cannot be directly used as sympathetic activities to indicate that it is in a state of excitement and wakefulness. For this reason, it is necessary to compare the balances of autonomic nervous activity (LF/HF) with each other. If there is a statistically identical difference between nLFP and LH/HF, it means that their sympathetic activities are consistent at this time. When both of them increase at the same time, it means that they are emotionally high and sober. Declining data mean that a person wants to relax and sleep.
Under three different light sources of sleep environment, the statistical results of HRV show that under Dynamic CCT lighting sleep, the mood of the volunteers is relaxed, and the nHFP of the whole short-term sleep is rising, which represents that the volunteers having N2 and N3 stages of sleep. In nLFP and LH/HF, in the first 15 min, Dynamic CCT lighting and dark room results are similar, both of them showing the downward trend and appearing statistically different. Furthermore, parasympathetic activities are improved, which is significantly better than Dim light, indicating that the volunteers could quickly enter the sleep stage. However, after 15 min, there is no significant statistical difference, and nLFP and LF/HF results are not consistent, which could not explain the sympathetic activities. Dynamic CCT is therefore used. The sleep quality of lighting is higher than that of dark room and Dim light.

4.2. Volunteers and Non-volunteers Correlation

In the volunteersive psychological questionnaire, there are significant differences in the statistical results of sleep quality and better spirit after sleep. Using Dynamic CCT lighting in the sleep environment is better than Dim light, compared with dark room, although there is no statistical difference; the average value is still higher than dark room. The results show that Dynamic CCT lighting is better than Dim light and better than dark room in sleep. In ESS questionnaire, there is no significant difference among the three sleep light environments.
From the results of the volunteersive psychological questionnaire and non-volunteersive physical signal measurement, it can be found that the relaxation state of Dynamic CCT lighting is better than that of dark room and also better than that of Dim light. In volunteersive psychological mode, Dynamic CCT lighting is superior to dark room and Dim light in terms of lighting. In the questionnaire analysis, the volunteersive view is that Dynamic CCT lighting is better than dark room and better than Dim light, showing a positive correlation among the above data, indicating that the use of Dynamic CCT lighting can really make the volunteers have a good sleep effect.

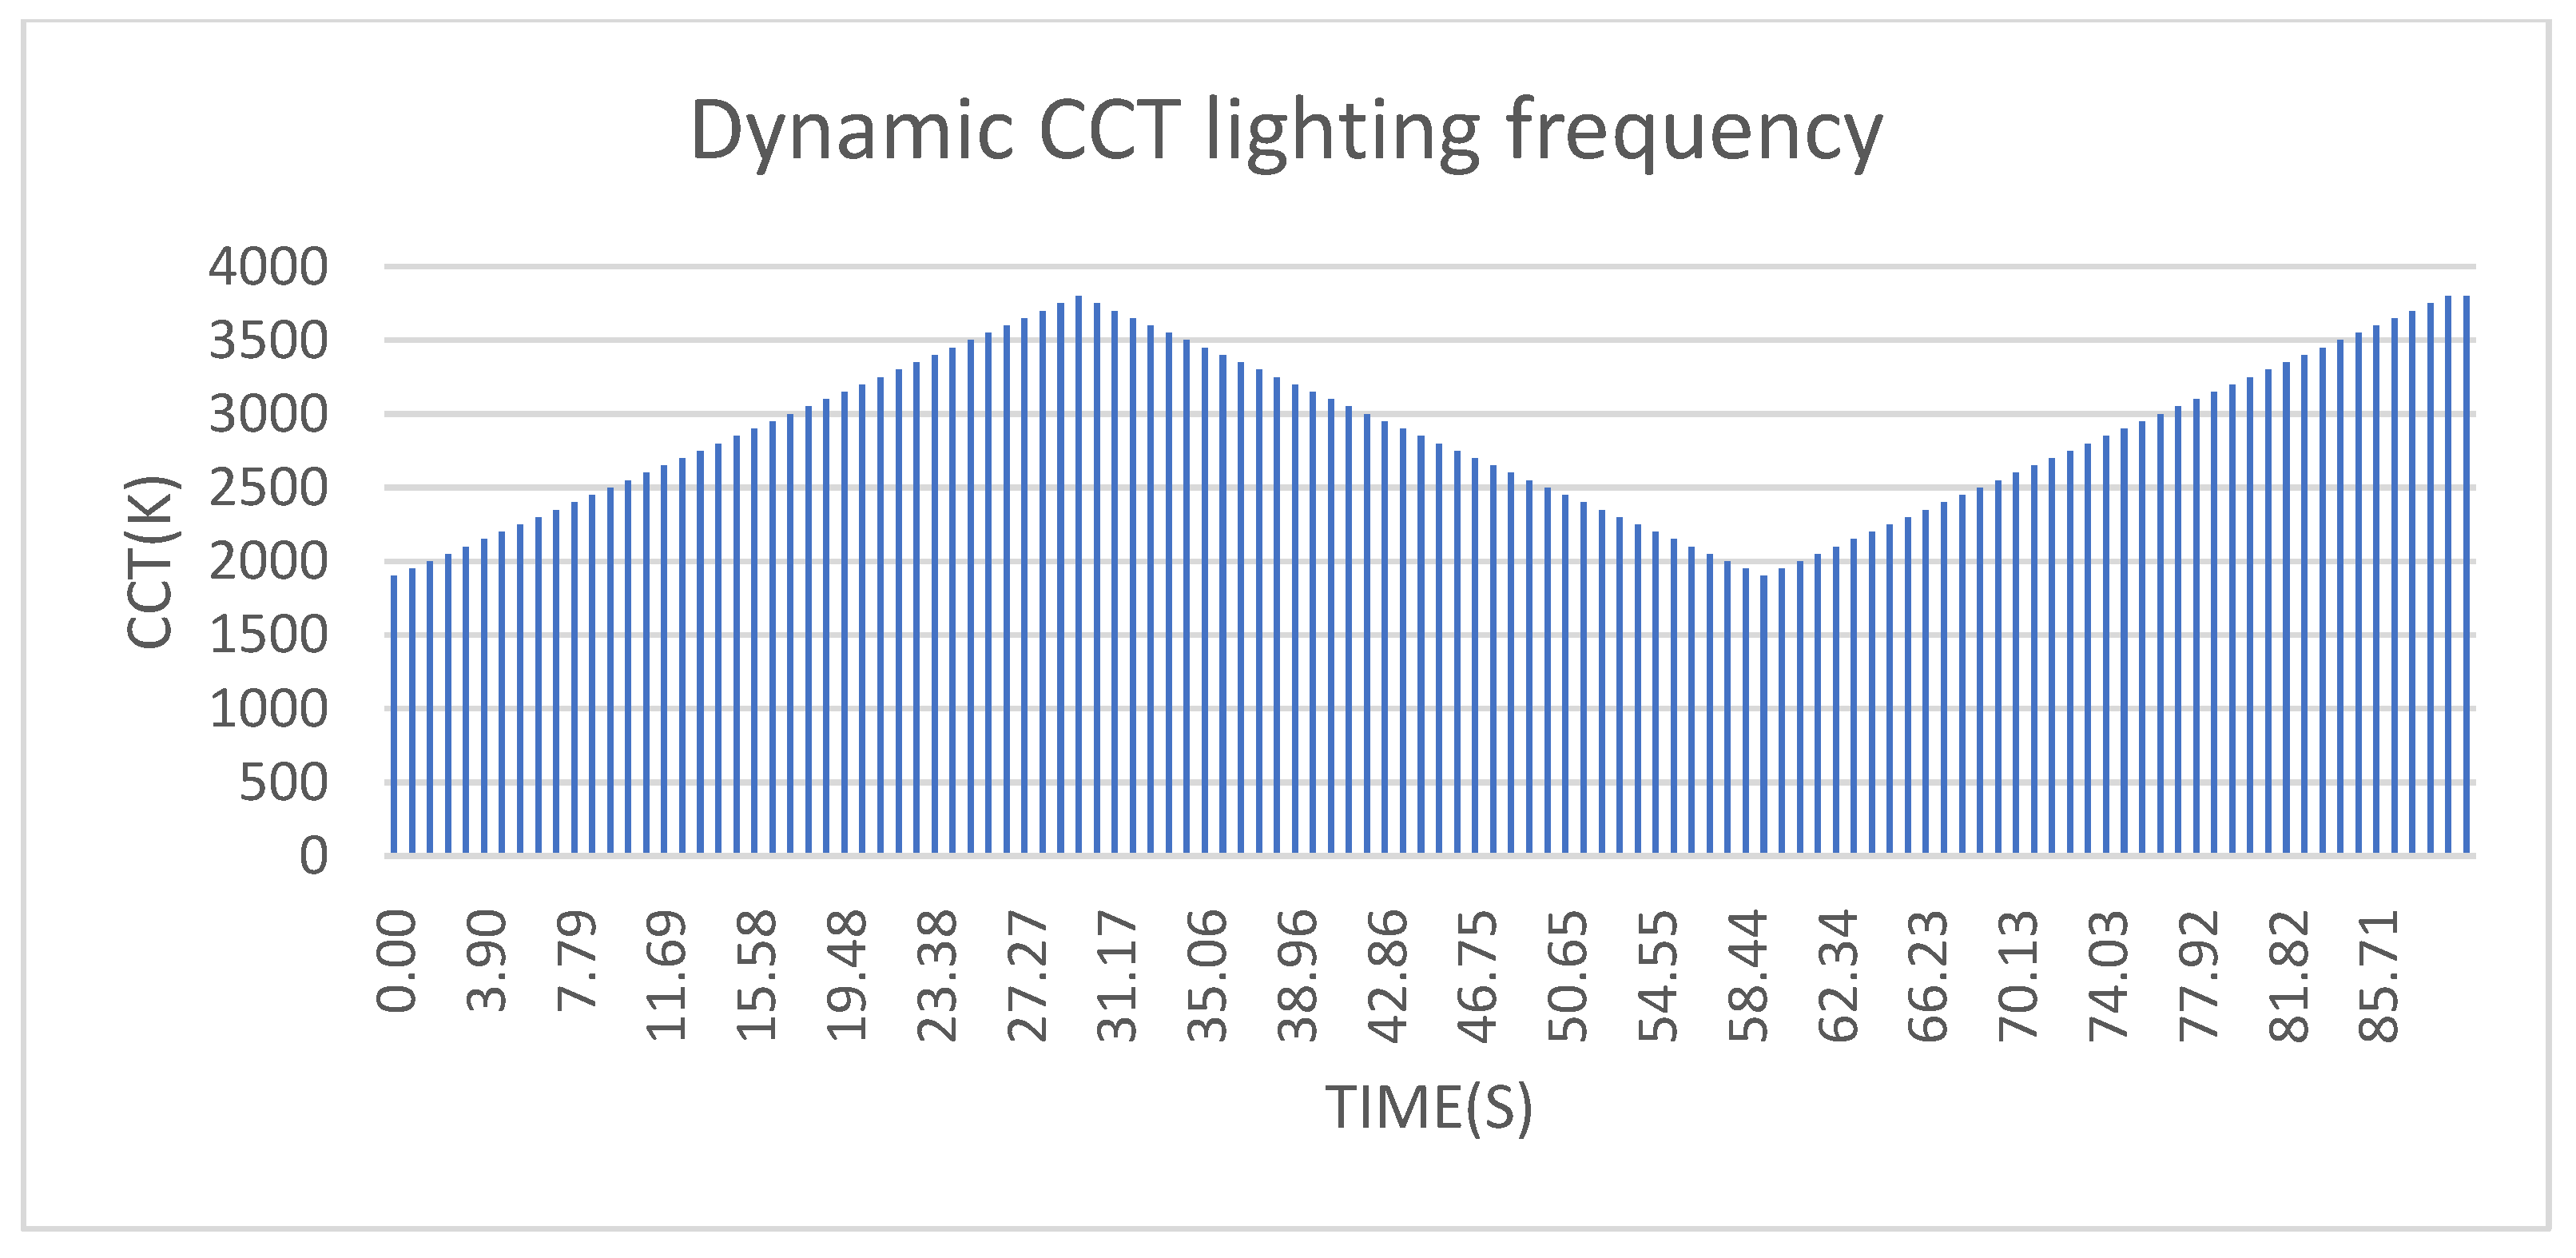
4.3. The Transformation of Dynamic Hypnotic Light

It can be seen from the above results that, in terms of the fixed light source, dynamic lighting has more significant physiological stimulation, even a dark room is the best sleeping environment, but dynamic lighting is still effective in helping the volunteers fall asleep and gain better work concentration. With the work content in the workplace becoming more and more extensive, more energy and physical strength is needed to complete these matters, and the novel hypnotic lighting system developed by this research institute is also needed. According to the research of Omer Sharon and Yuval NIR in 2018, with the help of specific frequency of dynamic lighting, the response of slow-wave activities (SWA) of brain is particularly significant [1]; through the research results of Lynn (2015), we can also see that the improvement of slow-wave activities can help achieve better sleep quality and improve work quality and concentration after a short rest [20].
From the analysis result of heart rate variability, Dynamic CCT lighting enhances nHFP, comparing with dim light and dark room, with statistical differences. It reveals that the novel hypnotic lighting system could help volunteers more efficiently relax the mood. The assistance of Dynamic CCT lighting in getting to sleep and the sleep quality is consistent with the nHFP result (Figure 8 and Figure 12), showing the improvement of the volunteerss’ sleep efficiency and quality with Dynamic CCT lighting. It can be prov-en by the decrease in typing error and the increase in typing efficiency (Figure 11) that volunteerss, after effective short rest, actually enhance work efficiency and concentration.

5. Conclusions

A lot of research pointed out the effect of work stress on cardiovascular health and sleep quality. Studies on the effect of different work stress models on autonomic nervous system found the relationship with sympathetic and parasympathetic activities. On the other hand, the autonomic nervous system changes with sleep stages, and some sleep problems respond to the change in the autonomic nervous system. With physiological theories, HRV analysis acquired from ECG could be the indicator of the autonomic nervous system further evaluatinge volunteerss’ autonomic nervous and sleep problems caused by work stress.
With psychological questionnaire before/after sleep, typing tasks, and HRV change during lunch break with lighting, HRV analysis is utilized in this study for evaluating the correlation of sympathetic/parasympathetic activities and sleep as well as the effect on work efficiency after lunch break. Therefore, this article has two achievements. First, sleep quality of the volunteers through the analysis of HRV is evaluated. One can see that the higher the HFP, the lower the LFP and LP/HP, which means that the activity of the autonomic nervous system of the volunteers is lower. The mood is more relaxed, which means that the volunteers can rest well, fall asleep, and obtain good sleep quality. Secondly, the Dynamic CCT lighting designed in this study and its slow light source changing frequency can effectively change the brain wave speed of the brain, so that the frequency of the cluttered brain waves of the volunteers slows down, allowing the volunteers to fall asleep faster and achieve deep sleep (slow wave sleep) stage. Future studies could use HRV to analyze autonomic nervous system activity as a basis for assessing sleep quality based on sympathetic and parasympathetic activity levels.

Author Contributions

Conceptualization, C.-Y.C.; methodology, C.-Y.C.; software, C.-Y.C.; validation, H.-W.C.; formal analysis, H.-W.C.; data curation, C.-Y.C. and H.-W.C.; writing—original draft preparation, C.-Y.C. and H.-W.C.; writing—review and editing, C.-Y.C.; supervision, C.-Y.C.; project administration, C.-Y.C. and H.-W.C. All authors have read and agreed to the published version of the manuscript.

Funding

This research was funded by the Ministry of Science and Technology of Taiwan. Research project name: The impact of LED lighting on human behavior, project number: 105-2622-E-011-014-CC3.

Institutional Review Board Statement

The study was conducted according to the guidelines of the Declaration of Helsinki, and approved by the Institutional Review Board (or Ethics Committee) of the National Taiwan University Research Ethics Center (protocol code 201802FM029).

Informed Consent Statement

Informed consent was obtained from all volunteerss involved in the study.Written informed consent has been obtained from the patient(s) to publish this paper.

Data Availability Statement

All data generated or analyzed to support the findings of the present study are included this article. The raw data can be obtained from the authors, upon reasonable request.

Conflicts of Interest

The authors declare no conflict of interest.

References

  1. Shalala, D.E.; Satcher, D.; Lee, P.R.; Joyner, F.G.; McMillen, T. Physical Activity and Health: A Report of the Surgeon General; US Department of Health and Human Services: Washington, DC, USA, 1996; p. 278.
  2. Kang, M.G.; Koh, S.B.; Cha, B.S.; Park, J.K.; Baik, S.K.; Chang, S.J. Job stress and cardiovascular risk factors in male workers. Prev. Med. 2005, 40, 583–588. [Google Scholar] [CrossRef] [PubMed]
  3. Mika, K.; Virtanen, M.; Elovainio, M.; Kouvonen, A.; Väänänen, A.; Vahtera, J. Work stress in the etiology of coronary heart disease a meta analysis. Scand. J. Work Environ. Health 2006, 32, 431–442. [Google Scholar]
  4. Mika, K. Job strain as a risk factor for coronary heart disease: A collaborative meta-analysis of individual participant data. Lancet 2012, 380, 1491–1497. [Google Scholar]
  5. Nakata, A.; Haratani, T.; Takahashi, M.; Kawakami, N.; Arito, H.; Kobayashi, F.; Araki, S. Job stress, social support, and prevalence of insomnia in a population of Japanese daytime workers. Soc. Sci. Med. 2004, 59, 1719–1730. [Google Scholar] [CrossRef] [PubMed]
  6. Ota, A.; Masue, T.; Yasuda, N.; Tsutsumi, A.; Mino, Y.; Ohara, H. Association between psychosocial job characteristics and insomnia: An investigation using two relevant job stress models—the demand-control-support (DCS) model and the effort-reward imbalance (ERI) model. Sleep Med. 2005, 6, 353–358. [Google Scholar] [CrossRef] [PubMed]
  7. Ota, A.; Masue, T.; Yasuda, N.; Tsutsumi, A.; Mino, Y.; Ohara, H.; Ono, Y. Psychosocial job characteristics and insomnia: A prospective cohort study using the Demand-Control-Support (DCS) and Effort–Reward Imbalance (ERI) job stress models. Sleep Med. 2009, 10, 1112–1117. [Google Scholar] [CrossRef]
  8. Kim, H.-C.; Kim, B.-K.; Min, K.-B.; Min, J.-Y.; Hwang, S.-H.; Park, S.-G. Association between job stress and insomnia in Korean workers. J. Occup. Health 2011, 53, 164–174. [Google Scholar] [CrossRef] [PubMed] [Green Version]
  9. Jackowska, M.; Dockray, S.; Endrighi, R.; Hendrickx, H.; Steptoe, A. Sleep problems and heart rate variability over the working day. J. Sleep Res. 2012, 21, 434–440. [Google Scholar] [CrossRef]
  10. Bonnet, M.H.; Arand, D.L. Heart rate variability: Sleep stage, time of night, and arousal influences. Electroencephalogr. Clin. Neurophysiol. 1997, 102, 390. [Google Scholar] [CrossRef]
  11. Bonnet, M.H.; Arand, D.L. Heart Rate Variability in Insomniacs and Matched Normal Sleepers. Psychosom. Med. 1998, 60, 610. [Google Scholar] [CrossRef] [PubMed]
  12. Spiegelhalder, K.; Fuchs, L.; Ladwig, J.; Kyle, S.D.; Nissen, C.; Voderholzer, U.; Feige, B.; Riemann, D. Heart rate and heart rate variability in volunteersively reported insomnia. J. Sleep Res. 2011, 20, 137. [Google Scholar] [CrossRef] [PubMed]
  13. Shinar, Z.; Baharav, A.; Akselrod, S. Obstructive Sleep Apnea Detection Based on Electrocardiogram Analysis. Comput. Cardiol. 2000, 27, 757. [Google Scholar]
  14. Shinar, Z.; Akselrod, S.; Dagan, Y.; Baharav, A. Autonomic changes during wake–sleep transition: A heart rate variability based approach. Auton. Neurosci. Basic Clin. 2006, 130, 17. [Google Scholar] [CrossRef] [PubMed]
  15. Ong, J.L.; Lo, J.C.; Chee, N.I.; Santostasi, G.; Paller, K.A.; Zee, P.C.; Chee, M.W.L. Effects of phase-locked acoustic stimulation during a nap on EEG spectra and declarative memory consolidation. Sleep Med. 2016, 20, 88–97. [Google Scholar] [CrossRef] [Green Version]
  16. James, J.S.; Umunna, S.; Bretl, T. The elicitation of steady-state visual evoked potentials during sleep. Psychophysiology 2017, 54, 496–507. [Google Scholar]
  17. Ingegärd, E.M. A Review of Biomarkers in Leadership Research—Can Heart Rate Variability be a Suitable Method? Karolinska Institutet 2007, LIME. [Google Scholar]
  18. Badia, P.; Myers, B.; Boecker, M.; Culpepper, J.; Harsh, J. Bright light effects on body temperature, alertness, EEG and behavior. Physiol. Behav. 1991, 50, 583–588. [Google Scholar] [CrossRef]
  19. Liu, N. Effects of Monochromatic LED Blue Light Irradiation on Circadian Rhythm in Healthy Humans. Chin. J. Tissue Eng. Res. 2009, 30, 5923–5926. [Google Scholar]
  20. Sharon, O.; Nir, Y. Attenuated Fast Steady-State Visual Evoked Potentials During Human Sleep. Cereb. Cortex 2018, 28, 1297–1311. [Google Scholar] [CrossRef] [PubMed]
  21. West, K.E.; Jablonski, M.R.; Warfield, B.; Cecil, K.S.; James, M.; Ayers, M.A.; Maida, J.; Bowen, C.; Sliney, D.H.; Rollag, M.D.; et al. Blue light from light-emitting diodes elicits a dose-dependent suppression of melatonin in humans. J. Appl. Physiol. 2011, 110, 619–626. [Google Scholar] [CrossRef] [Green Version]
  22. Global, L.A. Optical and Photobiological Safety of LED, CFLs and Other High Efficiency General Lighting Sources. A White Paper of the Global Lighting Association, March 2012. Available online: http://docplayer.net/13709395-Optical-and-photobiological-safety-of-led-cfls-and-other-high-efficiency-general-lighting-sources-a-white-paper-of-the-global-lighting-association.html (accessed on 15 February 2022).
  23. Hsieh, C.H.; Huang, B.R.; Wu, P.J.; Chen, C.Y. Colour Deviation Sensing and Compensation Method for Multi-Spectral LED Lighting System. In Proceedings of the CIE 2018 Conference on Smart Lighting, PO17, Taipei City, Taiwai, 24–28 April 2018; pp. 17–28. [Google Scholar]
  24. Chen, C.Y. Improvement of Sleep Quality by Using an Intelligent Light. In Proceedings of the CIE 28th Session, Manchester, UK, 28 June–4 July 2015. [Google Scholar]
  25. Hsieh, B.H. Can short breaks with a dynamic light make people fully energetic? In Proceedings of the CIE Midterm Meeting 2017, PO106, Jeju, Korea, 25 October 2017; pp. 1181–1184. [Google Scholar]
  26. Saul, J.P.; Arai, Y.; Berger, R.D.; Lilly, L.S.; Colucci, W.S.; Cohen, R.J. Assessment of autonomic regulation in chronic congestive heart failure by heart rate spectral analysis. Am. J. Cardiol. 1988, 61, 1292–1299. [Google Scholar] [CrossRef]
  27. Ako, M.; Kawara, T.; Uchida, S.; Miyazaki, S.; Nishihara, K.; Mukai, J.; Hirao, K.; Ako, J.; Okubo, Y. Correlation between electroencephalography and heart rate variability during sleep. Psychiatry Clin. Neurosci. 2003, 57, 59–65. [Google Scholar] [CrossRef] [PubMed]
Figure 1. Flow chart of novel hypnotic lighting system control and correction. This technology consists of RGB LEDs and two cool and warm white LEDs to form a multi-spectrum dynamic light supply system. It has a measurement and correction system that can monitor and control the spectrum, illuminance, CCT, color rendering and Duv.(driver: led power driver, led drive power supply; cool white LED CCT: 6000 K ± 100 K. warm white LED CCT: 3300 K ± 100 K).
Applsci 12 02284 g001
Figure 2. This is the changing frequency of Dynamic CCT lighting, which is changed by 50 K (CCT) each time, rising from the lowest CCT 1900 K to the highest CCT 3800 K (for example: 1900 K, 1950 K, 2000 K, 2050 K, 2100 K,…, 3800 K), and then Descending from 3800 K to 1900 K every 50 K (e.g., 3800 K, 3750 K, 3700 K, 3650 K,…, 1900 K) in one cycle and complete within one minute, then repeat.
Applsci 12 02284 g002
Figure 3. (a) Lowest Dynamic CCT lighting spectrum (1900 K); (b)The highest Dynamic CCT lighting spectrum (3800 K), please refer to Figure 2 for the Dynamic CCT lighting frequency.
Applsci 12 02284 g003
Figure 4. Dim light spectrum, which is the same as the lowest Dynamic CCT lighting spectrum (1900 K), is designed according to the night light spectrum.
Applsci 12 02284 g004
Figure 5. Actual typewriting status chart.
Applsci 12 02284 g005
Figure 6. Execution of sleep experiments.
Applsci 12 02284 g006
Figure 7. After a long period of demonstration, the software directly shows that the wrist sleep actigraph has not captured the volunteers data at all.
Applsci 12 02284 g007
Figure 8. MP-150 (Bipac system) physiological signal measuring instrument: connect to a computer via a local area network (LAN), and you can connect to different physiological signal amplifiers by yourself. The sampling frequency can be as high as 200 Hz. The signal processed by the amplifier is very weak, so it needs to be amplified (1 Mv × 1000 times = 1 V) before it is easy to record and analyze the signal clearly.
Applsci 12 02284 g008
Figure 9. Wrist sleep actigraph (ActiGraph wGT3X-BT) and Actilife’s interface.
Applsci 12 02284 g009
Figure 10. Dark room, Dynamic CCT, and Dim light effect comparison chart on nHFP under sleep environment. “*” is p < 0.05.
Applsci 12 02284 g010
Figure 11. Dark room, Dynamic CCT and Dim light effect comparison chart on nLFP under sleep environment. “*” is p < 0.05, “**” is p < 0.005.
Applsci 12 02284 g011
Figure 12. Dark room, Dynamic CCT and Dim light effect comparison chart on LF/HF under sleep environment. “*” is p < 0.05.
Applsci 12 02284 g012
Figure 13. Dark room, Dynamic CCT and Dim light typing efficiency comparison chart per minute in sleep environment. “***” is p < 0.001.
Applsci 12 02284 g013
Figure 14. Dark room, Dynamic CCT and Dim light typing efficiency comparison chart per minute in sleep environment. “*” is p < 0.05.
Applsci 12 02284 g014
Table 1. Experimental planning.
TimeTask
11:10–11:40Lunch
11:40–11:45Environmental adaptation
11:45–11:50Wear ECG electrode patch
11:50–12:00Typing task
12:00–13:00Sleep experiment
13:00–13:10Typing task
13:10–13:15Psychological questionnaire
Table 2. Epworth Sleepiness Scale.
Score
Comfort123456
Environment is too bright123456
Environment is too dark123456
Sleep quality123456
More energetic123456
Publisher’s Note: MDPI stays neutral with regard to jurisdictional claims in published maps and institutional affiliations.

