1. Introduction
Explosives are used in various industries, such as in mining and excavation work. Structures such as dams or tunnels and nearby settlements are areas that can be affected by the vibration caused by the explosions. Comprehensive assessments are necessary to minimize explosive-related impacts from structural vibrations in built structures [
1].
Much of the explosive energy generated by explosives that does not go into breaking the rock generates vibrations within the mass of the rock with characteristics based on the properties of the rock mass. In explosive-assisted excavation works, necessary technical and economic requirements should consider the effects of blast-induced vibrations. To determine the peak particle velocity of a blast-induced vibration, there are various empirical estimation models in literature sources. To use an estimation model in determining blast-induced vibration, onsite studies should be undertaken and vibration measurements made. The Peak particle velocity values are measured by devices placed at a certain distance from the point of the blast. Based on the amount and yield of explosive used in blasting and the distances from the blast sites to the analyzed structures, parameters for the site are determined using binary regression analysis. Most estimation models use the concept of “scaled distance and peak particle velocity,” in which the level of vibration radiated from a blast point is determined by converting two main input variables into a single output value. Common inputs are the amount of explosive per delay and the distance from the source of the blast. Two-dimensional regression analysis is required to predict the peak particle velocity using amount of explosive per delay and distance [
2]. In addition, monitoring of peak particle velocity is very important in the conditions of a stratified rock mass, which is protected by mining support [
3]. Obviously, the value of peak particle velocity obtained from blasting is not controlled only by amount of explosive per delay and distance from blast area. Many parameters affect blast induced vibration and propagation. Especially in bench blasting operations, in addition to the amount of explosive per delay and distance to the blast site, factors of blast patterns (distances between holes, burden, bench height, length of hole, stemming length, hole diameter, sub-drill) and rock mass properties are also important parameters [
1]. On the other hand, geological features of the rock mass such as the fault zone affect the propagation of ground vibration and they play an active role in value of peak particle velocity. Some of the relevant works in the literature are summarized below.
Rock masses are typically characterized by discontinuous and anisotropic in homogeneous structures. The discontinuous structures, such as faults, joints, fissures, and fractured zones, are randomly distributed in the rock mass and have important implications for blasting engineering. In blasting operations, natural cracks in the rock mass structure are changed by additional stresses induced by the blasting, and the shear strength of the structural surface is significantly reduced, thereby decreasing the stability of the rock [
4,
5,
6]. Far from shot point, ground and rock mass characteristics, which carries the seismic waves, effects the vibration feature and specialty [
7,
8].
At short range, a wave radiates spherically and amplitude diminishes inversely with distance from the blast. At longer ranges, two other factors affect the propagation process: (1) the wave splits into three types of wave that travel at different speeds and (2) variations in the medium such as layering or fissuring may introduce further scattering and dispersal effects [
9,
10]. A major geological fault intersecting the path may largely prevent propagation in a particular direction [
9].
Bazzi et al. examined using an acceleration-time wave typical of a mine blast, a pit slope containing a fault under seismic loading caused by successive explosions with varying intensity. They selected some reference points above/under the fault surface and their motions recorded during the FE analysis. According to their results, they found that the points above the fault surface had the greatest displacement, while below the fault surface, only minimal (negligible) motions occurred [
11].
Yin et al. showed that the attenuation rate of the vibration velocity and energy attenuation of the blasting vibration increased with increasing joint degree. Based on this result, they mentioned that the structural parameters of the rock mass (such as the number of joints) had a significant impact on the attenuation law of blasting vibration in their research paper [
6].
Nicieza et al. measured vibrations from blasts of two different benches located in front of and behind the fault zone. Two geophones were used to take measurements. The first bench was situated on the same side of the fault. Accordingly, the vibration velocities of the blasts in the first bench are higher than the vibration velocities of the blasts in the second bench, located on the opposite side of the fault. They said that attenuation was stronger for first bench measurement points that for second bench measurement points [
12].
Adushkin and Oparin emphasize that theoretical forecasting and then experimental discovery of the pendulum waves immediately associated with the stress-strain state of rocks has spurred the development of brand-new methods and means for integrated seismic-deformation electromagnetic monitoring of natural and induced earthquakes, rock bursts and other seismic events, as well as for the enhanced oil recovery due to vibration treatment [
13]. Adushkin and Oparin validates the energy approach to describing transformation of elastic energy of destructive event source areas into kinetic energy of structural elements of these areas. The authors introduce a new notion of interference seismic emission events [
14].
However, there are only a few studies regarding the vibration wave propagation characteristics of structural planes in literature. Studies on the vibration effects of blasting have described the transmission and reflection of the stress wave on the surface of the structure using theoretical analysis and have focused primarily on the amplitude attenuation effect of structures on the stress wave [
6,
15,
16,
17]. Therefore, there is a need to research the effect of rock mass properties, such as fault, on the blast vibration attenuation. In addition, the influence of rock structures on the propagation of vibration attenuation should be analyzed accurately.
In this study, 11 blasts in a limestone quarry were monitored to produce a total of 42 measurements of vibration in two different directions. The measurement directions were determined considering the location of the fault zone. According to this, directions were selected as Northwest and Southwest. There is not a fault zone between the blasting area and the geophone locations in the southwest, while the fault zone is between the blasting area and the geophone in the northwest direction. The data set was analyzed using USBM empirical estimation model and compared each other according to directions. This research aims to estimate the propagation distances of the particle velocities, which will occur in the ongoing blasting operations at this quarry, based on the geological conditions. For this reason, the effect of the fault zone has been investigated on blast-vibration propagation.
2. Location of Quarry and Geology
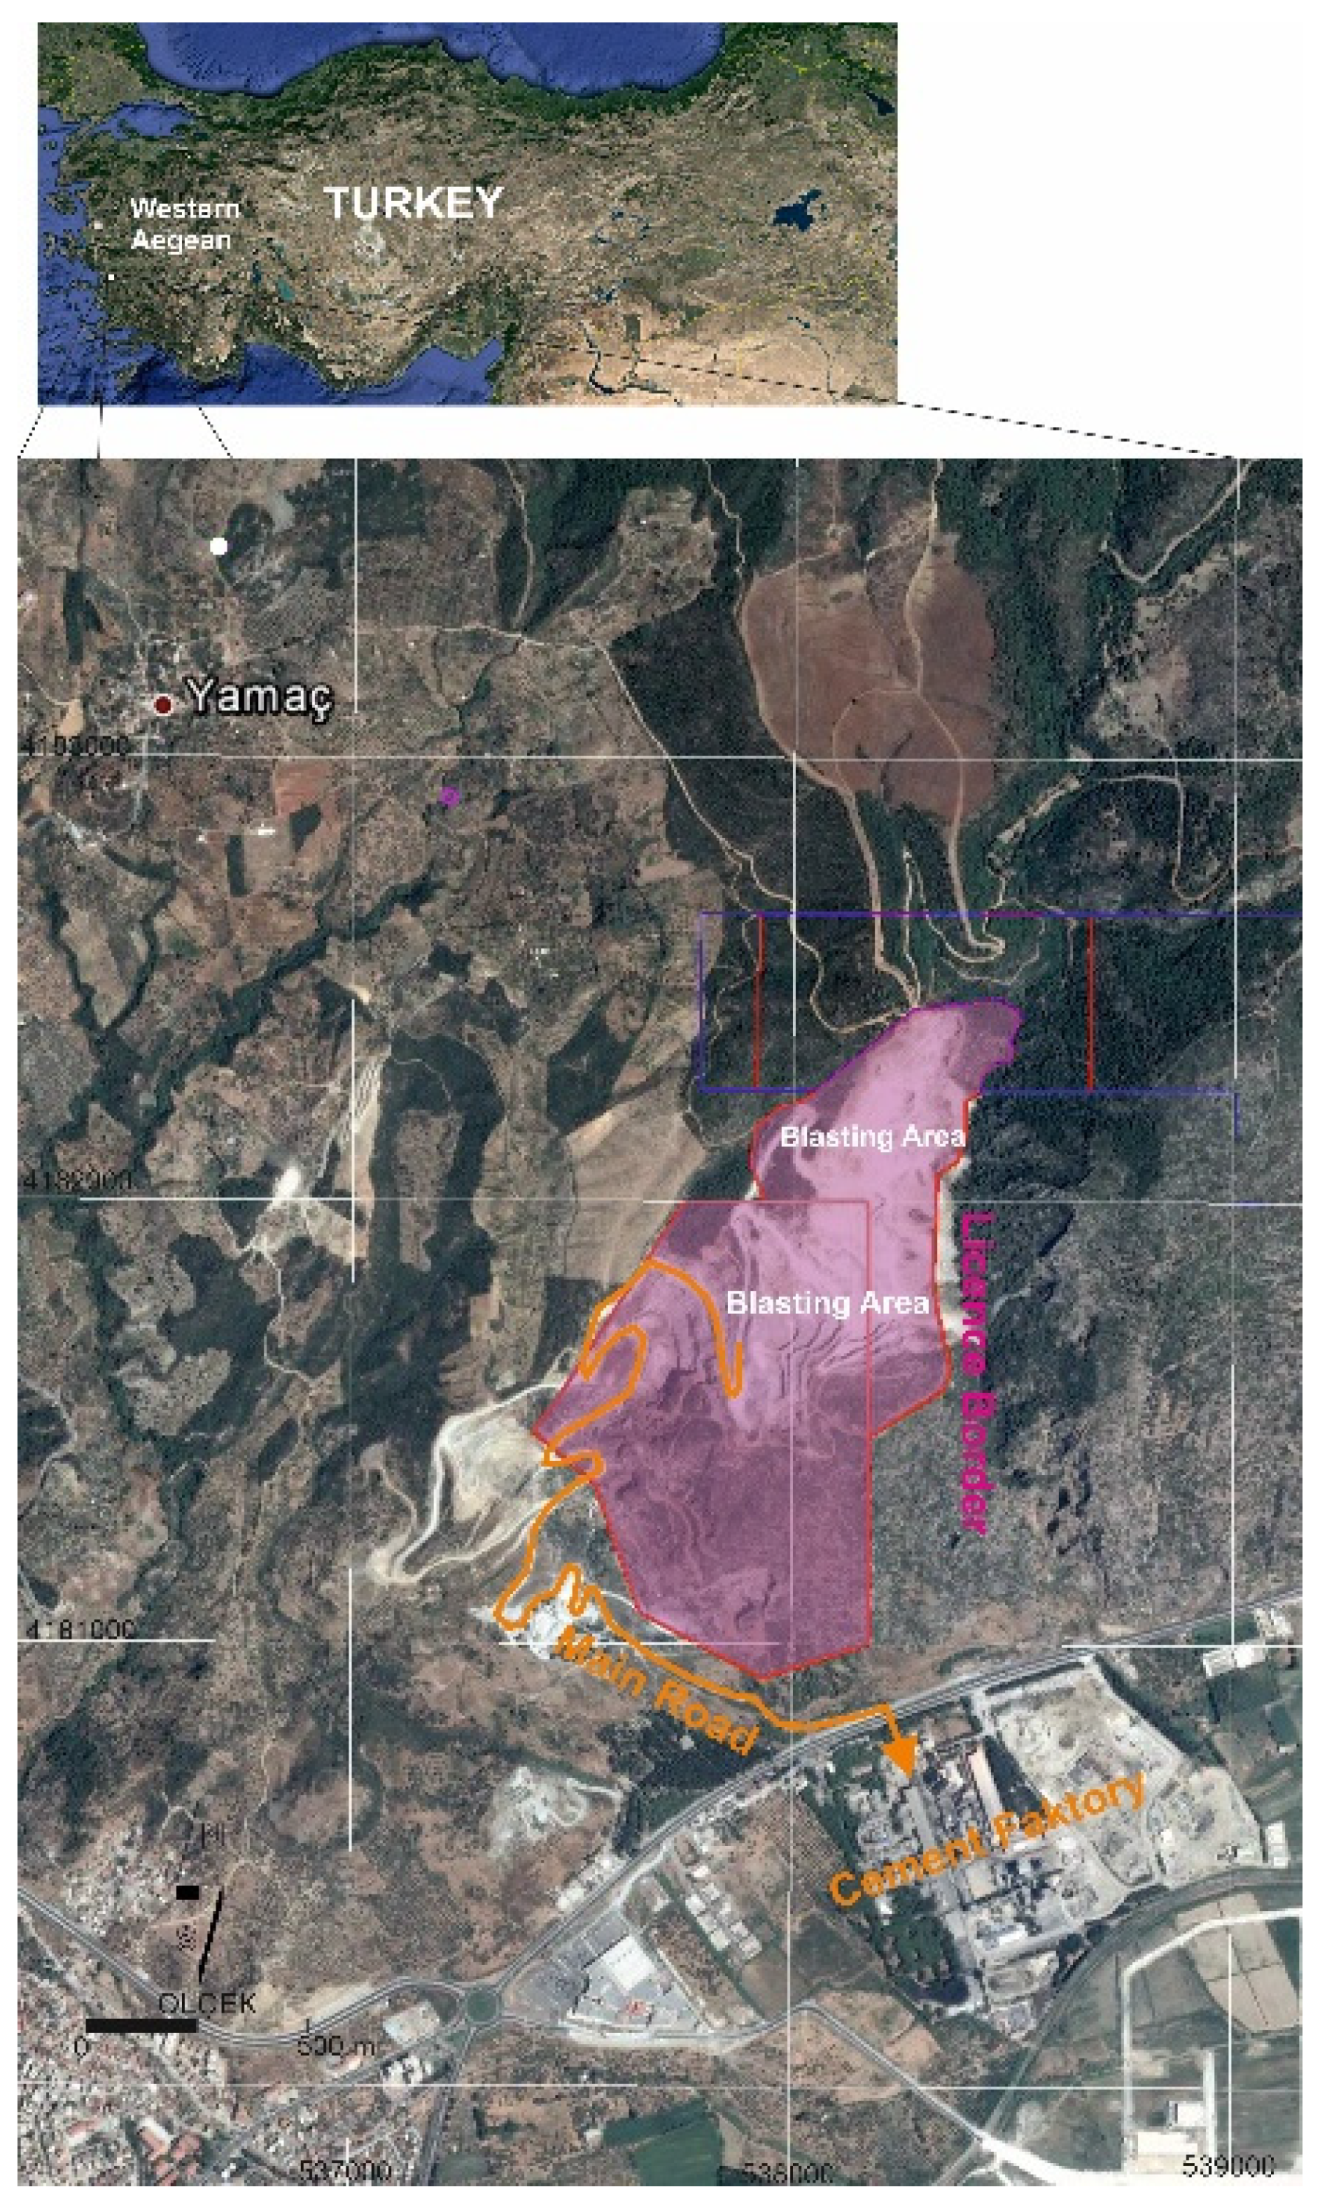
This research was performed in a limestone quarry located in western Turkey that supplies raw materials to a cement factory. In this study, the blasting operations were monitored to produce 42 measurements of vibration. As a result of these measurements, vibration velocities have been evaluated. Mining activities in the field are carried out within the license limit. Limestones from the quarry, where open-pit mining is by the shovel-truck systems, are used in the cement factory and ready-mixed concrete plants. It has been planned to bench blast two or three times a week for an annual capacity of 2.5 million tons.
Figure 1 shows the location of the field. The elevations of the blasting area given in
Figure 1 vary between +410 m and +270 m. The elevation of the cement factory is +20. The main transport road has an average length of 3.5 km.
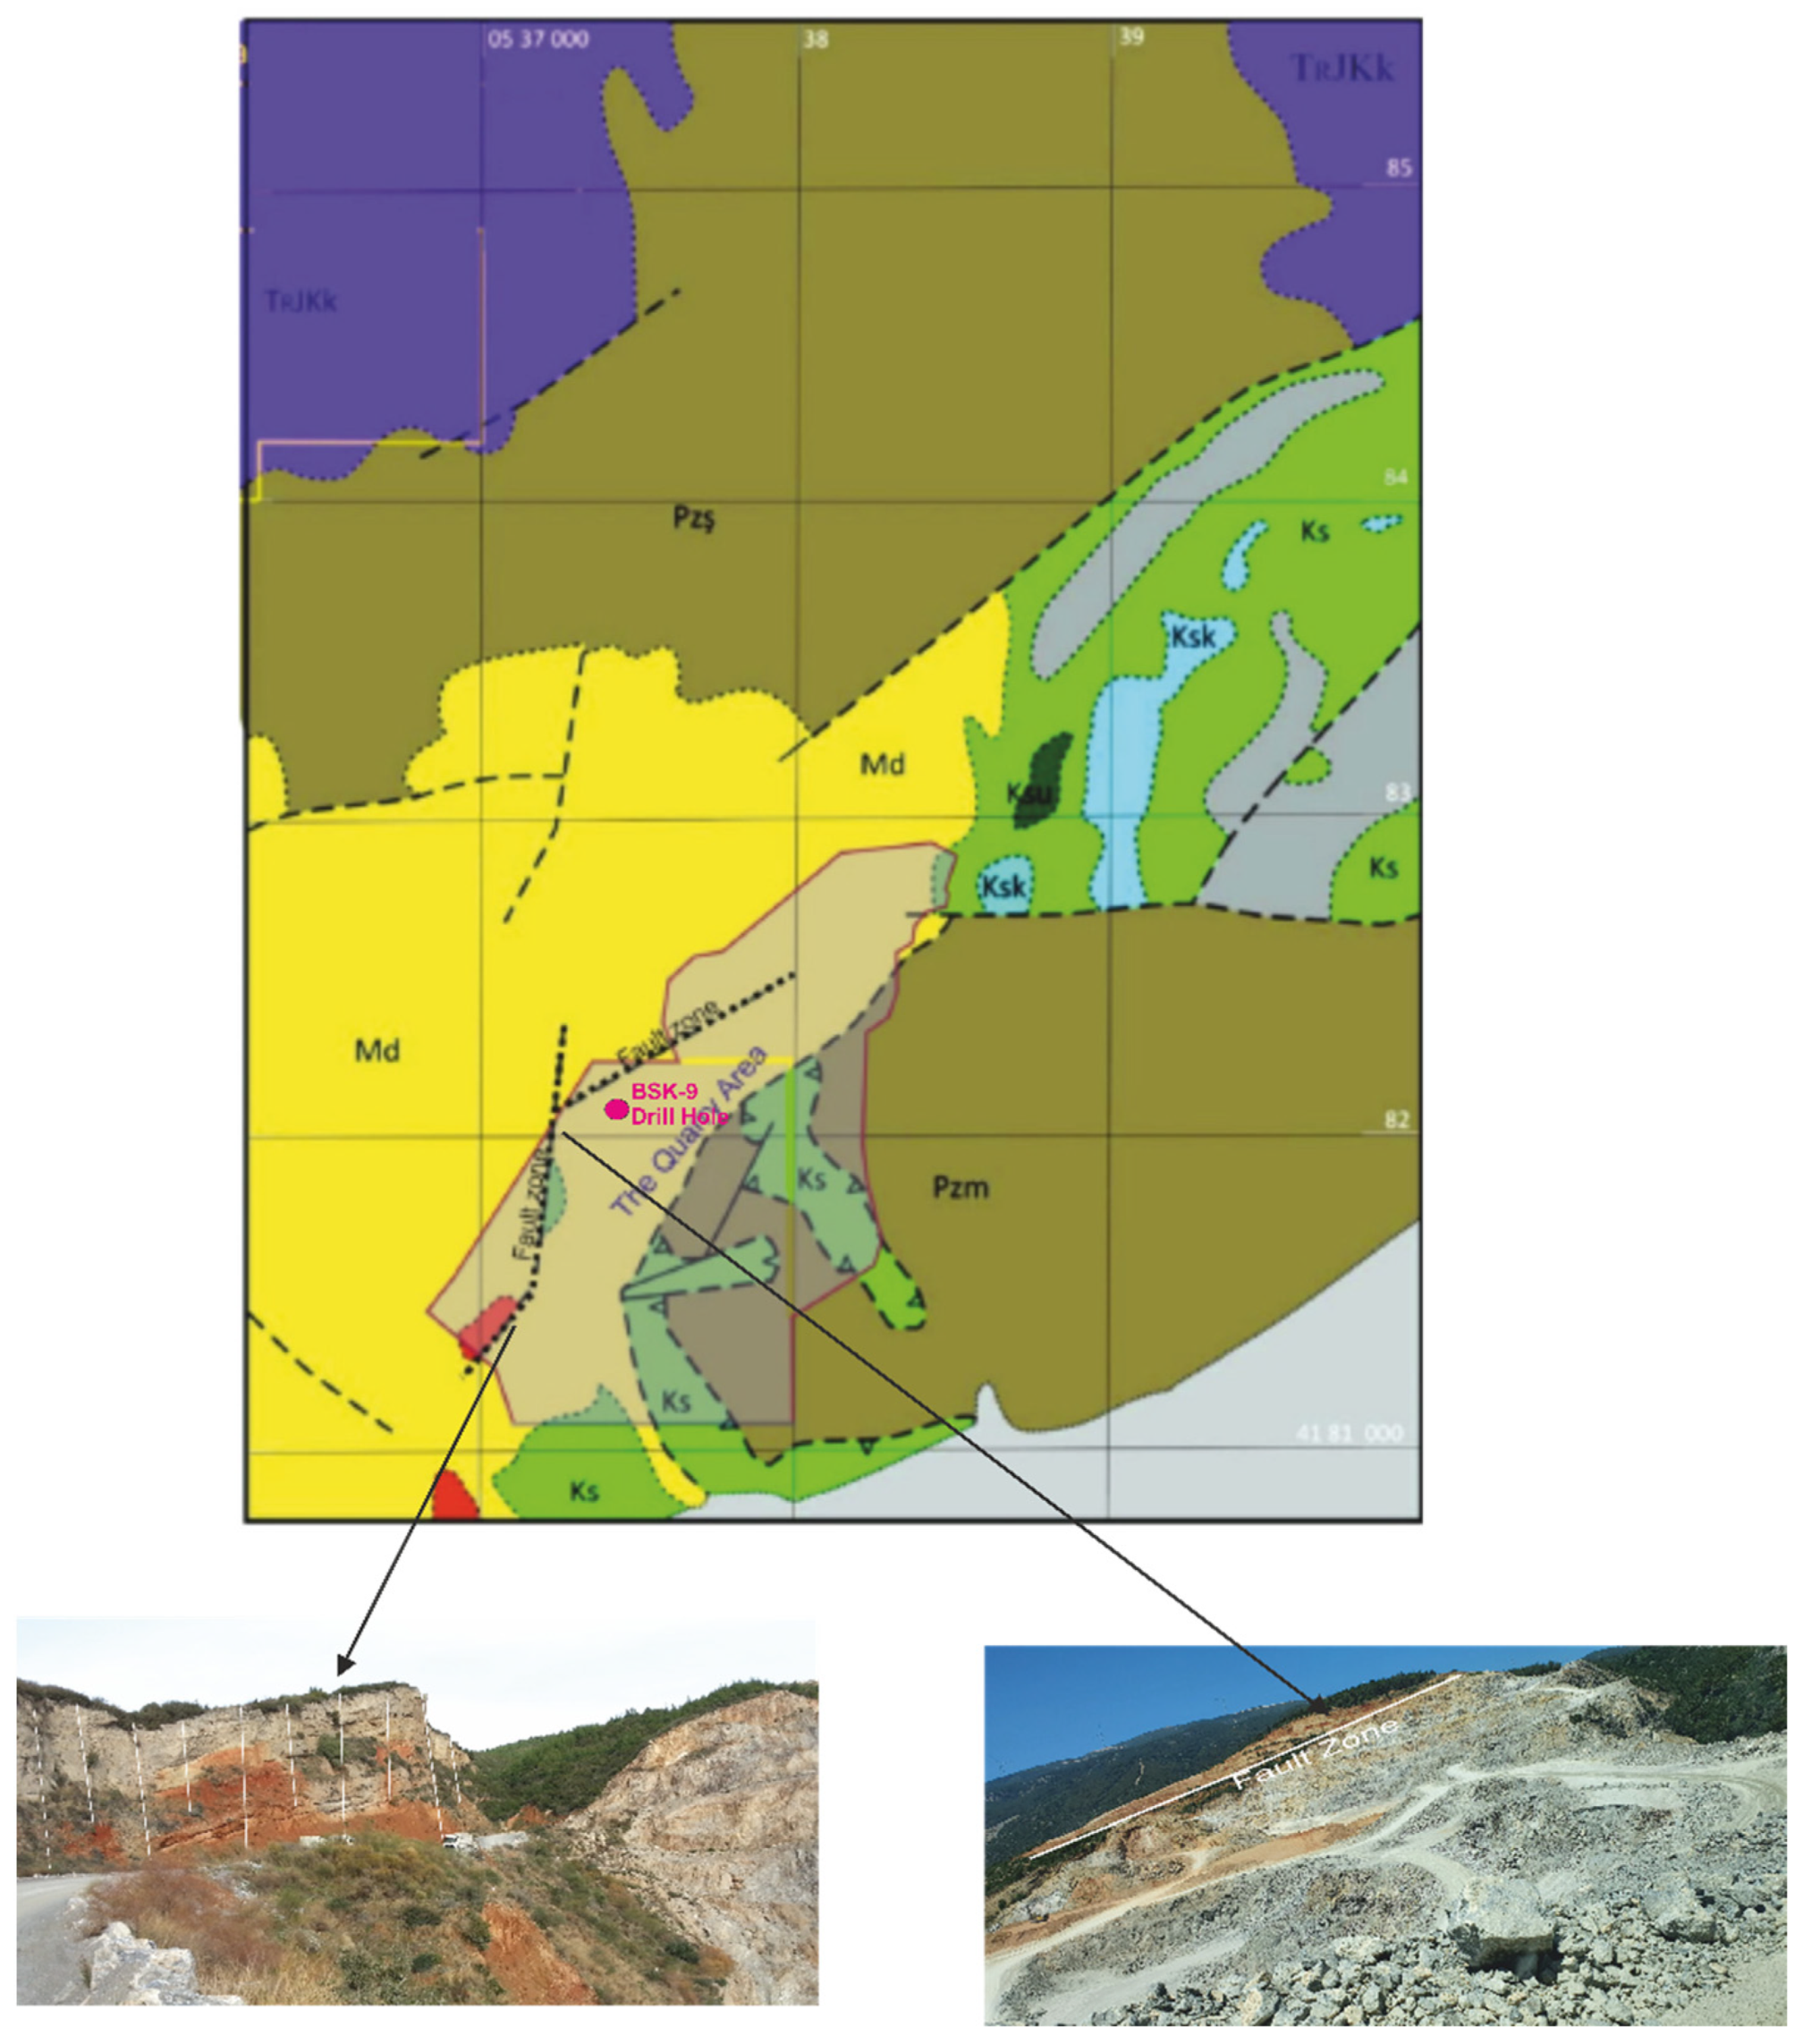
The strike of the fault zone is N5–10E in the south and N40–50E in the north. The fault is a dip slip normal fault (nearly vertical) having 35–40 m throw. The fault zone is generally 10–20 m thick, and rarely reaches to 100 m. The persistence of the fault zone is about 1180 m in N5–10E direction and 875 m in N40–50E direction.
Paleozoic age metamorphic rocks such as quartzite-quart-schists, gneiss and marbles belonging to the Menderes Massif constitute the basement rocks in and around the quarry site (
Figure 2). The Menderes Massif is a vast NE–SW trending metamorphic terrain in western Turkey [
18]. The platform type marble successions range in age from Triassic to Late Cretaceous, and are overlain by a marble horizon and flysch-type detrital rocks of Late Cretaceous–Earliest Eocene [
17,
19].
The upper part of the Menderes Massif’s cover series is represented by detrital and carbonate rocks. Neogene aged alternating formations of conglomerate and sandstone-mudstone-limestone are located on the metamorphic basement discordantly in the western and northern parts of Söke. Quaternary alluvial soils cover all these units [
20].
Kayaaltı formation bearing thick metamorphosed carbonate platform overlies Bayındır formation bearing Menderes Massif’s schists [
21,
22].
Bayındır formation (Pzş, Pzm) include mica schists, meta-quartzites, phyllites and marbles. Quartz-rich meta-conglomerates, mafic meta-tuffs and chloritoid-disten schists are placed in the top of the sequence. Bayındır formation also bearing grey-black colored marble, dolomite and calc schist intercalations. Marbles are grey, dark grey and white colored and have large calcite and dolomite crystals. These marbles have been produced in the Cankurtaran field [
22].
Yellow, white colored marbles with large crystals and dark grey colored dolomitic marbles and dolomites are located at the bottom of the Kayaaltı formation (TRJKk). Grey colored, moderate-thinly foliated marbles with metaboksite lences are represented in the upper layers of the formation. Grey-white colored marbles having thin layers with chert interbands and lences are exposed in the top of the sequence [
22].
Mafic volcanic, serpentinite, marble and dolomite blocks bearing garnet mica schist matrix, Selçuk nappe (Ks), tectonically overlie Menderes Massif. Selçuk nappe outcrop is in northern parts of the Cankurtaran field [
22].
Likya nappes, from bottom to top, red colured metapelite and metapsammites overlied by dolomites and tectonically overlies the Menderes Massif and Selçuk nappe [
18].
Söke formation (Miocene) consists of rough gravelstones and lacustrine limestones. These rocks are intercalated and the thickness of the formation is about 250 m [
24]. Gravelstones are grey-brown colored, massif, poorly graded. Sandstone and laminated mudstones are intercalated in the gravelstone unit.
Gneiss, marble, quartzite, schist, recrystallized limestone and metaserpentinite gravels are the fragments of the gravelstone. A sequence formed by sandstone, mudstone, limestone and bitumunuous shales overlies the gravelstones. Lignite layers are located in this sequence. Limestones are represented with white colored micritic limestones and having thin layeres claystone and lignite intercalations. The age of the Soke formation is Lower-Mid Miocene having Gastropoda fossils [
25] and sporomorf fossils [
26]. Soke formation discordantly overlie Menderes Massif, Selcuk nappe and Likya nappe [
22].
Davutlar gravelstone consists of blocky gravelstones, gravelly sandstones and sandstones, having thickness of 200 m. Massif sandstone layer is located at the bottom of the sequence and followed by gravelly sandstones and gravelstones having cross-bedding.
Gravelstones are beige-yellow colored, massif, having cross-beddings, well cemented, grain supported, well-moderate rounded. Bottom layers of the gravelstone have sandstone intercalations. Gravels are marble, recrystallized limestone, dolomite, quartz-schist, mica schist, serpentinite and metaboksite, dominantly. Grain size is in between gravel and block, but rarely larger than block. Kusadasi formation conformably overlies Davutlar gravelstone [
22].
There is no outcrop of Kusadasi formation (Miocene) observed in the study area [
25,
27]. Kusadasi formation consists of sandstones, mudstones and limestones.
The bottom layer of the formation is formed by sandstones having thin gravelstone interlayers. Mudstones are grey colored and intercalated with beige colored limestones. Total thickness of the formation is about 115 m. With the help of fossil content and contact relationship with Hisartepe volcanics, the age of the formation is Mid-Upper Miocene. Fevzipaşa formation discordantly overlies Kusadasi formation [
22].
Hisartepe volcanics (Miocene) consists of trachyandesite, latite, rhyodacite lava domes [
28]. Outcrops of Hisartepe volcanics are located in between Davutlar and Söke having NE-SW direction. Columnar joints are commonly seen in volcanic dome structures. Minerals of the volcanics are plagioclase, ojite, hornblende and sanidine. These phenocrysts are placed in glassy and very fine-grained matrix. This unit cuts Davutlar gravelstone and Kusadasi formation [
22].
The contact between the Davutlar conglomerate and the marbles of the Menderes Massif, which is still under production, is a high-angle normal fault in the northeast direction. The fault zones are shown in
Figure 3.
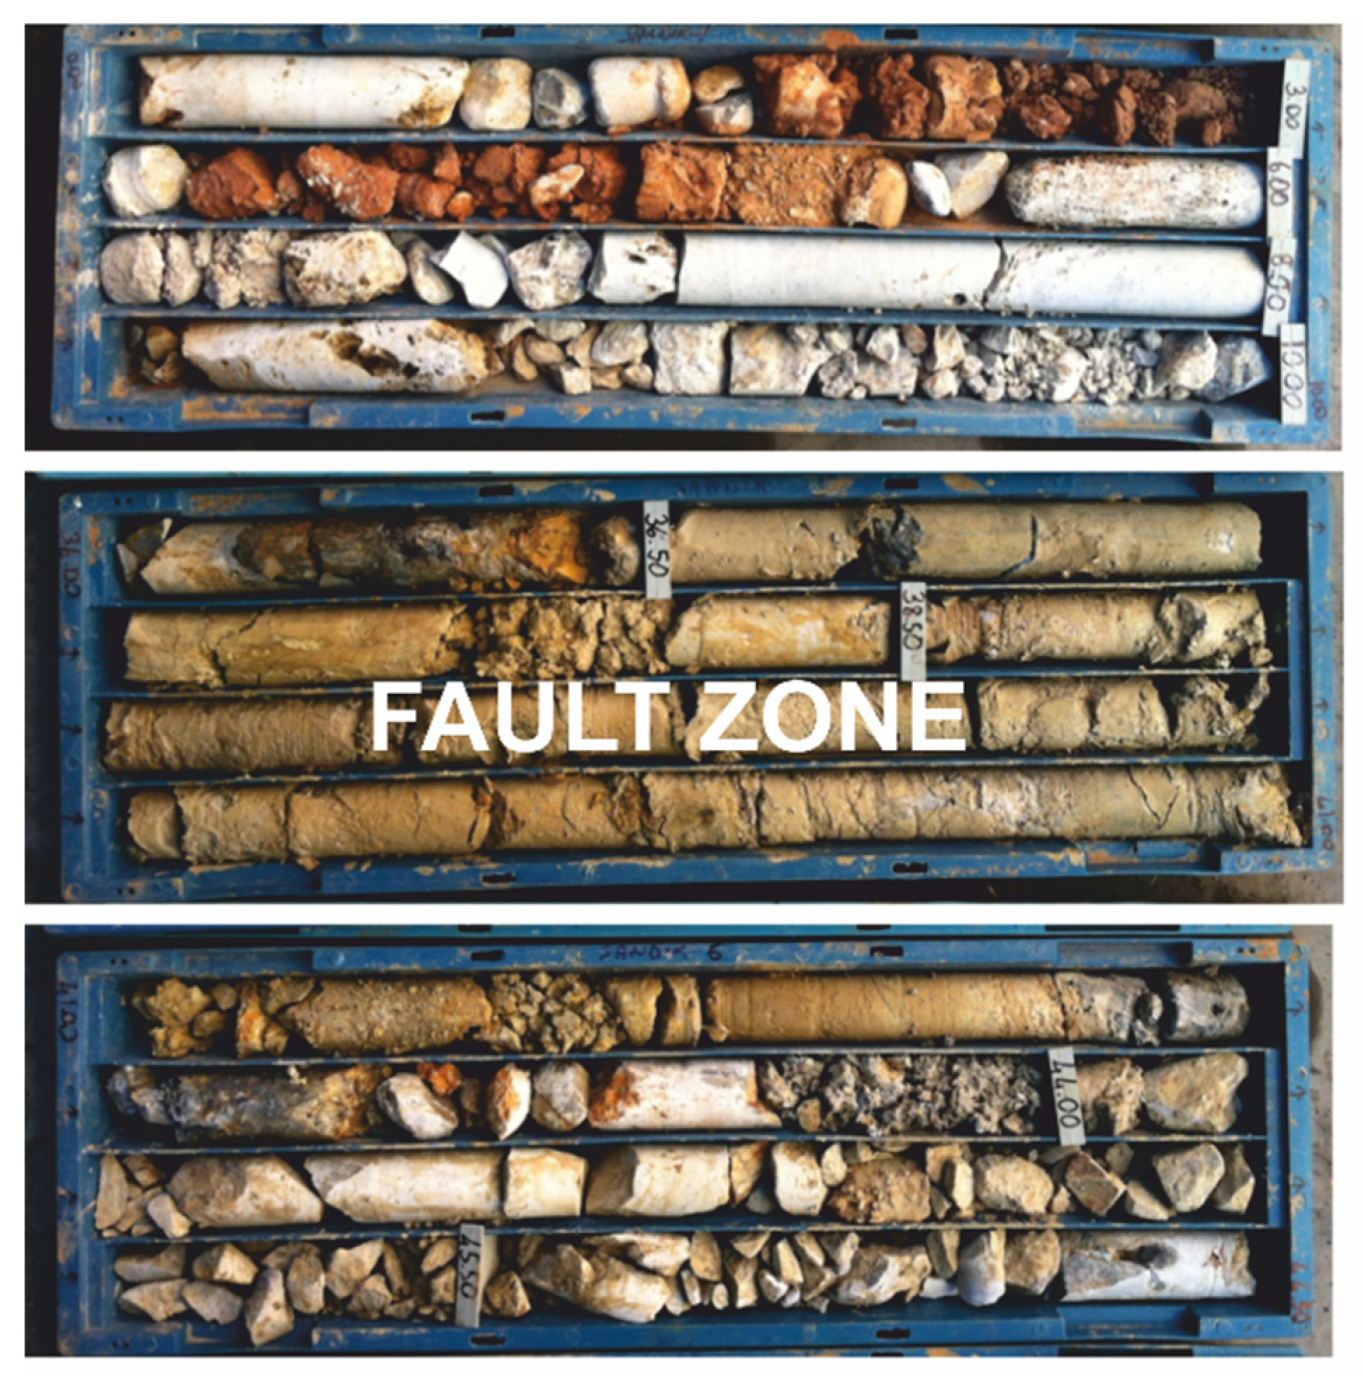
The fault zone was observed during the drilling studies carried out in the field. Drilling in the quarry was carried out to reveal the %MgO distribution of the cement raw material limestone (
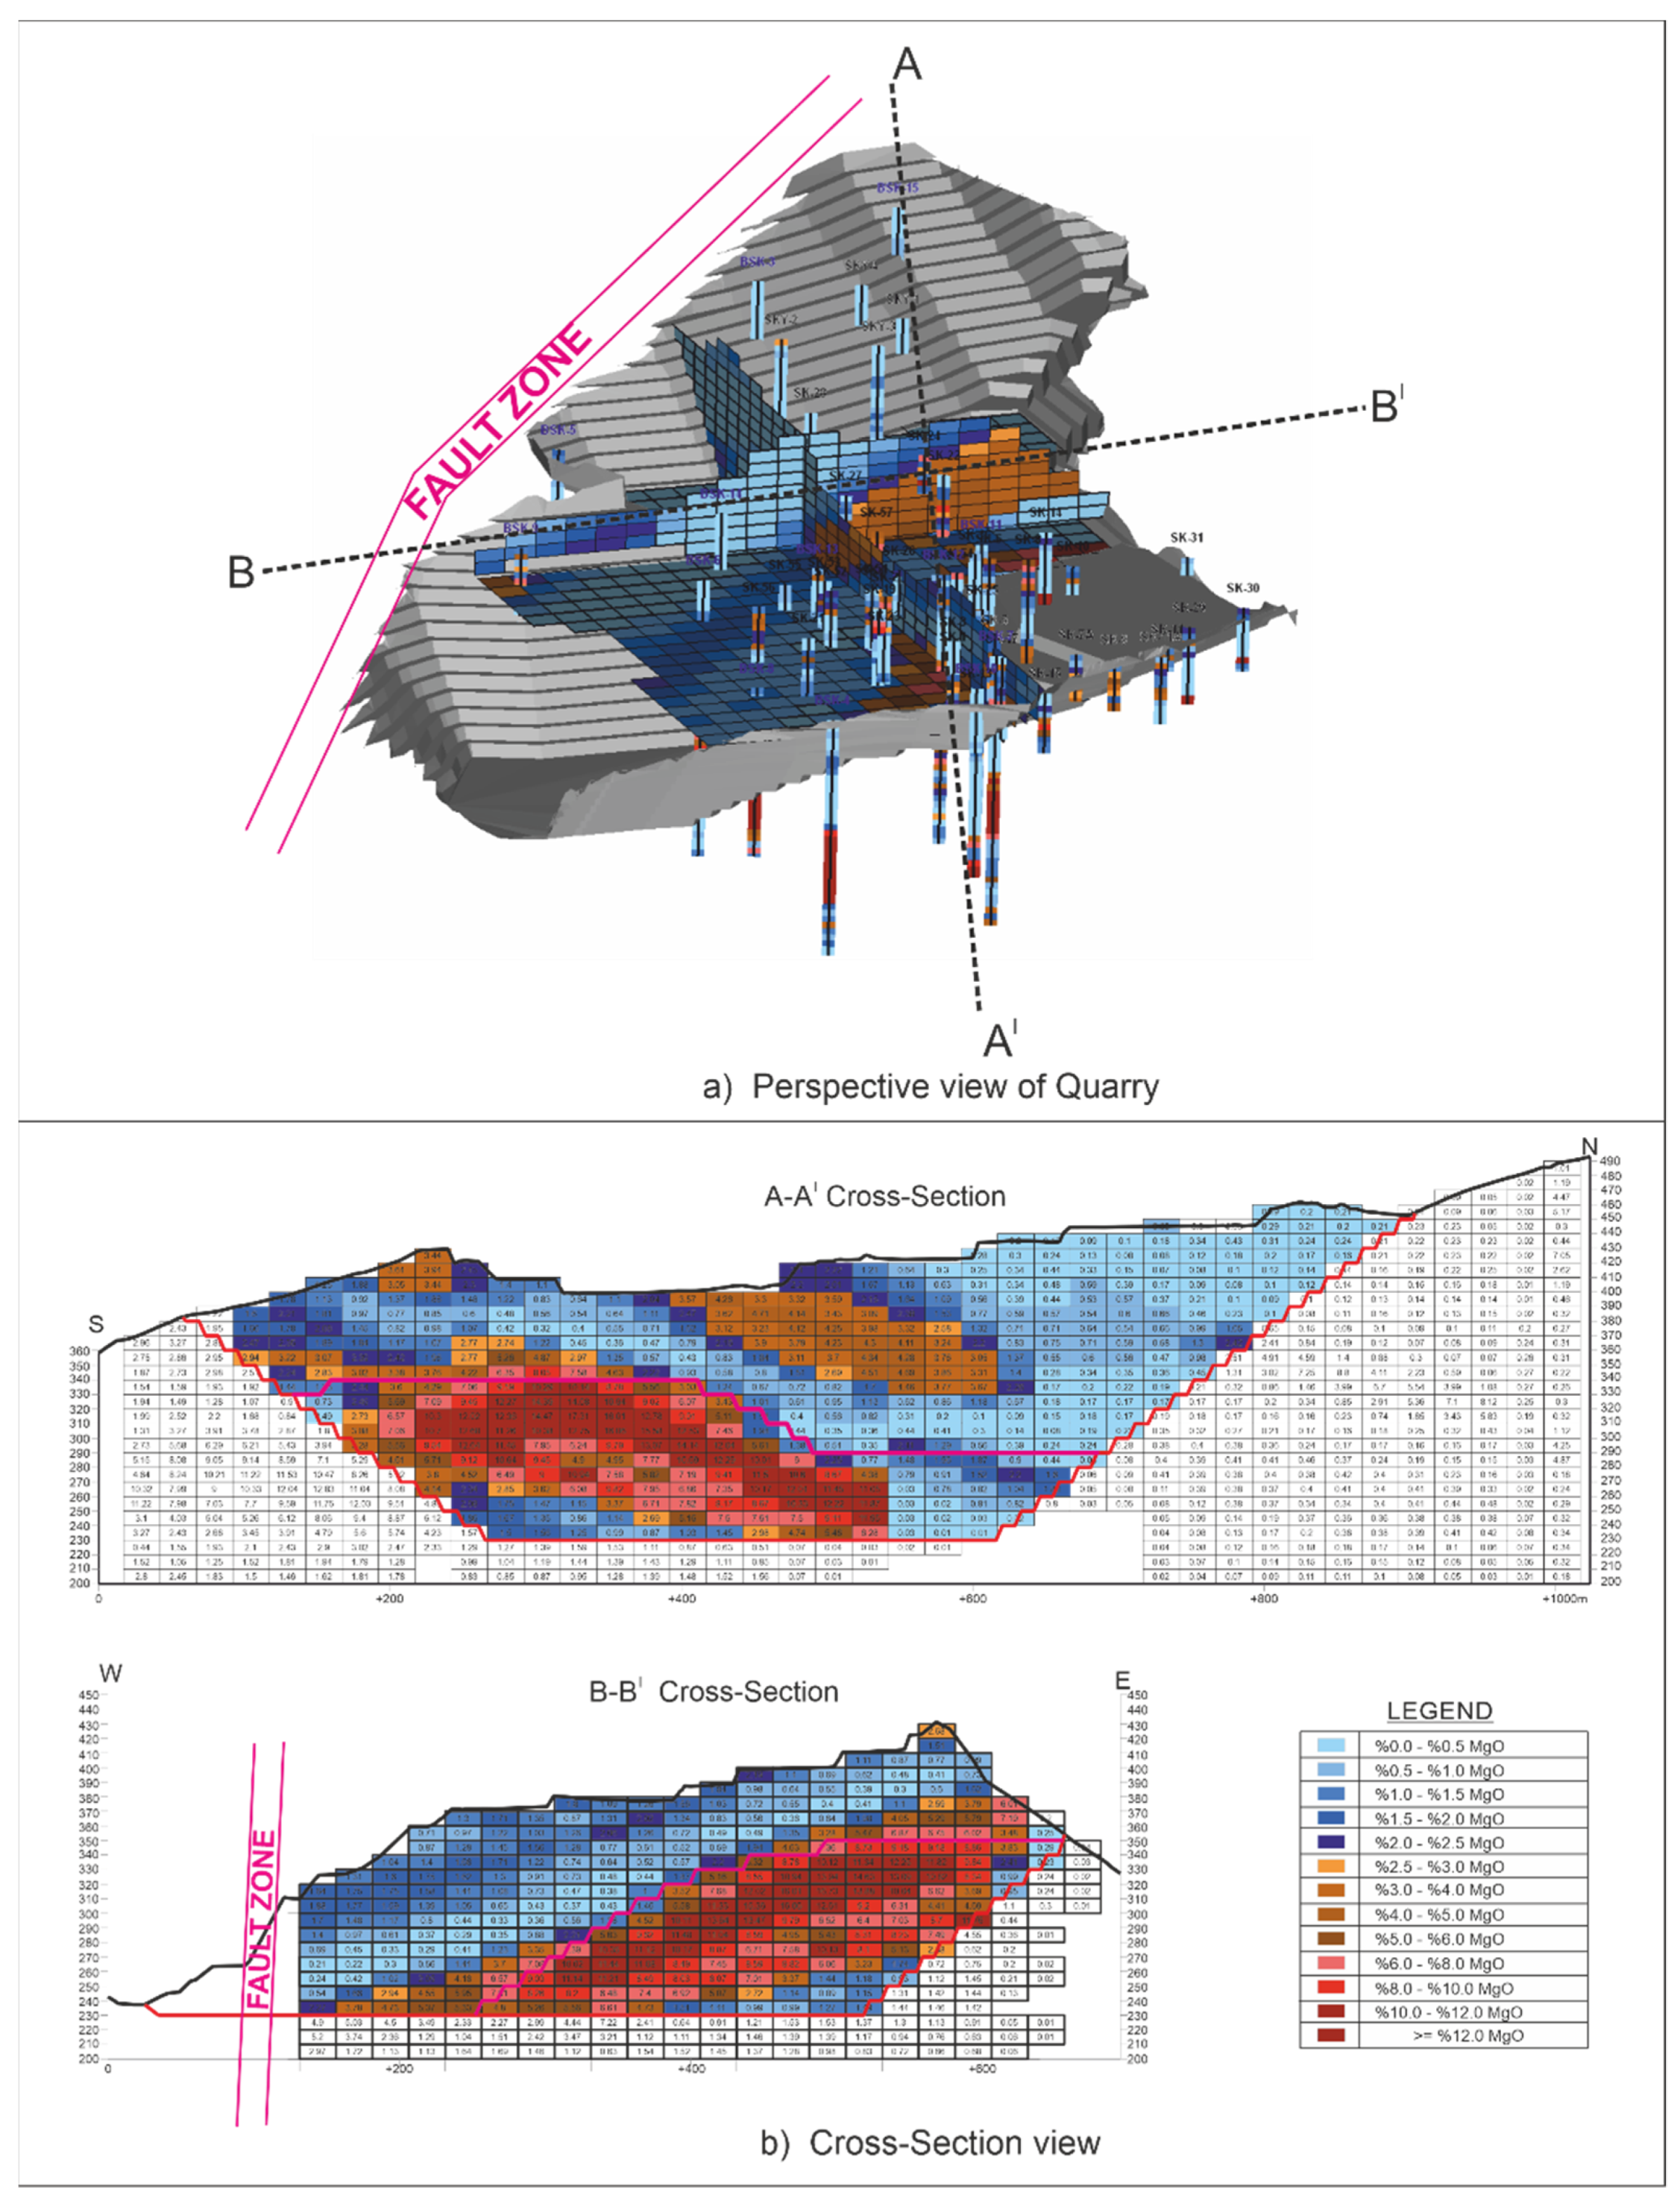
Figure 4). The quality distribution of the raw material quarry according to the %MgO content was carried out by using 52 drills. The fault zone observed in the west of the field has been decisive in terms of the quality distribution of the field. In
Figure 5, the %MgO quality distribution and cross-sectional views of the quarry are given by geostatistical method. Block model was created by using Micromine, Autocad and CorelDraw software.
3. Vibration Measurements
In line with the scope and specifications of the above studies, a total of 11 production blasts in the limestone quarry within Aydin Province, Soke area, registered to Batısöke Söke Çimento Sanayii A.Ş. were monitored to determine the range and distance over which vibrations would be dampened depending on the amount of the instant explosive charge used. Based on the boundaries of the blast sites and the directions of the geologic units, 42 vibrations measurements, 23 of them in the southwest and the others in the northwest direction, were recorded. The measurement directions were determined considering the location of the fault zone. Location of the limestone quarry, blasting and measurements points, and fault zone direction are given in
Figure 6. The resulting values were analyzed using the empirical estimation model proposed by the United States Bureau of Mines (USBM) for each direction.
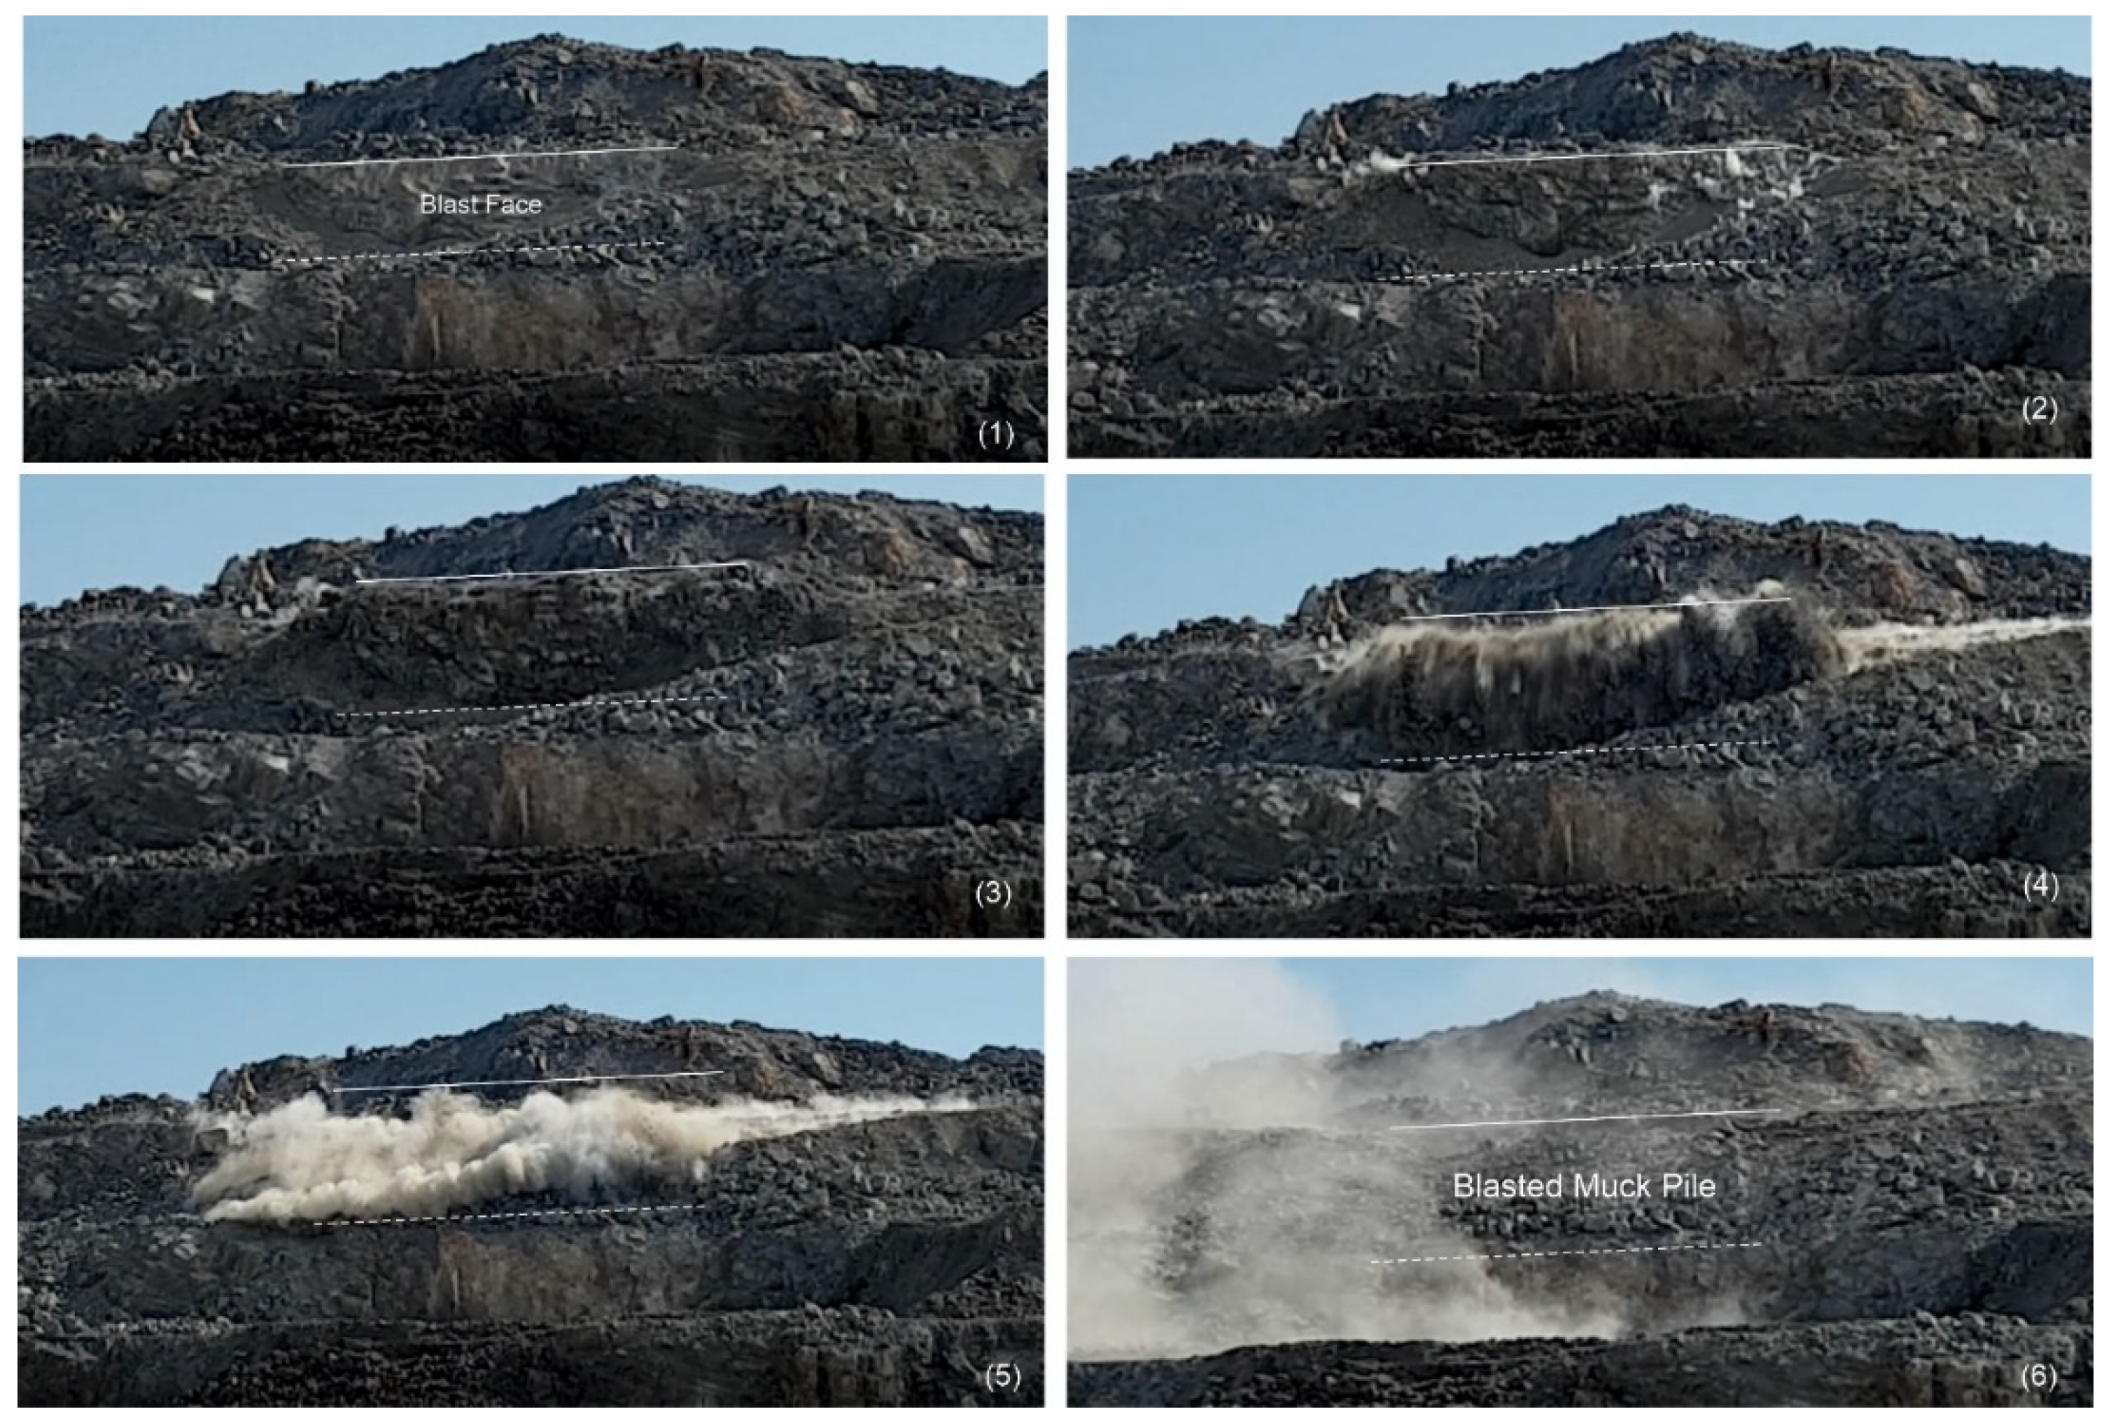
The measurements are 89 mm hole diameter, 2 m burden, 3 m spacing, 3 m stemming, 10–14 m hole length. For each blast hole, 0.5 kg cap sensitivity emulsion explosive and ANFO (Ammonium nitrate-Fuel Oil) with 35–62 kg per delay is used. In
Figure 7, the typical blast pattern and cross-section of the boreholes are illustrated. Data that have been taken from blasting is given in
Table 1. In addition,
Figure 8 shows the fragmentation mechanism in the blast of B7. In
Figure 8 (1)–(6) represents snapshot of the blast taken at 400 ms intervals. In this study, by keeping the blasting pattern constant, its effect on the vibration velocity measurements is minimized.
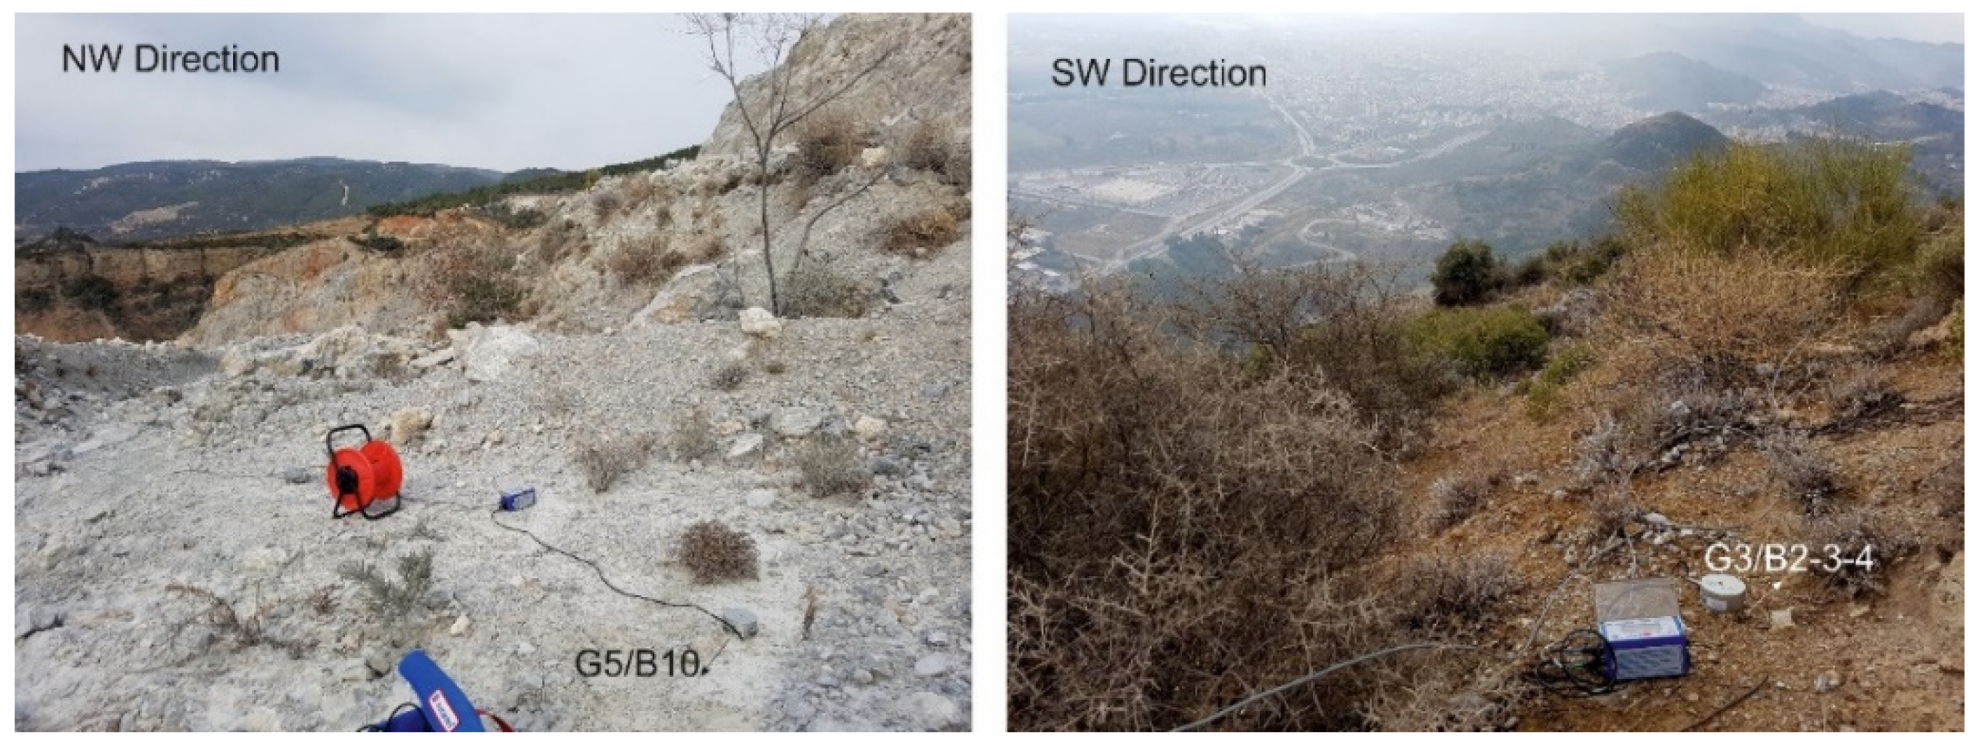
Scaled distances were calculated for two different (southwest and northwest) directions using the USBM equation based on the positions of the geophones and the amount of the explosives per delay (
Table 1). For this purpose, vibration monitoring is carried out with minimate blaster, minimate plus geophones and Blastware 8.12 software program manufactured by Instantel. All of the measurement stations (geophones) in the northwest direction are located behind the fault zone. For example, the pictures of the G3 geophone used for blast 2-3-4 in the SW direction and the G5 geophone used for blast 10 in the NW direction are given in
Figure 9.
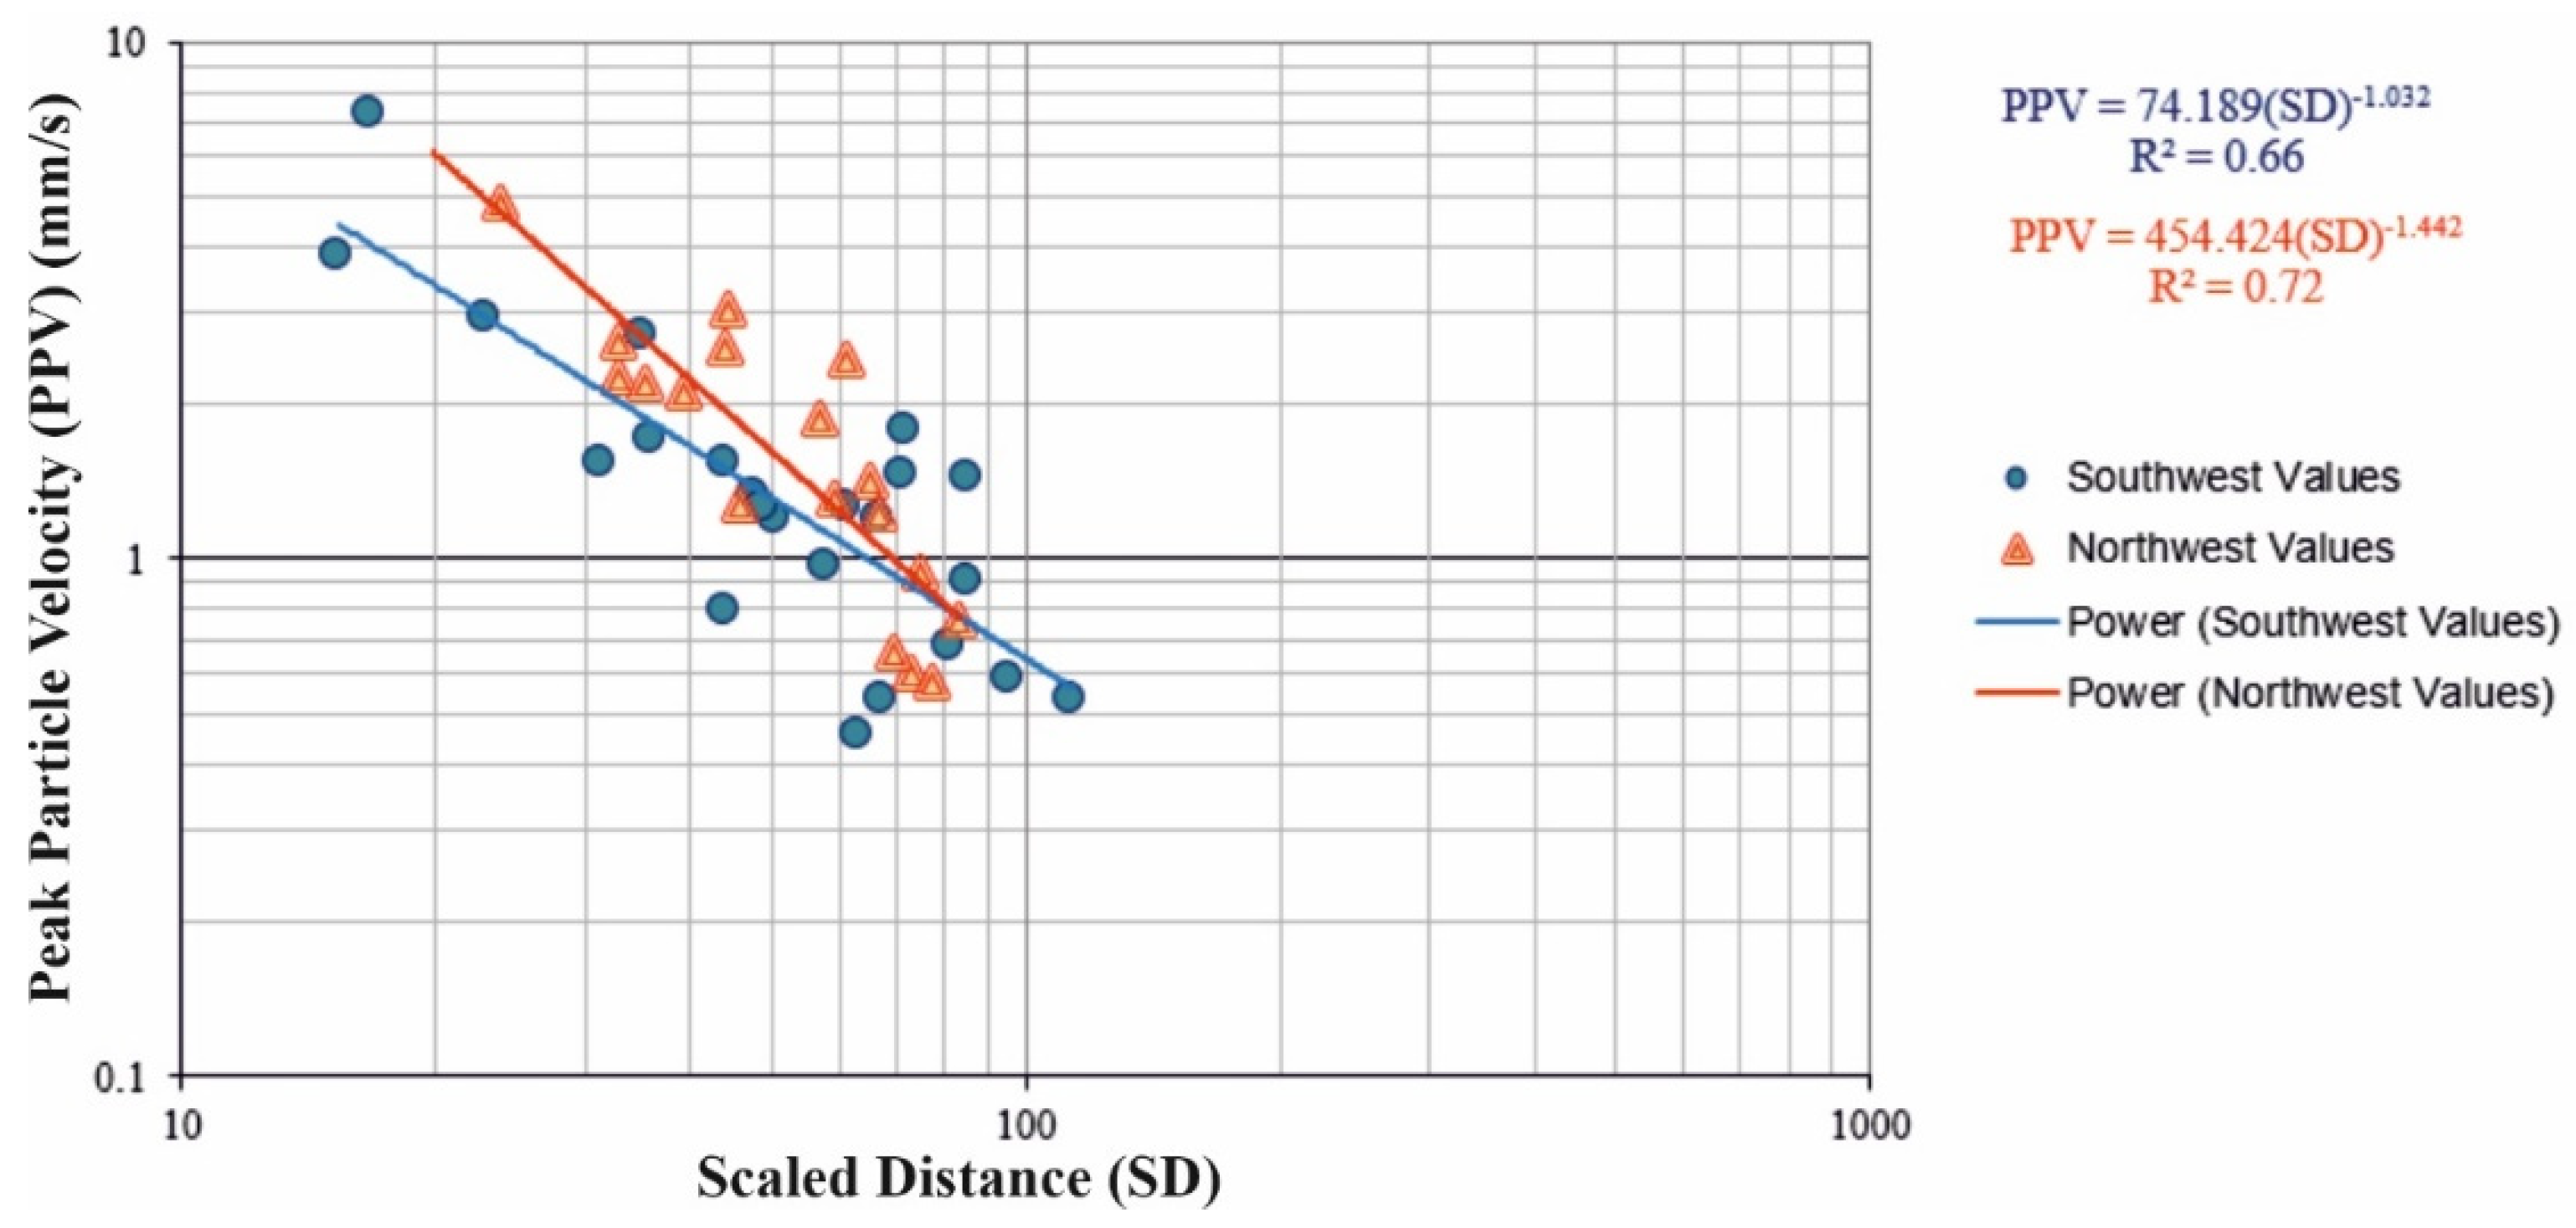
In this study, the directional change of the propagation of blast-induced vibration due to fault zone was examined, and the relationship of scaled distance-peak particle velocity has been determined for each direction. For each estimation model based on directions, the relationship of scaled distance-peak particle velocity is given in
Figure 10.
Blast vibration levels were predicted using the empirical estimation formula proposed by the United States Bureau of Mines (USBM) [
29]. The field parameters were obtained by regression analysis at 66% confidence level in the southwest direction and 72% confidence level in the northwest direction. Scaled distances based on the USBM estimation model, shown in
Table 2, are used to determine parameters K and β site constants. These parameters, although sometimes named differently in the literature, are known as the K, ground and damping parameters. The best regression models for scaled distance–peak particle velocity estimation can be obtained using exponential functions. In such cases, the K parameter can be obtained as a factor, as the β parameter is deduced as an exponential value. The β parameter can have negative or positive values depending on the relation between the scaled distance and peak particle velocity [
1]. In order to find K and β site constants, the graph between the recorded PPV values and SD were plotted in
Figure 10. While the correlation values for each direction from the USBM estimation models are relatively high, they are also similar. However, even though their damping parameters are relatively similar, their field parameters differ significantly (
Table 2).
4. Discussion of the Results Based on Directions
It may be stated that the analyzed rock mass presents a fairly uniform structure. This means the geology of the blasting sites is similar. The lithology of them is predominantly metamelange. However, regression analysis is undertaken using blast-induced vibration measurements according to two different directions. According to the location of the fault zone, two different directions were chosen for the study area. This factor adds uncertainties to blast vibration propagation. Vibration measurement stations located in the southwest are fallen behind the fault zone, which means there is not a fault zone between the blasting area and the geophone locations, while those in the northwest direction, the fault zone is between the blasting area and the geophone. The main purpose of the estimation models based on directions is to estimate the peak particle velocity value accurately before the blasting operation for ongoing production blasting, taking into account geological changes such as faults. On the basis of the PPV, SDs are often developed which make it possible to estimate the extent of damage to the excavation [
30]. When evaluating the relationship between the scaled distance and resultant particle velocity based on directions, field factors are estimated for each direction. In
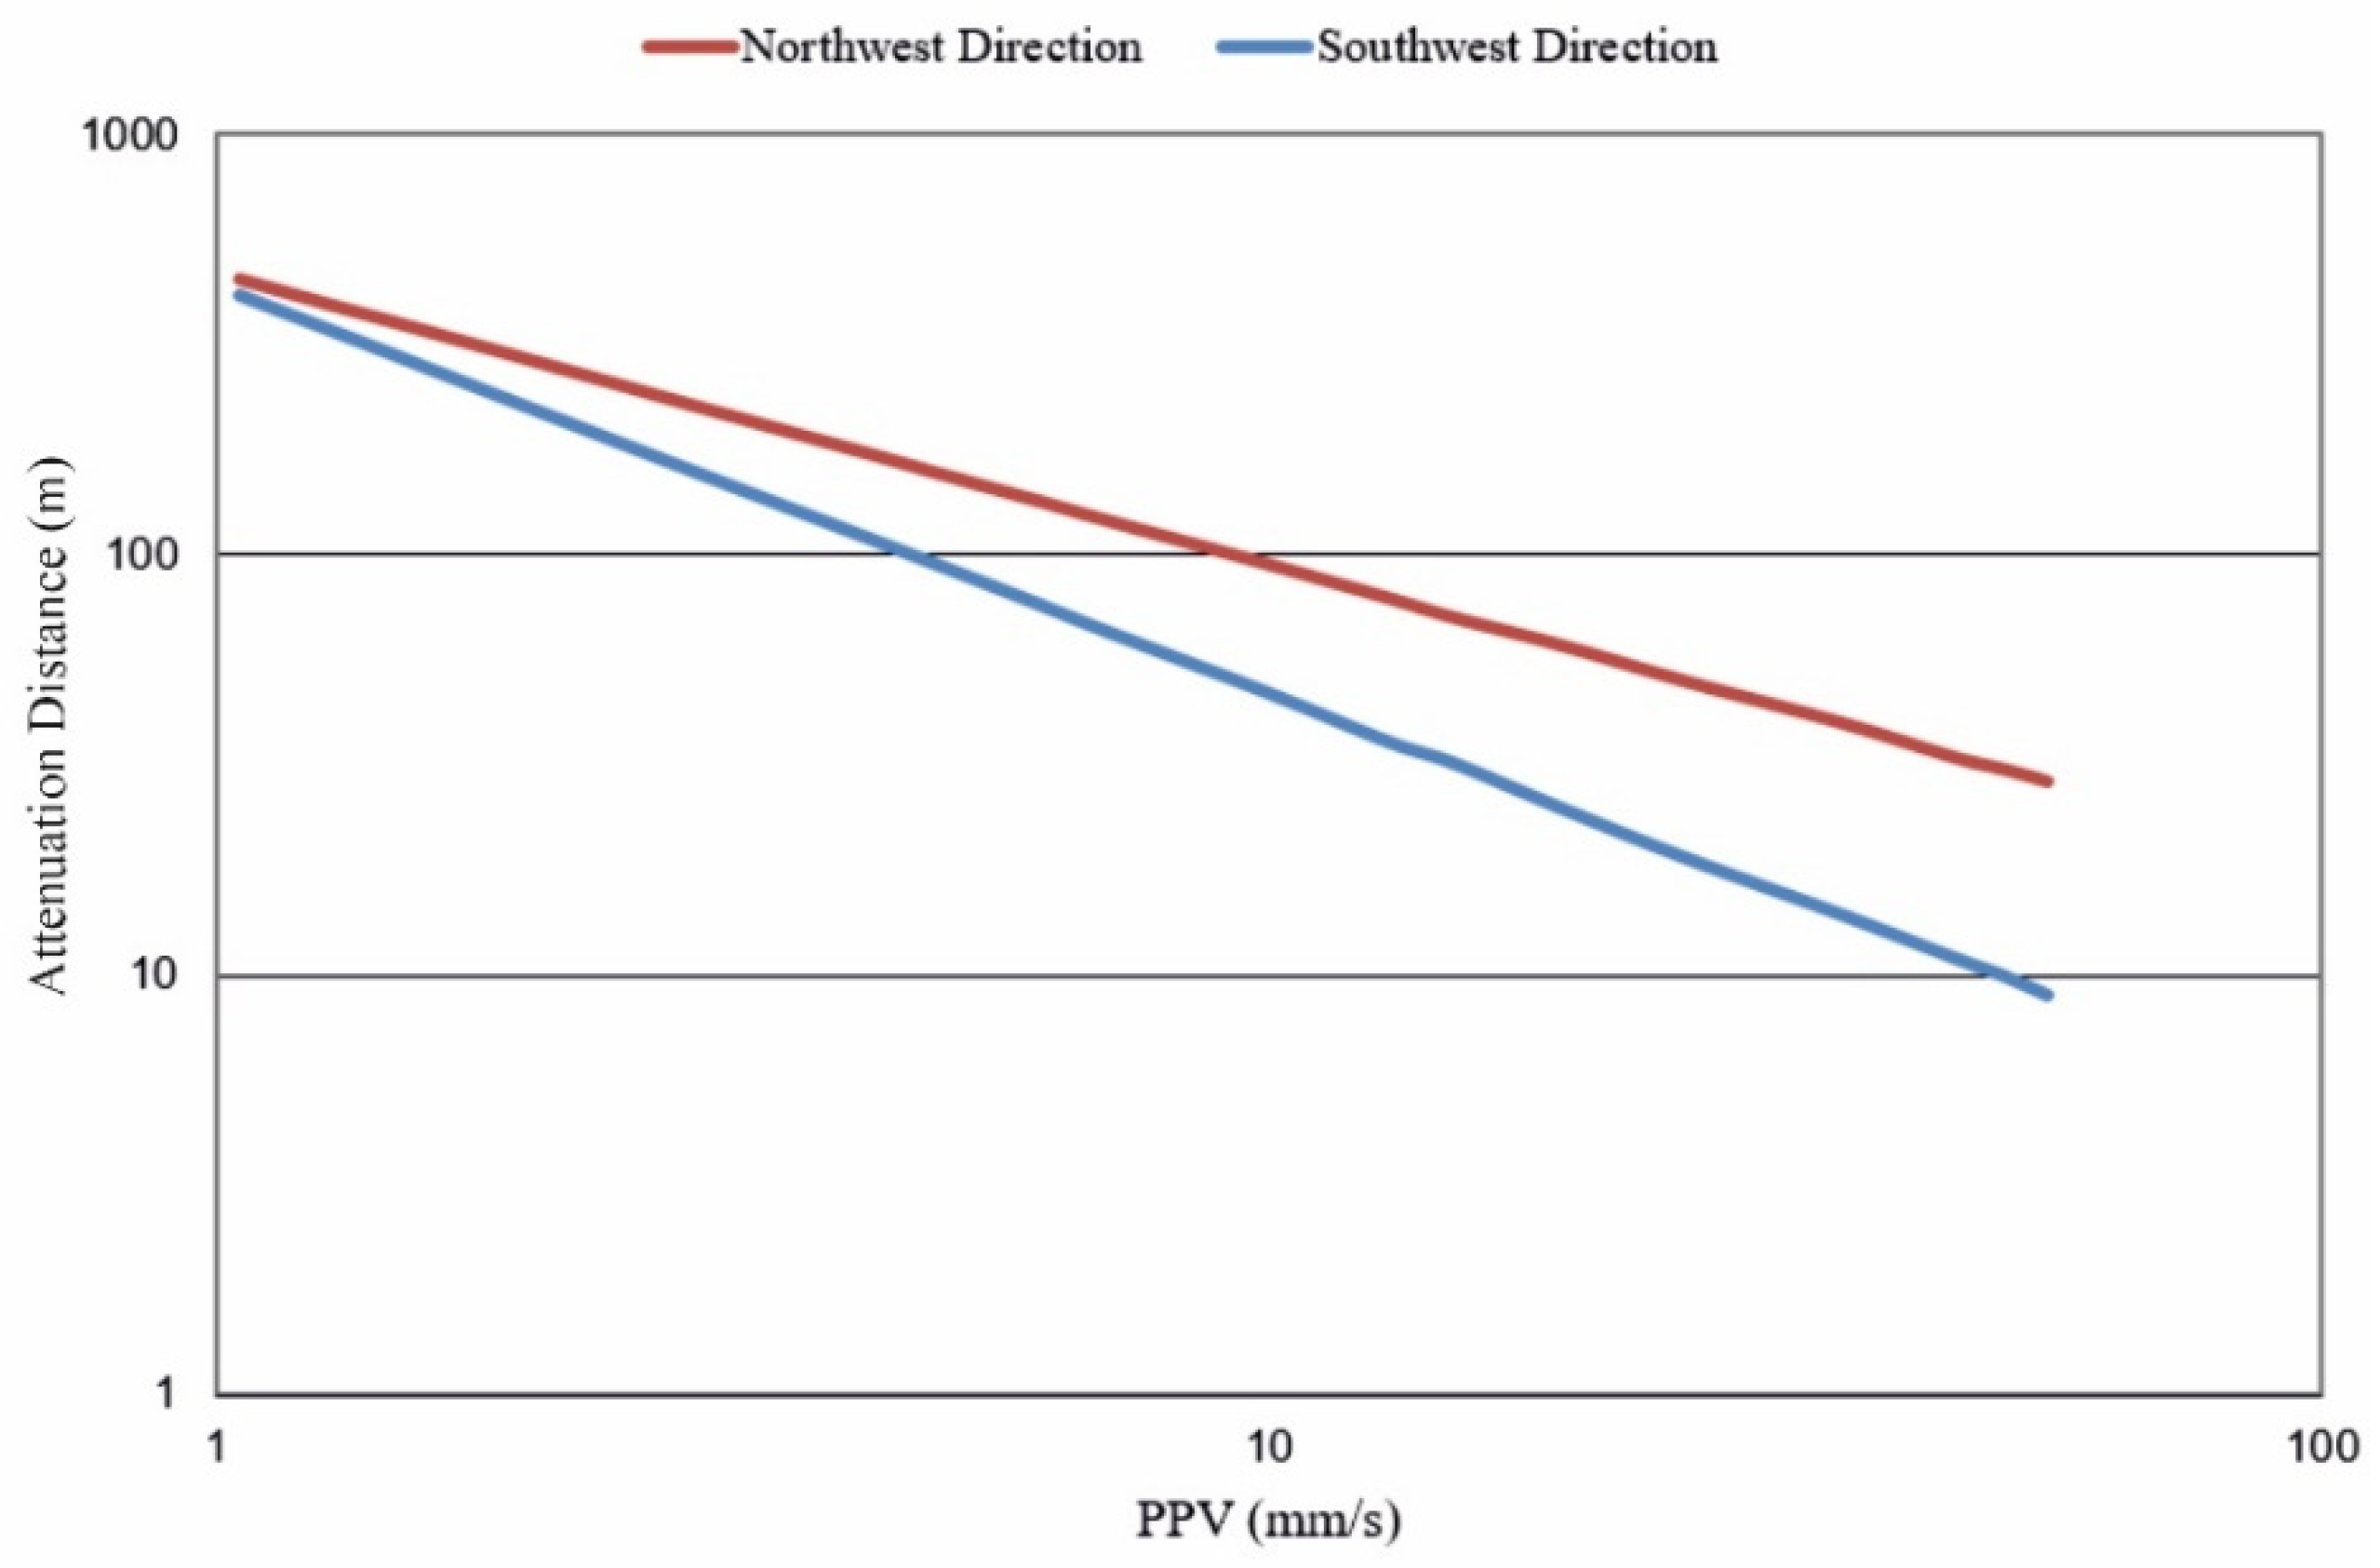
Figure 11, cross-validation graphs are indicated for two different direction approaches in this study. The cross-validation coefficient shown as blue is 0.66 for southwest direction. On the other hand, the coefficient of the northwest direction shown as red is 0.72. Comparing the two regression lines, these two models estimate blast-induced vibration levels with different accuracy. Even though their damping parameters (β) are relatively similar, their field parameters (K) differ significantly. This shows that although there is no change in the general geological units, there is a change in the prediction model coefficients depending on the location of the fault zone. That is, if the measurements are made in one direction by considering the structures that will be affected by blast vibration, the estimation model to be obtained will not reflect the truth for the structures in different directions of the field. Geology and faulting of the area should be revealed by detailed research. According to the models of these two directions, the propagation distances of the blast-induced vibration will be different for the same number of explosives per delay. The graph of changing propagation (attenuation) distances, when evaluated according to different vibration values, is given below (
Figure 11).
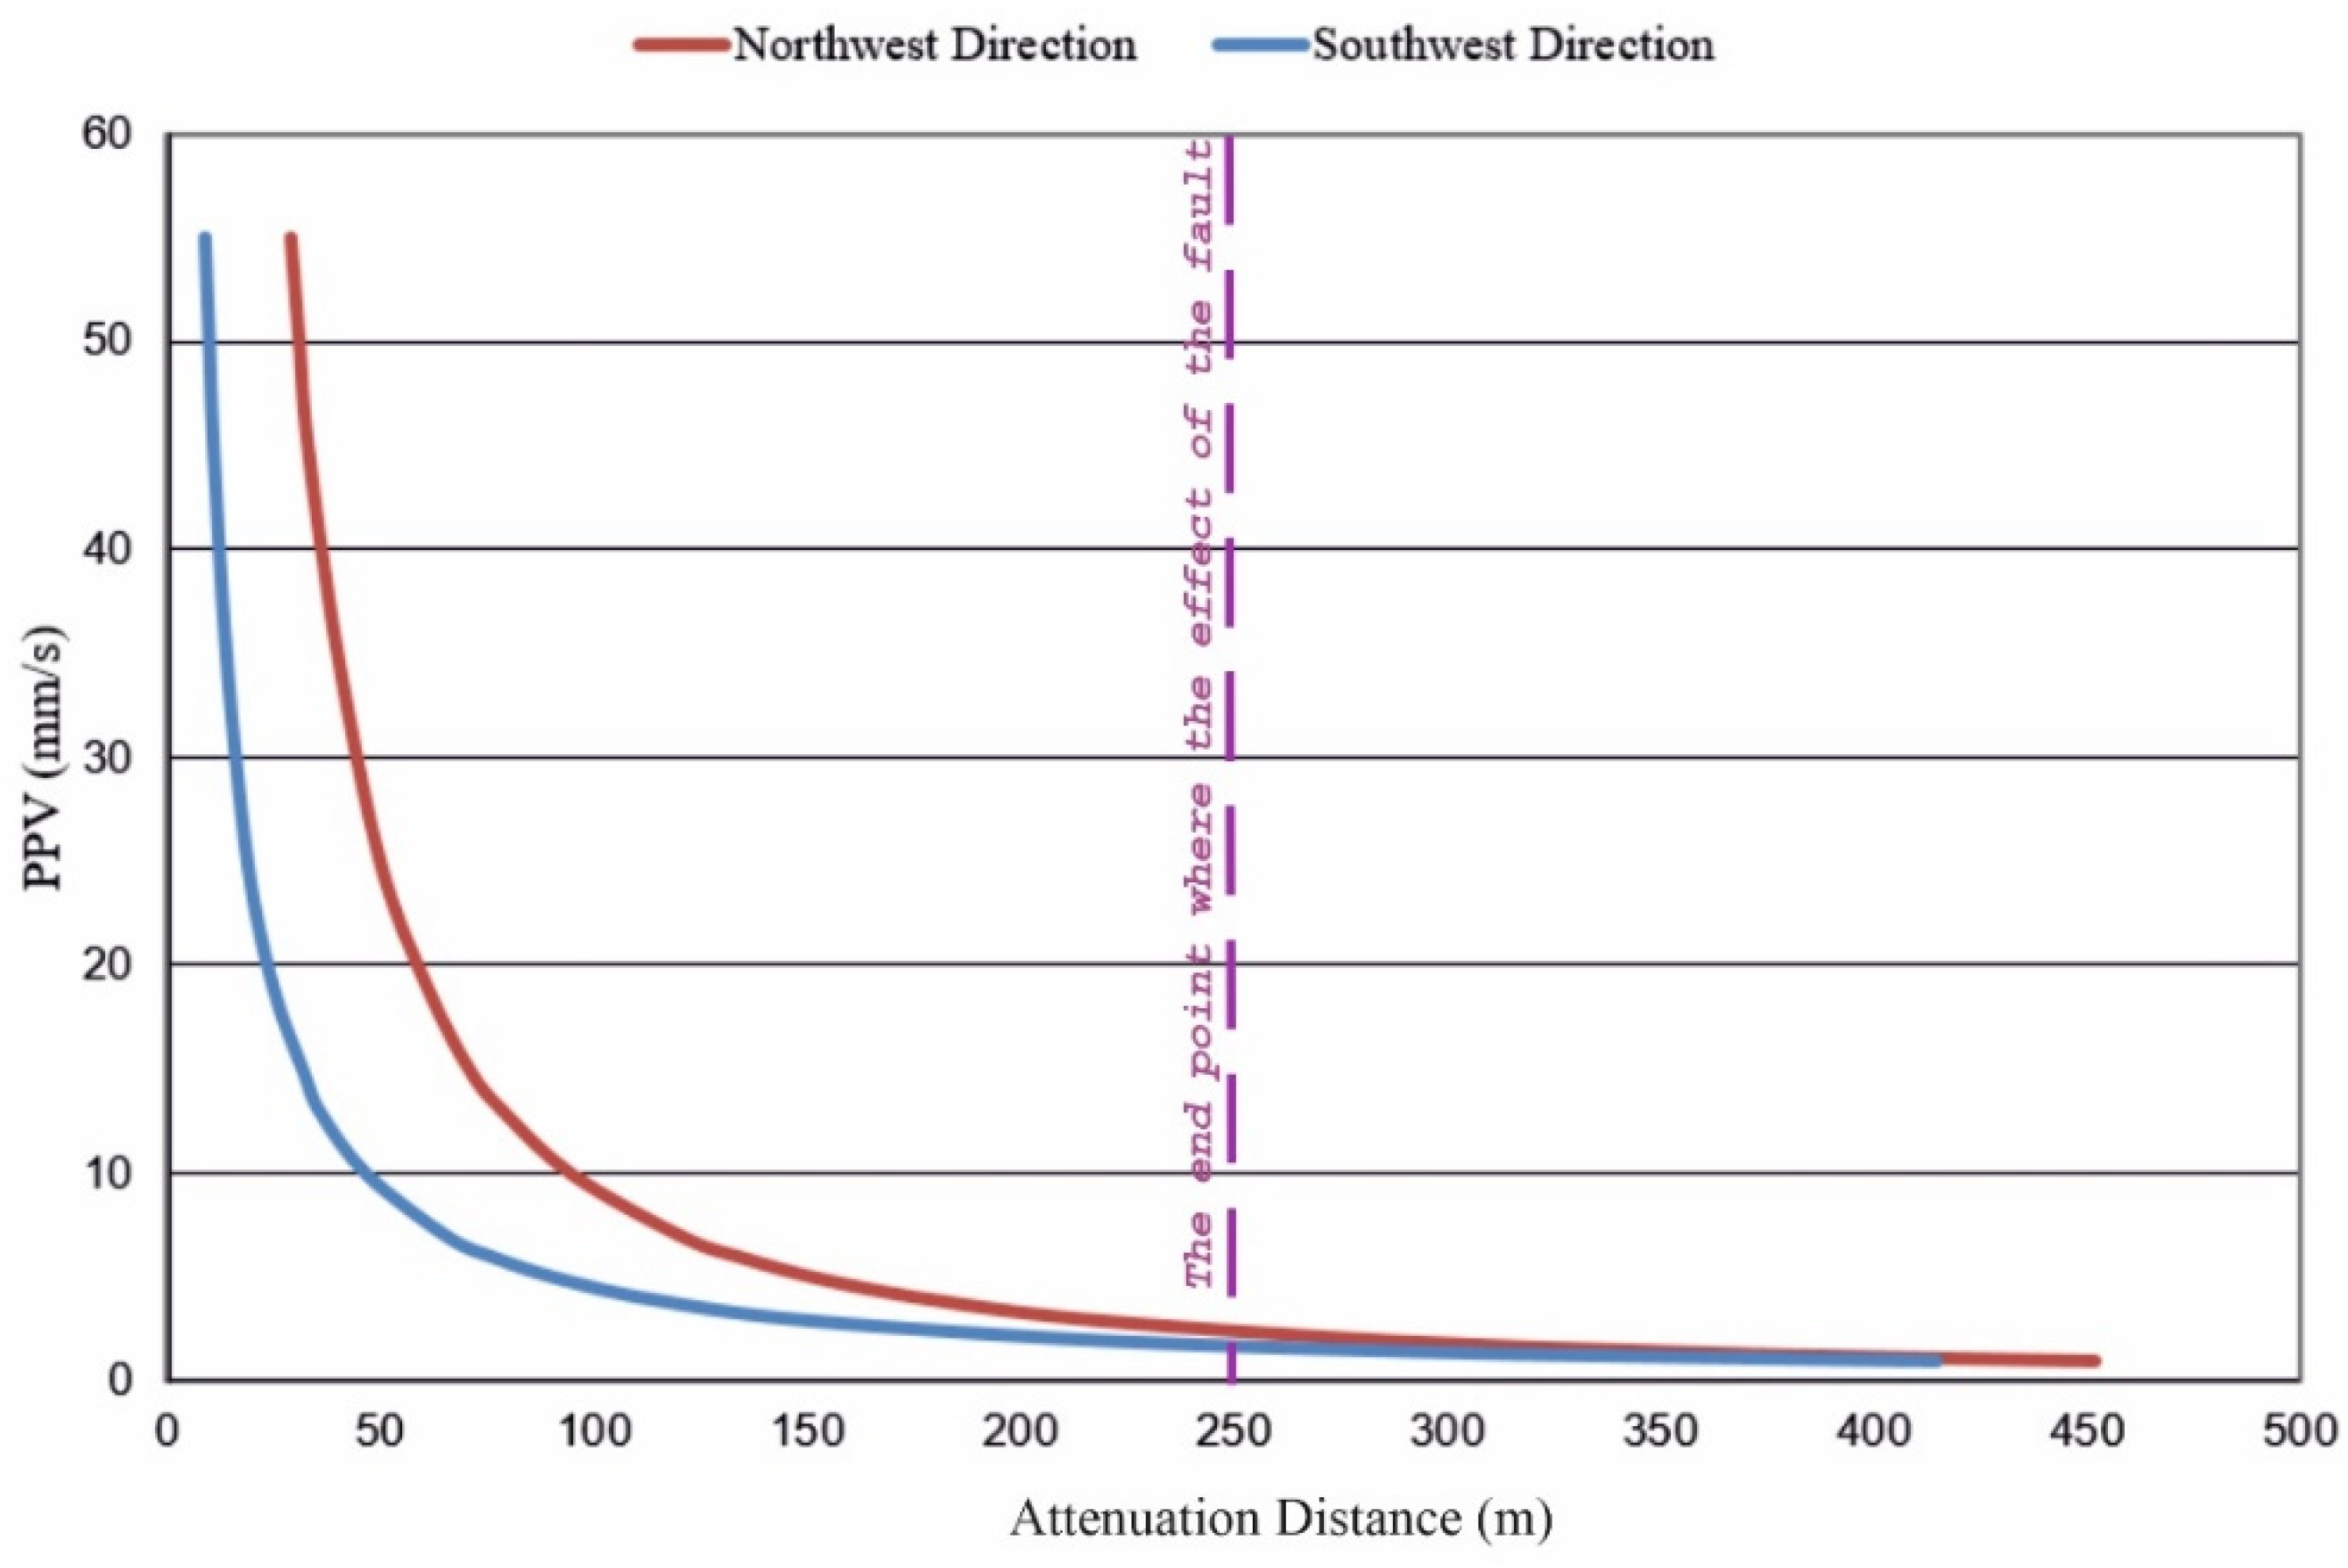
The ground vibration attenuation connected with the fault zone was studied, and it was found that the PPV of ground vibration was increased by 66% at 5 mm/s when it travels in the northwest direction. In
Figure 11, it is clearly seen that the estimated particle velocities produced by the northwest direction prediction model have different propagation distances compared to the southwest prediction model. Accordingly, the propagation (attenuation) distance of PPV between 3 and 7 mm/s is 1.5–2 times greater than the propagation distance in the southwest direction. At velocities between 7 and 25 mm/s, this difference increases 2–2.5 times. At velocities between 25 and 50 mm/s, the difference in propagation distances becomes 2.5–3 times. For the sake of clarity, the propagation distances for the limit values in USBM using both prediction equations are given in
Table 3.
In
Figure 11 and
Table 3, it can be seen that the variation of the propagation distance depends on the direction. The propagation distances of the blast vibration velocities change directionally. However, according to the location and characteristics of the discontinuities, these variation rates vary. It has been observed that the fault zone has a significant effect on the propagation of blast vibration up to a certain distance and has no effect after a certain distance in the field study. According to the field measurements, it is seen in
Figure 12 the Change graph, belonging to PPV values in the southwest part and PPV values that occurred with distance from the fault zone.
As seen in
Figure 12, in blastings carried out behind the fault zone (Northwest direction), depending on the vibration velocity, the propagation distance differs compared to the southwest region, which does not show any significant change in its geological structure. According to the data set obtained from the field, this difference is observed up to 250 m distance. After 250 m, the effect of the fault zone on the propagation of the vibration velocity disappears.


