
Laser Induced Breakdown Spectroscopy of Er II for Transition Probability Measurements


 , ,
, ,
Abstract
1. Introduction
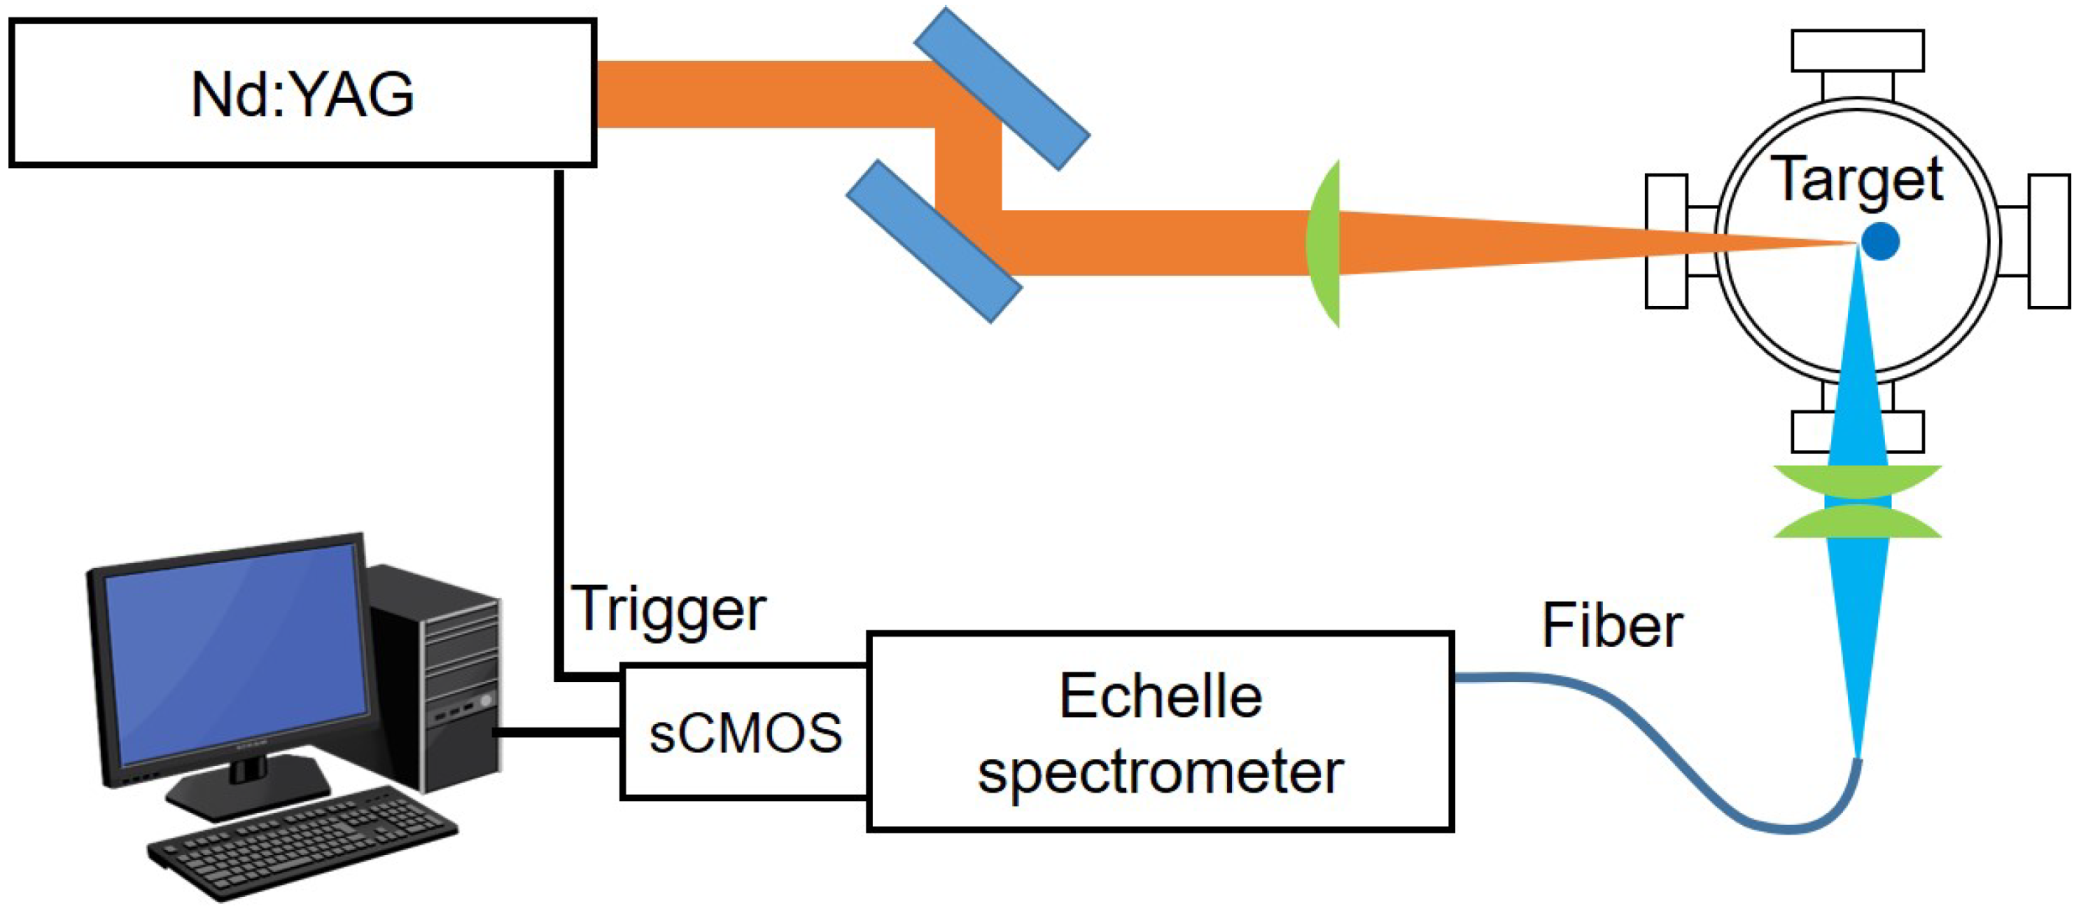
2. Experiment
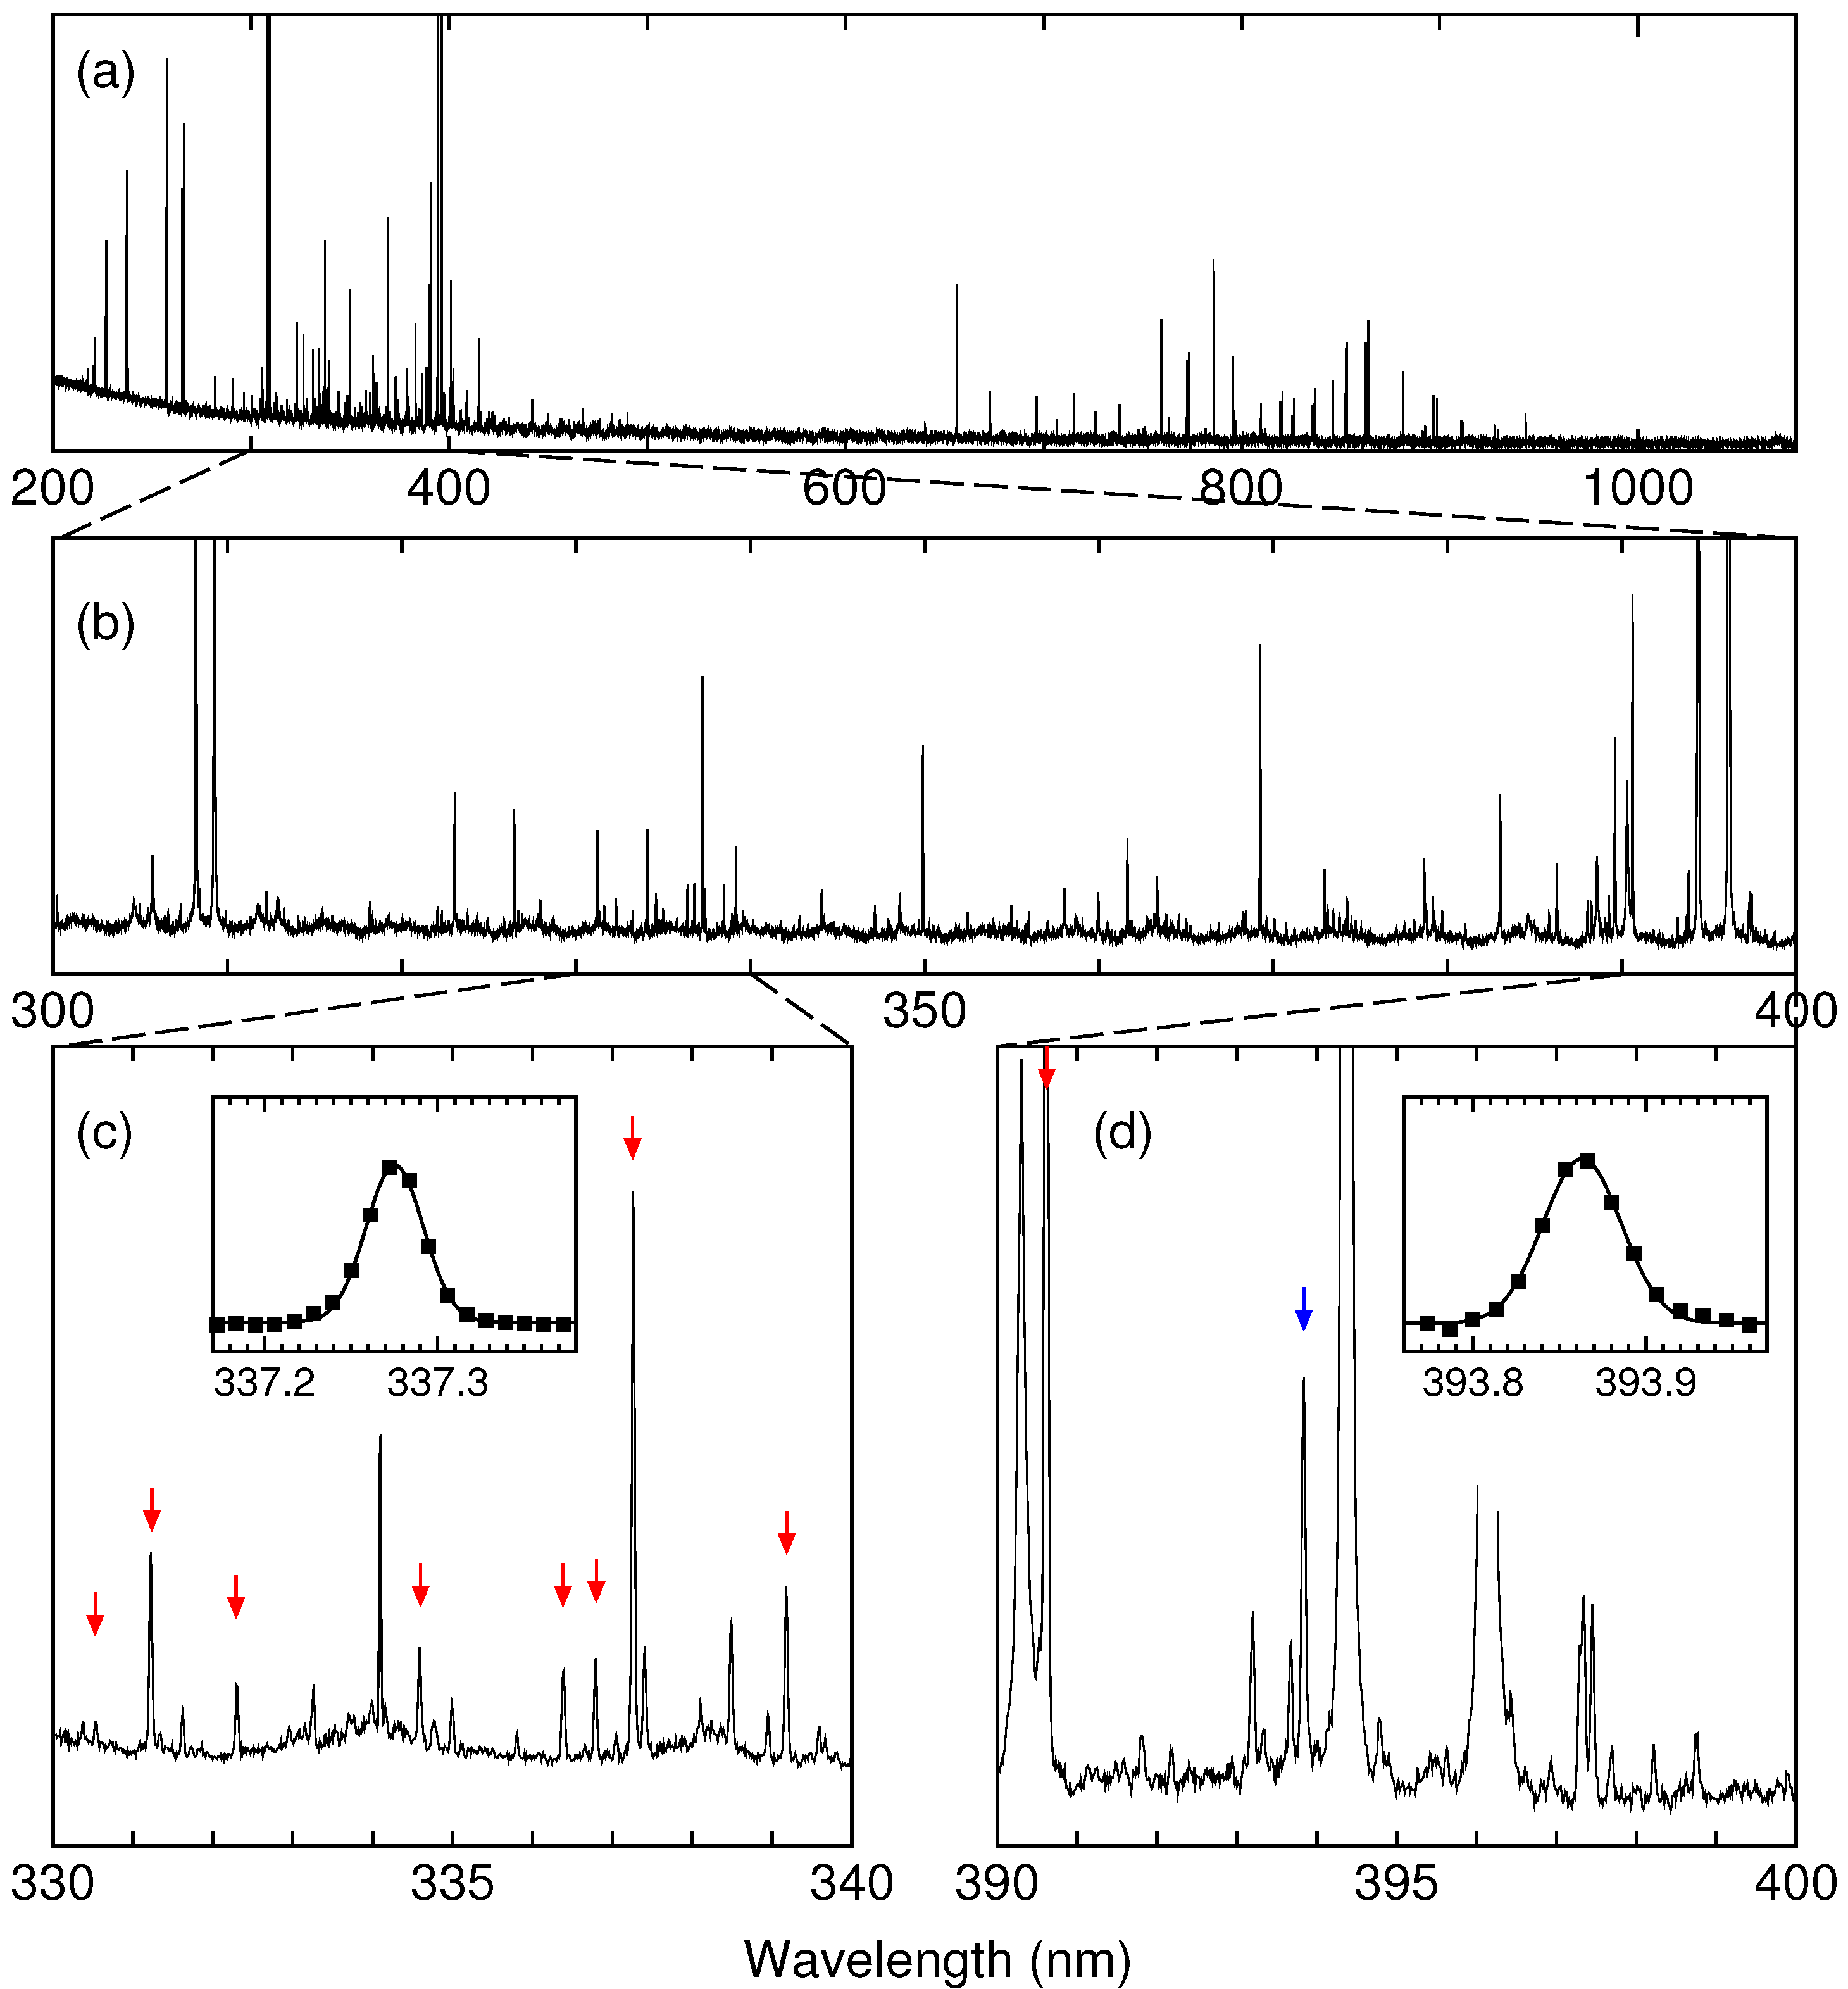
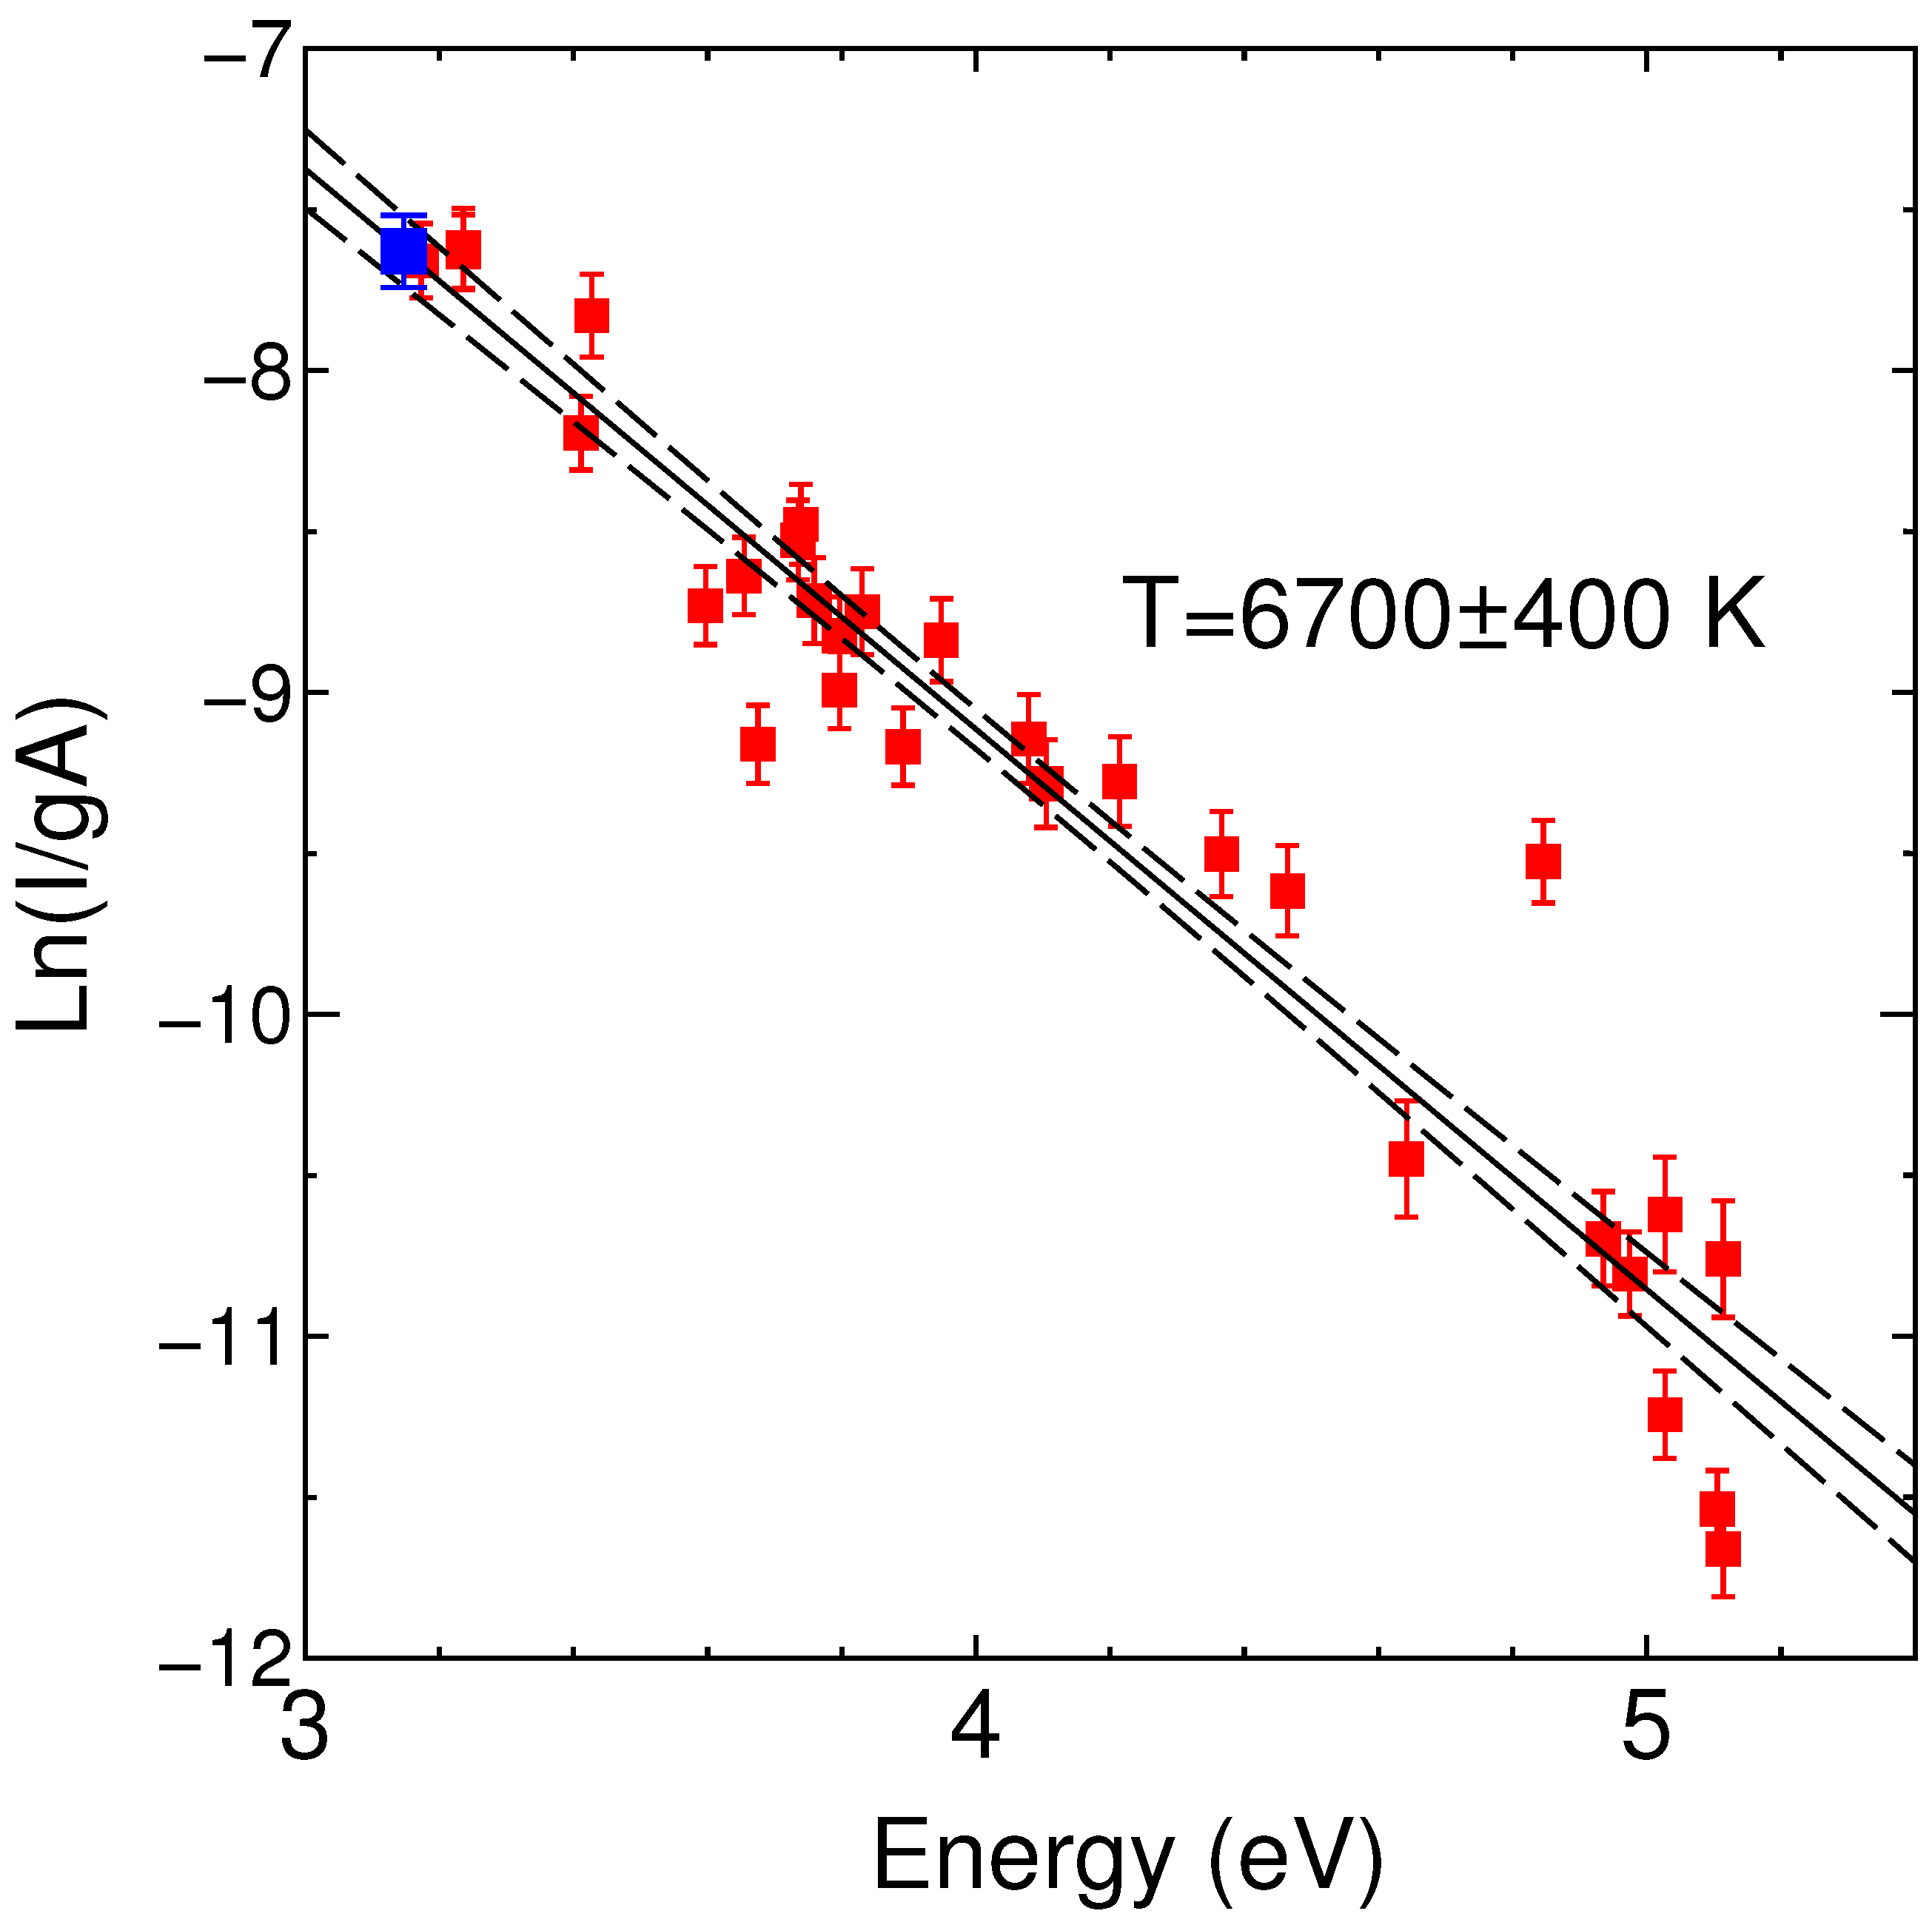
3. Results and Discussion
4. Summary
Author Contributions
Funding
Institutional Review Board Statement
Informed Consent Statement
Data Availability Statement
Acknowledgments
Conflicts of Interest
Abbreviations
| LIBS | Laser induced breakdown spectroscopy |
| NIST | National Institute of Standards and Technology |
| LIF | Laser induced fluorescence |
| LTE | Local thermal equilibrium |
| CMOS | Complementary metal oxide semiconductor |
References
- Sneden, C.; Cowan, J.J.; Gallino, R. Neutron-Capture Elements in the Early Galaxy. Annu. Rev. Astron. Astrophys. 2008, 46, 241–288. [Google Scholar] [CrossRef]
- Cowan, J.J.; Sneden, C.; Lawler, J.E.; Aprahamian, A.; Wiescher, M.; Langanke, K.; Martínez-Pinedo, G.; Thielemann, F.K. Origin of the heaviest elements: The rapid neutron-capture process. Rev. Mod. Phys. 2021, 93, 015002. [Google Scholar] [CrossRef]
- Kasen, D.; Badnell, N.R.; Barnes, J. Opacities and Spectra of the R-Process Ejecta From Neutron Star Mergers. Astrophys. J. 2013, 774, 25. [Google Scholar] [CrossRef]
- Tanaka, M.; Kato, D.; Gaigalas, G.; Rynkun, P.; Radžiūtė, L.; Wanajo, S.; Sekiguchi, Y.; Nakamura, N.; Tanuma, H.; Murakami, I.; et al. Properties of Kilonovae from Dynamical and Post-merger Ejecta of Neutron Star Mergers. Astrophys. J. 2018, 852, 109. [Google Scholar] [CrossRef]
- Kramida, A.; Ralchenko, Y.; Reader, J.; NIST ASD Team. Tex.Howpublished: NIST Atomic Spectra Database (ver. 5.8), National Institute of Standards and Technology, Gaithersburg, MD. 2020. Available online: https://physics.nist.gov/asd (accessed on 14 June 2021).
- Meggers, W.F.; Corliss, C.H.; Scribner, B.F. Tables of Spectral-Line Intensities, Part I – Arranged by Elements; Number 145 in National Bureau of Standards Monograph; U.S. Government Printing Office: Washington, DC, USA, 1975.
- Musiol, K.; Labuz, S. Experimental Determination of the Transition Probabilities in Er II. Phys. Scr. 1983, 27, 422–424. [Google Scholar] [CrossRef]
- Bentzen, S.M.; Nielsen, U. Lifetime measurements in singly ionized erbium using fast-beam laser-modulation spectroscopy. J. Opt. Soc. Am. 1982, 72, 1210. [Google Scholar] [CrossRef]
- Xu, H.; Jiang, Z.; Zhang, Z.; Dai, Z.; Svanberg, S.; Quinet, P.; Bi mont, E. Radiative lifetime measurements in Er II by time-resolved laser spectroscopy. J. Phys. B At. Mol. Opt. Phys. 2003, 36, 1771–1781. [Google Scholar] [CrossRef]
- Lawler, J.E.; Sneden, C.; Cowan, J.J.; Wyart, J.F.; Ivans, I.I.; Sobeck, J.S.; Stockett, M.H.; Den Hartog, E.A. Improved Laboratory Transition Probabilities for Er II and Application to the Erbium Abundances of the Sun and Five r-Process-Rich, Metal-Poor Stars. Astrophys. J. Suppl. Ser. 2008, 178, 71–88. [Google Scholar] [CrossRef][Green Version]
- Stockett, M.H.; Den Hartog, E.A.; Lawler, J.E. Radiative lifetimes for 80 levels of singly ionized erbium. J. Phys. B At. Mol. Opt. Phys. 2007, 40, 4529–4536. [Google Scholar] [CrossRef]
- Yu, Q.; Wang, X.; Li, Q.; Li, Y.; Dai, Z. Experimental Radiative Lifetimes, Branching Fractions, and Oscillator Strengths of Some Levels in Er i and Er ii. Astrophys. J. Suppl. Ser. 2019, 240, 25. [Google Scholar] [CrossRef]
- Wyart, J.F.; Lawler, J.E. Theoretical interpretation and new energy levels in Er II. Phys. Scr. 2009, 79, 045301. [Google Scholar] [CrossRef]
- Cowan, R. The Theory of Atomic Structure and Spectra; Los Alamos Series in Basic and Applied Sciences; University of California Press: Berkeley/Los Angeles, CA, USA, 1981. [Google Scholar]
- Keraba Ankush, B. Experimental Verification of Theoretical Configuration Mixing in the Energy Levels of Er II Spectra via Isotope Shift Measurements Using a FTS. Am. J. Astron. Astrophys. 2017, 5, 10. [Google Scholar] [CrossRef]
- Pedarnig, J.D.; Trautner, S.; Grünberger, S.; Giannakaris, N.; Eschlböck-Fuchs, S.; Hofstadler, J. Review of Element Analysis of Industrial Materials by In-Line Laser—Induced Breakdown Spectroscopy (LIBS). Appl. Sci. 2021, 11, 9274. [Google Scholar] [CrossRef]
- Zhang, Y.; Zhang, T.; Li, H. Application of laser-induced breakdown spectroscopy (LIBS) in environmental monitoring. Spectrochim. Acta Part B At. Spectrosc. 2021, 181, 106218. [Google Scholar] [CrossRef]
- Gonçalves, D.A.; Senesi, G.S.; Nicolodelli, G. Laser-Induced Breakdown Spectroscopy applied to environmental systems and their potential contaminants. An overview of advances achieved in the last few years. Trends Environ. Anal. Chem. 2021, 30, e00121. [Google Scholar] [CrossRef]
- Fabre, C. Advances in Laser-Induced Breakdown Spectroscopy analysis for geology: A critical review. Spectrochim. Acta Part B At. Spectrosc. 2020, 166, 105799. [Google Scholar] [CrossRef]
- Wiens, R.C.; Maurice, S.; Robinson, S.H.; Nelson, A.E.; Cais, P.; Bernardi, P.; Newell, R.T.; Clegg, S.; Sharma, S.K.; Storms, S.; et al. The SuperCam Instrument Suite on the NASA Mars 2020 Rover: Body Unit and Combined System Tests. Space Sci. Rev. 2021, 217, 4. [Google Scholar] [CrossRef] [PubMed]
- Messaoud Aberkane, S.; Safi, A.; Botto, A.; Campanella, B.; Legnaioli, S.; Poggialini, F.; Raneri, S.; Rezaei, F.; Palleschi, V. Laser-Induced Breakdown Spectroscopy for Determination of Spectral Fundamental Parameters. Appl. Sci. 2020, 10, 4973. [Google Scholar] [CrossRef]
- Putnam, R. Recent Advances in the Measurement of Rare-Earth Metal Transition Probabilities Using Laser-Induced Plasmas. Ph.D. thesis, University of Windsor, Windsor, ON, Canada, 2014. [Google Scholar]
- Di Rocco, H.; Iriarte, D.; Pomarico, J. Lifetimes and transition probabilities of Xe II: Experimental measurements and theoretical calculations. Eur. Phys. J. D 2000, 10, 19–26. [Google Scholar] [CrossRef]
- Mayo, R.; Ortiz, M.; Parente, F.; Santos, J.P. Experimental and theoretical transition probabilities for lines arising from the 6p configurations of Au II. J. Phys. B At. Mol. Opt. Phys. 2007, 40, 4651–4660. [Google Scholar] [CrossRef]


| Lower | Upper | A | ||||||
|---|---|---|---|---|---|---|---|---|
| (nm) | Parity | 2J | E (eV) | Parity | 2J | E (eV) | ( s) | I |
| 290.447 | odd | 15 | 0.846164 | even | 17 | 5.113654 | 93 ± 5 | 0.05 (1) |
| 291.036 | odd | 15 | 0.846164 | even | 15 | 5.105013 | 204 ± 11 | 0.12 (1) |
| 296.452 | odd | 15 | 0.846164 | even | 17 | 5.027212 | 159 ± 8 | 0.14 (2) |
| 300.241 | odd | 15 | 0.846164 | even | 13 | 4.974455 | 130 ± 7 | 0.14 (2) |
| 323.058 | even | 11 | 0.054607 | odd | 11 | 3.891327 | 92 ± 5 | 0.42 (5) |
| 323.798 | even | 9 | 0.636362 | odd | 9 | 4.464322 | 19.1 ± 1 | 0.05 (1) |
| 326.478 | even | 13 | 0.000000 | odd | 13 | 3.796533 | 69 ± 3 | 0.44 (5) |
| 330.557 | even | 9 | 0.892110 | odd | 9 | 4.641802 | 32.1 ± 1.7 | 0.03 (1) |
| 331.243 | even | 11 | 0.054607 | odd | 13 | 3.796533 | 40.9 ± 2.1 | 0.31 (3) |
| 332.319 | even | 9 | 0.636362 | odd | 11 | 4.366164 | 34.3 ± 1.9 | 0.11 (1) |
| 334.603 | even | 11 | 0.054607 | odd | 9 | 3.758950 | 25.6 ± 1.3 | 0.15 (2) |
| 336.408 | even | 11 | 0.054607 | odd | 11 | 3.739083 | 18.5 ± 0.9 | 0.17 (2) |
| 336.802 | even | 11 | 0.054607 | odd | 11 | 3.734768 | 18.8 ± 0.9 | 0.16 (2) |
| 337.275 | even | 13 | 0.000000 | odd | 15 | 3.674999 | 145 ± 7 | 0.89 (10) |
| 339.199 | even | 13 | 0.000000 | odd | 15 | 3.654160 | 28.3 ± 1.4 | 0.29 (3) |
| 349.910 | even | 11 | 0.054607 | odd | 9 | 3.596907 | 105 ± 5 | 0.62 (7) |
| 359.950 | odd | 15 | 1.402160 | even | 13 | 4.845660 | 52.2 ± 2.7 | 0.20 (2) |
| 360.490 | odd | 19 | 1.588866 | even | 17 | 5.027212 | 42 ± 3 | 0.07 (1) |
| 361.657 | even | 13 | 0.000000 | odd | 11 | 3.427253 | 21 ± 1.1 | 0.37 (4) |
| 369.265 | even | 11 | 0.054607 | odd | 13 | 3.411246 | 67 ± 3 | 0.95 (10) |
| 370.764 | odd | 15 | 1.770584 | even | 17 | 5.113654 | 46 ± 4 | 0.06 (1) |
| 373.127 | even | 9 | 0.892110 | odd | 11 | 4.214012 | 19.5 ± 1 | 0.08 (1) |
| 373.816 | odd | 13 | 1.619322 | even | 15 | 4.935095 | 46.8 ± 2.5 | 0.06 (1) |
| 374.264 | even | 9 | 0.636362 | odd | 9 | 3.948168 | 20.6 ± 1.1 | 0.11 (1) |
| 383.048 | even | 13 | 0.000000 | odd | 13 | 3.235860 | 19.4 ± 1 | 0.49 (6) |
| 385.839 | even | 9 | 0.892110 | odd | 11 | 4.104563 | 18.5 ± 0.9 | 0.08 (1) |
| 388.061 | even | 9 | 0.636362 | odd | 7 | 3.830423 | 31.3 ± 1.6 | 0.15 (2) |
| 388.289 | even | 11 | 0.886441 | odd | 9 | 4.078630 | 31.6 ± 1.6 | 0.12 (2) |
| 389.623 | even | 11 | 0.054607 | odd | 13 | 3.235860 | 23.9 ± 1.2 | 0.59 (6) |
| 390.631 | even | 13 | 0.000000 | odd | 11 | 3.173046 | 48.2 ± 2.4 | 1.00 (10) |
| 393.863 | even | 13 | 0.000000 | odd | 11 | 3.147014 | 12 ± 2 | 0.26 (3) |
Publisher’s Note: MDPI stays neutral with regard to jurisdictional claims in published maps and institutional affiliations. |
© 2022 by the authors. Licensee MDPI, Basel, Switzerland. This article is an open access article distributed under the terms and conditions of the Creative Commons Attribution (CC BY) license (https://creativecommons.org/licenses/by/4.0/).
Share and Cite
Naoi, Y.; Iwata, M.; Yokota, D.; Gaigalas, G.; Kato, D.; Murakami, I.; Sakaue, H.A.; Sekiguchi, Y.; Tanaka, M.; Tanuma, H.; et al. Laser Induced Breakdown Spectroscopy of Er II for Transition Probability Measurements. Appl. Sci. 2022, 12, 2219. https://doi.org/10.3390/app12042219
Naoi Y, Iwata M, Yokota D, Gaigalas G, Kato D, Murakami I, Sakaue HA, Sekiguchi Y, Tanaka M, Tanuma H, et al. Laser Induced Breakdown Spectroscopy of Er II for Transition Probability Measurements. Applied Sciences. 2022; 12(4):2219. https://doi.org/10.3390/app12042219
Chicago/Turabian StyleNaoi, Yuki, Masayuki Iwata, Daichi Yokota, Gediminas Gaigalas, Daiji Kato, Izumi Murakami, Hiroyuki A. Sakaue, Yuichiro Sekiguchi, Masaomi Tanaka, Hajime Tanuma, and et al. 2022. "Laser Induced Breakdown Spectroscopy of Er II for Transition Probability Measurements" Applied Sciences 12, no. 4: 2219. https://doi.org/10.3390/app12042219
APA StyleNaoi, Y., Iwata, M., Yokota, D., Gaigalas, G., Kato, D., Murakami, I., Sakaue, H. A., Sekiguchi, Y., Tanaka, M., Tanuma, H., Wanajo, S., & Nakamura, N. (2022). Laser Induced Breakdown Spectroscopy of Er II for Transition Probability Measurements. Applied Sciences, 12(4), 2219. https://doi.org/10.3390/app12042219