Article

Analysis, Simulations, and Experiments for Far-Field Fourier Ptychography Imaging Using Active Coherent Synthetic-Aperture

1
Space Optical Technology Research Department, Xi’an Institute of Optics and Precision Mechanics, Chinese Academy of Sciences, 17 Xinxi Road, Xi’an 710119, China
2
School of Optoelectronics, University of Chinese Academy of Sciences, Beijing 100049, China
*
Author to whom correspondence should be addressed.
Appl. Sci. 2022, 12(4), 2197; https://doi.org/10.3390/app12042197
Submission received: 13 January 2022 / Revised: 3 February 2022 / Accepted: 17 February 2022 / Published: 20 February 2022

Abstract

:

Featured Application

The technology in the study has great prospects in remote sensing imaging. It was able to reconstruct the high-resolution intensity image and the phase information and realize the effect of synthetic aperture of one small aperture scan by using the low-resolution intensity images and improve the robustness of the system, as well as overcoming the difficulty of confocal and co-phase between multiple sub-apertures.

Abstract

Fourier ptychography (FP) is a powerful phase retrieval method that can be used to reconstruct missing high-frequency details and high-space-bandwidth products in microscopy. In this study, we further advanced the application of FP in microscopic imaging to the field of macroscopic far-field imaging, incorporating camera scanning for spatial resolution improvement. First, on the basis of the Fraunhofer diffraction mechanism and the transmission imaging model, we found the analysis of the associated theoretical fundamentals via simulations and experiments to be crucially relevant to the far-field of FP imaging. Second, we built an experimental device with long-distance imaging and experimentally demonstrated the relationship between the spectrum overlap ratio and the reconstructed high-resolution image. The simulation and experimental results showed that an overlap ratio higher than 50% had a good reconstruction effect. Third, camera scanning was used to obtain low-resolution intensity images in this study, for which the scanning range was wide and spherical wave illumination was satisfied, and therefore different positions corresponded to different aberrations of low-resolution intensity images, and even different positions of the same image had aberration differences, leading to inconsistencies in the aberrations of different images. Therefore, in the reconstruction process, we further overcame the effect of the inconsistency of aberrations of different images using the partition reconstruction method, which involves cutting the image into smaller parts for reconstruction. Finally, with the proposed partition reconstruction algorithm, we were able to resolve 40 μm line width of GBA1 resolution object and obtain a spatial resolution gain of 4× with a working distance of 2 m.

1. Introduction

Fourier ptychography (FP) has emerged as a powerful tool to improve spatial resolution in microscopy [1,2]. Zheng et al. first proposed the Fourier ptychography microscopy (FPM) imaging technique and successfully built a microscopy setup [1]. In FPM, using light-emitting diodes (LEDs) to illuminate the object at different angles, we can obtain a series of low-resolution (LR) intensity images in the image plane and synthesize them together [1,2,3,4]. FP iteratively transforms the LR images in the spatial and frequency domains and minimizes the difference between the measured and calculated images [3,4,5,6,7]. Thus, the high-resolution (HR) intensity image and corresponding phase information can be recovered with the synthesized aperture.
In addition, in the Fourier plane, camera scanning is also a commonly used method that can effectively scan different portions of the space with the shifting pupil function [3]. Therefore, Dong et al. acquired multiple intensity images of the sample by applying a scanning aperture at the Fourier plane to recover the HR complex field [3]. FP not only eliminates the limitation of the thin sample but also accomplishes three-dimensional (3D) holographic refocusing [3]. Later, Ou et al. constructed an aperture-scanning FPM setup using a spatial light modulator located at the back focal length of the objective lens [4]. Combined with the principle of compressive sensing, this FPM structure can use the recovered 2D complex scattered light field to reconstruct the 3D sample complex scattered field, which is applicable in both transmissive and reflective models [4].
All these previous studies provide examples of FP imaging in macroscopy. To extend the technique to long-range imaging, Holloway et al., on the basis of the transmissive imaging model, used a camera array system to achieve a 4–7× resolution of the actual object at a working distance of 1.5 m [5]. Subsequently, they formally researched long-range synthetic apertures for visible imaging (SAVI) using FP [6]. They built a macroscopic FP reflection-imaging optical setup with coherent illumination. The object was placed 1 m away from the camera, which was installed on a two-dimensional XY translation stage. Their experimental results showed resolution gains of 6× in the long-range imaging optical resolution of various diffuse reflective objects.
In the above two microscopy imaging schemes of the 4f system with aperture scanning [3,4], the resolution is limited by the aperture scanning range. However, in order to obtain dark-field images with high signal-to-noise ratio (SNR), the specific scanning aperture (≥0.5 NA) is required. When the scanning aperture size is less than N A / 2 , the zero-frequency information may be lost during aperture scanning, which reduces and even eliminates the signal-to-noise (SNR) ratio of dark field images. Therefore, the aperture size should be greater than or equal to N A / 2 [7]. To overcome this limitation, we placed the object behind the focusing lens while using the experimental scheme of Holloway et al. for reference in far-field applications. Therefore, the spectrum information of the object is not limited by the aperture size during the camera scanning process, which can achieve super-diffraction resolution imaging.
FP overcomes the resolution and field of view trade-off exhibited by traditional imaging systems [1,2,3,4,5,6,7]. Thus, the development of an optical system along with a thorough analysis of the associated theoretical fundamentals via simulations and experiments is crucially relevant for the advancement of the field of FP imaging [6,8]. Additionally, improving the working distance to 2 m and reporting the 4× spatial resolution improvement certainly are tangible examples of the contribution made by this study. First, the far-field imaging process of the system is derived on the basis of the Fraunhofer diffraction mechanism and the transmissive imaging model. Second, a transmissive imaging experimental setup is built to verify the reconstruction effect under different overlap ratios, and a partition reconstruction algorithm is used for HR complex field recovery to overcome the influence of system aberrations more effectively [9,10,11]. In this study, by introducing an imaging lens before the sample, we can place the Fourier transform plane at the imaging lens (and hence at the pupil function of the system). Therefore, scanning the camera + imaging lens has a clearly defined effect of shifting the point spread function (PSF). This is in contrast to previous work, which affected the PSF less dramatically for each scan position.
We first analyzed the imaging process of the optical system using Fresnel diffraction theory to help us understand the macroscopic FP imaging process more effectively. Second, we showed that our prototype setup can bypass the diffraction limit of a conventional photographic lens and achieve HR in the far field. Third, we demonstrated the resolution gains using two real captured experimental datasets with different scanning steps and further explored the potential to achieve remote sensing imaging. Finally, we summarized the results, discussed the limitations of our work, and presented future research avenues.
In this study, we demonstrate a transmissive far-field FP imaging system using camera scanning, which uses a small aperture to synthesize a large aperture and an equivalent aperture expansion to improve the spatial resolution of the system. We show that for far-field applications, FP can overcome the limitation of aperture size in passive imaging systems, as well as the requirement of confocal and co-phase sparse aperture in active imaging.

2. Analysis of the Macroscopic FP Principle

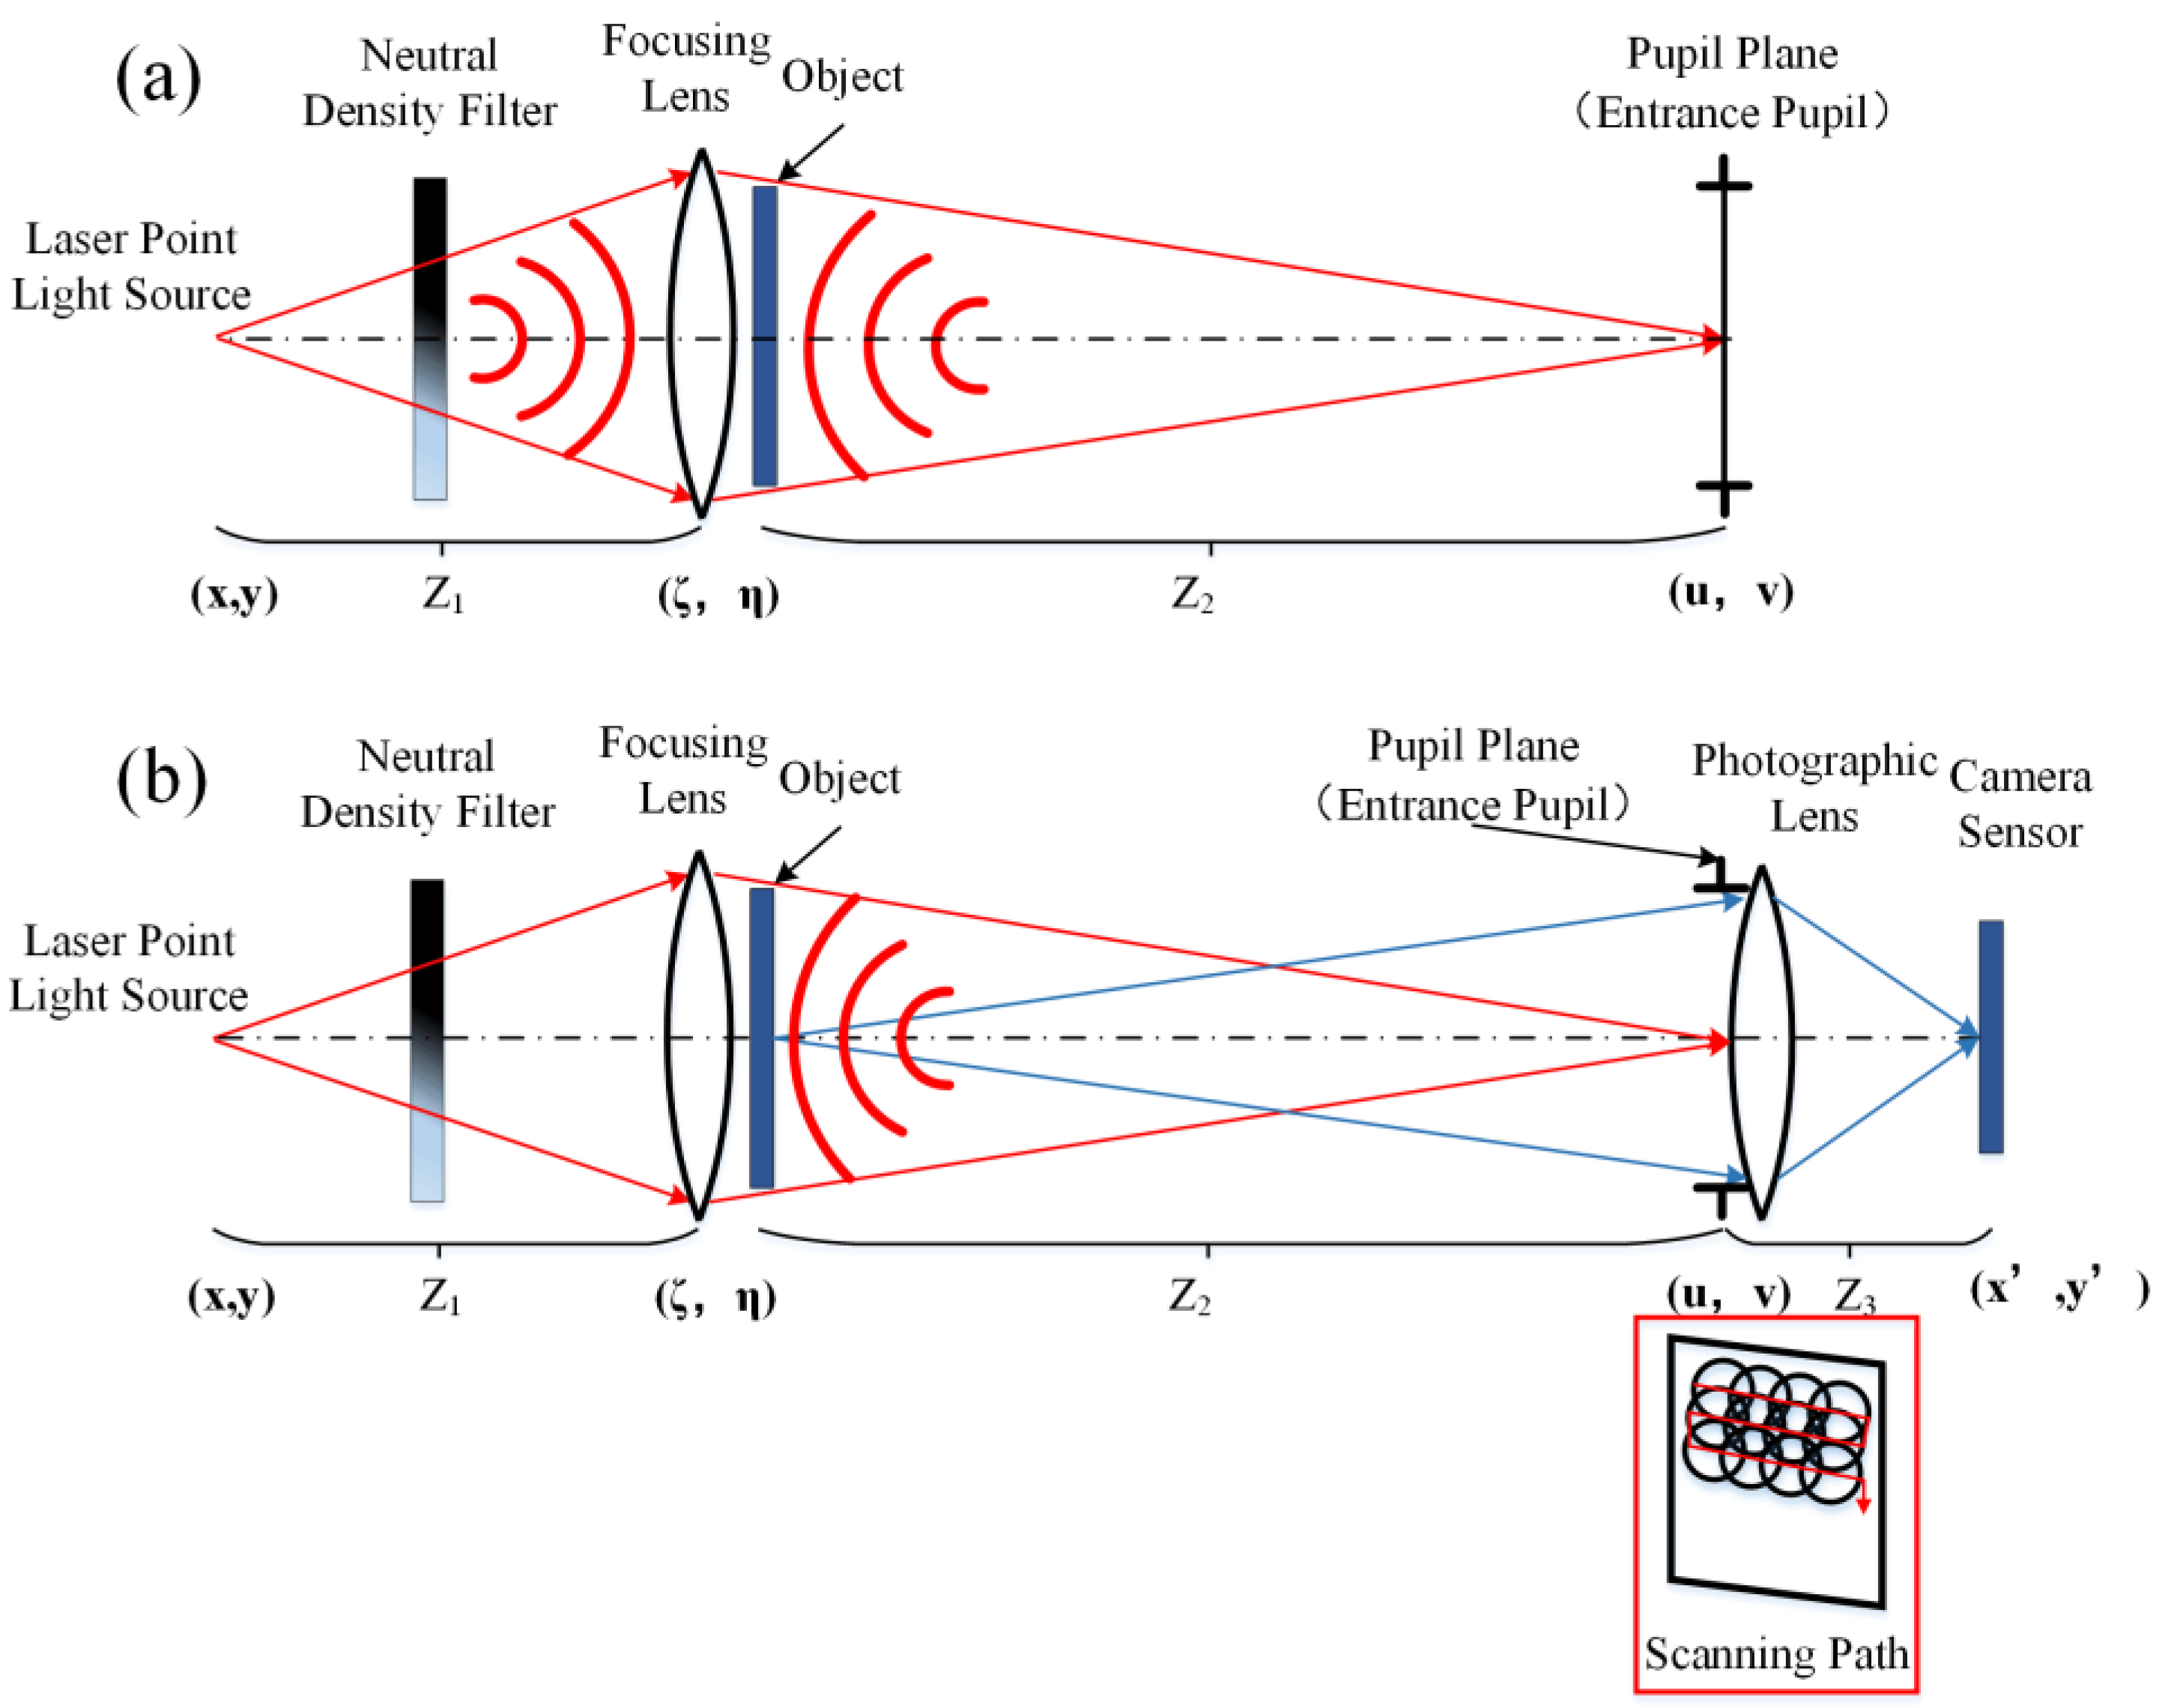
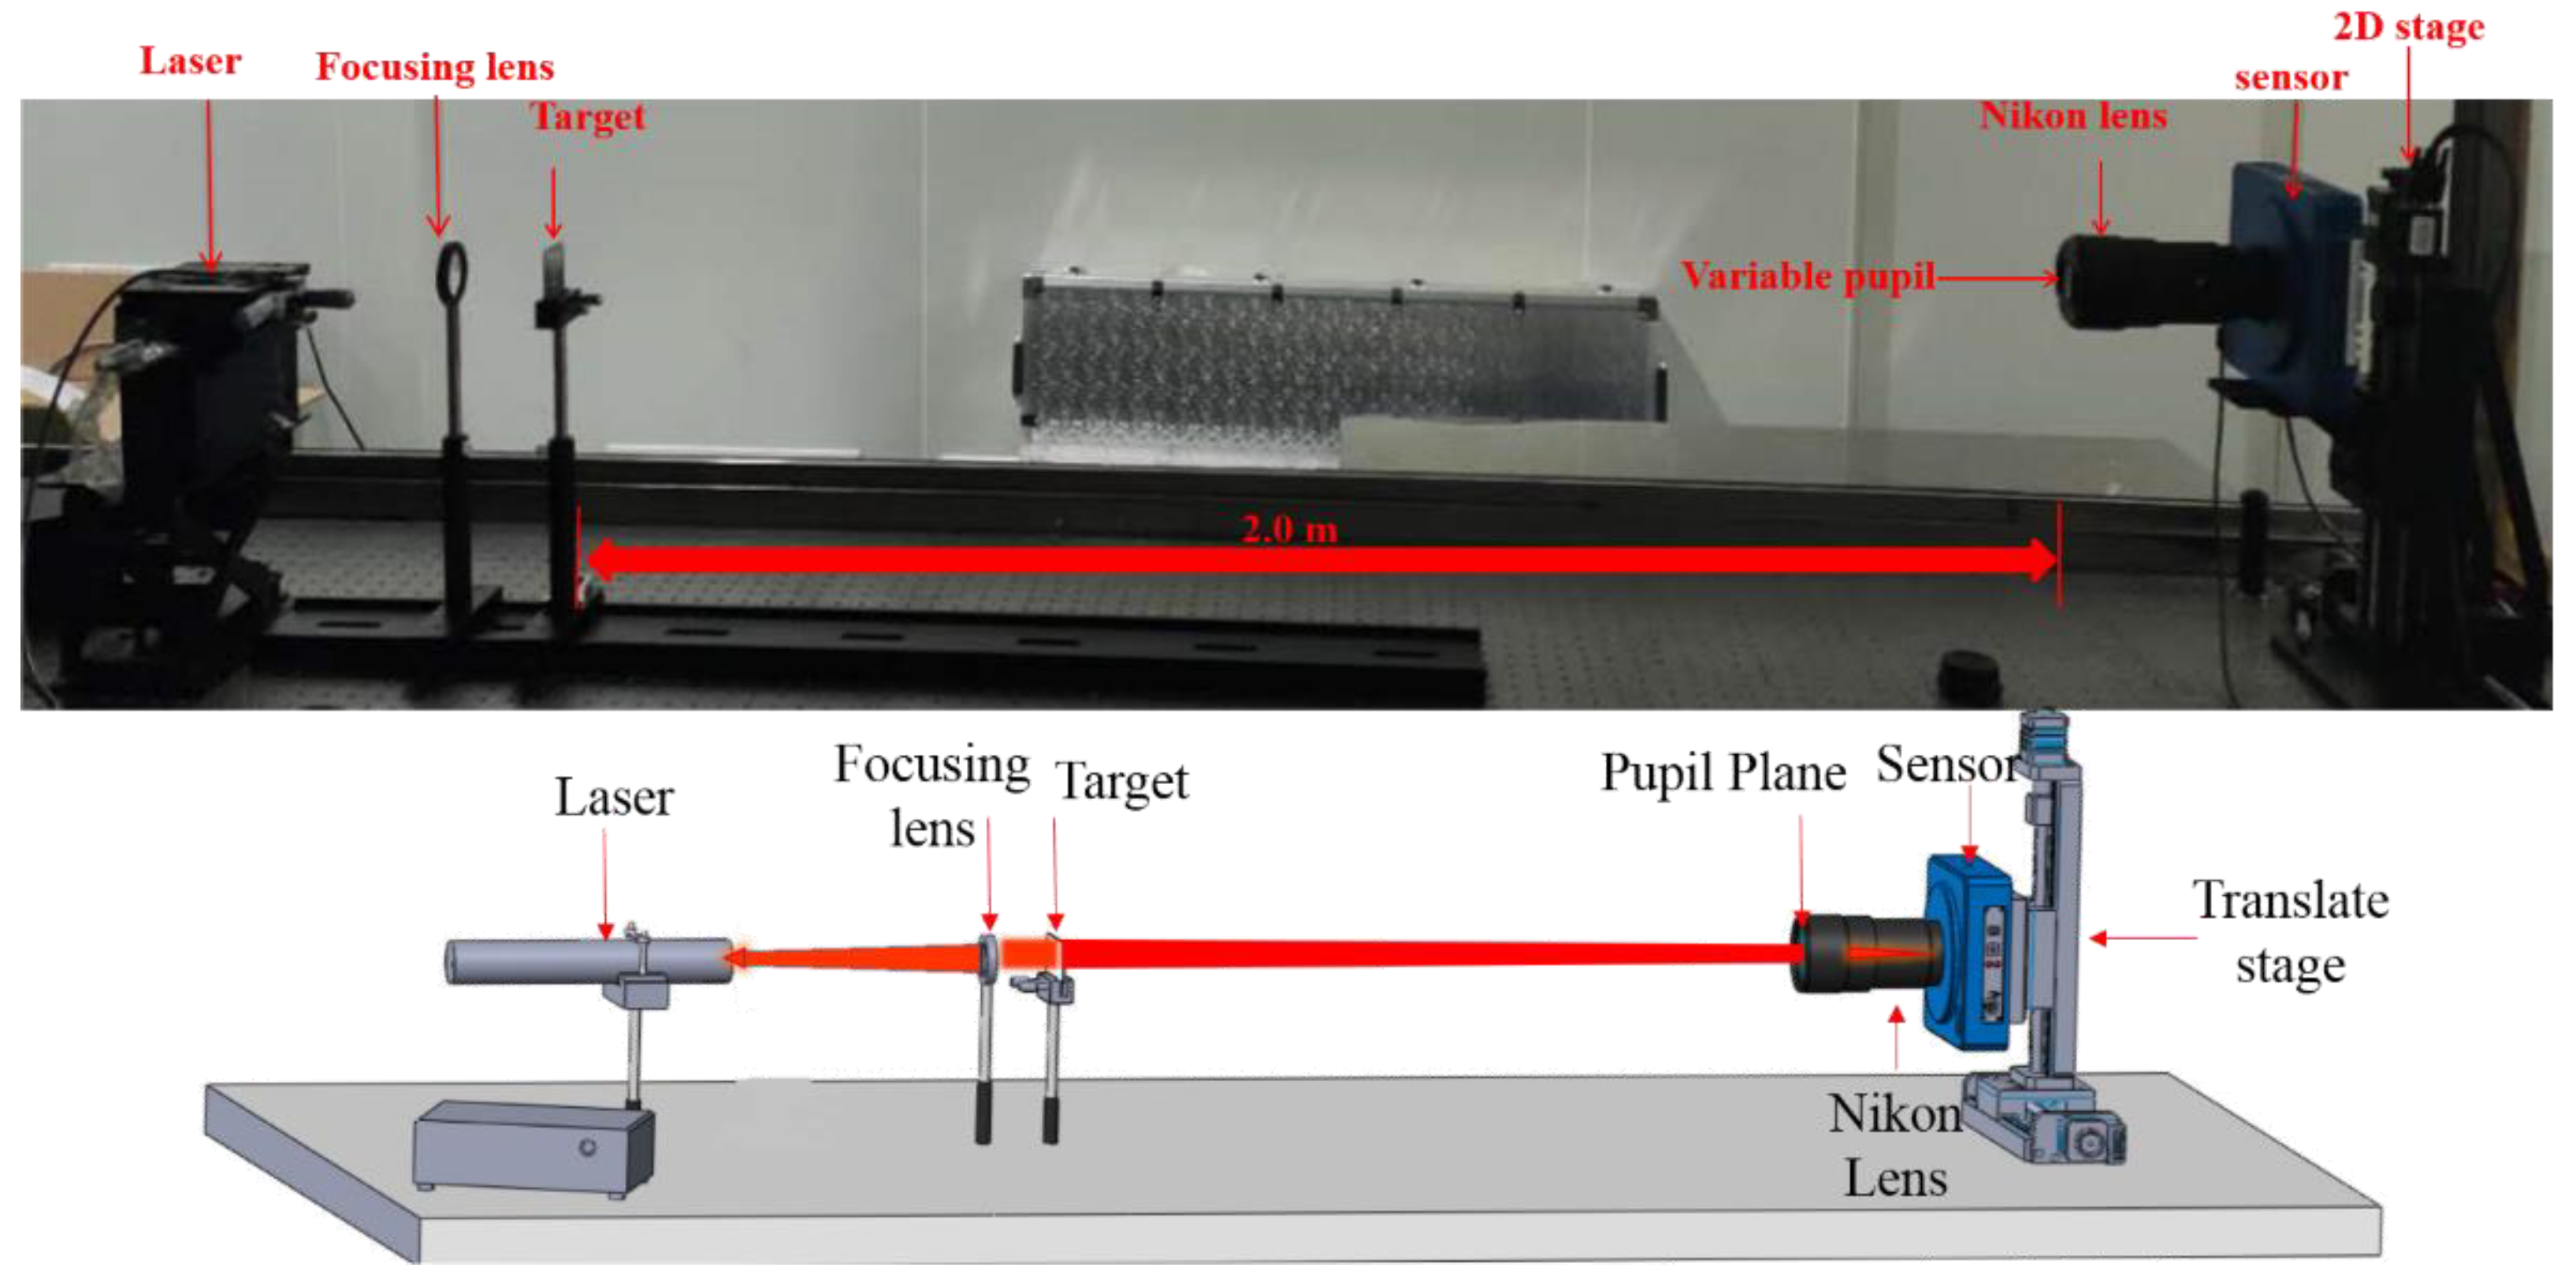
We used the Fraunhofer diffraction theory to verify the mathematical model of the proposed macroscopic FP method. The schematic and experimental configurations of the macroscopic FPs are shown in Figure 1. The coherent light source and camera sensor were located on opposite sides with respect to the object.
As shown in Figure 1a, the laser point light source emits a divergent spherical wave that propagates to the focusing lens and becomes a converging spherical wave, illuminating the object imaged at the pupil plane. In this experiment, in order to effectively control the system energy, we placed a neutral density filter behind the laser point light source. The distance between the light source and the focusing lens is z 1 , and the distance between the object and the pupil plane is z 2 . The amplitude distribution of the object near the focal position of the point light source is the Fraunhofer approximation pattern, which is located at the pupil plane (entrance pupil) of the photographic lens.
As shown in Figure 1b, the scanning path of the camera is in the red box. In addition, the light field emitting from the object propagates distance z 2 toward the pupil plan, and the image of the object is finally imaged on the camera sensor.
The spatial coordinates and frequency coordinates of the system are shown in Figure 1. ( x , y ) represents the spatial coordinates corresponding to the plane where the lighting source is located, ( ξ , η ) represents the spatial coordinates corresponding to the object plane, ( u , v ) represents the frequency coordinates corresponding to the pupil plane, and ( x , y ) is the spatial coordinates corresponding to the plane of the camera sensor.

2.1. Far-Field Fraunhofer Approximation

On the basis of the macroscopic far-field FP imaging model shown in Figure 1 and assuming that the distance between the object and camera sensor z 2 satisfies the far-field Fraunhofer approximation, we obtained the following relationship [6,8,9]:
z 2 > 2 d 2 λ
where z 2 is the distance between the object and the pupil plane, d is the diameter of the entrance pupil of the photographic lens, and λ is the wavelength of the laser source.
The laser point source emits coherent light with a wavelength of λ = 808 nm, and the focal length of the focusing lens is f = 180   nm with a f-number of F / 22 , creating the entrance pupil of d = 8.2   mm . The Fraunhofer far-field distance calculated is defined as
z 2 = ( 2 d 2 ) / λ = 166   m
Thus, for Equation (2) to hold, the camera should be placed at least 166 m away from the object. With such a large distance between the object and the photographic lens, the Fourier transform of the object will always appear on the image plane of the laser point light source. To avoid this, we used a focusing lens to converge the light emitted by the point source to the pupil plane of the photographic lens [7].

2.2. Forward Model

The laser point light source emits a wave filed that is monochromatic with wavelength λ and is spatially coherent across the surface of the object. The illumination light field interacts with the object, and part of the light field reaches the camera sensor through the imaging system. The light field emitted from an object is a two-dimensional complex field O ( ξ , η ) .
The light filed from the object O ( ξ , η ) propagates a distance z 2 toward the imaging system to satisfy the far field Fraunhofer approximation. The field at the pupil plane U ( u , v ) is related to the light field at the object O ( ξ , η ) through a Fourier transform.
U ( u , v ) = F { O ( ξ , η ) }
Because of the finite diameter of the photographic lens, only a portion of the light filed U ( u , v ) can be imaged onto the camera sensor. Let the pupil function be given by P ( u , v ) . For an ideal circle pupil, P ( u , v ) is given by
P ( u , v ) = { 1 , u 2 + v 2 r 2 0 , o t h e r w i s e
where r is the semi-diameter of the entrance pupil of the photographic lens.
The light field at the pupil plane U ( u , v ) is low-passed by pupil function (or coherent transfer function) to form an image of the object at the camera sensor.
U ( u , v ) = U ( u , v ) P ( u , v ) = F { O ( ξ , η ) } P ( u , v )
Because the camera sensor only detects optical intensity, the LR image measured by the camera is
I ( x , y ) = | F 1 { F { O ( ξ , η ) } P ( u , v ) } | 2
where F is the Fourier transform, and F 1 is the inverse Fourier transform.
The equivalent coherent transfer function (CTF) after aperture synthesis most appropriately reflects the characteristics of FP imaging, and thus the equivalent coherent transfer function corresponding to FP synthetic aperture imaging is derived herein.
H ( u , v ) = { 1 , i f c i r c ( u 2 + v 2 / r ) n = 1 N s h i f t δ ( u u n , v v n ) > 0 0 , i f c i r c ( u 2 + v 2 / r ) n = 1 N s h i f t δ ( u u n , v v n ) 0
where the relationship of relative position between the individual sub-aperture centers can be expressed as Equation (8):
{ u n = u n 1 + d ( 1 o v e r l a p ) v n = v n 1 + d ( 1 o v e r l a p )
where o v e r l a p the overlap denotes the spectrum overlap ratio, N s h i f t represents the total number of camera scans, and d is the diameter of the pupil of the photographic lens.
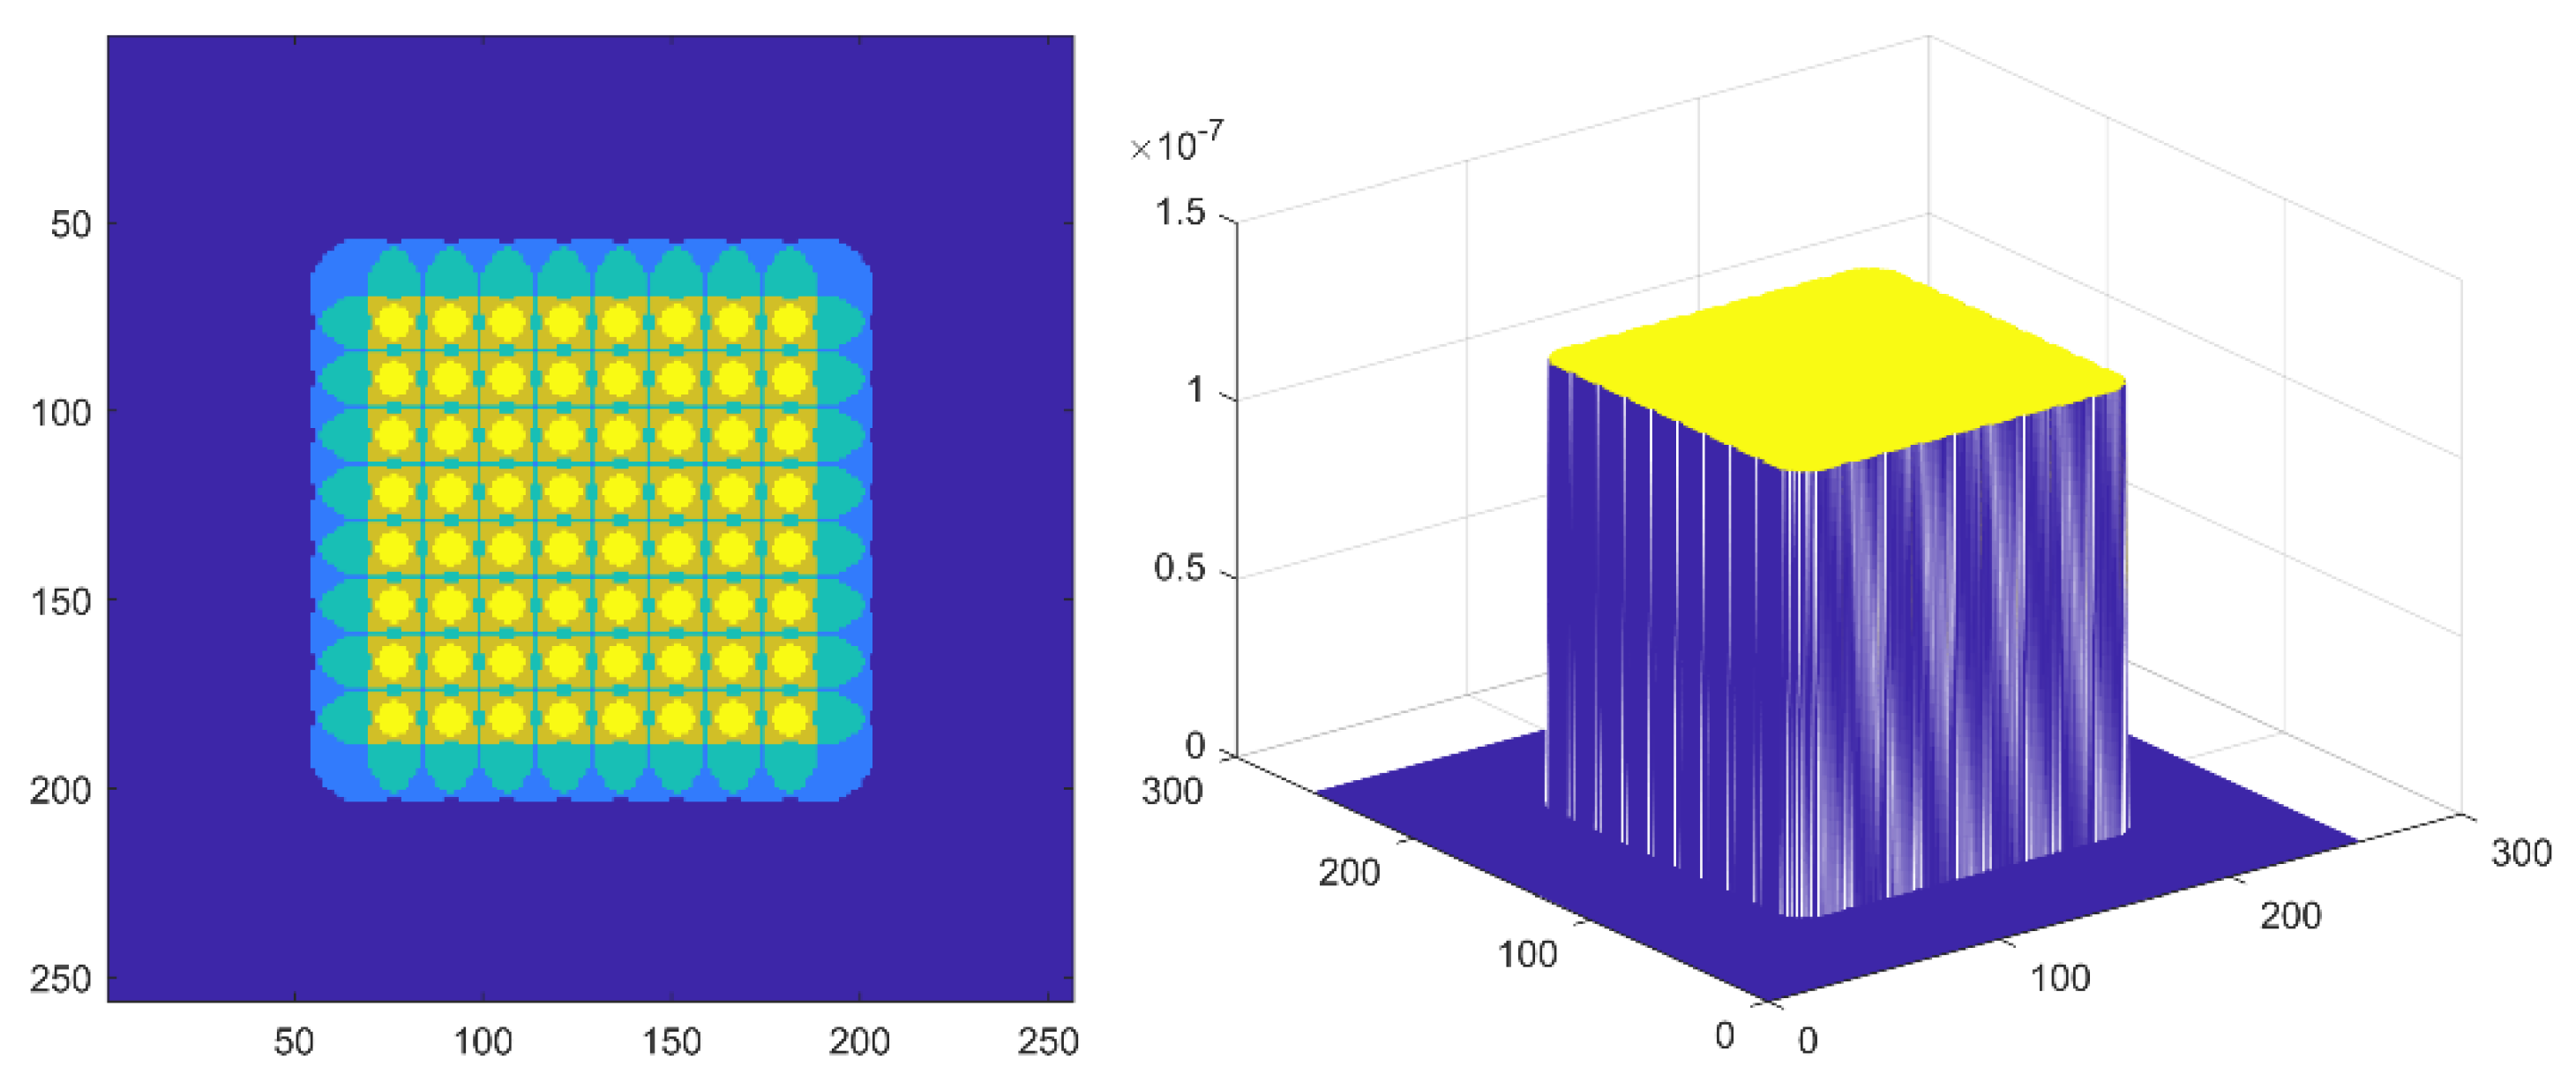
The synthetic aperture range corresponding to a single aperture after a two-dimensional scanning translation stage is presented in the left side of Figure 2, whereas the right side represents the derived equivalent synthetic aperture coherence transfer function expressed by Equation (7). As observed, the two results were highly similar.
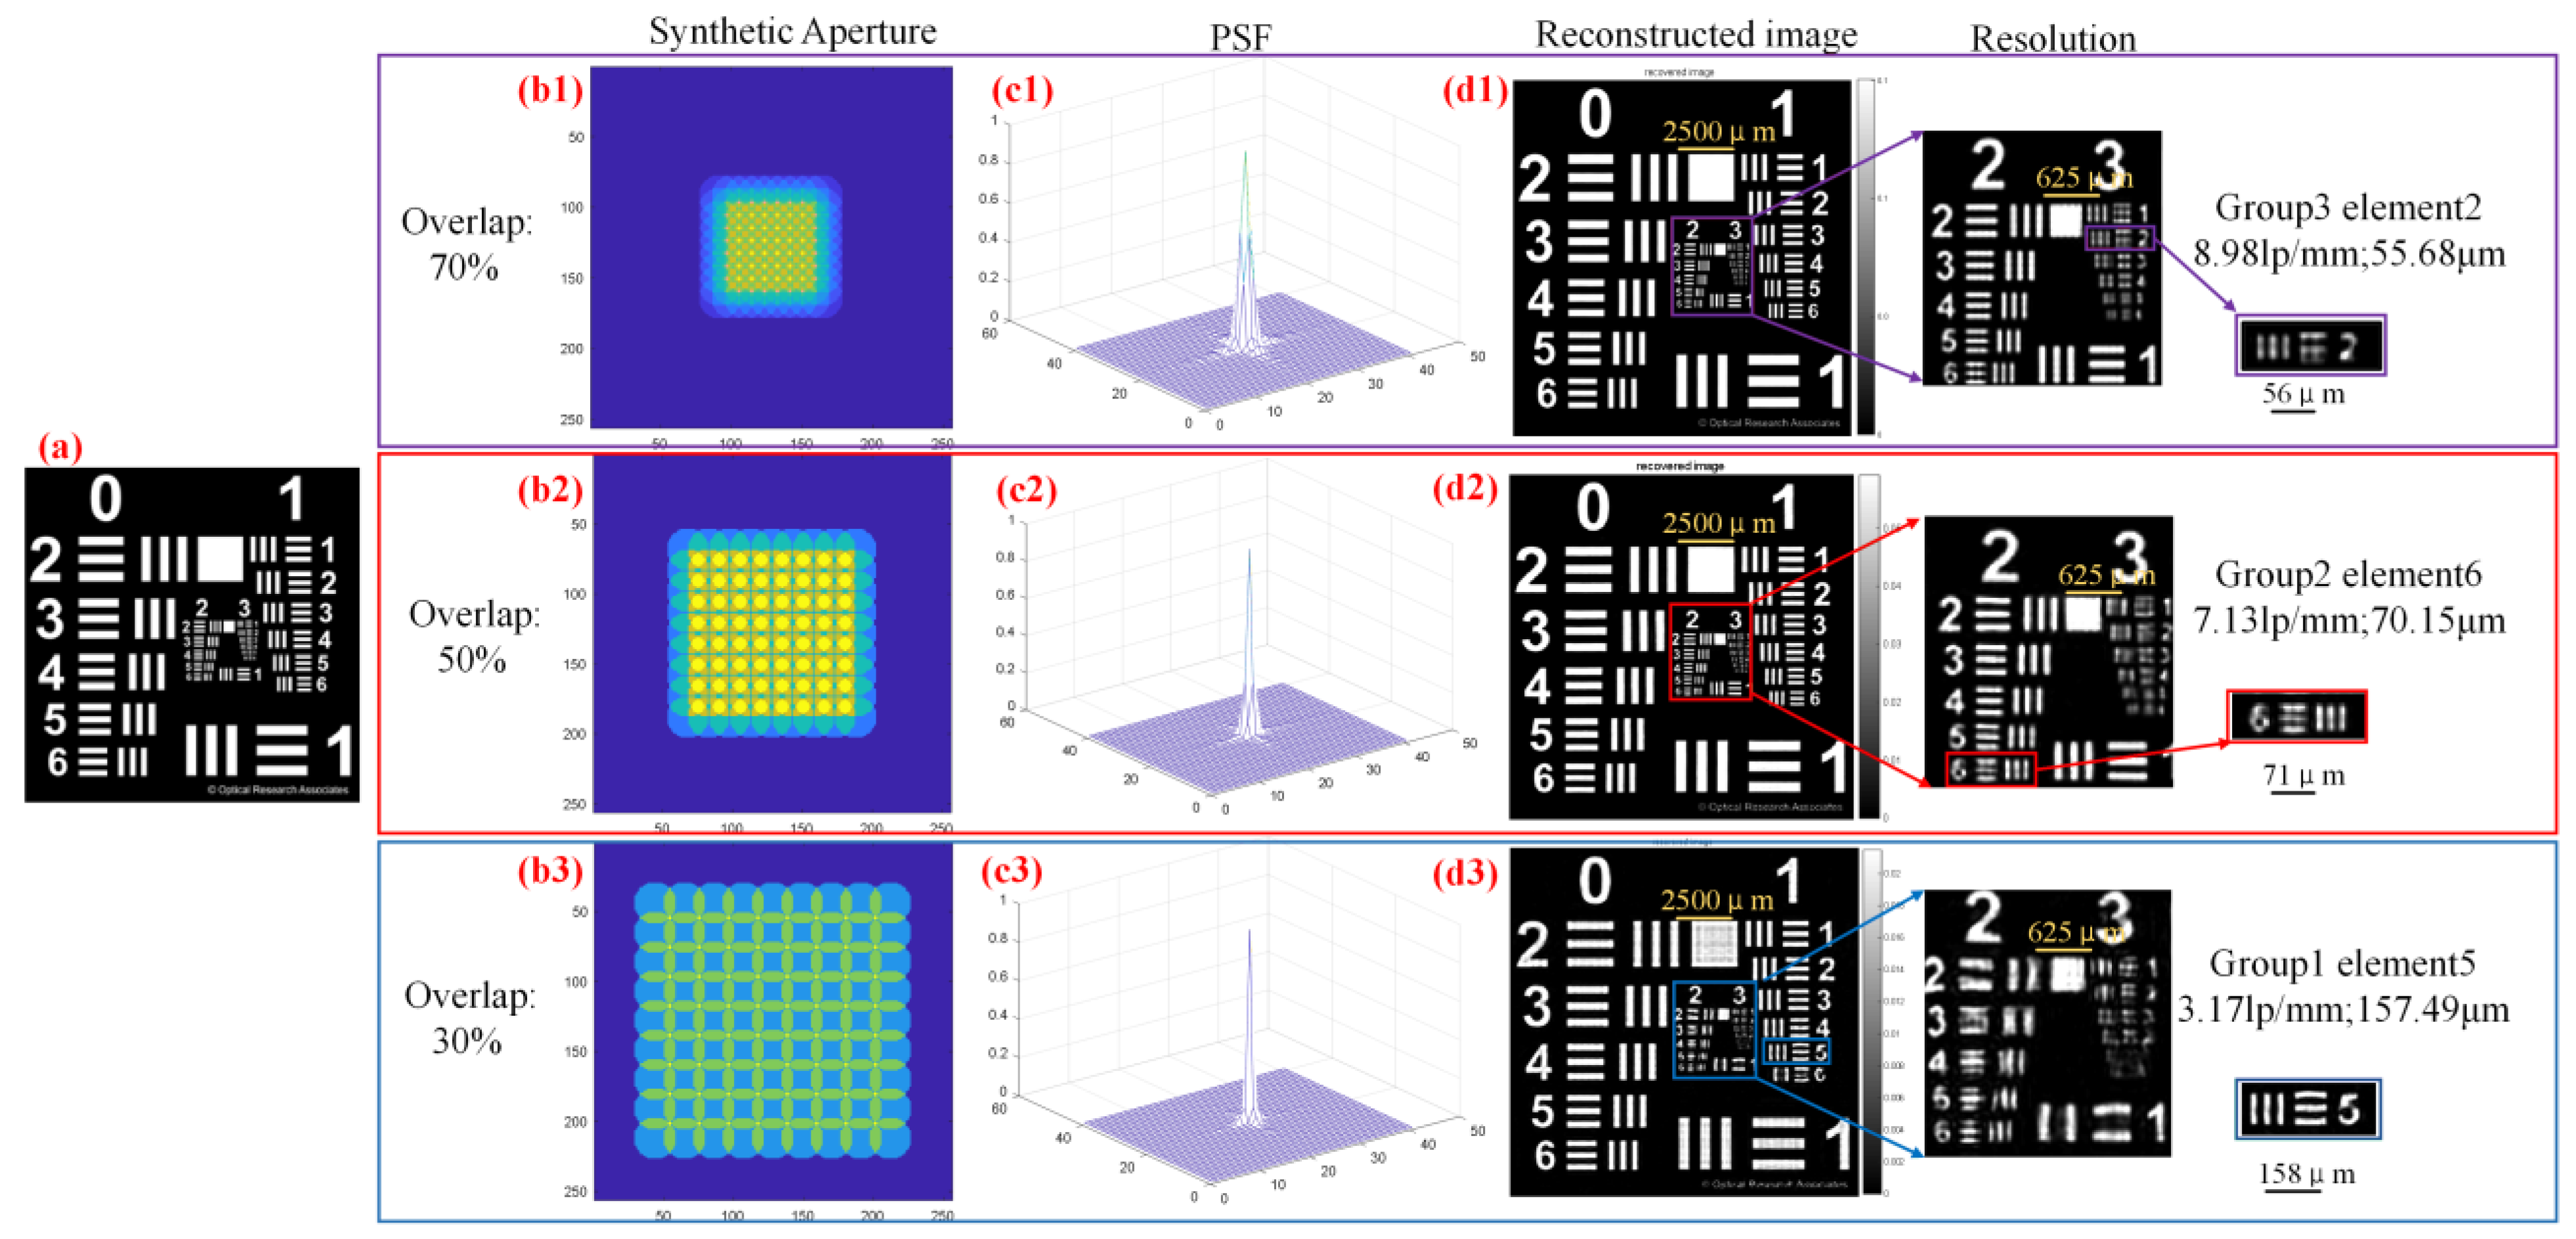
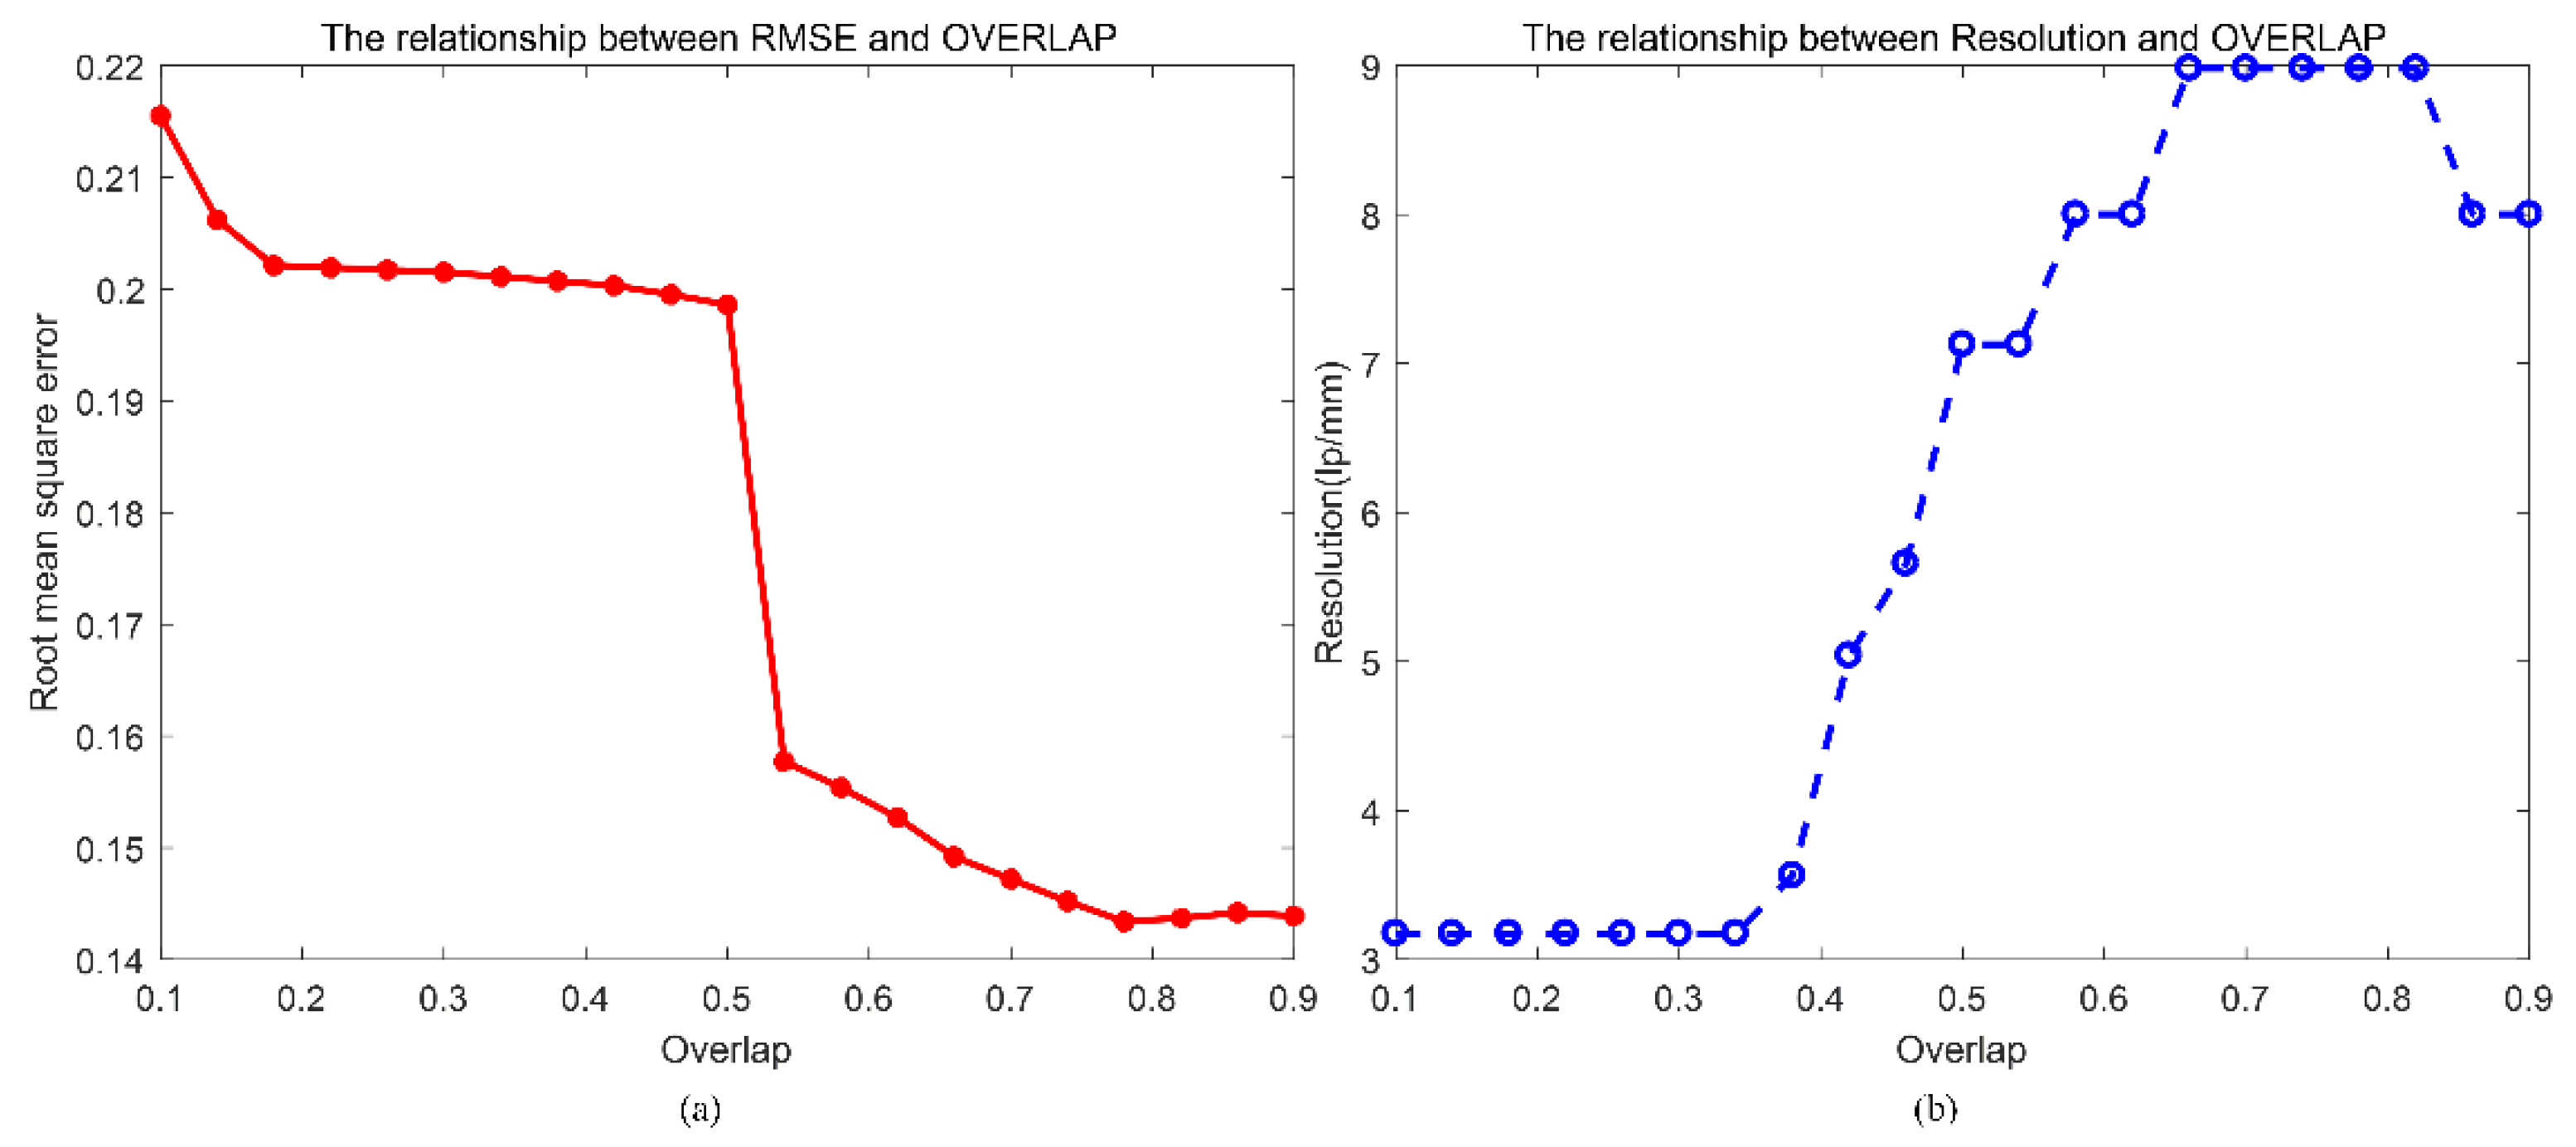
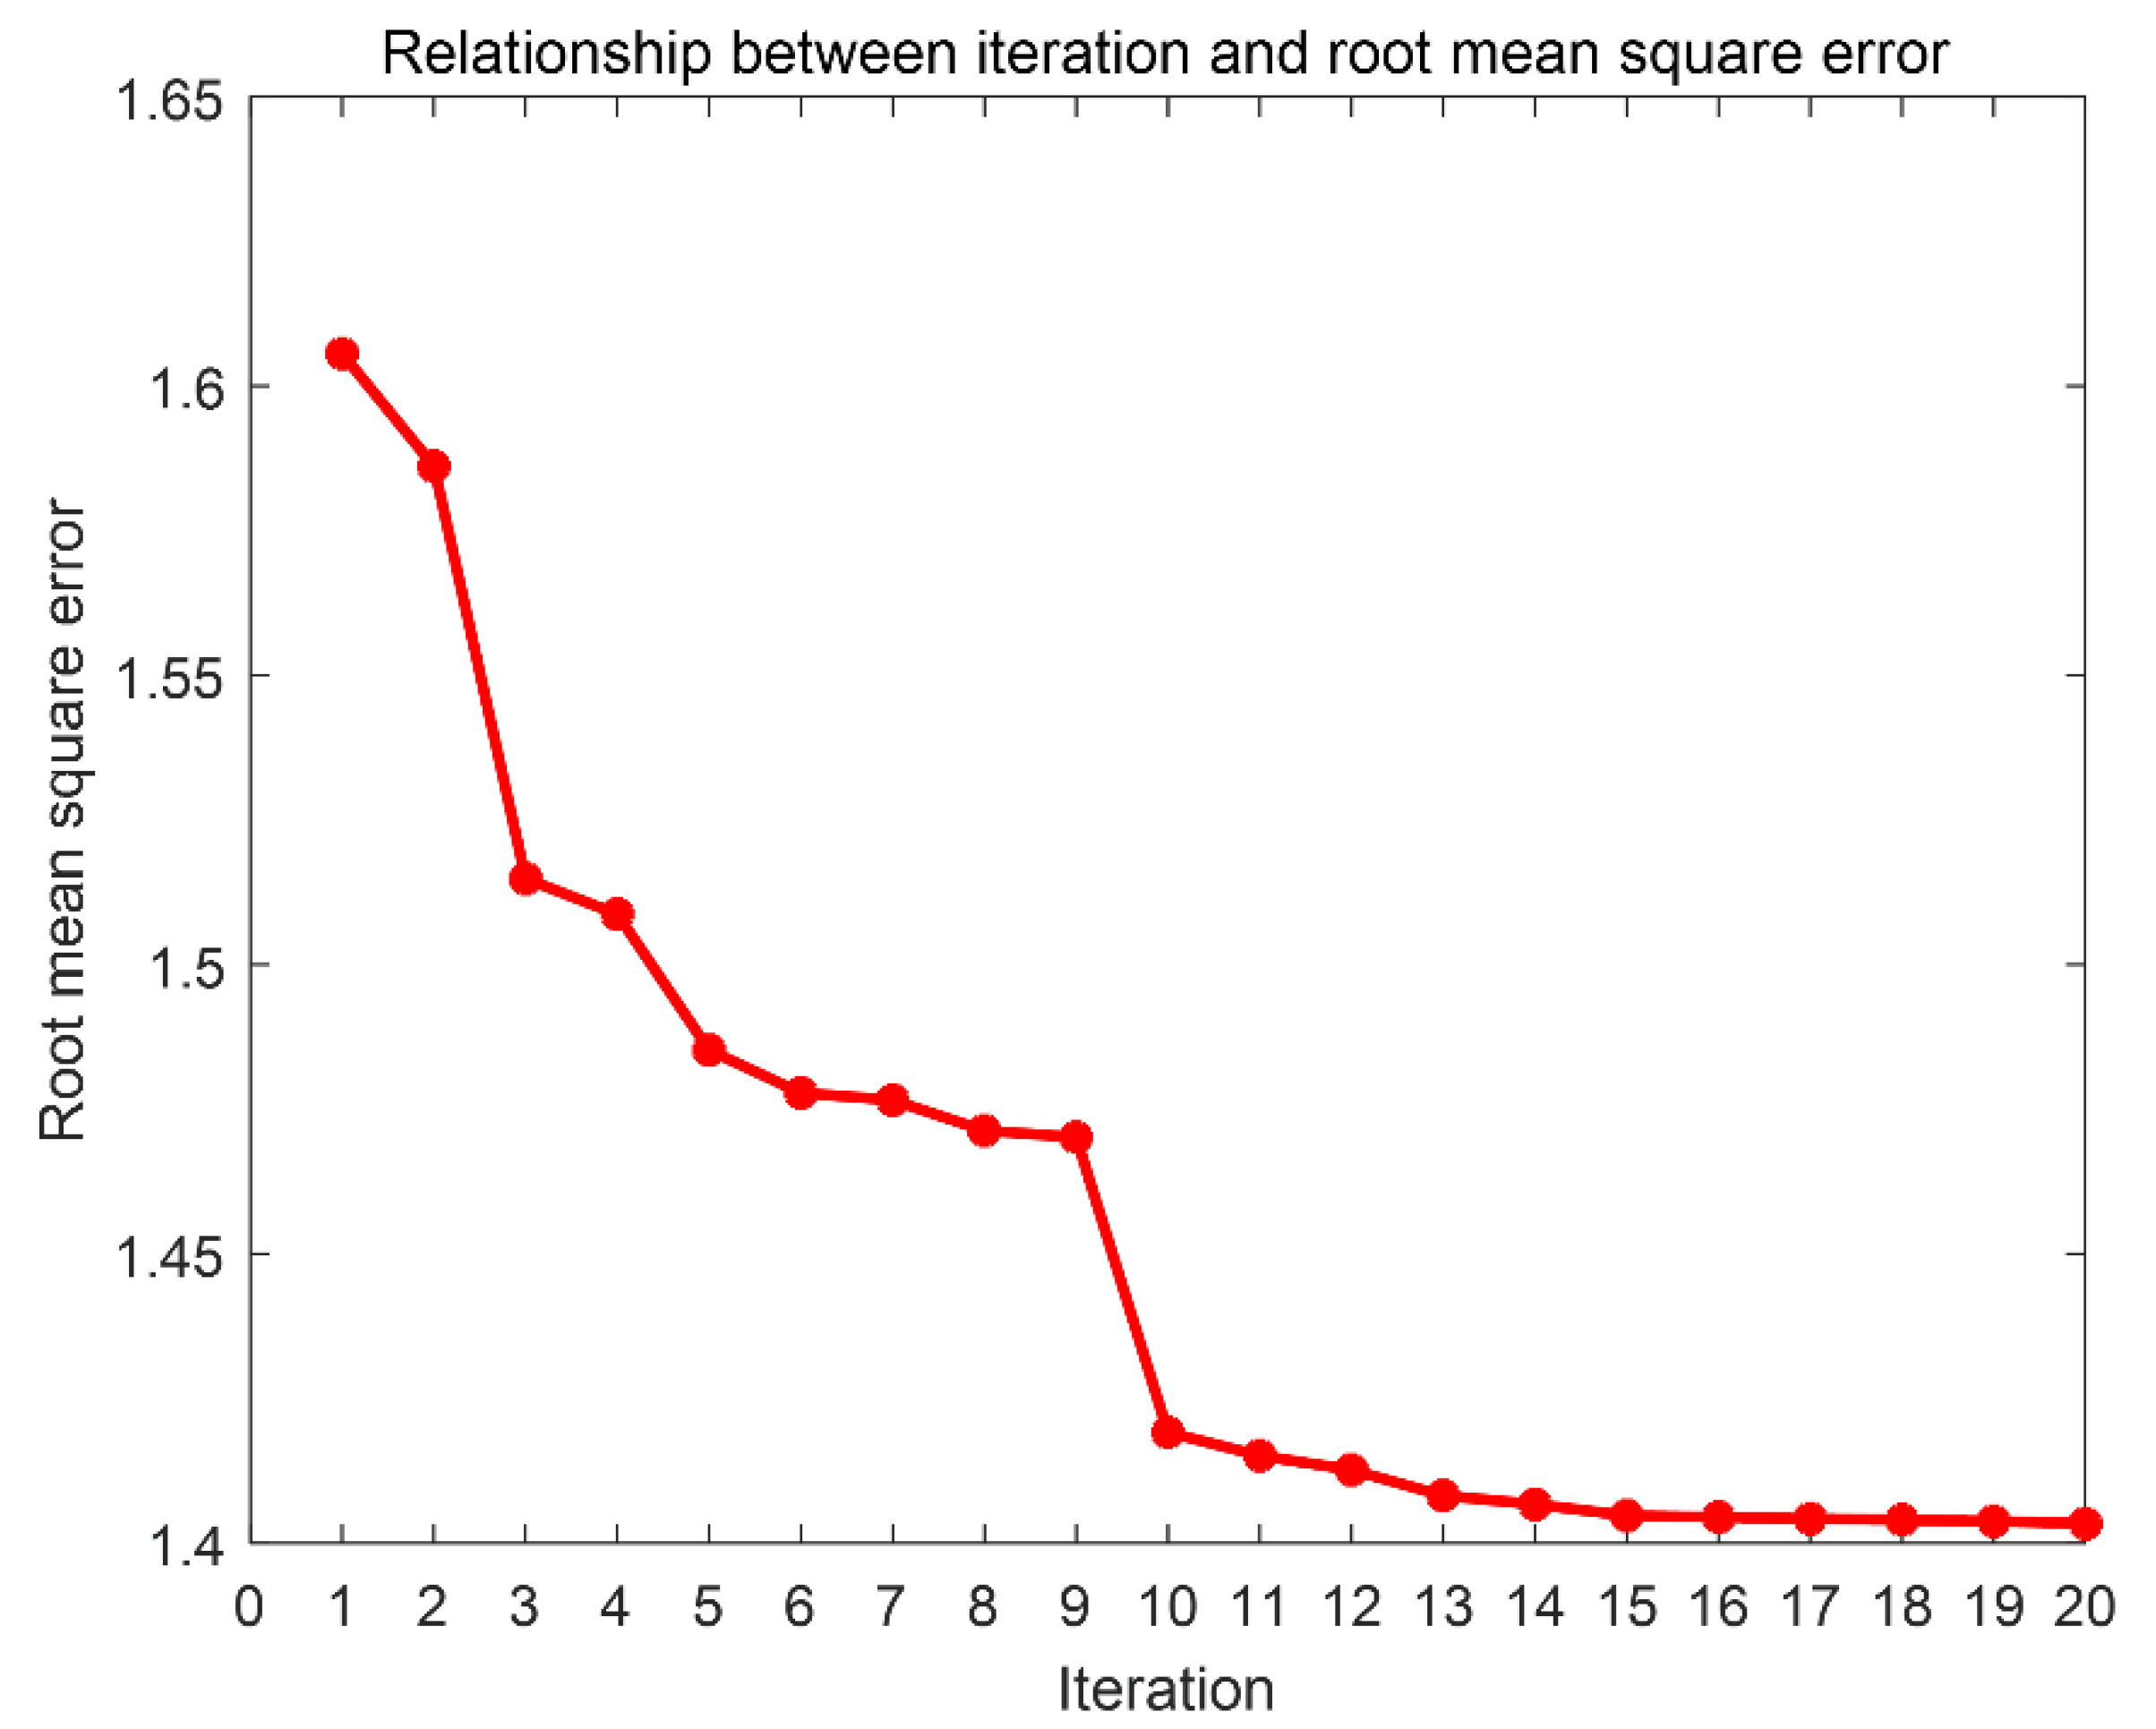
The iterative algorithm of FP imaging shows that the quality of the reconstructed image is also related to the amount of overlap between adjacent images. The effect of overlap ratio on the reconstruction of the ptychography iterative engine (PIE) has been described clearly [10,11]; meanwhile, we directly ported the results from real space PIE to spectrum plane of FP and studied the effect of the root mean square error (RMSE) and resolution of high-resolution image. Therefore, in this study, we scanned the spectrum plane of the object using a camera to acquire low-resolution images with a varying amount of overlap between adjacent images, which determined the distance the camera + image lens movements and the image reconstruction quality and is the important parameter we have to consider.

3. Simulations

3.1. Quantitative Metric

f ( x , y ) denotes the objective function, and g ( x , y ) is the image function, which is reconstructed from the amplitude of the Fourier-transformed object function. In order for the reconstruction quality to be quantitatively evaluated in the following simulations, the RMSE E is defined by [12]
E 2 = min α , x 0 , y 0 Σ x , y | α g ( x x 0 , y y 0 ) f ( x , y ) | x , y | f ( x , y ) | 2 = 1 max x 0 , y 0 | r f g ( x 0 , y 0 ) | 2 x , y | f ( x , y ) | 2 x , y | g ( x , y ) | 2
where r f g ( x 0 , y 0 ) = x , y f ( x , y ) g ( x x 0 , y y 0 ) is the cross-correlation of f ( x , y ) , g ( x , y ) , and * represents the complex conjugate [12]. The metric describes the difference between two complex functions f ( x , y ) and g ( x , y ) . We used it to compare the reconstructed HR complex field of the sample with its ground truth in the simulations.

3.2. Simulations

In the simulations, the low-resolution images performance using camera-scanning Fourier ptychography imaging is shown in Figure 3. And the focal length of the focusing lens was f = 180   mm , and the diameter of the circular pupil was D = 8.2   mm , i.e., the f-number was F / 22 . The corresponding pupil function is an ideal binary function (all ones inside the pupil circle and all zero outside). The working distance from the object to the pupil plane was 2 m, the scanning step between adjacent LR images was 2 mm, and 15 × 15 sequence images were used to reconstruct the HR image, with the overlap ratio between adjacent sub-spectrum being approximately 84%. We used the USAF resolution test chart (512 pixel × 512 pixel) as the HR amplitude. For the above image simulation process, we iterated a total of 20 times, which required approximately 1 min to reconstruct the HR image on a laptop with a 9th Generation Intel Core i7 processor and 16 GB RAM. The recovered HR intensity image is shown in Figure 4c, and the phase image is shown in Figure 4d. The algorithm can immediately calculate the synthetic aperture spectrum of a complex object in a Fourier space (on a log scale), as shown in Figure 4e. While improving the image resolution, it can also obtain the phase information of the actual pupil function, as shown in Figure 4f. The relationship between the reconstruction quality of the HR image and the number of iterations is shown in Figure 5.
We applied long-distance FP imaging to the simulated data with varying spectrum overlap ratios to study the performance of the algorithm [13]. Specifically, the overlap of the adjacent spectrum was to 70%, 50%, and 30%, which showed that the insufficient overlap drastically reduced the resolution of the HR image [11]. The visual results are shown in Figure 6. From the results, we can see that long-distance FP worked worse in reconstructing intensity with decreasing overlap ratio. Holding the individual aperture size and the number of samples constant, we varied the overlap ratio between adjacent apertures; the RMSE plot of HR intensity image is shown in Figure 7a. When the overlap was less than 50%, we were unable to faithfully recover the high-resolution image, as shown in the resolution plot in Figure 7b.

4. Experiments

4.1. Experimental Prototype

Our imaging system consists of a high-performance cooled CCD (Belfast, UK, Apogee Alta F16000 Compact, 15.8 Megapixel CCD) coupled with a 180 mm Nikon photographic lens (Tokyo, Japan, AF NIKKOR 180MM F/2.8, IF-ED), which was mounted on a motorized 2D stage (Shanghai, China, GCD-20330M, see Figure 8). The total travel of the 2D stage was 300 mm with an accuracy of 0.1 μm. The object was located 2 m away from the pupil plane of the lens and illuminated by a 808 nm laser with a multimode fiber near-infrared semiconductor (Changchun, China, CNI, MDL-Ⅲ-808 nm-1W-19121367). The coherent light beam emitted by the laser light source directly illuminated the focusing lens (f1 = 150 mm) and was imaged to the variable pupil plane of the Nikon imaging lens after passing the object with 20 mm × 20 mm (Shanghai, China, RealLight, RT-GBA1-TNS001). In addition, the object image and the corresponding data chart are shown in Figure 9. As shown in Figure 9, the object of the experiment, which is shown on the left and tagged with No. 1 to No. 25, had a total of 25 groups of stripes, and the line width and frequency of each group that indicate the resolution increases in turn are shown in the chart. The camera sensor received a series of LR intensity images, which was the inverse Fourier transform of the object spectrum at different locations.
The purpose of our fiber laser is to ensure that the object has a sufficient illumination range. The laser source with less than 1% intensity fluctuation was used in our experiments. Therefore, we were able to obtain a uniform illumination image without correcting the laser illumination intensity, as was evident from the images collected. The focusing lens converges the illumination and forms a Fourier transform of the object on the imaging plane of the lens, which means that the laser source is imaged at the pupil position of the imaging lens.
To simulate a cheap lens with a long focal length and small aperture, we stopped the lens down to a focal length of 180 mm and f-number F/22, creating an 8.2 mm diameter aperture. A set of images was acquired by moving the camera to different positions in the synthetic aperture plane via the translation stage. At every grid position, we captured multiple images with different exposures time to form a high-dynamic-range reconstructive image. By translating the camera, the shift in perspective causes the captured images to be misaligned. The translation stage is sufficiently precise enough to allow the calibration step to be performed immediately before or after data capture.

4.2. Quality Control and Error Correction

In this study, we performed a simple analysis of the noise distribution [13]. For the camera noise, we can use the elimination of outliers or the estimated noise distribution to redefine the random variable. In this scheme, we used the estimated noise distribution, as shown in Figure 10. The large scanning range of camera in this experiment caused the large noise and the low signal-to-noise ratio of the dark field images, which eventually led to an unsatisfactory HR image. To improve the reconstruction quality of the images and reduce the effect of the noise, we used each low-resolution image to subtract the estimated noise distribution as a new intensity image, which was used as the initial input for super-resolution reconstruction.
In our experiments, we obtained image sequences at different positions using camera scanning. The camera’s movement error may lead to LR image position misalignment and the loss of information during the imaging process. For image position misalignment, we aligned the image sequence using a fast sub-pixel registration algorithm [12].

5. Results

We tested the proposed method with two real captured datasets with scanning steps of 4.5 and 2 mm, respectively. We used an object placed 2 m away from the pupil plane of the imaging lens. First, a total of 225 LR images with resolution of 231 pixel × 231 pixel was obtained with a scanning step of 4.5 mm and a 61% overlap ratio between two adjacent images. Second, by changing the scanning step to 2 mm and with an 84.5% overlap ratio between adjacent images, we obtained 361 LR images with the same resolution.
Figure 11 is the dataset under multiple acquisitions showing different results under two different far-field FP experimental setups. 
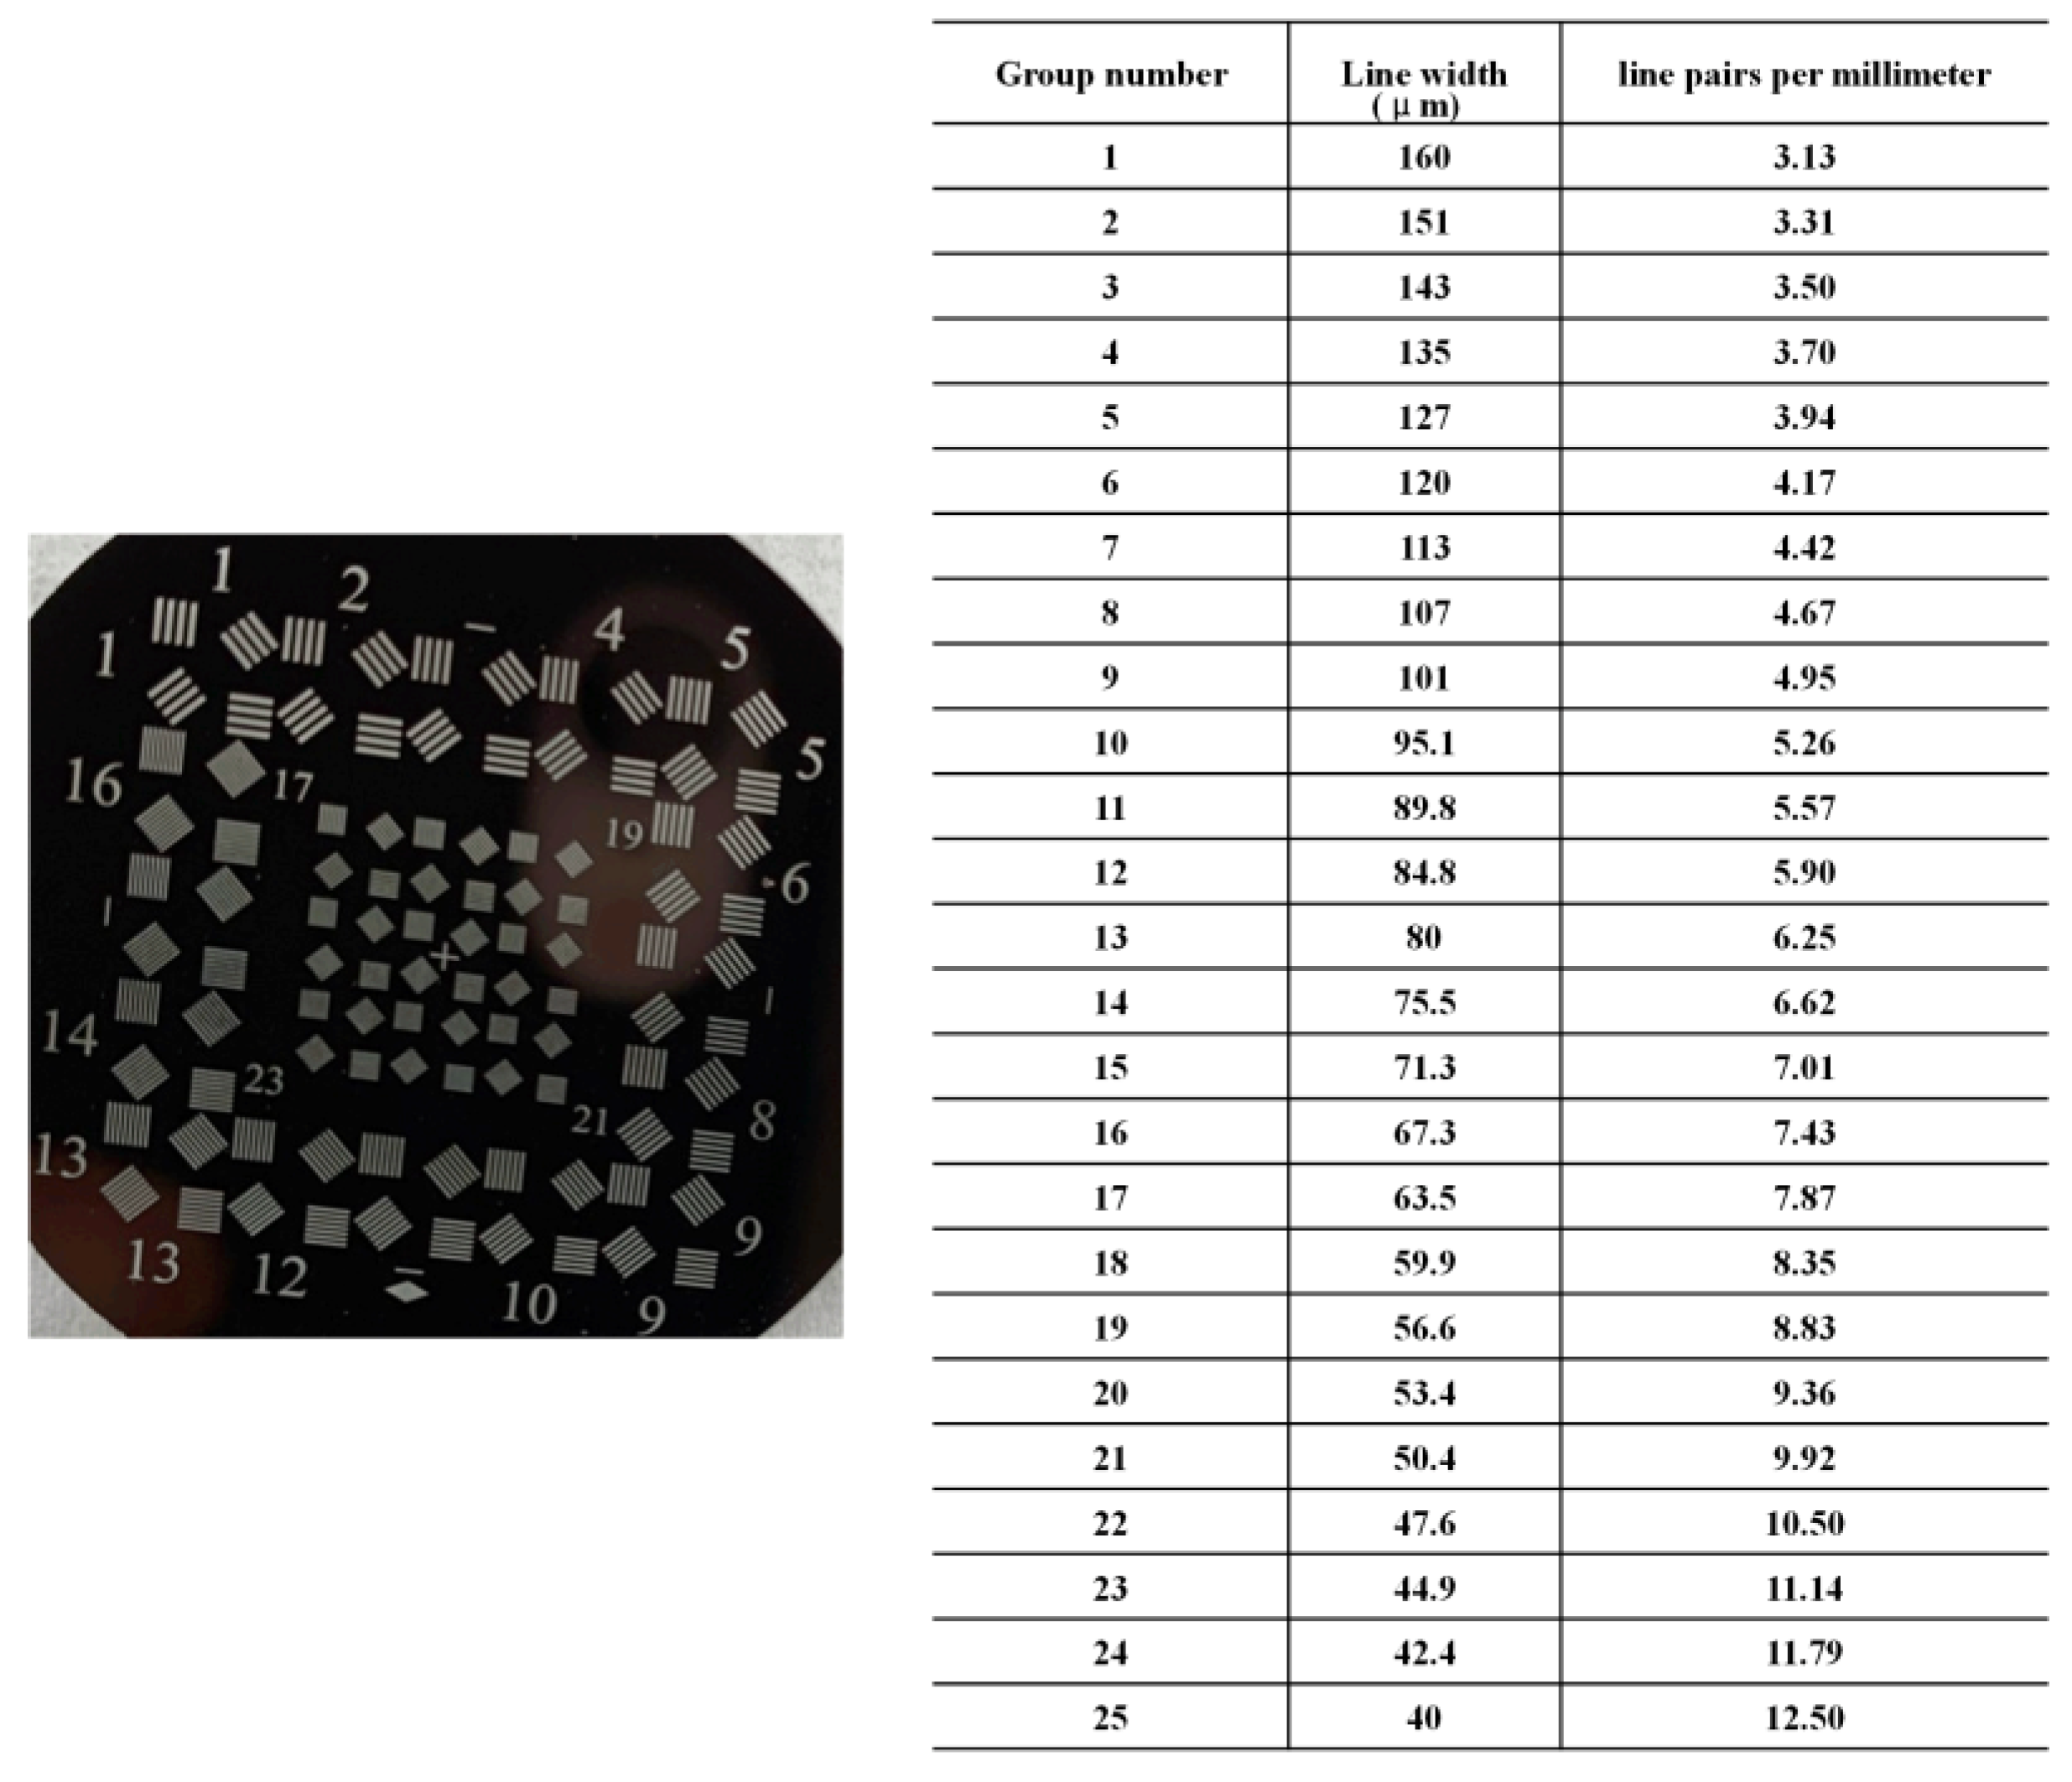
Figure 11a, with a scanning step of 4.5 mm and 61% overlap ratio, is an original sequence image composed of 225 LR images with 160 μm line width and 3.13 lp/mm resolution. Figure 11b, with a scanning step of 2 mm and 84.5% overlap ratio, shows a set of images with 361 LR intensity images with the same resolution.
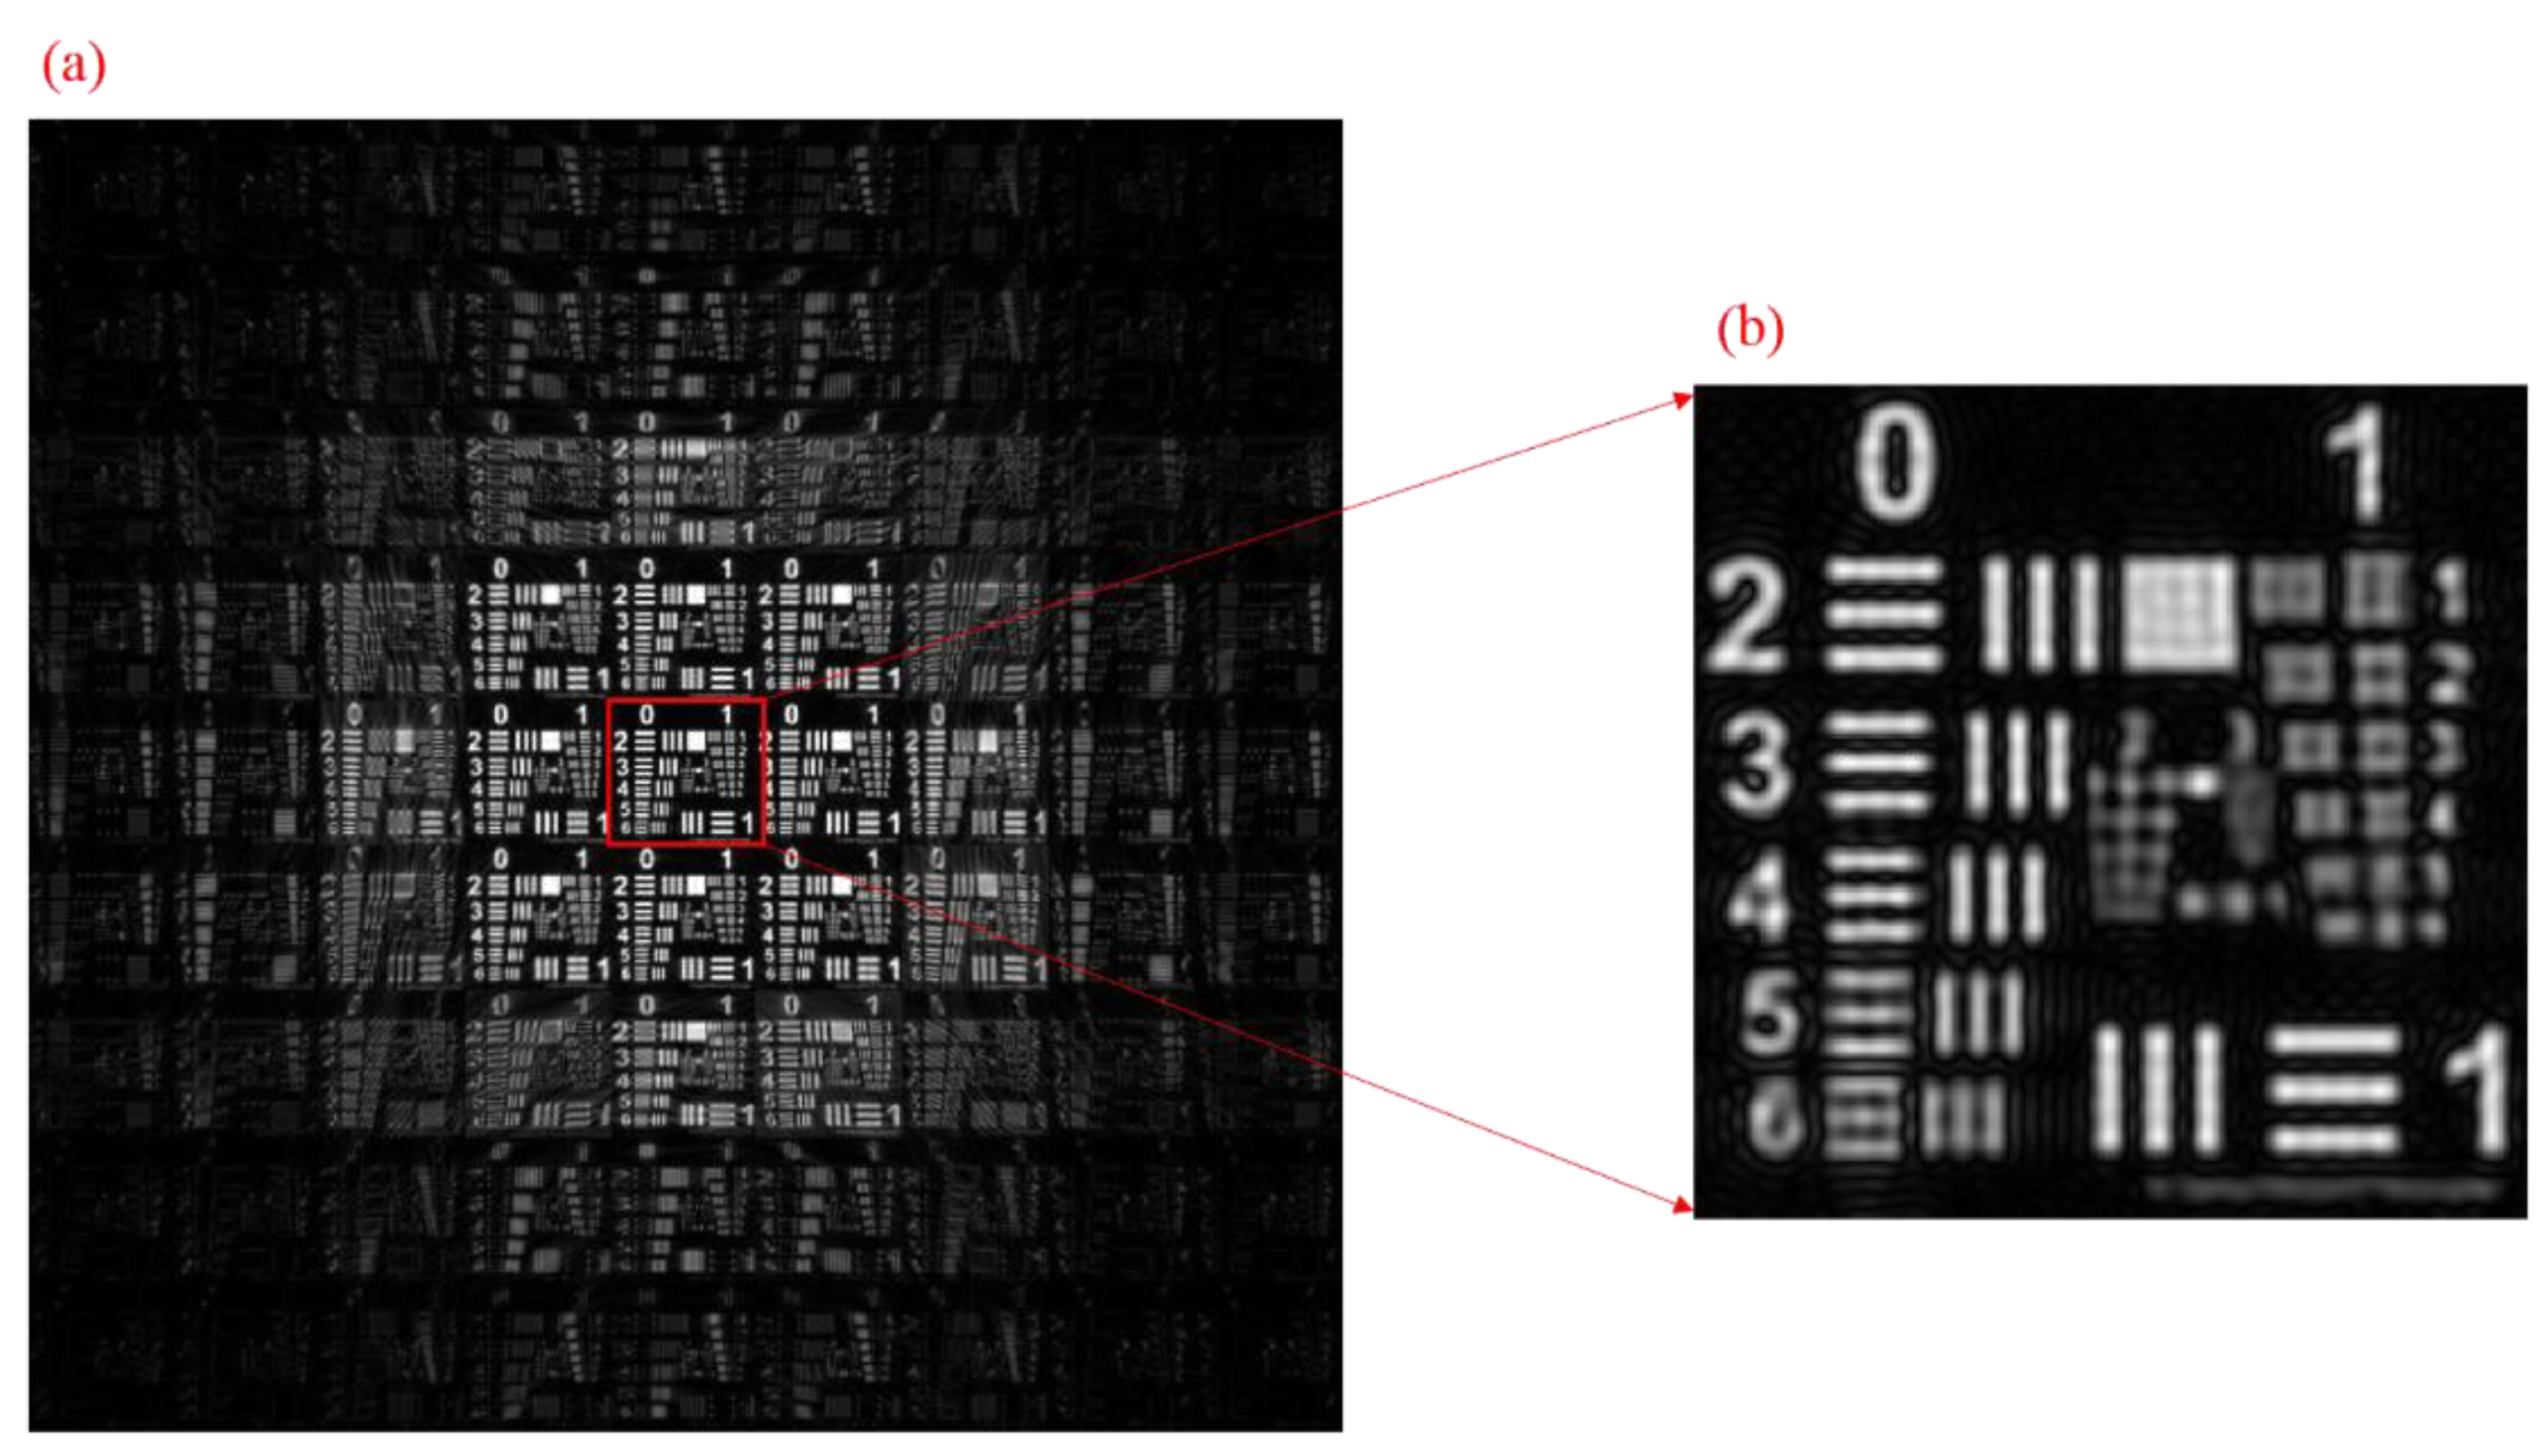
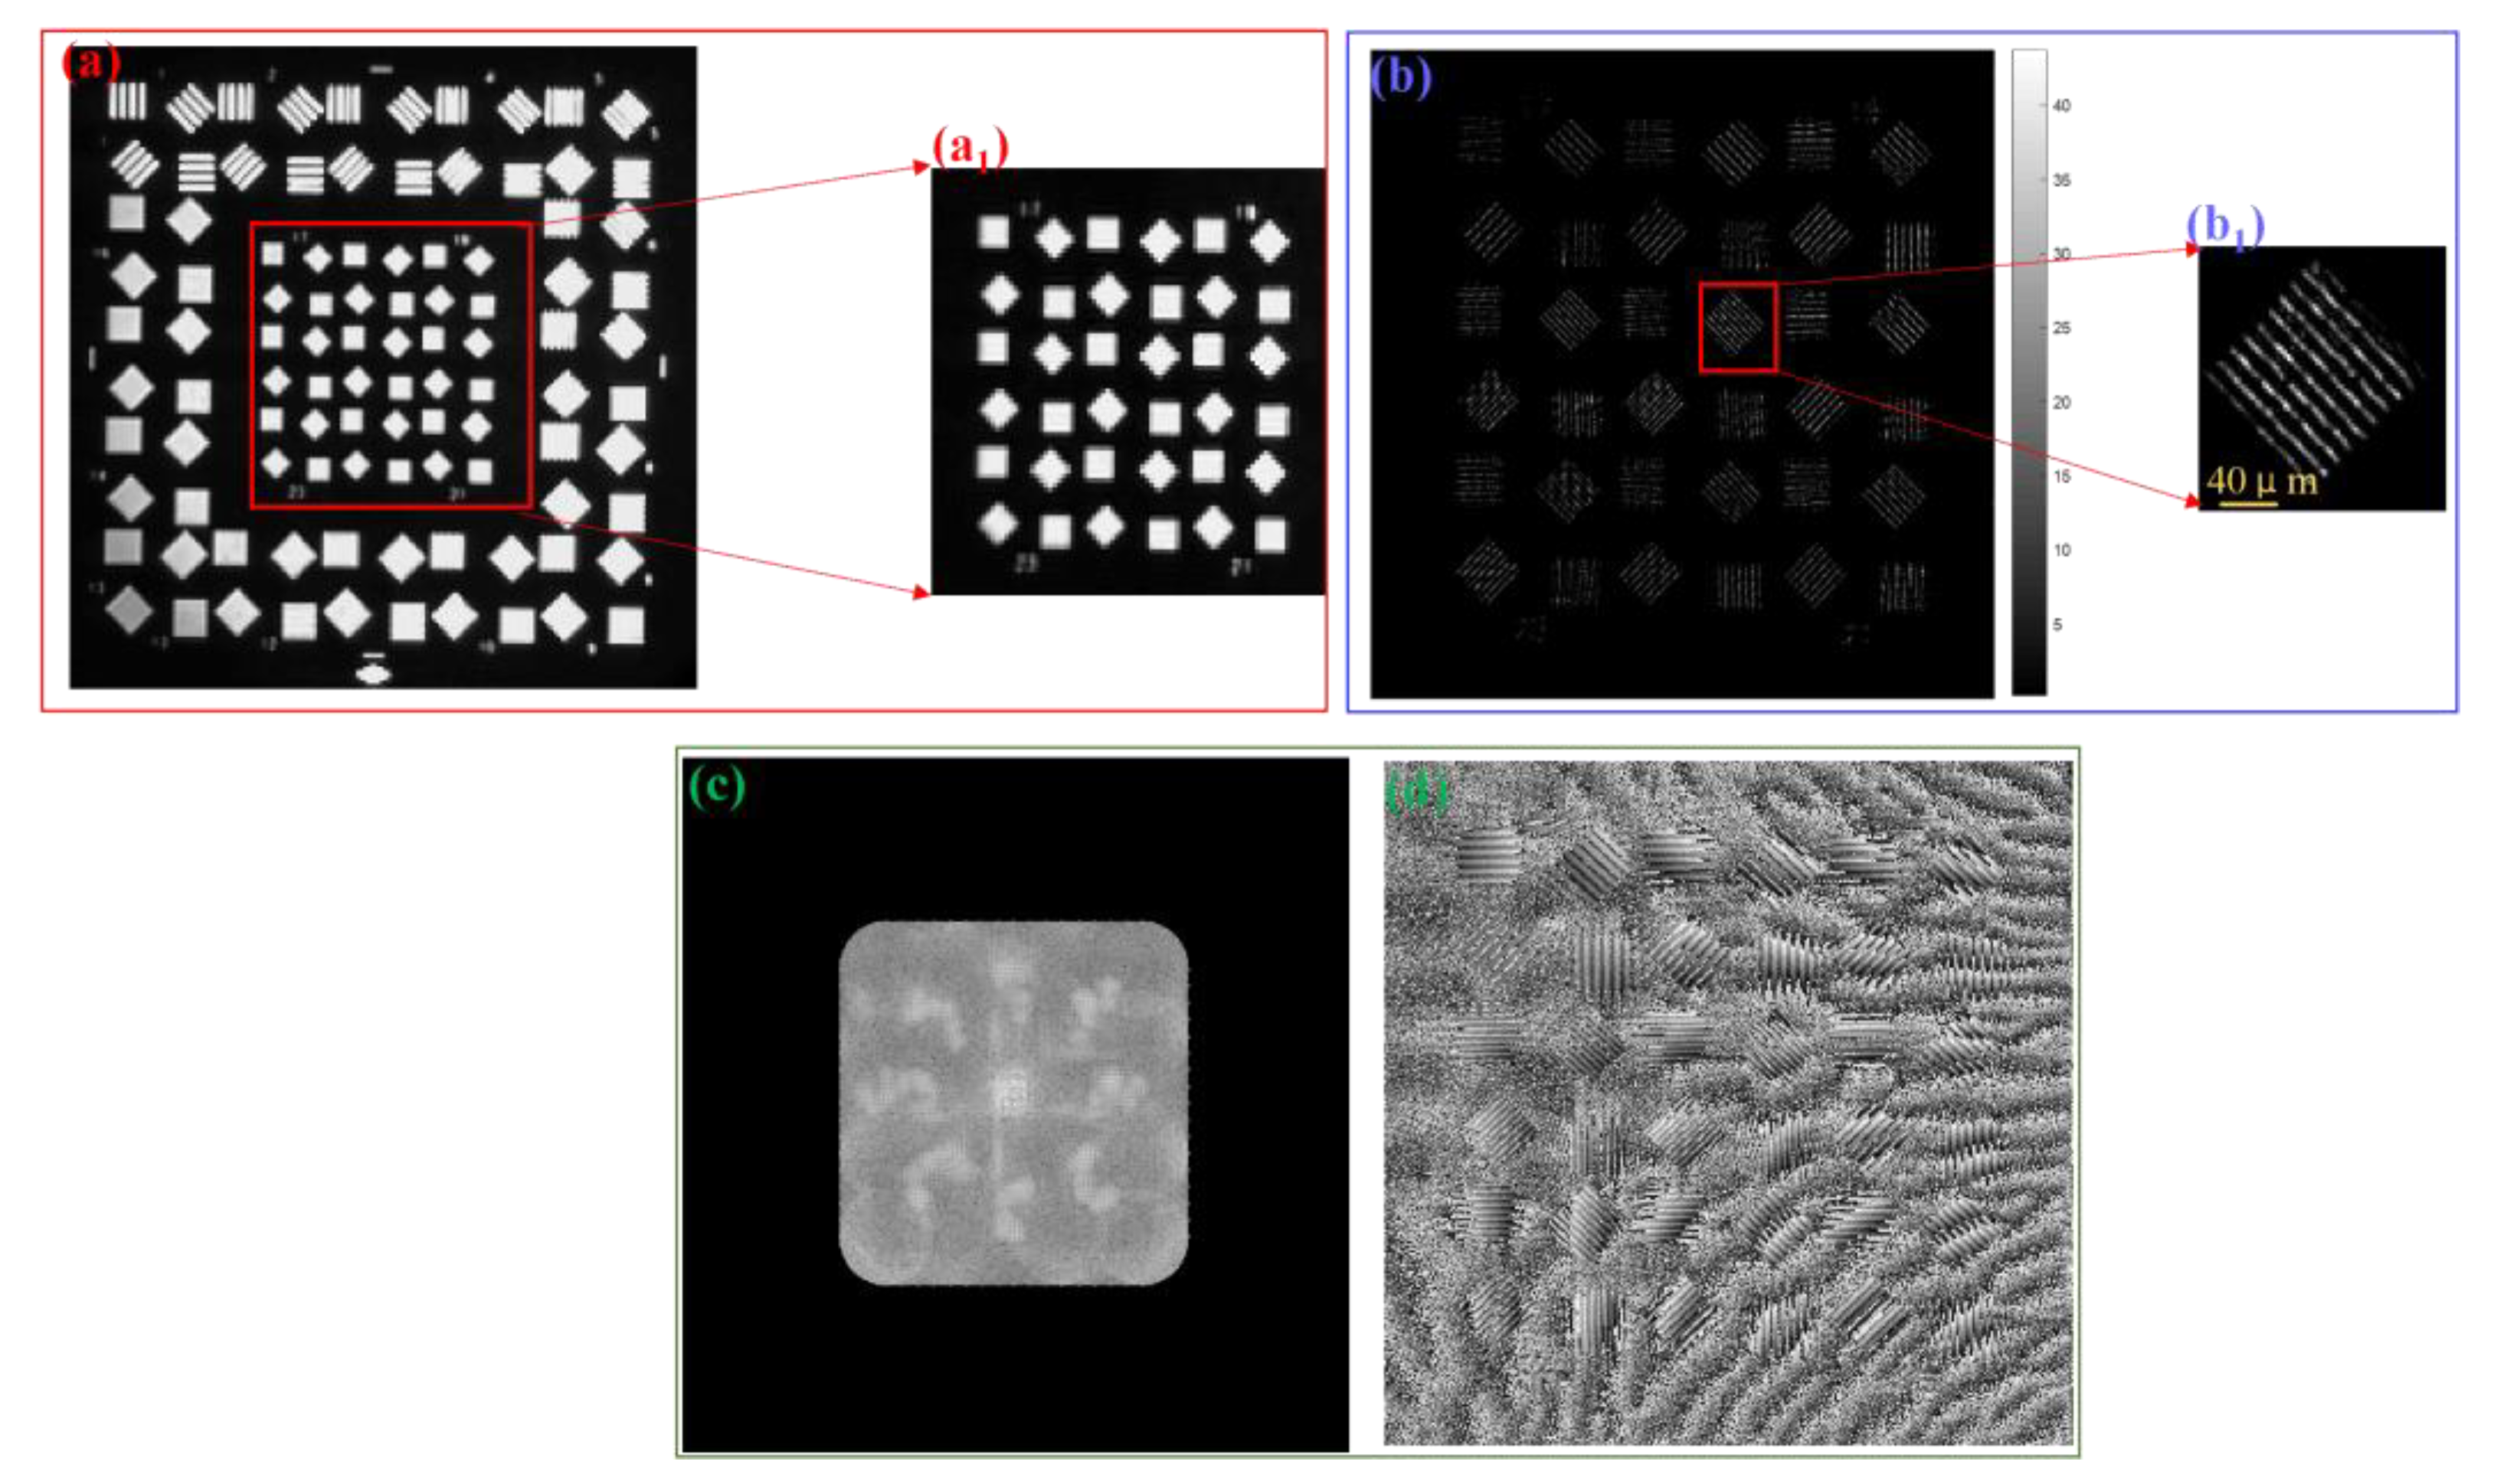
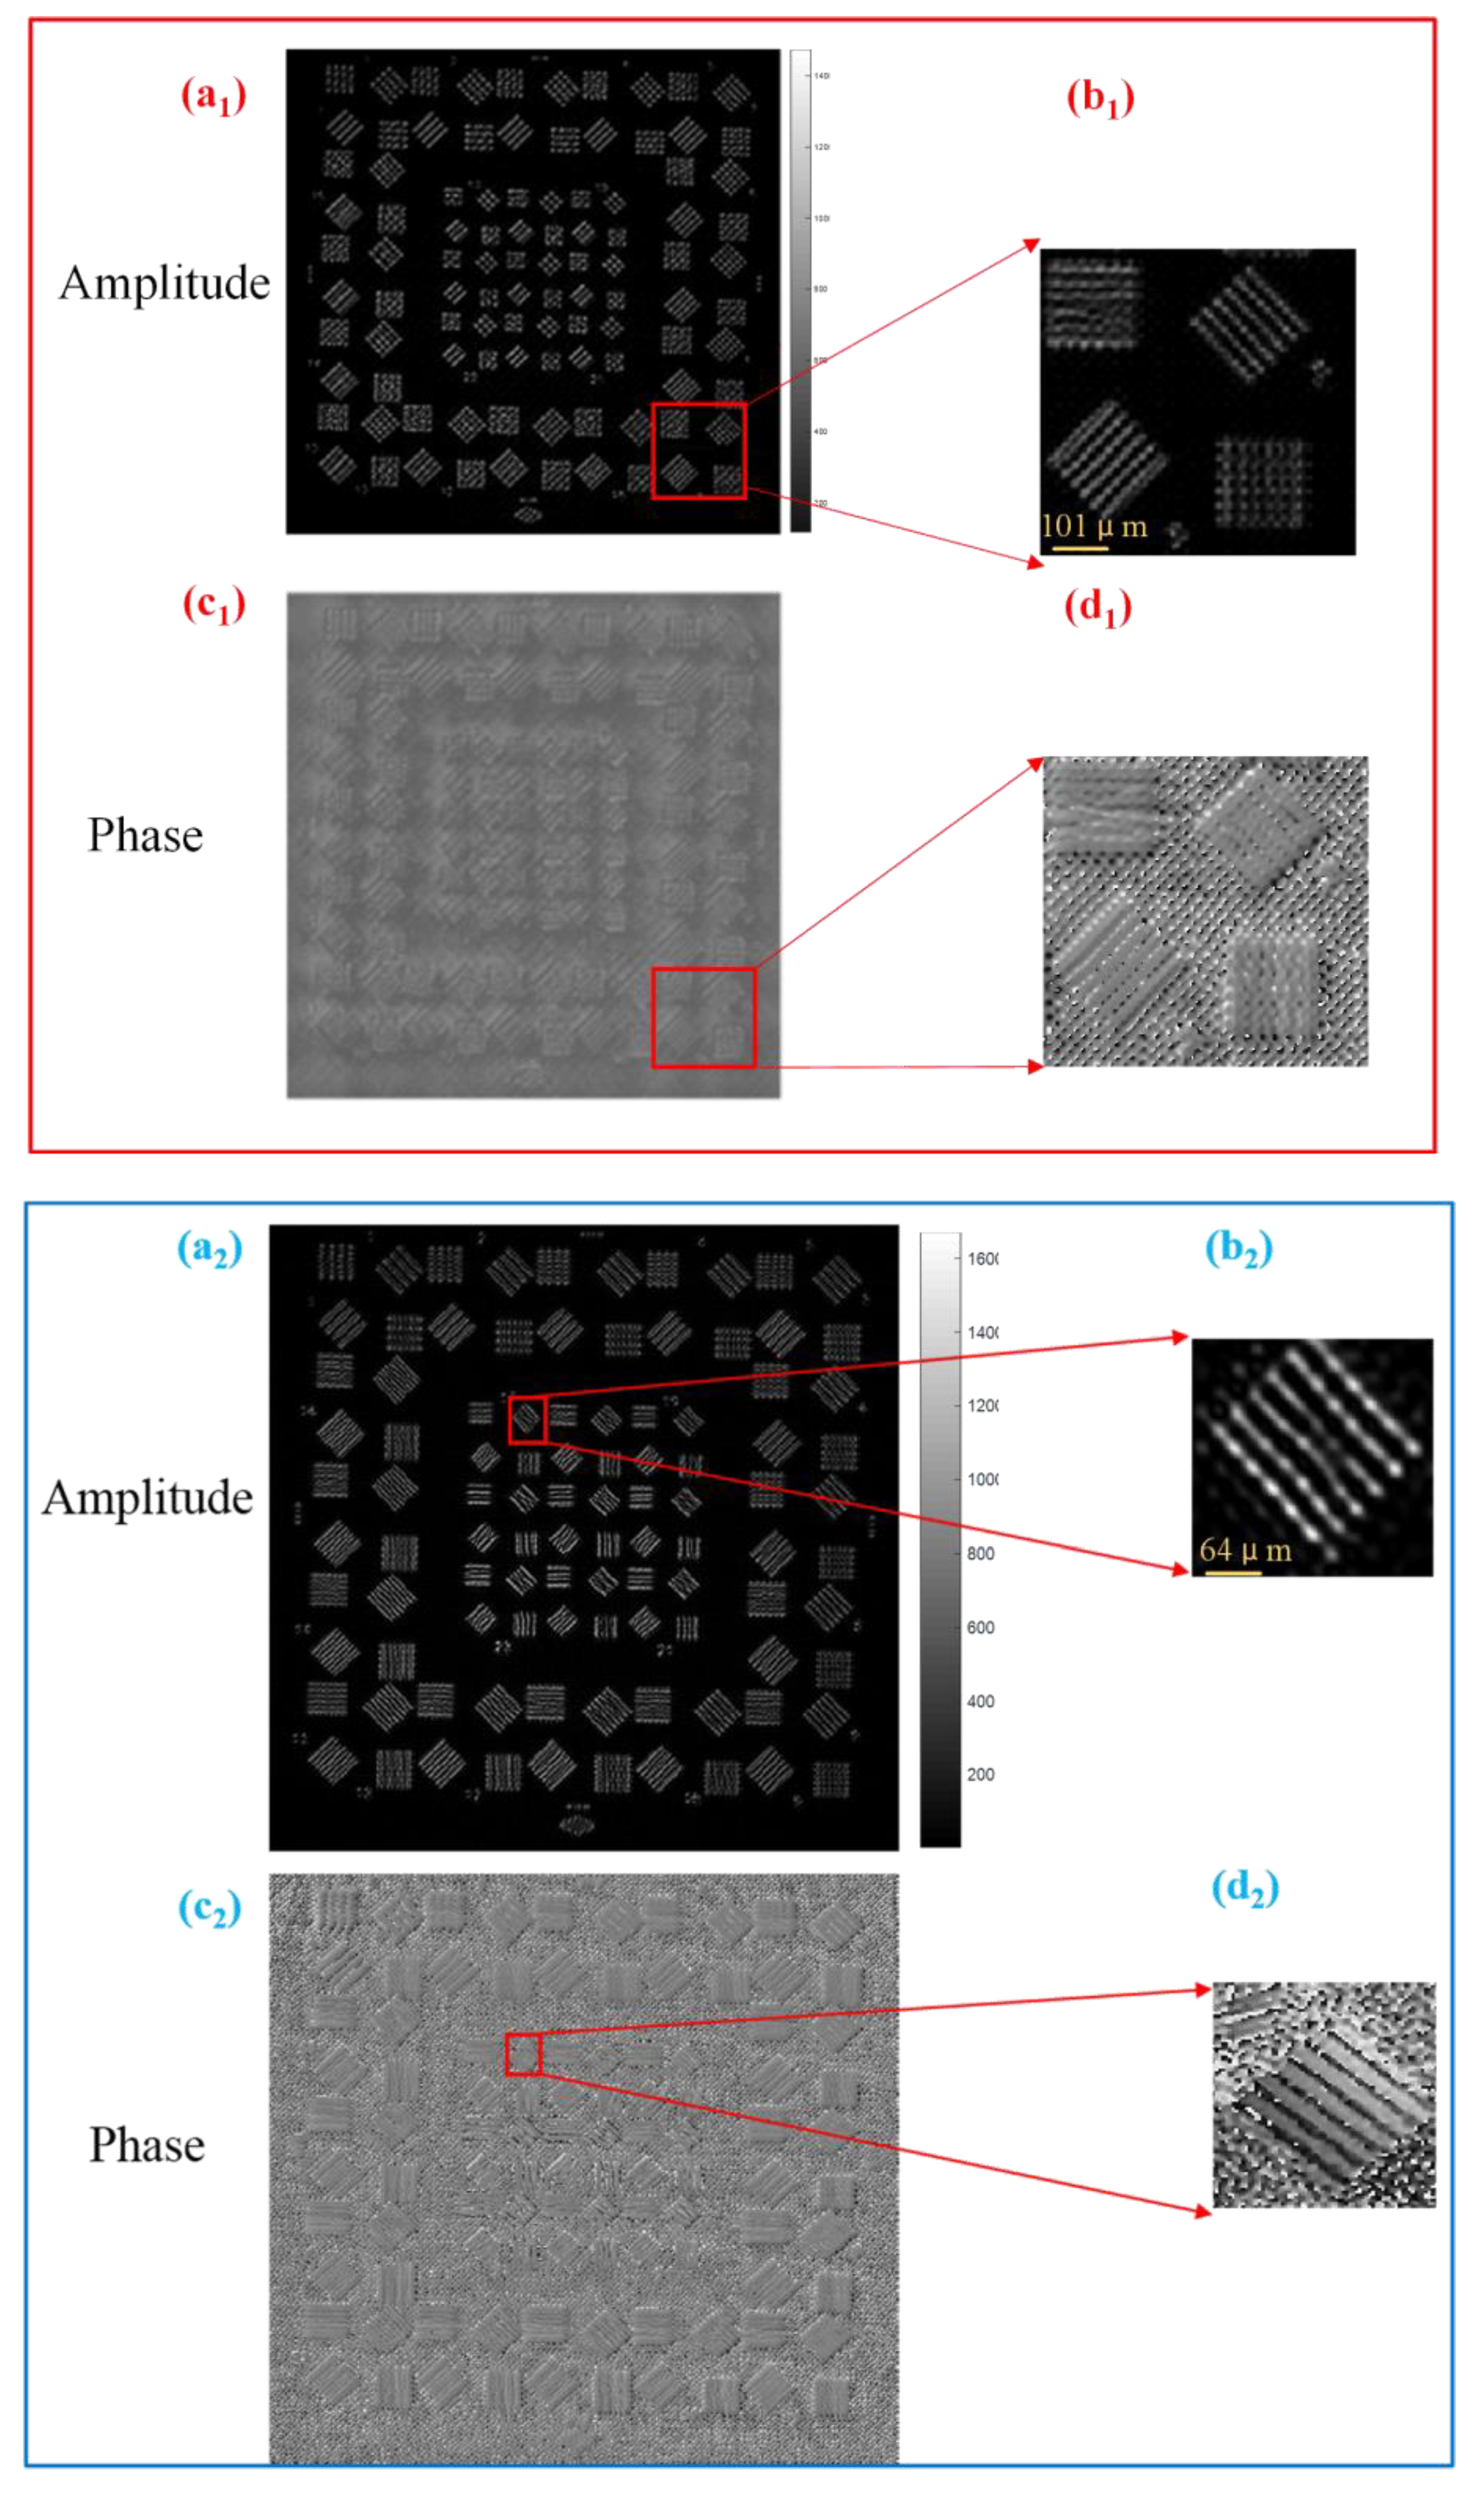
In Figure 12, the images in the red box were recovered from 225 LR images with 231 pixel × 231 pixel and a scanning step of 4.5 mm. Using a personal computer (9th Generation Intel Core i7), we found the single iteration time to be 3 s, and the data converged after 10-15 iterations. The total recovery time was approximately 30~45 s. The reconstructed detailed information of the object is shown in Figure 12(a1,b1). Figure 12(c1) shows the phase of the reconstructed HR image. Figure 12(d1) shows the zoomed-in phase of Group 9 HR image. Meanwhile, the images in the blue box were recovered from 361 LR images with 231 pixel × 231 pixel with a scanning step of 2 mm. The single iteration time was 5 s, and the data converged after 15~25 iterations. The total recovery time was approximately 80–130 s. Group 17 of the HR object (Figure 12(a2)) is shown in Figure 12(b2). Figure 12(c2) shows the phase of the reconstructed HR image. Figure 12(d2) shows the zoomed-in phase of Group 17 HR image. The recovery algorithm with a longer scanning step has a shorter running time and higher efficiency.
Comparing the experimental results with the two scanning steps (4.5 and 2 mm), we found that when the scanning step was decreased, the increase in the spectrum overlap ratio greatly improved the recovered HR image. The two experiments directly proved the validity of the simulation results along with the correctness, efficiency, and effectiveness of the imaging equations and phase retrieval algorithm.
We further processed the images with a scanning step of 2 mm with partition reconstruction, which involved cutting the image into smaller objects for reconstruction. We chose to intercept the central position objects of each LR image for reconstruction. The above algorithm was used to reconstruct the intercepted images again, and the reconstruction results are shown in Figure 13. From the results, we found that the partition reconstruction can effectively reduce the effect of the aberrations and reconstruct smaller feature with higher image quality than HR image reconstructed by full-frame reconstruction. Partition reconstruction yields better results than full-frame reconstruction. For example, full-frame reconstruction can only resolve the feature of Group 17 on the object, as shown in Figure 12, while partition reconstruction can even resolve Group 25 with a 40 μm line width of 12.5 lp/mm and a resolution gain of 4×.
Finally, LR images with different off-axis aberrations at different locations were acquired by camera scanning. Although the FP algorithm has a certain correction effect on the aberration, it is more effective to correct the aberration at different positions of the same image by using the partition reconstruction method to obtain more high-frequency image details.
To allow a clearer comparison of the image quality of the high-resolution intensity images in the three cases, we compared the resolution and calculated the corresponding signal to noise ratio (SNR) [14], as shown in Table 1. As we can tell from the table, the partition reconstruction can improve the image resolution and the SNR at the same time.

6. Discussion

In the current system, the higher the sensitivity of the camera, the higher the dynamic range images that can be captured, which provides more powerful conditions for the reconstruction of the high-resolution image using the FP algorithm. However, under the current conditions of our experimental setup, insufficient sampling of low-resolution images affects the quality of the reconstructed image and fails to recover even small resolution features. In addition, we believe that changing to a larger object or a different camera sensor may effectively solve this problem.
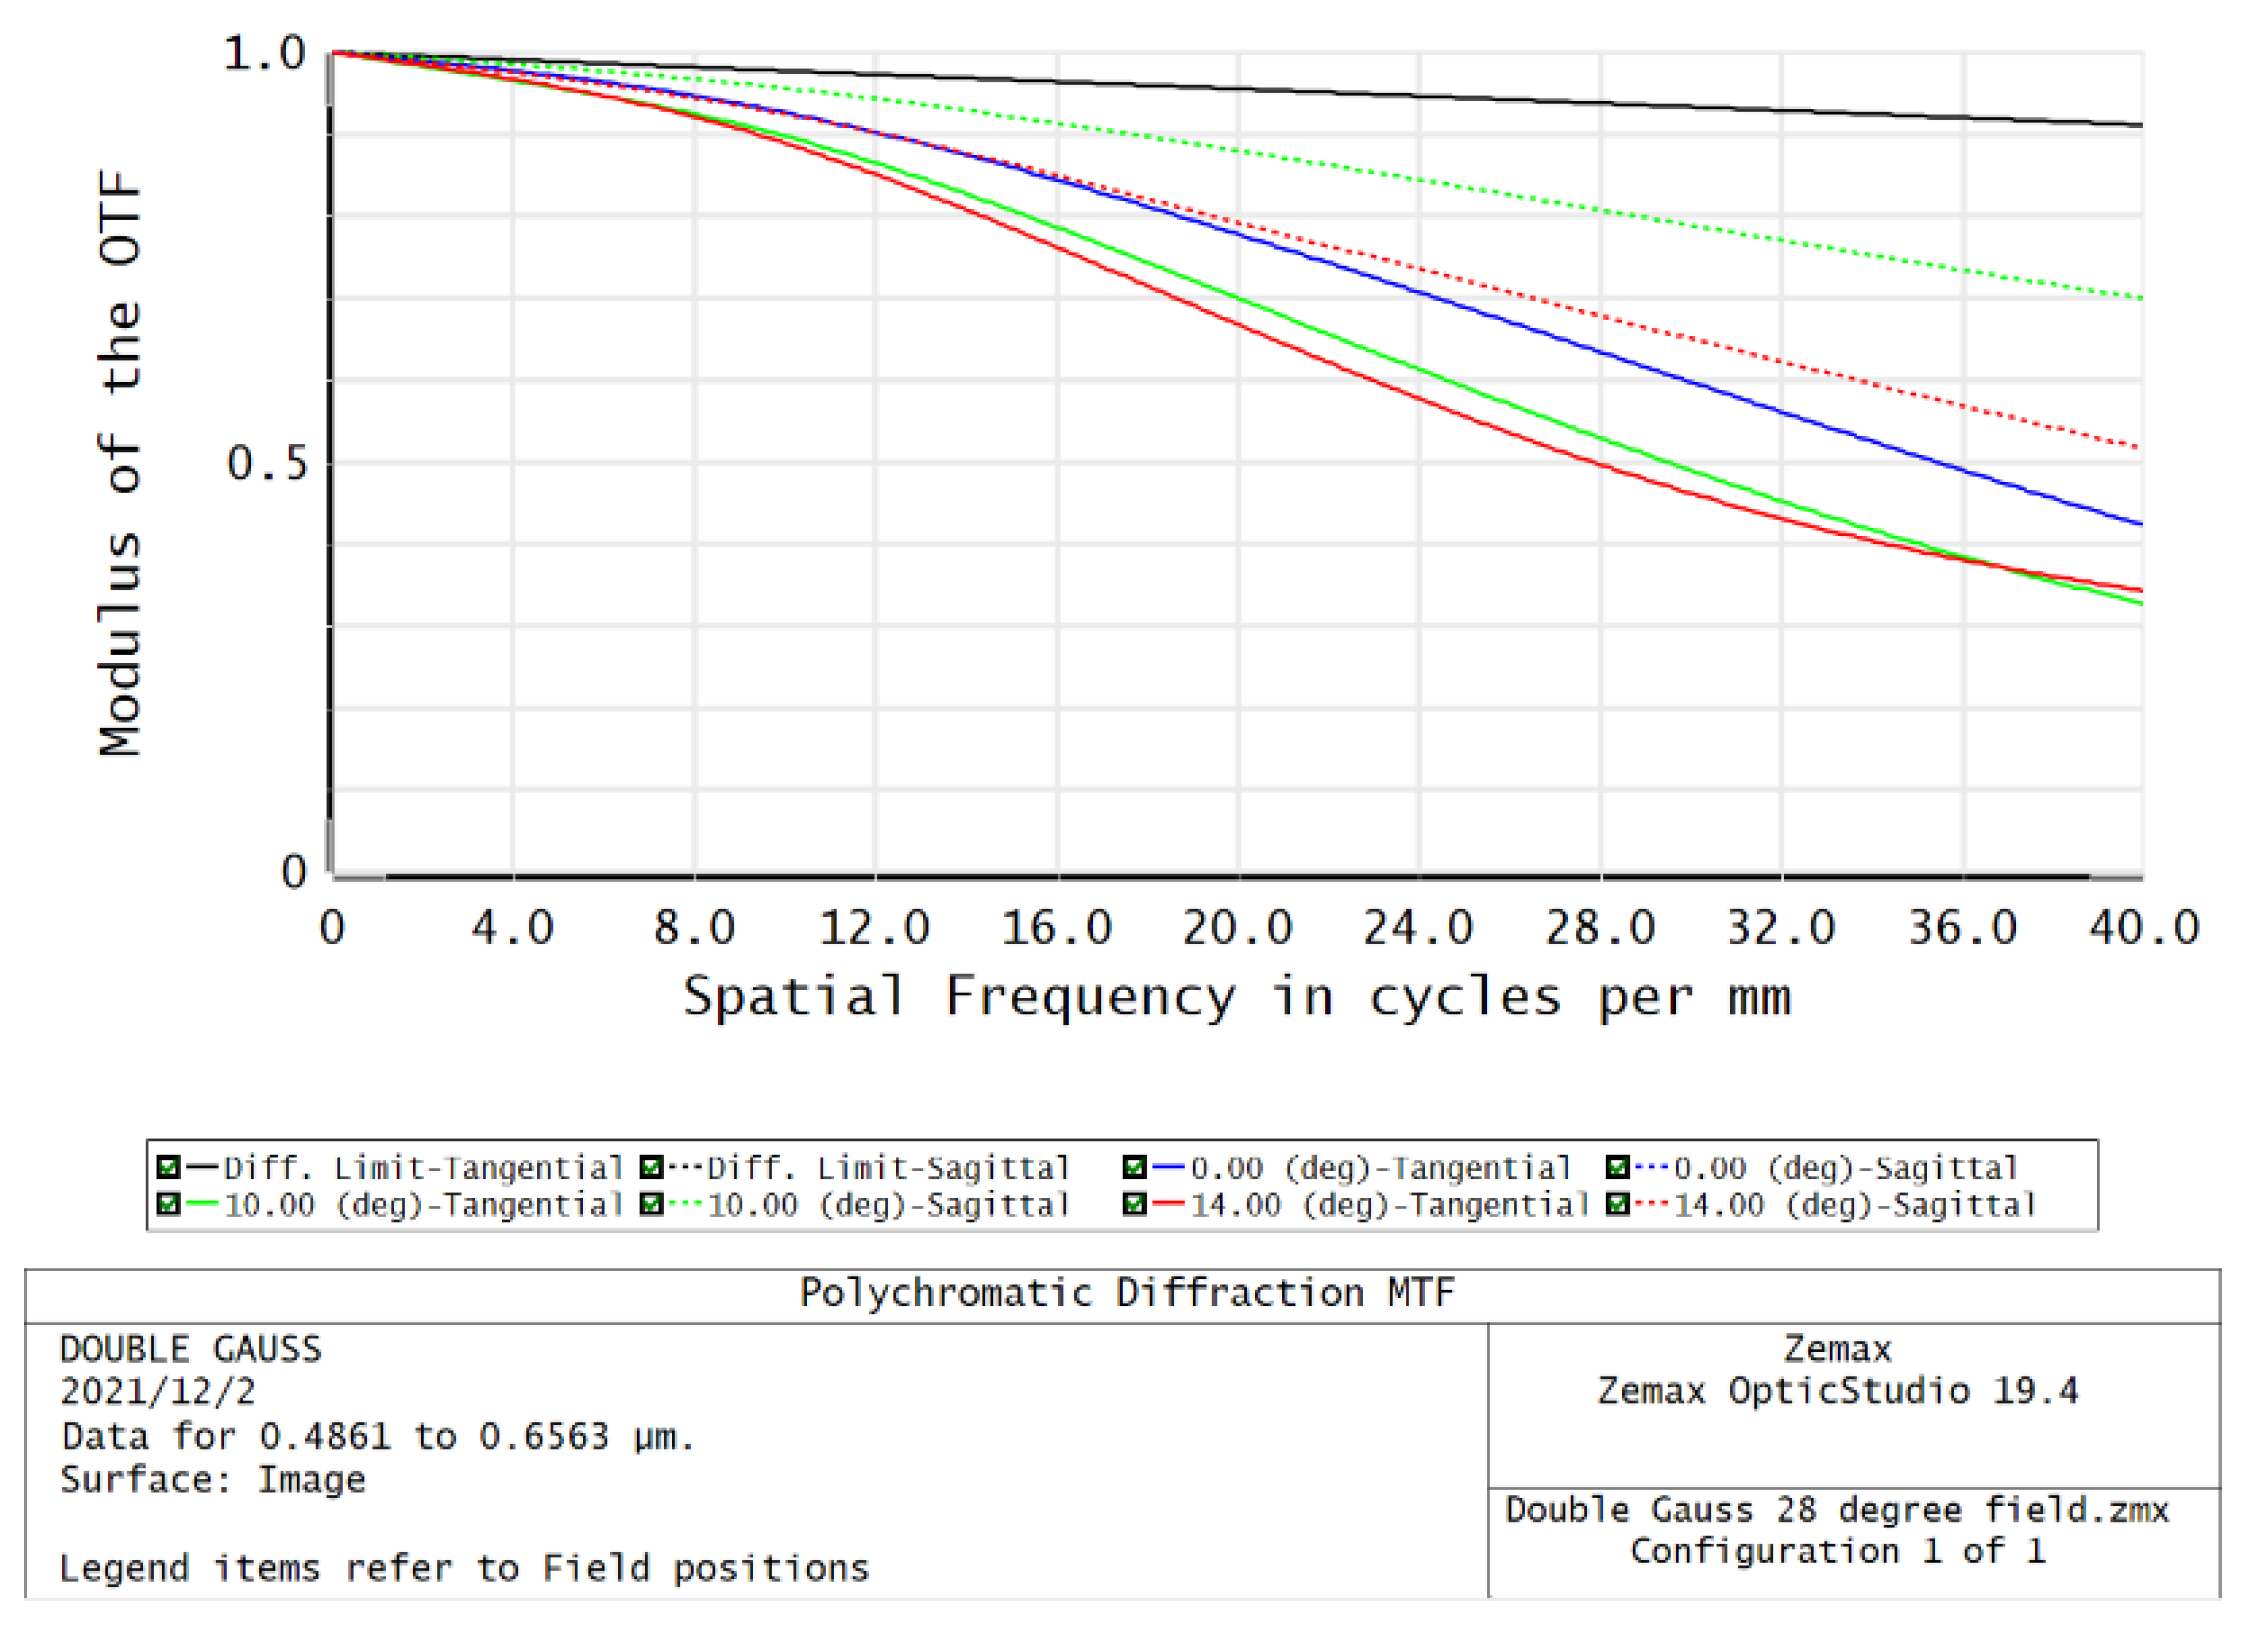
In addition, we find that the stripes in the diagonal direction can recover better, which may be caused by the imaging capability of the imaging lens. As shown in Figure 14, the modulation transfer function (MTF) of the imaging lens has different values in the S and T directions. Therefore, in a certain direction, the spatial frequency can pass well. Verification of this hypothesis will be carried out in follow-up work [15]. The Figure 14 is only a sketch map, and we can see that the imaging ability of the lens is different in different directions.
Now, while we addressed the image misalignment arising from camera movement, for far-field FP imaging, the slight position errors in the camera’s movement will change the spectrum redundancy information, and the imaging contrast may not be significantly reduced. The missing information in the Fourier plane causes obvious errors in the image reconstruction process, which may result in poor intensity images in a certain direction. Next, we plan to address this deficiency, improve the experimental conditions, and strengthen phase retrieval algorithm research to obtain higher-resolution complex images [16,17,18,19,20,21].
Another consideration that must be addressed is the relationship between the performance of the proposed technique and the associated hardware [22,23,24]. For example, the stripes in certain directions cannot be correctly resolved on the basis of the orientation characteristics of the imaging lens. Thus, we plan to improve the experimental conditions, replace the camera, and study various interference components of the system [22].
Additionally, we will adapt the active coherent illumination imaging system on the basis of the far-field FP imaging mechanism to establish a reflective mathematical model, as well as build a reflective experimental system to realize phase recovery and super-resolution [25,26,27,28]. This can overcome the limitation of the system aperture on spatial resolution improvement in the passive non-coherent imaging system, and thus will demonstrate the potential of this technology in remote sensing applications.

7. Conclusions

In this study, we extended the FP imaging technology from microscopic imaging to long-distance imaging with dramatically improved resolution. In addition, by introducing an imaging lens before the sample, we placed the Fourier transform plane at the imaging lens (and hence at the pupil function of the system). Therefore, scanning the camera + imaging lens had a clearly defined effect of shifting the PSF. This is in contrast to previous work, which affected the PSF less dramatically for each scan position [29,30,31]. First, we used the Fraunhofer diffraction theory to derive and verify the mathematical model of the proposed macroscopic FP method. The results of both simulations and experimental data showed that the proposed long-distance FP method can successfully recover HR images and improve the resolution. Second, to further validate the effectiveness of the proposed method, we tested it on two real captured datasets with scanning steps of 4.5 and 2 mm, respectively. When the image scanning step was 4.5 mm, the recovered HR image stripe width was able to be resolved up to 101 μm; and when the scanning step was 2 mm, the HR image stripe width was able to be resolved up to 63.5 μm. Finally, we further processed the images with partition reconstruction, which was even abled to resolve Group 25 with 40 μm line width with 12.5 lp/mm resolution and a resolution gain of 4×.

Author Contributions

Conceptualization, M.Y. and H.Z.; methodology, M.Y.; software, M.Y.; validation, M.Y. and H.Z.; formal analysis, M.Y. and Y.W.; investigation, M.Y., X.F., Y.W. and H.Z.; resources, M.Y.; data curation, M.Y. and Y.W.; writing—original draft preparation, M.Y.; writing—review and editing, M.Y. and H.Z.; visualization, M.Y.; project administration, X.F. and H.Z.; funding acquisition, X.F. and H.Z. All authors have read and agreed to the published version of the manuscript.

Funding

This research was funded by the Major Project on the High-Resolution Earth Observation System (GFZX04014307).

Acknowledgments

The authors thank Baoli Yao, An Pan, and Jing Wang for their help with the experiments and discussion.

Conflicts of Interest

The authors declare no conflict of interest.

References

  1. Zheng, G.; Horstmeyer, R.; Yang, C. Wide-field, high-resolution Fourier ptychographic microscopy. Nat. Photonics 2013, 7, 739–745. [Google Scholar] [CrossRef] [PubMed]
  2. Faulkner, H.M.L.; Rodenburg, J.M. Error tolerance of an iterative phase retrieval algorithm for moveable illumination microscopy. Ultramicroscopy 2005, 103, 153–164. [Google Scholar] [CrossRef] [PubMed]
  3. Dong, S.; Horstmeyer, R.; Guo, K.; Shiradkar, R.; Ou, X. Aperture-scanning Fourier ptychography for 3D refocusing and super-resolution macroscopic imaging. Opt. Express 2014, 22, 13586–13599. [Google Scholar] [CrossRef] [PubMed]
  4. Ou, X.; Chung, J.; Horstmeyer, R.; Yang, C. Aperture scanning Fourier ptychographic microscopy. Biomed. Opt. Express 2016, 7, 3140. [Google Scholar] [CrossRef] [PubMed] [Green Version]
  5. Holloway, J.; Asif, S.; Sharma, M.; Matsuda, N.; Horstmeyer, R.; Cossairt, O.; Veeraraghavan, A. Toward long-distance subdiffraction imaging using coherent camera arrays. IEEE Trans. Comput. Imaging 2016, 2, 251–265. [Google Scholar] [CrossRef]
  6. Holloway, J.; Wu, Y.; Sharma, M.; Cossairt, O.; Veeraraghavan, A. SAVI: Synthetic apertures for long-range, subdiffraction-limited visible imaging using Fourier ptychography. Sci. Adv. 2017, 3, e1602564. [Google Scholar] [CrossRef] [Green Version]
  7. Ou, X.; Horstmeyer, R.; Yang, C.; Zheng, G. Quantitative phase imaging via Fourier ptychographic microscopy. Opt. Lett. 2013, 38, 4845–4848. [Google Scholar] [CrossRef]
  8. Goodman, J.W. Introduction to Fourier Optics, 3rd ed.; Roberts and Company Publishers: Greenwood, CA, USA, 2005. [Google Scholar]
  9. Ou, X.; Zheng, G.; Yang, C. Embedded pupil function recovery for Fourier ptychographic microscopy. Opt. Express 2014, 22, 4960–4972. [Google Scholar] [CrossRef]
  10. Wang, Y.; Shi, Y.; Li, T.; Gao, Q.; Xiao, J.; Zhang, S. Research on the key parameters of illuminating beam for imaging via ptychography in visible light band. Acta Phys. Sin. 2013, 62, 064206. [Google Scholar] [CrossRef]
  11. Bunk, O.; Dierolf, M.; Kynde, S.; Johnson, I.; Marti, O.; Pfeiffer, F. Influence of the overlap parameter on the convergence of the ptychographical iterative engine. Ultramicroscopy 2008, 108, 481–487. [Google Scholar] [CrossRef] [PubMed]
  12. Manuel, D.S.; Samuel, T.T.; James, F.R. Efficient subpixel image registration algorithms. Opt. Lett. 2008, 33, 156–158. [Google Scholar] [CrossRef] [Green Version]
  13. Kuang, C.; Ma, Y.; Zhou, R.; Lee, J.; Barbastathis, G.; Dasari, R.R.; Yaqoob, Z.; Peter, T.C.S. Digital micromirror device-based laser-illumination Fourier ptychographic microscopy. Opt. Express 2015, 23, 26999. [Google Scholar] [CrossRef] [PubMed]
  14. Zou, M.Y. Deconvolution and Signal Recovery; Defense Industry Press: Beijing, China, 2001. [Google Scholar]
  15. Gardner, D.F.; Tanksalvala, M.; Shanblatt, E.R.; Zhang, X.; Galloway, B.R.; Porter, C.L.; Karl, R., Jr.; Bevis, C.; Adams, D.E.; Kapteyn, H.C. Subwavelength coherent imaging of periodic samples using a 13.5 nm tabletop high-harmonic light source. Nat. Photonics 2017, 11, 259–263. [Google Scholar] [CrossRef]
  16. Tripathi, A.; McNulty, I.; Shpyrko, O.G. Ptychographic overlap constraint errors and the limits of their numerical recovery using conjugate gradient descent methods. Opt. Express 2014, 22, 1452–1466. [Google Scholar] [CrossRef]
  17. Bian, L.; Suo, J.; Chung, J.; Ou, X.; Yang, C.; Chen, F.; Dai, Q. Fourier ptychographic reconstruction using Poisson maximum likelihood and truncated Wirtinger gradient. Sci. Rep. 2016, 6, 27384. [Google Scholar] [CrossRef] [Green Version]
  18. Sun, J.; Chen, Q.; Zhang, Y.; Zuo, C. Efficient positional misalignment correction method for Fourier ptychographic microscopy. Biomed. Opt. Express 2016, 7, 1336. [Google Scholar] [CrossRef] [Green Version]
  19. Fienup, J.R. Phase retrieval algorithms: A comparison. Appl. Opt. 1992, 21, 2758–2769. [Google Scholar] [CrossRef] [Green Version]
  20. Fienup, J.R. Reconstruction of a complex-valued object from the modulus of its Fourier transform using a support constraint. J. Opt. Soc. Am. A 1987, 4, 118–123. [Google Scholar] [CrossRef]
  21. Idell, P.S.; Fienup, J.R.; Goodman, R.S. Image synthesis from nonimaged laser-speckle patterns. Opt. Lett. 1987, 12, 858–860. [Google Scholar] [CrossRef] [Green Version]
  22. Cederquist, J.N.; Fienup, J.R.; Marron, J.C.; Paxman, R.G. Phase retrieval from experimental far-field speckle data. Opt. Lett. 1988, 13, 619–621. [Google Scholar] [CrossRef] [PubMed]
  23. Miao, J.; Charalambous, P.; Kirz, J.; Sayre, D. Extending the methodology of X-ray crystallography to allow imaging of micrometre-sized non-crystalline specimens. Nature 1999, 400, 342–344. [Google Scholar] [CrossRef]
  24. Marchesini, S.; He, H.; Chapman, H.N.; Hau-Riege, S.P.; Noy, A.; Howells, M.R.; Weierstall, U.; Spence, J.C.H. X-ray image reconstruction from a diffraction pattern alone. Phys. Rev. B 2003, 68, 140101. [Google Scholar] [CrossRef] [Green Version]
  25. Gerchberg, R.W.; Saxton, W.O. A practical algorithm for the determination of phase from image and diffraction plane pictures. Optik 1972, 35, 237–246. [Google Scholar]
  26. Guo, K.; Bian, Z.; Dong, S.; Nanda, P.; Wang, Y.; Zheng, G. Microscopy illumination engineering using a low-cost liquid crystal display. Biomed. Opt. Express 2015, 6, 574–579. [Google Scholar] [CrossRef] [PubMed]
  27. Yi, R.; Chu, K.K.; Mertz, J. Graded-field microscopy with white light. Opt. Express 2006, 14, 5191–5200. [Google Scholar] [CrossRef]
  28. Mehta, S.B.; Sheppard, C.J.R. Quantitative phase-gradient imaging at high resolution with asymmetric illumination-based differential phase contrast. Opt. Lett. 2009, 34, 1924–1926. [Google Scholar] [CrossRef]
  29. Tian, L.; Li, X.; Ramchandran, K.; Waller, L. Multiplexed coded illumination for Fourier ptychography with an LED array microscope. Biomed. Opt. Express 2014, 5, 2376–2389. [Google Scholar] [CrossRef] [Green Version]
  30. Rodenburg, J.M.; Faulkner, H.M.L. A phase retrieval algorithm for shifting illumination. Appl. Phys. Lett. 2004, 85, 4795–4797. [Google Scholar] [CrossRef] [Green Version]
  31. Bian, L.; Suo, J.; Zheng, G.; Guo, K.; Chen, F.; Dai, Q. Fourier ptychographic reconstruction using Wirtinger flow optimization. Opt. Express 2015, 23, 4856–4866. [Google Scholar] [CrossRef]
Figure 1. A model of far-field Fourier ptychography imaging based on near-infrared laser illumination with 808 nm using camera scanning; the scanning path is shown in the red box. (a) Propagation from the light source to the pupil plane; (b) propagation from the object to the camera sensor.
Applsci 12 02197 g001
Figure 2. Synthetic aperture image and CTF.
Applsci 12 02197 g002
Figure 3. Capture of low-resolution images performance using camera-scanning Fourier ptychography imaging. (a) The raw image array of the object captured directly by the camera sensor and (b) the central raw image.
Applsci 12 02197 g003
Figure 4. Super-resolution simulation using transmission far-field Fourier ptychography. (a) USAF resolution test chart; (b) the low-resolution central image was captured in the imaging plane after long-distance imaging; (c) the reconstructed high-resolution image; (d) the phase of the resolution test chart; (e) the synthetic aperture spectrum of a complex object in a Fourier space (on a log scale); (f) the actual pupil function.
Applsci 12 02197 g004
Figure 5. Relationship between the number of iterations and the RMSE of the image.
Applsci 12 02197 g005
Figure 6. Image reconstruction effect of the original image under different degrees of overlap ratio. (a) The ideal original image; (b1) the synthetic aperture under 70% overlap ratio; (b2) the synthetic aperture under 50% overlap ratio; (b3) the synthetic aperture under 30% overlap ratio; (c1) the system PSF image under 70% overlap ratio; (c2) the system PSF image under 50% overlap ratio; (c3) the system PSF image under 30% overlap ratio; (d1) the intensity image with high-resolution under 70% overlap ratio; (d2) the intensity image with high-resolution under 50% overlap ratio; (d3) the intensity image with high-resolution under 30% overlap ratio.
Applsci 12 02197 g006
Figure 7. Effect of varying overlap between adjacent images on RMSE and resolution of HR image. (a) the RMSE plot of HR intensity image; (b) the resolution plot of the different overlap ratio.
Applsci 12 02197 g007
Figure 8. Laboratory hardware configuration for images obtained.
Applsci 12 02197 g008
Figure 9. The object image and the corresponding data chart.
Applsci 12 02197 g009
Figure 10. The graph of the random distribution function of dark current; through this graph, we generated a new random dark current field.
Applsci 12 02197 g010
Figure 11. The image array is acquired by the laboratory macroscopic far-field Fourier ptychography setup with scanning pupils of 4.5 and 2 mm. (a) the image array with a scanning step of 4.5 mm and 61% overlap ratio; (b) the image array with a scanning step of 2 mm and 84.5% overlap ratio.
Applsci 12 02197 g011
Figure 12. (Top panel) The recovered experimental data when the camera moved 4.5 mm with a red frame each time. (Bottom panel) The recovered experimental data when the camera moved 2 mm with a blue frame each time. (a1) the reconstructed HR intensity image of the object with scanning step 4.5 mm; (b1) the zoomed-in HR intensity image of Group 9; (c1) the reconstructed phase of the object with scanning step 4.5 mm; (d1) the zoomed-in phase image of Group 9; (a2) the reconstructed HR intensity image of the object with scanning step 2 mm; (b2) the zoomed-in HR intensity image of Group 17; (c2) the reconstructed phase of the object with scanning step 2 mm; (d2) the zoomed-in phase image of Group 17.
Applsci 12 02197 g012
Figure 13. Reconstruction results by partition reconstruction on real datasets with scanning step 2 mm when capturing corresponding LR images. (a) the central raw image; (a1) the central raw image with partition reconstruction; (b) the high-resolution image of (a1); (b1) the zoomed-in intensity image of Group 25; and we also show the synthetic aperture and the phase details in (c,d) respectively.
Applsci 12 02197 g013
Figure 14. Diagram of the relationship between the MTF of the lens and the frequency.
Applsci 12 02197 g014
Table 1. Comparison of the experimental results.
Full-Frame ReconstructionPartition Reconstruction
Step with 4.5 μmStep with 2 μmStep with 2 μm
ResolutionGroup 9
101 μm, 4.95 lp/mm
Group 17
63.5 μm, 7.87 lp/mm
Group 25
40 μm, 12.5 lp/mm
Signal to noise ratio (SNR)25.6 dB28.6 dB32.5 dB
Publisher’s Note: MDPI stays neutral with regard to jurisdictional claims in published maps and institutional affiliations.

