Abstract
The traces of carbon fibers along the cracked surfaces of mortar prisms, being 40 mm x 40 mm x 160 mm in size, are studied, assuming that the cracked surfaces in the prisms are the places with the lowest resistance to the stresses they are exposed to. This is to explain why the prisms with 1.0% carbon fibers in volume reveal higher flexural strength than those with 0.5%, 1.5% and 2.0% of fibers. Five distinctive traces of carbon fibers, such as uprootedness, avulsion, separation, overlay and dividedness are observed in the cracked surfaces. As the percentage increases by more than 1.0%, the number of the uprooted fibers reduces, while the numbers of the divided, avulsed and separated fibers increase. The percentage increase induces more fibers to be clustered together and overlap each other to make more divided, avulsed and separated fiber traces. At the same time, the fiber strands are mixed with the mortar to a greater extent. Consequently, the crack surfaces of the prisms with fiber percentages of 1.5% and 2.0% become mostly covered with fiber-laden mortar and cemented fiber clusters. Since the cemented fiber clusters work as air pockets of various volumes and act as the inhomogeneities together with the fiber-laden mortar, the cohesiveness of the mortar is greatly reduced. The deteriorating cohesiveness of the mortar and the increased inhomogeneity cause the reduction in the flexural strength of the prisms in comparison with those with 1.0% carbon fibers.
1. Introduction
Mortar is a formulated mixture of cement, sand and water. Carbon fiber is often added to mortar to reinforce the strength of prisms made from the mortar [1]. This is due to the fact that carbon fiber’s tensile strength, which is around 4900 MPa, is much higher than that of the mortar, which does not exceed 7.4 MPa [2]. However, it is known that mortar laden with carbon fiber around 1% in volume of the “cement + sand” produces the prisms with the highest strength. Adding more carbon fibers (hereafter named as “fibers”) to the prisms does not increase strength; rather it decreases it to less than 1% [3,4]. This is understandable because the fiber in the mortar is a chemically stable inhomogeneous object. The cohesiveness of the mortar will be reduced. Increasing the amount of fibers will eventually reduce the prism’s strength. However, it is still questioned why 1% of fiber produces the highest strength. No explanation to this has been given so far, except that the structures’ strength increases [5,6,7,8]. To answer this question, the fiber traces that appear along the cracked surfaces of the prisms with different fiber contents should be identified, and their behavior should be analyzed.
Since the fiber is a very stable material, it does not induce any chemical reaction with the cement, though it is physically confined within the prism. Hence, there should be certain physical forces that are holding the fibers to stay in their places within/on the prism, even in the presence of cracks. The physical force is provided by both the bonding effect of the cement and the sandwiching effect induced by the surrounding sands bonded together by the cement. Cement is a bonding material making sands agglomerate. Cement will also be on the surface of the fibers, but they are chemically too stable to let the cement adhere firmly on them. The individual fiber has the form of a cylindrical thread a few nanometers (10-9 m) in diameter. To put it to the mortar, thousands of fibers are twisted together forming a strand that has a diameter of 7 ± 2 μm [9]. This strand is cut to a required length. Due to this small diameter, it will be hard for the strand to stay as a single entity. In most cases, the fiber strands will be in a cluster state. Since the diameter of the fiber strand is within that of the lower part of the cement grain size distribution, which is in the range of 150 μm [10], the cement particles can hardly get into the cluster. The cement grains can exist mostly on the surface of the cluster because the cluster surface is too smooth for the cement particles to stick on, even if the fiber strand is in a twisted form. The cement cannot strongly hold the fiber cluster. Hence, the sandwiching effect will be the main physical force holding the fibers to the prism.
When sands are firmly bonded together, they will also firmly hold the fibers in them. It is also expected that the fiber clusters will be held more firmly when their lengths are longer and their diameters are smaller due to their smaller volumes. However, more fiber clusters will become bigger due to them bending and folding themselves rather than staying straight as their length increases. The folded fiber clusters can work oppositely because they can also form air pockets of different sizes. Folding makes the cluster bigger. The folded fiber cluster is much less tight than the straight cluster, even if there are cement grains caught in the folded part of the fiber clusters.
As the fiber content increases, more fiber clusters will overlap, cluster together and fold themselves to make bigger clusters, i.e., fiber balls. In this clustering, folding and overlapping process, the fiber clusters can be chunked by their surface cement. The fiber balls are just fiber chunks that cannot be firmly held by the surrounding mortar because of their bigger volumes. The inner fibers in the balls can hardly make contact with the mortar or cement, but they comprise air. It is assumed that there can be many fiber balls of different sizes, many fiber clusters longer than their initial length and many folded fiber clusters. These folded clusters will also work in the same way as air pockets, and the longer fiber clusters will be separated or divided depending on their end conditions. Hence, these probably reduce the strength of the prism.
When a force is applied to the prisms in a certain direction, it flows mostly along the lowest resistance places in the force propagation direction. Since the cracked surface represents the lowest resistance places to the force, the fiber traces on the cracked surface can provide information about the reason for the flexural strength reduction when the fiber percentage exceeds a certain value, i.e., 1.0%. In the prism samples, the plane mortar parts represent one of the lowest resistance places. This is why fibers are added to the prisms. Hence, the cracked surface, which represents the lowest resistance place in the force propagation direction, will be mostly the plane mortar parts.
Since the fiber clusters are randomly aligned in a prism and the cracks on the surface will try to avoid the places where fiber strands/clusters are located, bumps appear on the surface because of the cracks bypassing these randomized localizations to find the lowest resistance places. As the fiber percentage increases, more randomized localizations of fiber clusters will be achieved due to increased overlapping and aggregating among fibers. Since the cracks are bypassing these randomized localizations to find the lowest resistance places, more and bigger bumps appear on the surface, i.e., the surface will be bumpier as the fiber amount increases. Hence, the traces of fiber strands/clusters along the cracked surface will explain why the prisms with a higher fiber content will have lower strength than those with a certain fiber amount.
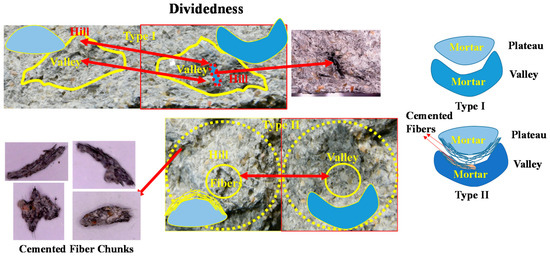
The fiber traces along the surface are classified into five groups: uprootedness, avulsion, separation, overlay and dividedness. Since the overlay can be grouped with the separation, the groups are not too different from those in the reference [11]. The uprootedness represents the trace of pulling one end of fiber clusters/strands out completely from the mortar. The avulsion is the trace of detaching the fiber cluster held by the cement from the mortar. Each of these two have two different types based on whether fibers remain in the mortar part or not for the uprootedness, and whether there are fiber vestiges in the mortar parts or not for the avulsion. Separation is the trace of separating two overlapped and aggregated fiber clusters into two parts. The overlay represents the trace of separating two overlapped fiber clusters of different directions into two parts. For the separation and overlay, one or both tip parts of the clusters are in the mortar. The dividedness represents the trace of breaking the mortar locally or fiber strand mixed mortar into two parts. This breaking is different from those in plane prisms because it appears as a set of valleys and plateaus/hills, and one or both of them contains fiber strand mixed mortar and/or s cemented fiber chunk. The resistance of these four groups to the applied force may not be too different from that of the uprootedness because they all appear on the cracked surfaces.
In this paper, to explain why the strength of the prisms with higher carbon fiber contents is reduced, five fiber traces appearing along the cracked surface are identified, and their behaviors are analyzed. For this purpose, mortar prisms with five different carbon fiber contents, namely, 0%, 0.5%, 1%, 1.5% and 2%, are prepared. For each percentage, two prism samples are used.
2. Preparation of Experiment
Carbon fiber-laden mortar prisms were manufactured to measure their flexural strengths. For this purpose, cement, sand, having grain sizes of not greater than 2 mm, and water were prepared to gain the weight ratio of 1.0:3.0:0.5. Carbons fibers having 0.5%, 1%, 1.5% and 2% volume of “sand + cement” along with polycarboxylic admixture having 1% weight of the cement were also prepared. These fibers were cut into 6 mm lengths. For each of the fiber percentages, the mixture of all these materials was prepared following the mixing procedures specified in KSL ISO 679 [12]: (1) cement and sand were mixed together for 60 s, (2) carbon fibers were added to the mixture by mixing for 90 s, and (3) water and admixture were poured into the carbon fiber added mixture, and then they were mixed together for 150 s. This mixture was turned to a prism shape by the test piece with the inner dimension of 40 mm × 40 mm × 160 mm by keeping for 24 h. After removing the test piece, the prism shape mortar was cured for 28 days in a water tank at a constant temperature of 20 °C ± 2 °C. Three prism samples for each carbon fiber percentage including the one with no fiber added, i.e., plane, were prepared in this way. Thus, 15 prism samples were manufactured.
The flexural strength measurement was performed with a universal testing machine (UTM). Three-point bending set-up was used by applying 50 N/sec force. The crack appearance on the prisms was observed with Nikon D810 placed 1 m away from the prism’s front surface so that the horizontal size of the prism surface (160 mm × 40 mm) was covered by all pixels in horizontal direction of the image sensor.
The camera has the resolution of 7360 × 4912 and a pixel size of 4.88 × 4.88 μm2. For the cracked surface observation, three different cameras were used: the D810, a mobile phone (Samsung Galaxy s20 Ultra) camera, which has the resolution of 12,000 × 9000 with a pixel size of 0.8 × 0.8 μm2, and a USB microscope with 10× magnification and 640 × 480 camera resolution. They were set to single frame mode. Since the D810 has a stable focus distance compared with the mobile phone, it was used to observe the depth of the cracked surface at a close distance. The mobile phone camera was used to examine the details of the surface due to its high resolution, and the microscope camera was used to take the magnified image of a small area of the surface. The microscope and mobile phone images have almost the same image quality. Thus, the best images were selected from these two cameras.
Each camera was set at a distance from the surface and its focus adjusted to compensate the height difference between the two pieces of the prism separated by the crack, as far as this height difference induces the size difference between the cracked surface image of left and right pieces. Hence, the surface images were digitally adjusted to have the same size. After adjusting the size, the images were overlapped with a wire grid to identify the matching fiber bundles in the left and right pieces. However, since the crack surface is not flat, the fiber clusters in slanted places often give the problem of identifying their matching clusters with the images. In this case, it was directly found from the left and right pieces. In the testing, because of a few errors in synchronizing the D810 to the UTM initiation and of the UTM operating mistakes, only two prism sample images were used to find the fiber traces in the cracked surface. In Figure 1, the experimental set-up for the flexural strength test and the cracked surfaces’ photographing are presented. The set-up consisted of three cameras, UTM and the prism samples.
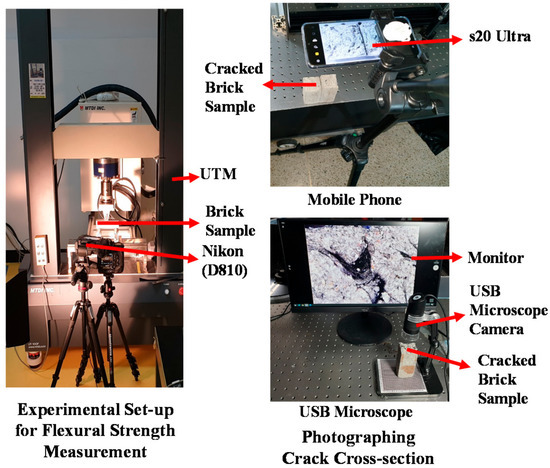
Figure 1.
Experimental set-up. Each camera is set to the single frame mode.
3. Properties of the Cracked Surfaces
As mentioned before, in a prism, the cracked surface represents the lowest resistance places in the direction of the force from the UTM. The low resistance places in the prism can be: (1) air pockets; (2) fiber balls that represent the fiber clusters; (3) the boundaries between tips of the fiber strands/clusters and the mortar, between the cemented fiber clusters, i.e., fiber clusters covered by cement, and between the cluster and the mortar; (4) the mortar laden with fiber strands; (5) plane mortars where no fiber strands exist. As explained before, the dimension of the fiber balls can be much greater than the length of a single strand, and they can also be formed by overlapping between the cemented fiber clusters.
The air pockets are observed in the plane prisms, but they almost disappear in the fiber-laden prisms. The air pockets work as a buffer zone for mitigating the internal stresses induced by the expanding and contracting of the prisms caused by the temperature changes. They are good for the durability but rather bad for the strength of the prisms. The fiber balls act as air pockets because of the air between the fibers working as the buffer zone, but the fibers themselves induce almost no internal stress because their temperature coefficient is almost zero. The fiber balls are essential for the durability of the prisms reinforced with the fibers. Nevertheless, they form low resistance places to the cracking forces when (1) their lengths are greater than that of the individual fiber strand and (2) their overlapped or folded parts are located along the force flowing direction.
Since the fiber clusters forming the fiber balls are mostly bonded by loosely adhered cement, they can be easily divided or separated into two parts. The boundaries between the tips of the fiber strands/clusters and the mortar are the places where the fibers are shallowly buried in the mortar. They can be easily uprooted from the mortar. If the fiber clusters covered with the cement and/or fiber strands mixed with the mortar are in the force flowing direction, the fiber clusters can be easily: (1) avulsed from the mortar, and (2) separated/divided from each other because the adhering power of the cement on the surface of the clusters and the cohesiveness of the fiber-laden mortar are low. Hence, it is expected that the crack will pass through the air pockets, the fiber balls, the boundaries between the fiber tips and the mortar, as well as between the cemented fiber clusters and fiber-laden mortars/the plane mortar. However, since the frequencies of these traces appearing are different for different amounts of fibers, the crack surfaces for different fiber amounts will differ from each other.
It is expected that more fiber clusters with bigger volumes will be formed as the fiber content increases. The cracked surface will become bumpier, i.e., the surface will have deeper hollows and higher humps/plateaus as the content increases. This is shown in Figure 2. Figure 2 presents a comparison of the crack lines on the bottom surfaces (1st row), the surface showing the most changes in the crack line direction (2nd row), the surface showing the longest crack line (3rd row) and the surface morphologies of the cracked surface (4th row) of the prisms with different fiber percentages. The force flowing direction is from right to left. The prism samples are identified by the description CF 0.0–2.0, where CF means carbon fiber, the 0.0 stands for the fiber percentages such as 0.0, 0.5, 1.0, 1.5 and 2.0, and the O the sample number such as 1 and 2. The 0.0 represents the plane prisms. In Figure 2, no sample numbers are given because the images have the maximum value in the same percentage samples in each row.
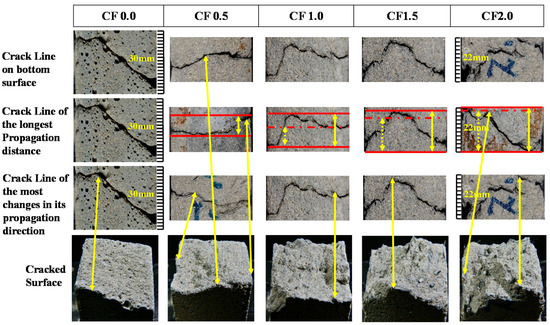
Figure 2.
Crack lines and surface roughness of the cracked surfaces of prism sample of different fiber contents.
The crack line of the CF 0.0′s bottom surface shows the longest propagation distance and the most direction changes. The distance is even longer than that of the fiber-laden samples. However, the cracked surface looks very flat compared with the fiber added prism samples. As shown in Figure 2, the crack propagation distances and the crack lines’ direction variations for the fiber-laden prism samples increase as the fiber percentage increases. The distance increase with increasing fiber percentages is specified in the 2nd row images by two solid horizontal lines. The two solid lines and a solid vertical line in each image represent the distance, while the vertical broken lines in between the horizontally drawn broken line and the bottom straight line indicate the distance of the immediate left side image.
The distances also increase as the fiber percentage increases. The increased direction variations are accompanied by the bumpier cracked surfaces. The crack lines and their corresponding edges of the cracked surfaces in the 4th row are specified by solid lines starting from the 4th row images. As the crack line shows more direction changes, the cracked surface becomes bumpier. The surface shows the increased numbers of deeper hollows and higher humps/plateaus as the fiber percentage increases. Numerous dark holes of different sizes are observed on the surface of the plane prism, but it is hard to find the holes of the same kind in the fiber added prism samples. These holes are air pockets. Holes of this kind are not noticed in fiber-laden prisms as shown in Figure 2, probably because the numbers and sizes of the holes are too small to be recognized in the fiber-laden prisms. This informs us that the overlapped and folded fiber bundles absorb most of the air in the prism and act as air pockets as in the plane prism.
The flexural strengths of the prism samples of different fiber contents are shown in Figure 3. The horizontal axis is the crack gap in mm and the vertical axis the applied forces in kN (Kilo-Newton). The value of 40 μm corresponds to a pixel width of the Nikon D810. The force initiating the crack is almost the same for samples CF 0.0-, CF 0.5- and CF 1.0-, but CF 1.5- and CF 2.0- show 0.64 kN and 0.17 kN differences between samples, respectively. In fact, the flexural strength of CF 2.0- is within those of CF 1.5-1 and CF 1.5-2. However, the average strength of CF 1.5- is around 3 kN and that of CF 2.0 is 2.9 kN. CF 1.5- appears to be slightly higher than CF 2.0-. The average flexural strengths of CF 0.0-, CF 0.5-, CF 1.0-, CF 1.5- and 2.0- are 1.2 kN, 2.25 kN, 3.9 kN, 3.0 kN and 2.9 kN, respectively.
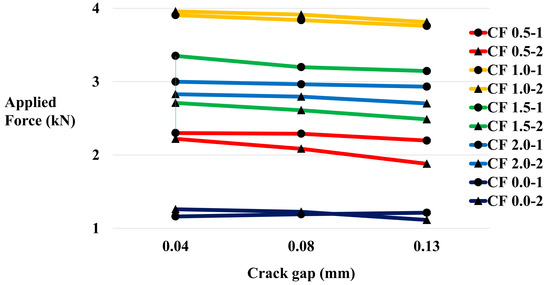
Figure 3.
Flexural strength of prism samples of different fiber percentages. CF 1.5- shows most variation for different samples.
The strength reduces as the gap increases, though the speed of reducing is different for different samples. This speed difference is caused by the presence of the fibers along the crack path. The CF 1.0 samples show the highest strength.
As mentioned before, the fibers along the cracked surfaces reveal four distinctive fiber traces such as uprootedness, avulsion, separation and dividedness. There is also an overlay type trace. The uprootedness, avulsion, separation and dividedness pave the crack path by pulling out the tips of the fiber clusters from the mortar, detaching the fibers completely from the mortar, separating a cemented fiber cluster from the other cemented fiber clusters and breaking either the mortar or fiber strand mixed mortar into sets of a valley and a plateau/hill form, respectively.
Figure 4 illustrates these five traces. The uprootedness and avulsion have two different types, the separation has three different types, the overlay has only one type, and the dividedness has two different types. The two types of the uprootedness are: (1) the pulled-out fiber bunches on one side and a grooved mortar area, where the fiber bunches are pulled-out, on the other side; (2) the grooved mortar area is also filled with fiber bunches in it. However, the second type is more frequent. The scale of the uprootedness is very small compared with other traces because of the involvement of the tip of a fiber cluster and a small groove.
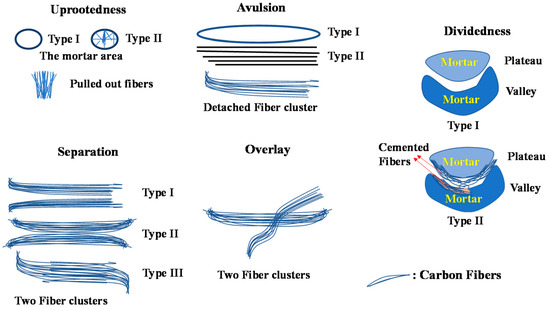
Figure 4.
Fiber traces found from the cracked surfaces of prisms. The avulsion, separation and overlay are caused by fiber cluster.
For the avulsion, a completely detached cemented fiber is on one side and (1) a trace of the fibers or (2) no trace of the fibers is on the other side.
The separation occurs when either a cemented fiber cluster on each side is overlapped almost in parallel or only a tip part of each side fiber clusters is overlapped with each other. The former includes two types: (1) a cemented fiber cluster with its one tip on one side of the mortar and another cemented fiber cluster with its one tip on the other side of the mortar, and (2) a cemented fiber cluster with both tips on one side of the mortar and another cemented fiber cluster with both tips or one tip on the other side of the mortar. The latter represents the third type. It is considered that the avulsion, separation and overlay are the traces appearing within the full length of the fiber strands because of the lack of tying two fiber strands/clusters together. However, the length can be more than the full length due to the lined overlapping of the fiber clusters held by the cement.
The dividedness represents breaking between a plateau/hump shape in the mortar on one side and a hollow shape in the mortar on the other side because (1) they are composed of plane mortar with either fibers underneath or no fibers, and (2) either the plateau/ hump or the hollow is composed of cemented fiber clusters, or both of them are. The first case will take the most parts of the cracked surface as the number of humps/plateaus and hollows increases with the fiber content increase. The second case also increases with the increase in the fiber content.
The overlay represents a special case in the separation when cemented fiber clusters on each side cross each other. In Figure 5, the fiber traces in the cracked surfaces corresponding to the illustrated traces in Figure 4 are shown. The illustrated traces are also overlapped to their corresponding traces in Figure 5 to show the validity of the illustrated traces. The broken circles and specific patterns in Figure 5 represent the corresponding area of the left- and right side images. The edge lines in the right side image are drawn to show the boundary between the left- and right side images. The force flowing direction is from the top to the bottom of the images.
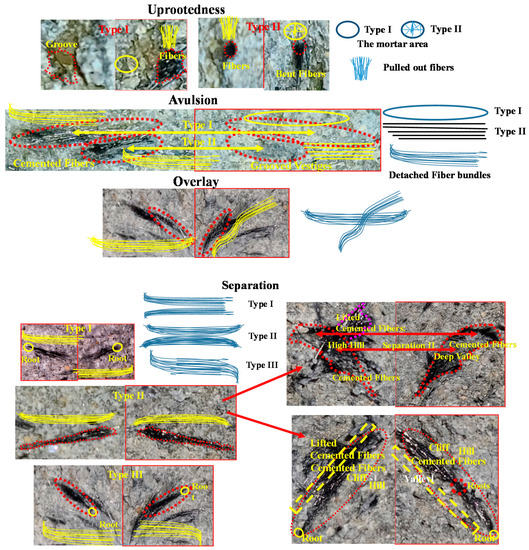
The uprooted and avulsed images are from CF 0.5-1. For the case of the uprootedness type I, the dotted circle that corresponds to the occupied area of the uprooted fibers reveals a part of a grooved mortar area. The mortar filling the grooved area was probably detached from the prism in the uprooting process together with the fibers on the right side. This is because a part of the uprooted fibers shows cemented tips. The gray spots in the circle specified by “Fibers” in the right side image represent the cemented tips. This uprootedness can be considered the small-scale avulsion. For the uprootedness type II, the uprooted fibers in the left side are coming from the groove/hollow in the right side but the groove is still filled with fibers. These fibers are rooted under the groove/ hollow. This type may not be different from the separation type III trace, except for the presence of a groove/hollow.
The avulsion and the separation are not too different from each other. The former is the separation of a cemented fiber cluster from the mortar, while the latter is the separation of a cemented fiber cluster from another cemented fiber cluster. The cemented fiber clusters are the source of these two traces. Hence, they can be treated as one kind. These two traces will appear more as the fiber content increases.
For the avulsion, the fibers on the left side are somewhat covered with cement that appears as a white/gray color on the fiber. These fibers are grouped as a cluster by the cement and are stuck to the left side. These cemented fibers are altogether avulsed from the right side but there is no visible vestige for both the top and the bottom. The former represents types I and the latter type II. For type II, the vestige is often grooved. No vestige in type I avulsion indicates that the cemented fiber clusters are probably not attached but simply lie on the mortar. If this is the case, the type I avulsion will represent the smallest resistance place in the cracked surface. The avulsion will not be too different from a bigger scale uprootedness.
The overlay image is from CF 1.0-2. As shown in the image, the left side and right side fibers are not completely overlapped with each other. The right side fibers are cemented ones, though only vague traces of cement are left there, and its bottom part is avulsed and slightly separated above the bottom part. The left side fibers are cemented. They are stuck in place. These two fibers are partly overlapped and then separated.
For the case of the separation, the left side and right side fibers are cemented and aligned almost in parallel to each other. The type I and II images are from CF 0.5-2. The type I image shows that the left- and right side fibers are aligned nearly symmetrically. The left-side fibers are rooted from the left side, and the right side ones are rooted from the right side as specified by circles, while their inner sides are not bounded to any place. The two fibers in the type II image are also cemented ones, though the traces are seen vaguely. The right side fiber clusters are in the bottom of a deep hollow and the left side ones are on the top of a high hump/plateau. The lengths of these fiber clusters are much longer than that of a fiber strand. This means that the fiber in each side is formed by two fiber clusters. In each side, fiber clusters are stuck to their positions, and the two tips of each fiber cluster in each side are buried into the mortar because, on both sides, the fiber clusters are cleanly divided with a faint trace of cements.
Two more peculiar examples of separation II found in CF 1.5-, but not from the samples listed in Figure 3, are also shown in Figure 5. The two right side images of the separation type II show that large relative positions and shapes are mismatched between the matching fiber clusters in the left- and right side images due to the involvements of a high hill and deep hollow. In the top image, the length of the cemented fiber cluster on the right side is two times greater than that of the fiber strand, and it is in a deep hollow with the shape specified by the broken pattern.
On the left side there are cemented fiber clusters that make a high hump, and they will fit into the hollow. Hence, their length will not be shorter than that of the right side one. Each of them makes a large fiber cluster. It is considered that the hump part specified by the same broken pattern on the right will mostly fit to the fibers in the bottom of the hollow, while the other parts of the fiber clusters will fit into both of the steep slope sides of the hollow. The lifted fibers can be a part of the fibers attached to the cemented fiber bunch on the right side as indicated by gray dots representing cement. In the process of separation, they detached later than the others did. In this regard, this separation can be a small-scale dividedness type II. However, while the cracked surface becomes bumpier as the fiber content increases, the scales of the dividedness can be smaller than that of the separation type II because of the compact clustering of cemented fiber bunches.
In the bottom image, the fiber bunches have almost the same length as those in the above image. Moreover, the relative positions and shapes of the matching fiber clusters look very different from each other compared with the above image due to their location on the steep slopes of the high hump and deep hollow. They are long fiber clusters composed of more than two lined fiber clusters on the steep slope of a hump. Hence, the force reaching the bottom of the hump will change its direction and propagate along the steep slope to reach the hill top. The fiber clusters on the steep slope are pushed away to be separated into left and right pieces by the applied force. This is the uniqueness of this type of separation. Since the hump in the right(left)-side image matches the valley in the left(right)-side image and cemented fiber bunches are on the steep slope, the fiber clusters in the right will be situated on the top left of the left side fiber cluster. Hence, the lifted fibers on the left side are detached from the place in the left side fiber clusters, where the arrow points.
The type III image of the separation is from CF 1.0-2. The left and right fibers are cemented and aligned nearly symmetrically, but they are rooted oppositely as specified by the circle. The unburied tip of each fiber is overlapped with each other, and they are cemented together. However, they are easily separated when force is applied due to the low cohesive power of the cement on the fiber. Type III separation may resist more than the type III avulsion, but it will also have a very low resistance to the force. The long-lined fiber bunches indicate that the buried tip part of the fibers’ resistance is greater than the cement’s cohesiveness.
The dividedness appears at bigger scales than the other three traces mentioned above because plane mortar and many fiber clusters are involved in the formation of a hump/plateau and a hollow. The presence of a hump/plateau and hollow often causes relative mismatches in the positions and shapes of the matching fiber clusters on the left and right sides.
The dividedness is classified into two different types. The first type is the breaking of mortars as shown in a trace in CF 0.5-1. This consists of a hump and a hollow, and a hollow and a hump, respectively, as shown in the left and right images. The matching positions of the two images are designated by two-sided arrows. No fibers are visible in this image. It is just breaking between plane mortars. As explained before, breaking appears in the process of finding the lowest resistance place, i.e., finding no fiber-imbedded places. It is shown that fibers are imbedded underneath each cracked surface. The part marked by a dashed rectangle is dug to see the fibers underneath. As expected, fiber chunks appeared as shown in the far right side images. However, for the left side image, the underneath fibers are not identified. It is just the plane mortar.
For the second type, the dividedness appears as a hollow on one side and a hump on the other side, but either one of or both of them will contain cemented fiber clusters, i.e., fiber chunks. The type II example is a trace in CF 1.0-1. It is breaking between the cemented fiber clusters on the left and cemented fiber strands on the right, i.e., the left side ones have fiber chunks emerging and the right side ones cemented fiber strands and small fiber clusters. The hump in the left side image is mostly formed by a group of cemented fiber clusters. The dark spots in the left side image are mostly parts of the cemented fiber clusters. They are exposed because the cement on them peeled off in the process of breaking. The dark spots in the right side image are mixed with uprooted fiber clusters and parts of fiber strands/clusters lying parallel to the crack surface. These fibers are in the mortar. The cemented fiber bunches on the right side will be rooted from the mortar because they are buried in the mortar.
Four fiber chunks from different prism samples are shown on the left side of Figure 5. Two stretched chunks on top can reach up to 16 mm in length. This means that there are at least three overlapped fiber clusters. Two bottom chunks are nearly 6 mm long. They are most likely formed by folding.
The type II dividedness appears to be more appropriate to figure out the role of fibers in weakening the flexural strength of the prism samples than the type I. Since the cracked surfaces will be more laden with fiber clusters/strands, they become bumpier as the fiber content increases. Consequently, the type II dividedness will increase more but the type I will reduce. The fibers appearing on the cracked surfaces will be one of the five traces shown in Figure 5. This is explained in the following section.
4. Fiber Traces on the Cracked Surfaces
The fiber traces on the cracked surfaces of prism samples with different fiber contents can provide essential clues to explain the reduction in flexural strength when fiber contents exceed a certain amount. For this purpose, the fiber traces on the cracked surface of each prism sample are scrutinized. Figure 6 presents both sides’ cracked surfaces of CF 0.0-1 and 2. The surfaces of both samples reveal many air pockets of different sizes. The dark spots are mostly air pockets. Two-sided arrows designate the matching broken pieces of few air pockets. It is hard to identify the matching pieces of the broken air pockets because most of the breaking appears at the top edges of the air pockets. The ratio of the area occupied by the air pockets in the cracked surface to the total area of the cracked surface is expected to be the highest among the prism sample cross sections parallel to the force propagation direction.
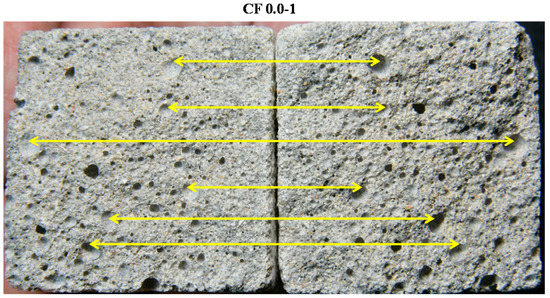
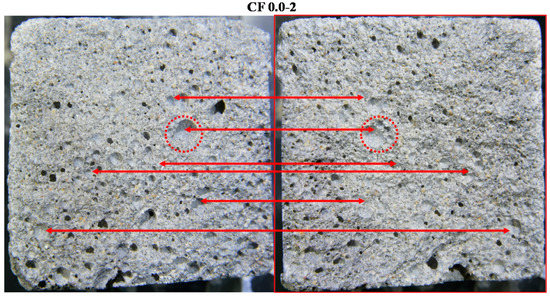
Figure 6.
Cracked surfaces of both sides. The dark spots represent air pockets.
Figure 7 shows the top view of the cracked surfaces of both pieces of each fiber-added prism sample listed in Figure 3. To identify the matching fiber bunch in the left and right pieces, and the length of the cluster, a square grid pattern is drawn on each image. The pattern consists of seven lines with 6 mm distance between them and one more line added with 4 mm distance in both the horizontal and vertical directions to cover the cracked surface of 40 mm × 40 mm. The 6 mm corresponds to the length of each fiber strand. The cracked surfaces are just plane mortar with occasional dark spots. The dark spots in these images represent fiber clusters. For the case of CF 0.5-, these dark patterns are not very noticeable but become more noticeable and of bigger sizes as the fiber content increases, though the difference between CF 1.5- and CF 2.0- is hardly recognizable.
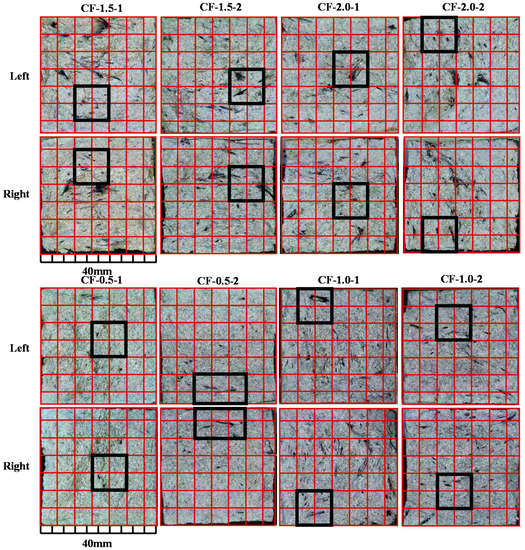
Figure 7.
Cracked surfaces of prism samples of different fiber contents: the dark squares and rectangles represent sampled areas.
The dominant traces for the prism samples of different fiber percentages for a selected area of each sample are shown in Figure 8, Figure 9, Figure 10 and Figure 11. Each of these figures shows the magnified images of corresponding left and right sides for each of two same fiber percentage prism samples. Each image shows the fiber traces within a 12 mm × 12 mm size area that corresponds to four squares in the grid pattern. The area is divided into regions by its surface relief. The solid lines in the image are boundary lines of the regions. The number of these regions indicates the roughness of the area. The size is good for showing details of the patterns in the area. However, the six bottom squares with the darkest patterns in the cracked surface are selected for CF 0.5-2 to compensate for the small number of traces in CF 0.5-1.
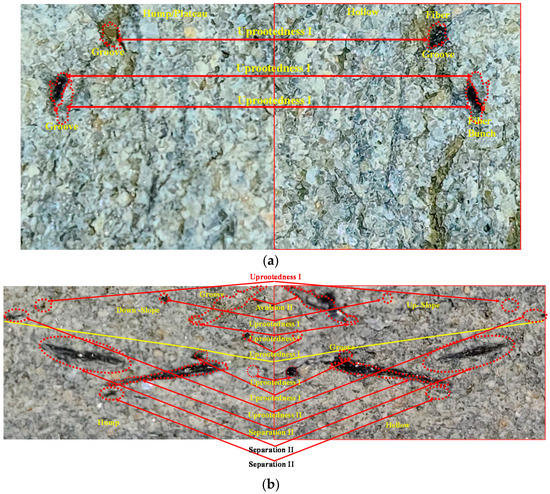
Figure 8.
Fiber traces on the cracked surfaces of CF 0.5. (a) CF 0.5-1, (b) CF 0.5-2.
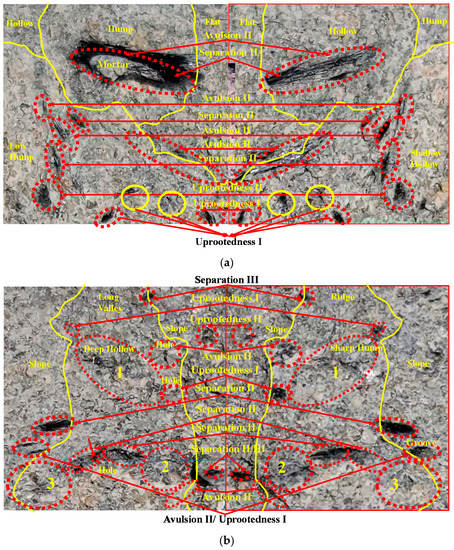
Figure 9.
Fiber traces on the cracked surfaces of CF 1.0. (a) CF 1.0-1 (b) CF 1.0-2.
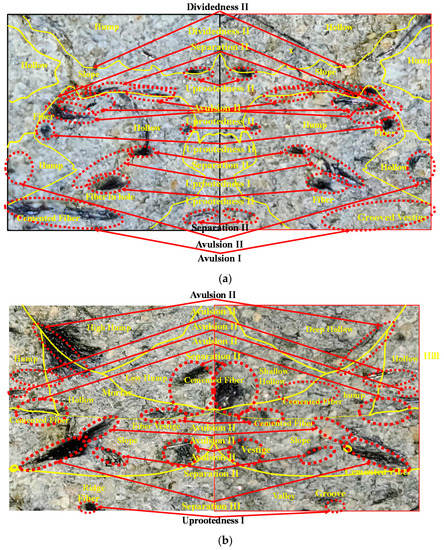
Figure 10.
Fiber traces on the cracked surfaces of CF 1.5. (a) CF 1.5-1, (b) CF 1.5-2.
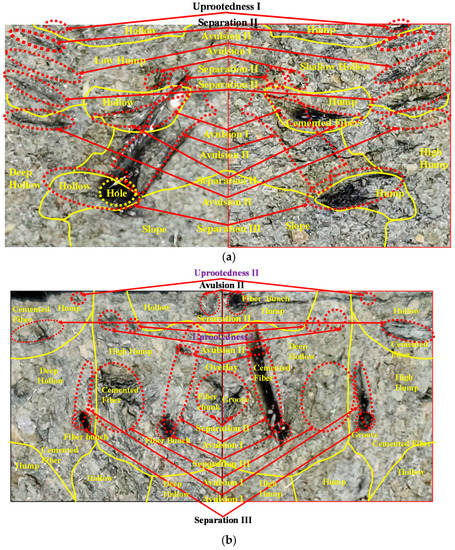
Figure 11.
Fiber traces on the cracked surfaces of CF 2.0. (a) CF 2.0-1, (b) CF 2.0-2.
This also shows the full shape of the patterns that are located across two adjacent squares in the grid. In addition, when counting the number of divides, the slope and slow varying areas at the edge of a sampled area are omitted from the counting because they will be a part of hollows or humps in neighboring areas of the sampled area, and they are almost flat. In these images, the matching areas and the type of each trace are marked by dotted ellipses and a broken/solid both-sided arrow, respectively. The name of the trace is written above each arrow, as well as the features of the cracked surfaces. Roman numbers at the end of each trace name indicate the type. The areas selected to show the traces are specified in Figure 7 with thick lined squares and rectangles.
Figure 8 shows the details of the fiber traces in the area specified in Figure 7 for CF 0.5-1 (Figure 8a) and CF 0.5-2 (Figure 8b). For CF 0.5-1, the entire area of the left image is just a low hump, and that of the right image is a shallow hollow. The entire areas reveal type I dividedness because no cemented fiber clusters or fiber-laden mortar are found in these areas. In addition to the dividedness, three uprootedness of type I are shown there. The top uprootedness I was shown in Figure 5.
The second and third uprootedness I appear side by side. The region on the left side, where these two traces are located, is slightly grooved. They can be classified as avulsion II. As mentioned before, the uprootedness that shows only the tip parts of the fiber clusters or strands is a kind of a small-scale avulsion. The other parts of the left- and right side images are just near flat mortar.
For the case of CF 0.5-2, each image is divided into two regions as specified by the solid line. A hump (hollow) is in the bottom and a down (up) slope is in the left (right) image. This hump and hollow couple reveals type II dividedness because of the frequent appearances of cemented fiber clusters and fiber-laden mortars in the regions.
In total, 11 other traces are shown there: 7 uprootedness, 3 separations and 1 avulsion. The uprootedness dominates the other traces. Among the uprootedness cases, six are type I, and one is type II. If the type II is assigned to the separation, there can be six uprootedness and four separations. The avulsion is type II. The three separations are all type II. This means that cemented fiber clusters are also in CF 0.5-. Among the three separations, the top one has already been introduced in Figure 5. The left side fiber clusters in the separations are on the top of the plateau/hump, but those on the right side are in a hollow as specified in the image.
In the CF 0.5-, no dividedness type II is found. For the case of the avulsion II, the hump(hollow) is low(shallow). The fiber clusters on the right side are nearly on the edge of the plateau, covered by cement, and their horizontal lengths are around 3 mm. However, its matching left side area shows only vestiges of the fiber cluster.
Figure 9 presents the fiber traces in four squares of CF 1.0-1 (Figure 9a) and CF 1.0-2 (Figure 9b) as specified in Figure 7.
The CF 1.0-1 is divided into four regions marked by solid lines; hollow (hump), hump (hollow), flat (flat) and low hump (shallow hollow) for the left (right) image. These hollow and hump couples indicate that there are three dividedness traces. The two couples on top are dividedness type I because no fibers are involved, except other traces. Both the hump and hollow couples are plane mortars with fibers underneath. Some dark spots in these regions are shadows created by protruded mortar pieces. However, the low hump and shallow hollow couple is dividedness II because of the fiber-laden mortar in the left image and cemented fiber clusters in the right image.
There are 12 other traces: 5 uprootedness, 4 avulsions and 3 separations. Among the five uprootedness traces, four are type I and one is type II. This type II can be assigned to the separation. All avulsions and separations are type II. The top left fiber cluster 6 mm in length and 2 mm in width is in the low-level hill showing two traces. The top part of the top left fiber cluster corresponds to the long fiber vestige lying mostly in the bottom of a sloped valley in the right side. Hence, the upper part of the top left fiber cluster is avulsed from the vestige designated by the two-sided arrow. However, the right side of the top left fiber cluster is separated from the fibers in the left side of the right side fiber cluster.
The remaining separations and avulsions appear on a hump/plateau and hollow as specified by two-sided arrows. Their scales (≤1 mm2) are almost comparable to the uprootedness. The uprootedness in the bottom of the image is in a relatively flatter area if compared with the other traces.
The whole area of the CF 1.0-2 is a bumpy hollow (a bumpy hump). However, it can be divided into three regions as specified by solid curved lines such as the up-slope, long valley and up-slope for the left side image, and the down-slope, ridge and down-slope for the right side image. However, the long valley and ridge couple makes a big scale dividedness II. When the bumpiness is considered, the three hollows in the left image and three humps in the right one, specified by 1, 2 and 3 can be considered as three dividedness II traces. Hence, there will be four dividedness II.
Among the dividedness II, the “1” is breaking between cemented fiber clusters in a very deep hollow and sharp hump, the “2” is breaking between fiber-laden mortar and the “3” is breaking between cemented fiber clusters in the left side image and uprooted style fiber clusters in the right side image. As shown in the image, the valley surface often shows cemented fiber clusters and fiber-laden mortar.
There are 13 other traces in CF 1.0-2: four uprootedness, two of type I and two of type II, three avulsions, one of type I and two of type II, and six separations, four of type II and two of type III. Many dark spots in these regions are shadows from the mortar pieces. Compared with CF 1.0-1, the number of separations increased from three to six. In the bottom of the image, separation II and III appear in a pattern, as well as the avulsion I and uprootedness I. The former appeared at the slope/cliff region. The small ellipse represents separation III and the large broken pattern represents separation II. The latter shows the simultaneous appearance of avulsion I and uprootedness I.
The left side shows mortar in the middle and the small tip part of fibers, and the right side shows cemented fiber clusters in a groove with the fiber clusters avulsed from the middle part and the small tip part of fibers uprooted from near the groove edges. The second and third separation II traces from the top look are also seen in a pattern, but the left side shows a hole near the middle of the pattern. This indicates that they are two separated patterns.
Figure 10 shows the fiber traces in four square grids specified in the cracked surfaces of CF 1.5-1 (Figure 10a) and CF 1.5-2 (Figure 10b). CF 1.5-1 is composed of several humps and hollows. Both the left and right images can be divided into six different regions as indicated by solid curved lines: The regions in the left (right) image are the hump (hollow) on the top, the hollow (hump) on the bottom and the narrow slope in between. The slope is connected to the hollow (hump) in its top left (right), and the hump (hollow) in its bottom left (right) and bottom right (left). The humps are not high and the hollows are not deep.
There are five sets of humps and hollows, i.e., five dividedness. The hump and hollow set at the top left (right) in the left (right) image is composed of mortar making type I. However, the other four are involved with cemented fiber bunches and make type II. There are also 13 other traces: 5 uprootedness II, 5 avulsions, 1 of type I and 4 of type II, and 3 separations of type II. For the uprootedness, no type I is observed. The uprootedness fibers from the top first, second and fifth are in a groove/hole in the left side and the other two are in the right side.
For the case of the avulsion, the left side fiber clusters of type I are cemented and are almost 7.5 mm in length, but there is no vestige in the right side. The fiber clusters are formed by the overlapping of at least two fiber clusters in their length direction. In the type II case, the left side fiber clusters are cemented with its vestige on the slope on the right side. For the separation, the top is on the edge of the hill on the left side and on the bottom of the hollow on the right side. The cemented fiber clusters in the left image are nearly 6 mm in length, but only the right part remains in the right image. The left part is considered to be avulsion II. The fibers are thickly cemented.
The separation II in the bottom is on the slope. The area of CF 1.5-2 is mostly composed of cemented fiber clusters as written in the image. The area can be divided into six regions: hump, high hump, low hump, hollow, slope and valley. This indicates that there are five hollow and hump sets, i.e., five dividedness II in the images. There are 11 other traces; one type I uprootedness, seven type II avulsions, and three separations, two of type II and one of type III. However, the fiber cluster in the top left side is on the slope. It is avulsed from the thin vestige on the right side. The fiber cluster bulges after the avulsion. The area surrounding the cliff reveals two combinations of hump and hollow, and hollow and hump. Hence, two dividedness II are observed there. The second fiber cluster in the left side is composed of two fiber clusters of different traces; one is rooted from the bottom left and the other is rooted from the top right. The former is separated from the fiber cluster on the right side that is rooted from the top left as specified by a small circle. Hence, they make type III separation. The latter is avulsed from the mortar part within the dotted ellipse. The separation III and avulsion II appear side by side. The cemented fiber clusters near the image center represent type II separation. The left fiber clusters are mostly covered with cement, but the right fiber clusters are mostly exposed. The four dividedness are just type II because the areas on the right and left are laden with cemented fiber clusters.
In CF 1.5-2, the cracked surface is mostly laden with the cemented fiber clusters and strands. The number of separations remains the same as in Figure 8 but that of uprootedness is reduced, and those of dividedness type II and avulsion type II are increased more compared with CF 1.0-1.
Figure 11 shows the fiber traces in four square grids specified in the cracked surfaces of CF 2.0-1 (Figure 11a) and CF 2.0-2 (Figure 11b). The left- and right side areas of CF 2.0-1 are bumpy but have slight slopes. The areas are mostly covered with fiber-laden mortars as shown by dark spots in the images. These spots are mostly a part/parts of fiber strands and clusters. The bumpiness of the slope enables the division of the areas into six regions: hollow (bump), low hump (shallow hollow), deep hollow (high hump), hollow (hump) and slope (slope) for both the left and right images, respectively, but the height differences are very small. Hence, the whole area induces one big scale dividedness II, but, in detail, they induce five dividedness II traces.
The CF 2.0-1 reveals 11 other traces: one uprootedness I, five avulsions, two of type I and three of type II, and five separations, four of type II and one of type I. The main trace of the CF 2.0-1 is in the form of mortar in a gray color surrounded by cemented fiber clusters of a dark color. It has the size of nearly 2 mm × 6 mm and is located in the middle of the left image. The matching trace in the right image reveals rather different features: (1) the bottom of the cluster is a hole with fibers, but its matching is another cemented fiber cluster extended horizontally; thus, the bottom pair is a separation III. (2) The body part of the clusters consists of cemented fibers, and its matching area in the right image is fiber-laden mortar; they mainly make avulsion II. (3) The top part is mortar, but its matching in the right image is cemented fiber clusters; this pair makes avulsion I.
Additionally, the left side of the mortar is cemented fiber clusters. Its matching in the right image is also cemented fiber clusters. This pair is separation II. For the other traces, the top six appear near the flat areas in both side images, though there are small height differences between them due to regional characteristics as shown in the images. The avulsion II in the second bottom is on the slope.
The CF 2.0-2 is mostly covered with cemented fiber clusters and fiber-laden mortars, as shown by the dark spots, and divided into seven regions specified by the solid curved lines in Figure 11b: hump (hollow), high hump (deep hollow), hollow (hump), deep hollow (high hump), hump (hollow), hollow (hump) and deep hollow (high hump) for the left (right) image. These seven hump-hollow pairs induce seven dividedness II.
There are 12 other traces in the CF 2.0-2: 2 uprootedness, 1 of types I and II, 5 avulsions, 3 of type I and 2 of type II, 4 separations, 2 of types II and III, and one overlay. The nearly vertically aligned cemented fiber cluster in the right image is situated at the bottom of the deep hollow. Its matching area in the left image on the top of the high hump shows no fiber vestige, except a small fiber chunk extended horizontally near the top of the area. Hence, the cemented fiber cluster is avulsion I. The small fiber chunk represents the overlay trace because the cemented fiber cluster in the right image is the same one that induces the avulsion I. The fiber chunk is aligned nearly vertically with the fiber cluster. There are also fiber clusters in the top and bottom of the nearly vertically aligned cemented fiber cluster. In the matching areas at the top and bottom of the left image, only vestiges and cemented fiber bunches are shown. This reveals avulsion II in the top and separation III in the bottom.
The smaller cemented fiber bunch is found in the right side of the nearly vertically aligned cemented fiber bunch on the slope side of the high hump. The matching area in the left image shows no fiber vestige. It reveals avulsion I. In the bottom of the smaller cemented fiber cluster, another small fiber cluster in a groove is observed. Its matching area in the left image also shows a fiber cluster. It is a separation III trace. The partly cemented dark areas in the center and top right of the left side image represent fiber clusters. Their matching areas in the right image are a fiber-laden mortar and a cemented fiber cluster. Hence, they reveal avulsion I and separation II traces, respectively. The dark spots are all fiber clusters except the dark area in the top left of the left side image and the long dark line in the top right of the right side image. These are mostly not fibers but broken areas during the breaking of the prism sample into two parts due to the crack.
In Table 1, the total numbers of each trace and regions in each prism sample are summarized. It looks as though the numbers of each trace for the two samples of each fiber percentage are too different, but they are actually very similar to each other. Since avulsion, separation and overlay can be considered as one because of the involvement of fiber clusters, if they are summed together, the number of each trace for two samples becomes nearly the same as shown in Table 2, except for the uprootedness.

Table 1.
The total numbers of each trace and regions in each prism sample summarized.
Table 2.
Numbers of combined traces.
Since the inhomogeneity of the prism is a major factor in reducing the flexural strength and is mainly related to fiber clusters and fiber-laden mortar, the summed number of the three traces and the number of dividedness informs us that the two samples of each fiber contents, except CF 0.5, have almost the same characteristics.
Table 1 shows the following:
- (1)
- The overlay and separation type I are rare: No type I separation is shown in the sampled areas specified in Figure 7, but type II prevails.
- (2)
- The number of regions between the same fiber percentage prism samples is not too different from each other; they have almost the same number of regions.
- (3)
- The uprootedness is decreasing from 10 (CF 0.5) to 9 (CF 1.0), 6 (CF 1.5) and 3 (CF 2.0) as the percentage increases. These numbers indicate that the fiber percentage increase from 0.5 to 1.0 reduces the number of uprootedness just a little. However, when it is considered that the sample area of CF 0.5-2 is slightly bigger than that of CF 1.0-1 or 2, there will not be any difference between the two, but the number decreases sharply with the fiber percentage increase to 1.5 and 2.0. Since it is considered that the uprooted fiber strands/clusters are held more tightly by the surrounding mortar than the avulsion, separation and overlay, the strength of the prism samples will be reduced as the number of uprooted fiber clusters reduces and those of the three traces increase.
- (4)
- The growth of overlapping and clustering caused by the fiber content increase introduces a greater number of cemented fiber clusters/chunks, i.e., air pockets as indicated by the summed number of avulsions and separations. The numbers are 4, 16, 18 and 19 for CF 0.5, CF 1.0, CF 1.5 and CF 2.0, respectively. If the overlay is added, the number becomes 20 for CF 2.0. It is increasing as the fiber percentage increases. The greatest increment is 12 between CF 0.5 and CF 1.0. However, the increment is reduced more as the fiber percentage increases further. The increasing numbers of (avulsions + separations) will reduce the strength of the prism samples.
- (5)
- The numbers of dividedness are 2, 7, 10 and 12 for CF 0.5, CF 1.0, CF 1.5 and CF 2.0, respectively. In these numbers, type II prevails, except CF 0.5. The numbers of the type II are 0, 5, 9 and 12 for CF 0.5, CF 1.0, CF 1.5 and CF 2.0, respectively. The greatest increase in number comes to 5 between CF 0.5 and CF 1.0. As the fiber content increases further, type I disappears but type II increases. Due to this, more parts of the cracked surfaces become covered with fiber-laden mortars and cemented fiber chunks as shown by Figure 10 and Figure 11 for CF 1.5 and CF 2.0, respectively.
- (6)
- The region number sum of the same percentage samples increases as the fiber percentage increases, though the difference between CF 1.5 and CF 2.0 is only 1. This number increase indicates that the cracked surface becomes bumpier as the percentage increases, though its roughness increment slows down as the content increases more.
The reason for the roughness growth was explained in the description regarding Figure 2. This growth will lead to the increase in the surface area of the cracked surface. In the homogeneous samples, the lowest resistance place will be the cross section with the smallest cross-sectional area. Hence, as the surface area of the cracked surface increases, the resistance to the imposed force should also grow. However, in reality, the resistance is reduced by the fibers inducing the traces on the cracked surface. These fibers are not nullifying the resistance increase induced by the surface area growth but are diminishing it.
The presence of any inhomogeneous materials in a homogeneous object can reduce the strength of the object as the plane mortar shows in Figure 2. The plane prism in Figure 2 shows the longest propagation distance to the side, i.e., the cracked surface has the widest surface area. This is probably because of the large amount of air pockets as shown in Figure 6. It is assumed that the total area occupied by the air pockets on the cracked surface will be greater than the area increase from 40 mm × 40 mm, by having the longest propagation distance. Since the fibers in the mortar prisms are inhomogeneous materials, if their amount become more than a certain quantity, the strength of the prisms will go down again. As the fiber amounts appearing at the cracked surface grows as the percentage increases, the surface becomes more inhomogeneous with increasing fiber contents. Since the fibers appearing at the surface create specific traces, the number of traces can inform the relative amount of the fibers for prisms with different fiber contents.
The results from Table 1 show that the fiber percentage 1.0 works as the turning point for changing the amount of decrement or increment in the number of each specific trace. This is because the highest increment in the number of the traces other than the uprootedness appears between CF 0.5 and CF 1.0. For the uprootedness case, the number stays almost the same as CF 0.5, but the numbers sharply reduce for CF 1.5 and CF 2.0. Moreover, the increasing number of the type II dividedness in the cases corresponding to the increasing fiber percentages shows that if the fiber content exceeds a certain amount, mixing more fibers in the prism samples will no longer increase their strengths because more portions of the cracked surface will be covered with fiber-laden mortars and cemented fiber clusters/chunks. The increasing amounts of the fiber-laden mortars and cemented fiber chunks/clusters will cause a further increase in the inhomogeneity of the mortar and reduction in the cohesive power of the cement. Hence, the strength growth achieved by mixing more fibers cannot match the strength reduction induced by the increased inhomogeneity and the reduced cohesive power.
Hence, the strength of the prism samples will be reduced when the fiber content exceeds a certain value. As shown in Figure 10 and Figure 11, the sampled areas of CF 1.5 and CF 2.0 are mostly covered with fiber-laden mortars and cemented fiber clusters/chunks. This means that the inhomogeneity increases more and the cohesive powers of CF 1.5 and CF 2.0 reduce more than those of CF 1.0.
The flexural strength measurements of different fiber percentage mortar prism samples shown in Figure 3 indicate that CF 1.0 provides the highest flexural strength. This confirms that the increased inhomogeneity and the decreased cohesive power in CF 1.5 and CF 2.0 are the main reasons for the reduction in their flexural strengths to less than that of CF 1.0. Hence, 1.0% will be considered to be the certain amount mentioned above. The fiber content of 1.0%, as the turning point for the decrement or increment in the numbers of different traces, is the fiducial point for decreasing the strength of the sample prisms for fiber percentages greater or smaller than 1.0.
5. Conclusions
The cracked surfaces of mortar prism samples reveal many unique fiber traces such as uprootedness, avulsion, separation, overlay and dividedness. Since the frequencies of these traces appearing on the surfaces are related to the fiber contents in the samples, they are used to explain why the prism samples mixed with 1.0% fiber amount reveal the highest flexural strength of all the other prism samples with 0.0%, 0.5%, 1.5% and 2.0% fiber amounts. The decreasing number of uprootedness and the increasing number of “avulsion + separation” as the fiber content increases, reveal explicitly the decreasing resistance to the crack for the prism samples with fiber percentages of 1.5% and 2.0%. In addition, the increasing number of type II dividedness indicates that the cracked surfaces of the prism samples with fiber percentages of 1.5% and 2.0% are covered more with the cemented fiber clusters/chunks and fiber-laden mortar. This implicitly informs us that the prisms become more inhomogeneous and less cohesive. This is the reason why the prism samples with a fiber percentage of 1.0% have the highest flexural strength.
The future works will be devoted to a more convincing verification of the above results and the study of the influence on the flexural strength of the microstructural and hydration process changes incurred by adding the carbon fibers using more prism samples. The flexural strength differences between the same fiber percentage samples will also be explained clearly.
Author Contributions
Conceptualization, J.-Y.S. and G.H.; methodology, J.-Y.S. and G.H.; software, J.K.; validation, J.-Y.S. and T.V.; formal analysis, J.-Y.S. and C.Y.; investigation, J.-Y.S. and C.Y.; resources, J.K.; data curation, J.K.; writing—original draft preparation, J.-Y.S.; writing—review and editing, J.-Y.S. and T.V.; visualization, J.K.; supervision, G.H.; project administration, G.H.; funding acquisition, G.H. All authors have read and agreed to the published version of the manuscript.
Funding
Priority Research Centers Program through the National Research Foundation of Korea (NRF) funded by the Ministry of Education (Grant Number: NRF-2018R1A6A1A03025542).
Data Availability Statement
Not applicable.
Conflicts of Interest
The authors declare no conflict of interest.
References
- Carl, W.C. The First Reinforced-Concrete Skyscraper: The Ingalls Building in Cincinnati and Its Place in Structural History. Technol. Cult. 1968, 91, 1–33. [Google Scholar] [CrossRef]
- Huang, X. Fabrication and Properties of Carbon Fibers. Materials 2009, 2, 2369–2403. [Google Scholar] [CrossRef]
- Baoguo, H.; Liqing, Z.; Chenyu, Z.; Yunyang, W.; Xun, Y.; Jinping, O. Reinforcement effect and mechanism of carbon fibers to mechanical and electrically conductive properties of cement-based materials. Constr. Build. Mater. 2016, 125, 479–489. [Google Scholar] [CrossRef] [Green Version]
- Heo, G.H.; Song, G.C.; Park, J.-G.; Han, Y.J.; Lim, C.Y. Mechanical Properties and Impact Resistance Review of Carbon Fiber Reinforced Cement Composites with Different Fiber Contents and Fiber Lengths. J. Korea Inst. Struct. Maint. Insp. 2019, 23, 86–95. [Google Scholar] [CrossRef]
- Toutanji, H.A.; El-Korchi, T.; Katz, R.N. Strength and reliability of carbon-fiber-reinforced cement composites. Cem. Concr. Compos. 1994, 16, 15–21. [Google Scholar] [CrossRef]
- Ahmet, B.K. Experimental Evaluation of Mechanical Properties and Fracture Behavior of Carbon Fiber Reinforced High Strength Concrete. Period. Polytech. Civ. Eng. 2016, 60, 289–296. [Google Scholar] [CrossRef] [Green Version]
- Liu, G.J.; Bai, E.L.; Xu, J.Y.; Yang, N. Mechanical Properties of Carbon Fiber-Reinforced Polymer Concrete with Different Polymer–Cement Ratios. Materials 2019, 12, 3530. [Google Scholar] [CrossRef] [PubMed] [Green Version]
- Benjamin, K.; Philipp, P.; Johann, K. Building lightweight structures with carbon-fiber-reinforced polymer-reinforced ultra-high-performance concrete: Research approach, construction materials, and conceptual design of three building components. Struct. Concr. 2018, 20, 730–744. [Google Scholar] [CrossRef] [Green Version]
- Toray. 2021. Available online: https://www.toray.us/products/prod_004.html (accessed on 10 October 2021).
- Osbaeck, B.; Johansen, V. Particle size distribution and rate of strength development of Portland cement. J. Am. Ceram. Soc. 1989, 72, 197–201. [Google Scholar] [CrossRef]
- Heo, G.H.; Son, J.-Y.; Kim, J.; Park, J.-G.; Kim, C.G. Peculiar Alignment of Carbon Fibers in a Mortar Brick. J. Korea Concr. Inst. 2021, 33, 363–371. [Google Scholar] [CrossRef]
- KS L ISO 679; Methods of Testing Cements-Determination of Strength. Korean Standards. Korean Standards Association: Seoul, Korea, 2016.
Publisher’s Note: MDPI stays neutral with regard to jurisdictional claims in published maps and institutional affiliations. |
© 2022 by the authors. Licensee MDPI, Basel, Switzerland. This article is an open access article distributed under the terms and conditions of the Creative Commons Attribution (CC BY) license (https://creativecommons.org/licenses/by/4.0/).