
Validation of a Simulink Model for Simulating the Two Typical Controlled Ventilation Modes of Intensive Care Units Mechanical Ventilators †


 ,
, 

Abstract
:1. Introduction
2. Mechanical Ventilation Modes
2.1. VC-CMV Mode
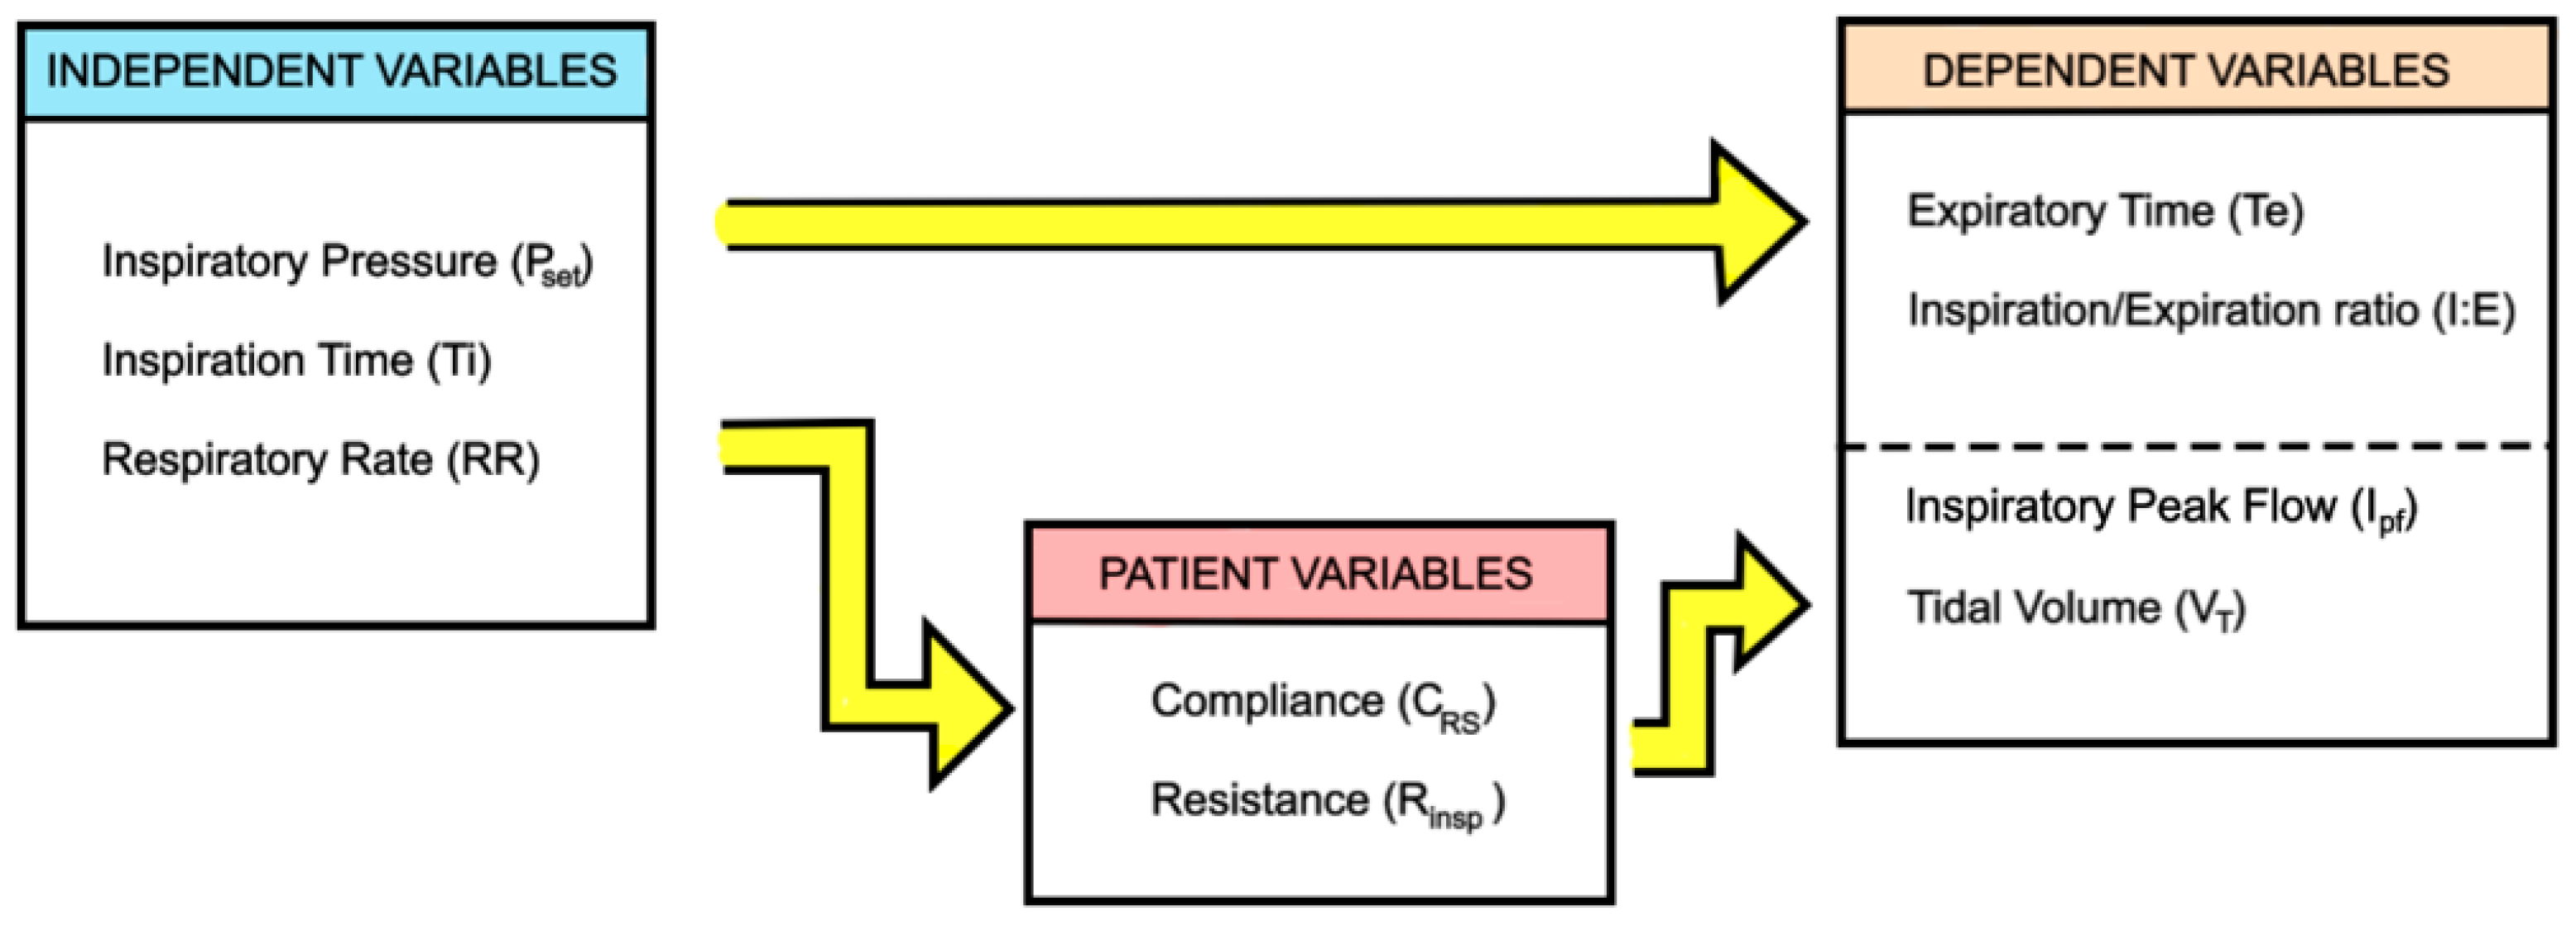
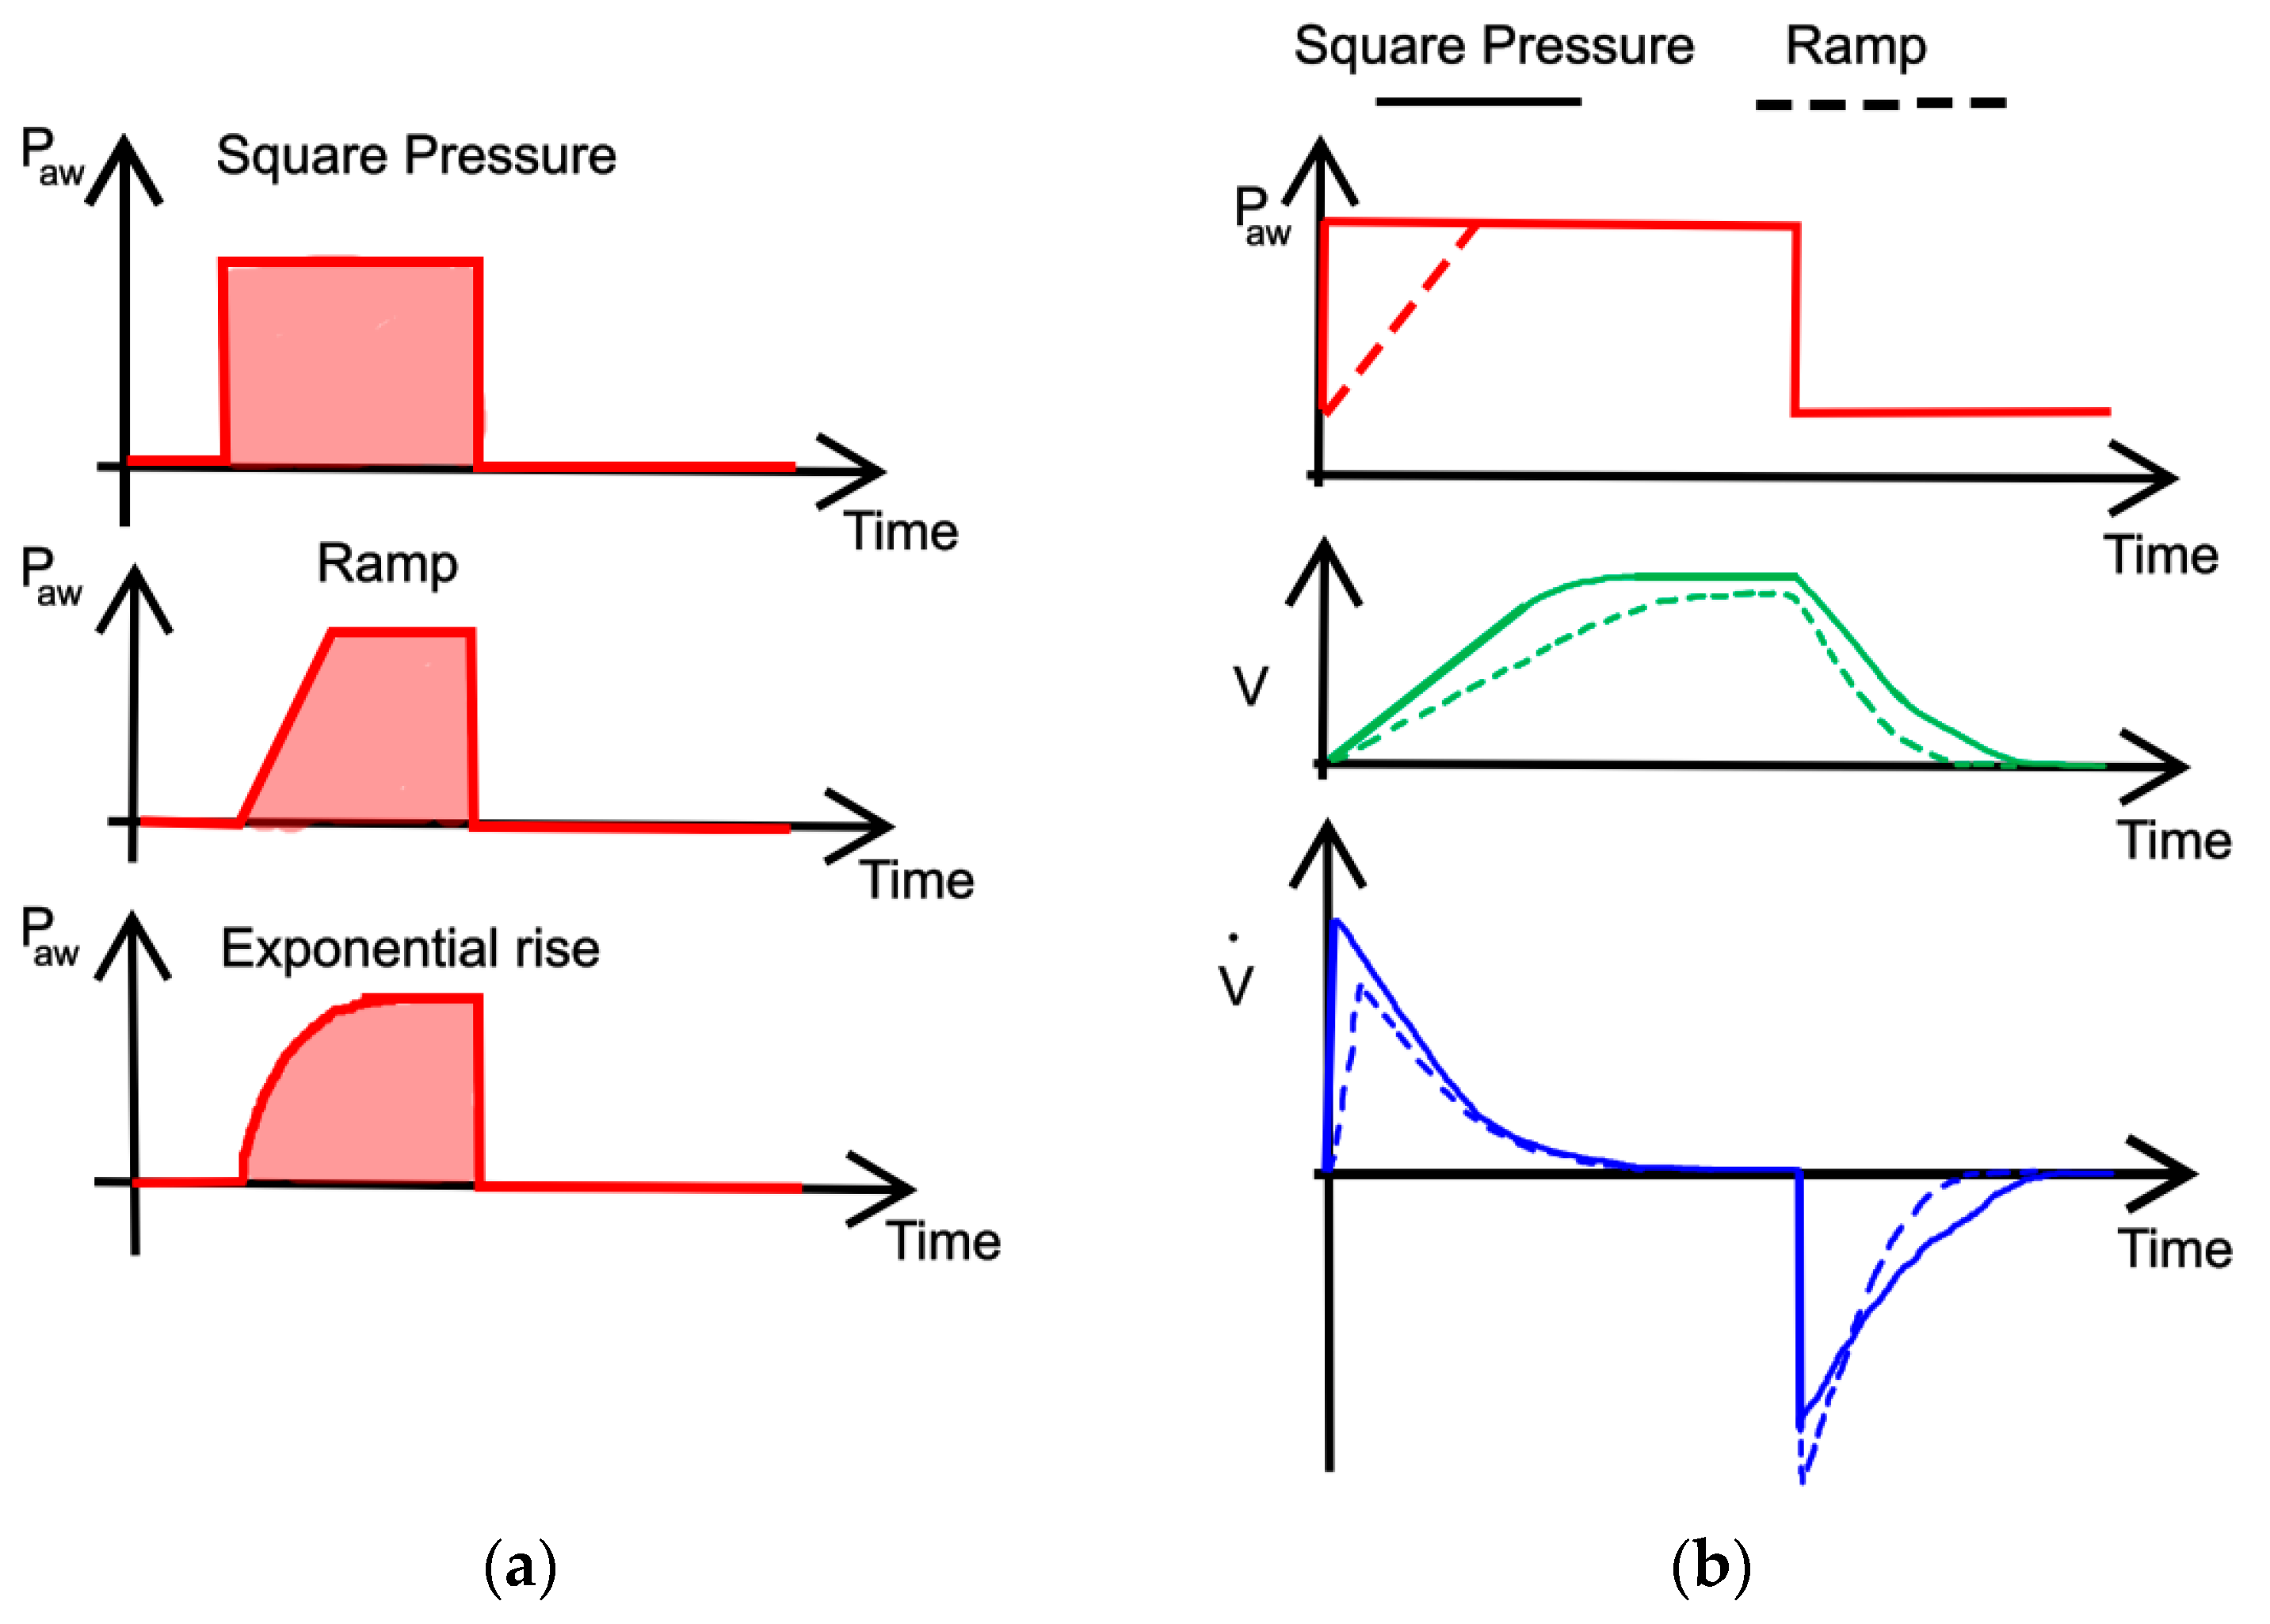
2.2. PC-CMV Mode
3. Operating Principles of Mechanical Ventilators for ICUs
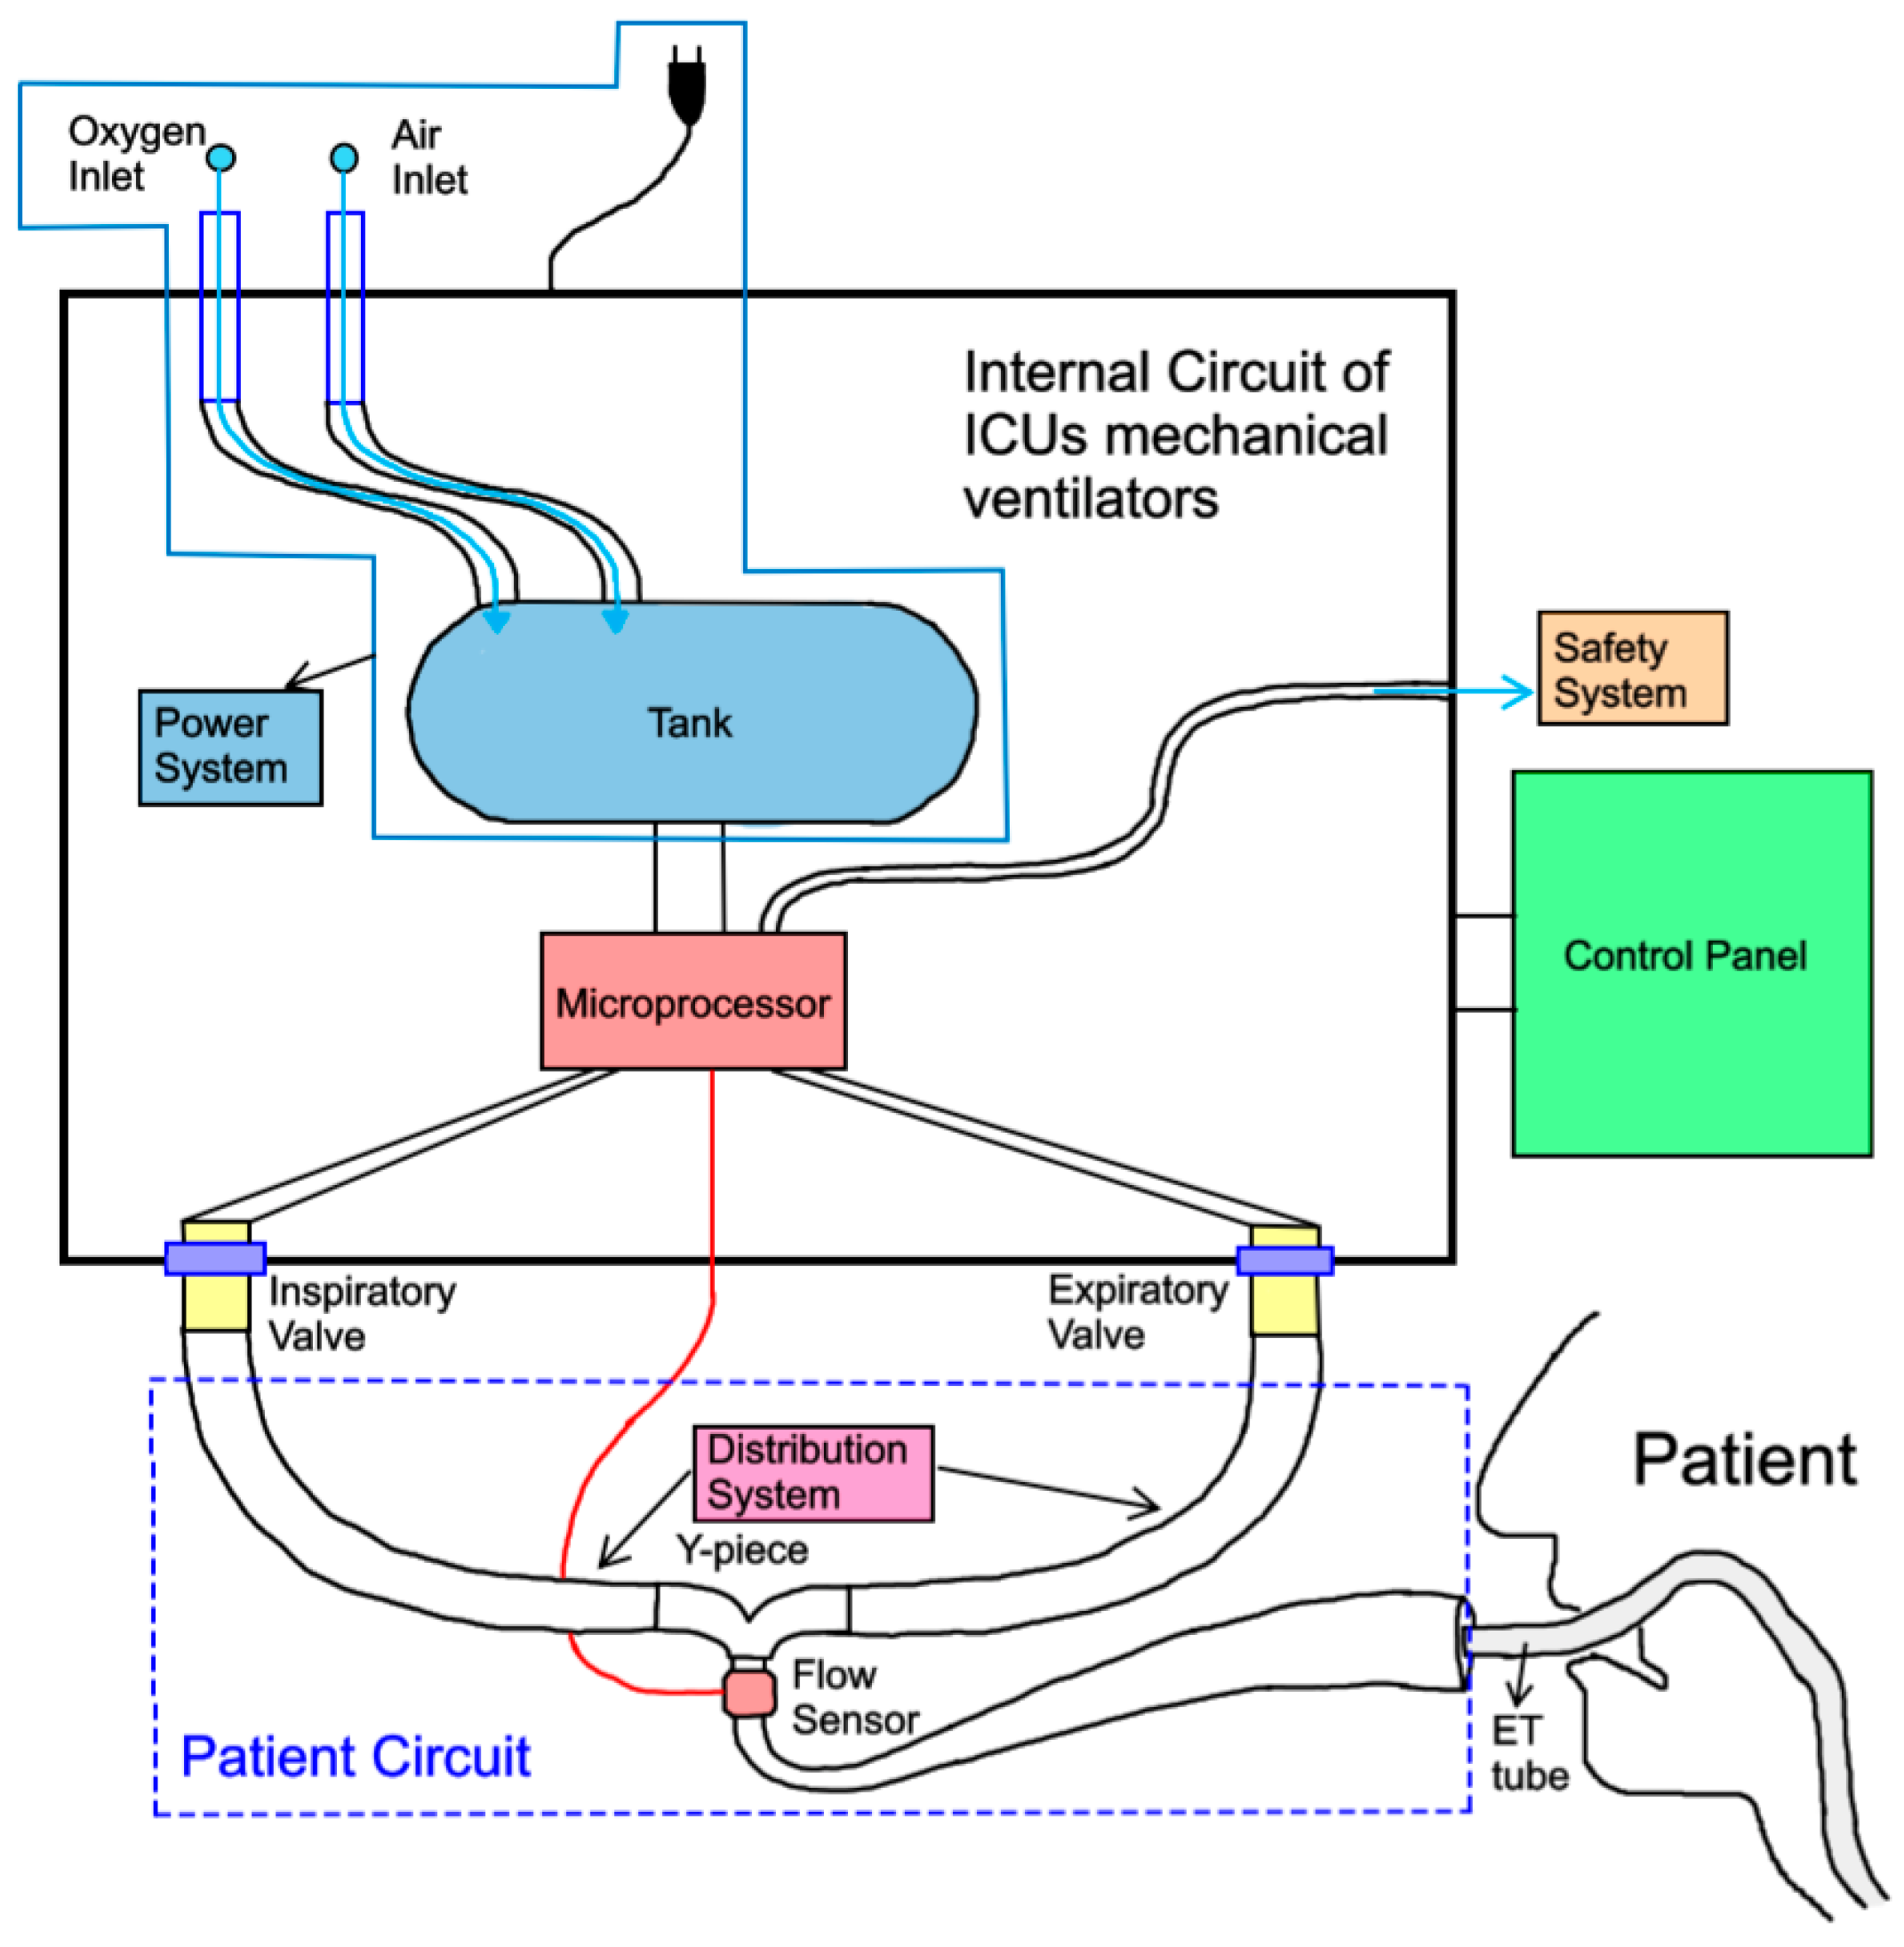
- A pneumatic unit (internal circuit), connected to the patient’s lungs through tubes (patient circuit);
- An electronic unit (microprocessor), which performs the logic operations of the pneumatic unit and measures the quantities of interest, through flow, and pressure sensors, in order to achieve the set conditions. In addition, it provides external alarms.
- The gas inlet connections (0), which allow the gases (oxygen and air) to enter the ventilator. These will initially follow parallel paths;
- A filter (1), used to remove impurities from incoming gases;
- A check valve (2), needed to prevent the gases from returning to the supply line;
- A pressure reducing valve (3), which allows the gas to decrease its pressure to a value of approximately 510 cmH2O;
- A pressure sensor (4), used to measure the pressure at this point of the circuit;
- Two proportional valves, namely an air metering valve (5) and an oxygen metering valve (6), whose opening degrees can be precisely adjusted by acting on control signal(s) sent to the solenoids, allowing the system to obtain the required mixture of gas with the selected percentage of oxygen;
- A tank (7) with a large volume (approximately 5.8 L), needed for ensuring the mixture of air and oxygen is uniform, as shown in the Galileo model [12], to supply high peak flows when required, and to smooth the pressure variation at this point of the circuit (maintained within the range of 204 to 357 cmH2O).
- A tank relief valve (8), needed to avoid uncontrolled pressure increases in the tank (7); in particular, when the pressure in the tank reaches a pre-set maximum value, the valve automatically opens and discharges the gas into the room in which the ventilator is located;
- An oxygen sensor (9), used to control the opening degree of the inlet metering valves (5) and (6), and thus to allow the system to control the oxygen concentration in the tank (7);
- A pressure relief valve (12), used in order to avoid uncontrolled pressure increases, which could harm the patients’ lungs; in particular, when a pre-set maximum value for pressure is reached (namely, the cracking pressure), this valve automatically opens and discharges the gas into the external environment;
- A safety valve (13), which allows the patient to breathe in case of standby or malfunctioning of the system; during normal operation of the ventilator, both the valves (12 and 13) remain closed.
- An additional filter (10), used to protect the downstream inspiratory valve (11) and the patient against possible contaminating particles carried by the gas;
- An inspiratory valve (11), which in the modern ventilator is a proportional valve, whose opening degree can be controlled accurately and that allows the system to obtain a precise control of the gas inhaled by the patient; in some models, such as the Galileo model [12], this valve is also equipped with a position sensor coupled with a differential pressure sensor measuring the pressure difference across the orifice of the inspiratory valve in order to calculate the flow of gas;
- A pressure sensor (14), used to measure the pressure at this point of the circuit;
- A humidification device and a heat exchanger (15) can optionally be used to control the humidity and temperature of the gas inhaled by the patient;
- A flow sensor (16), positioned close to the patient’s mouth, in order to measure and monitor the flow of gas inhaled and exhaled by the patient;
- A pressure sensor (14), used to measure the pressure at this point of the circuit;
- An optional additional filter (18);
- An expiratory valve (19), a proportional valve used both to adjust the minimum pressure in the patient circuit and to regulate the flow of expiratory gases from the patient to the external environment;
- A check valve (20), used to avoid reverse flow in the expiratory circuit.
- Plateau pressure (Pplt) should be adjusted to achieve volume and must be limited to 35 cmH2O by default;
- If VC-CMV is used, the operator/clinician must be able to set the inspiratory airway pressure limit in the range of at least 15–40 cmH2O in at least 5 cmH2O increments;
- The mechanical failsafe valve (see pressure relief valve (12)) must open itself at 80 cmH2O;
- Peak pressure (PIP) should be no more than 2 cmH2O greater than plateau pressure;
- The patient breathing system must remain pressurised to at least the PEEP level setting at all times;
- The positive end-expiratory pressure (PEEP) must be greater than 5 cmH2O, adjustable in at least 5 cmH2O increments.
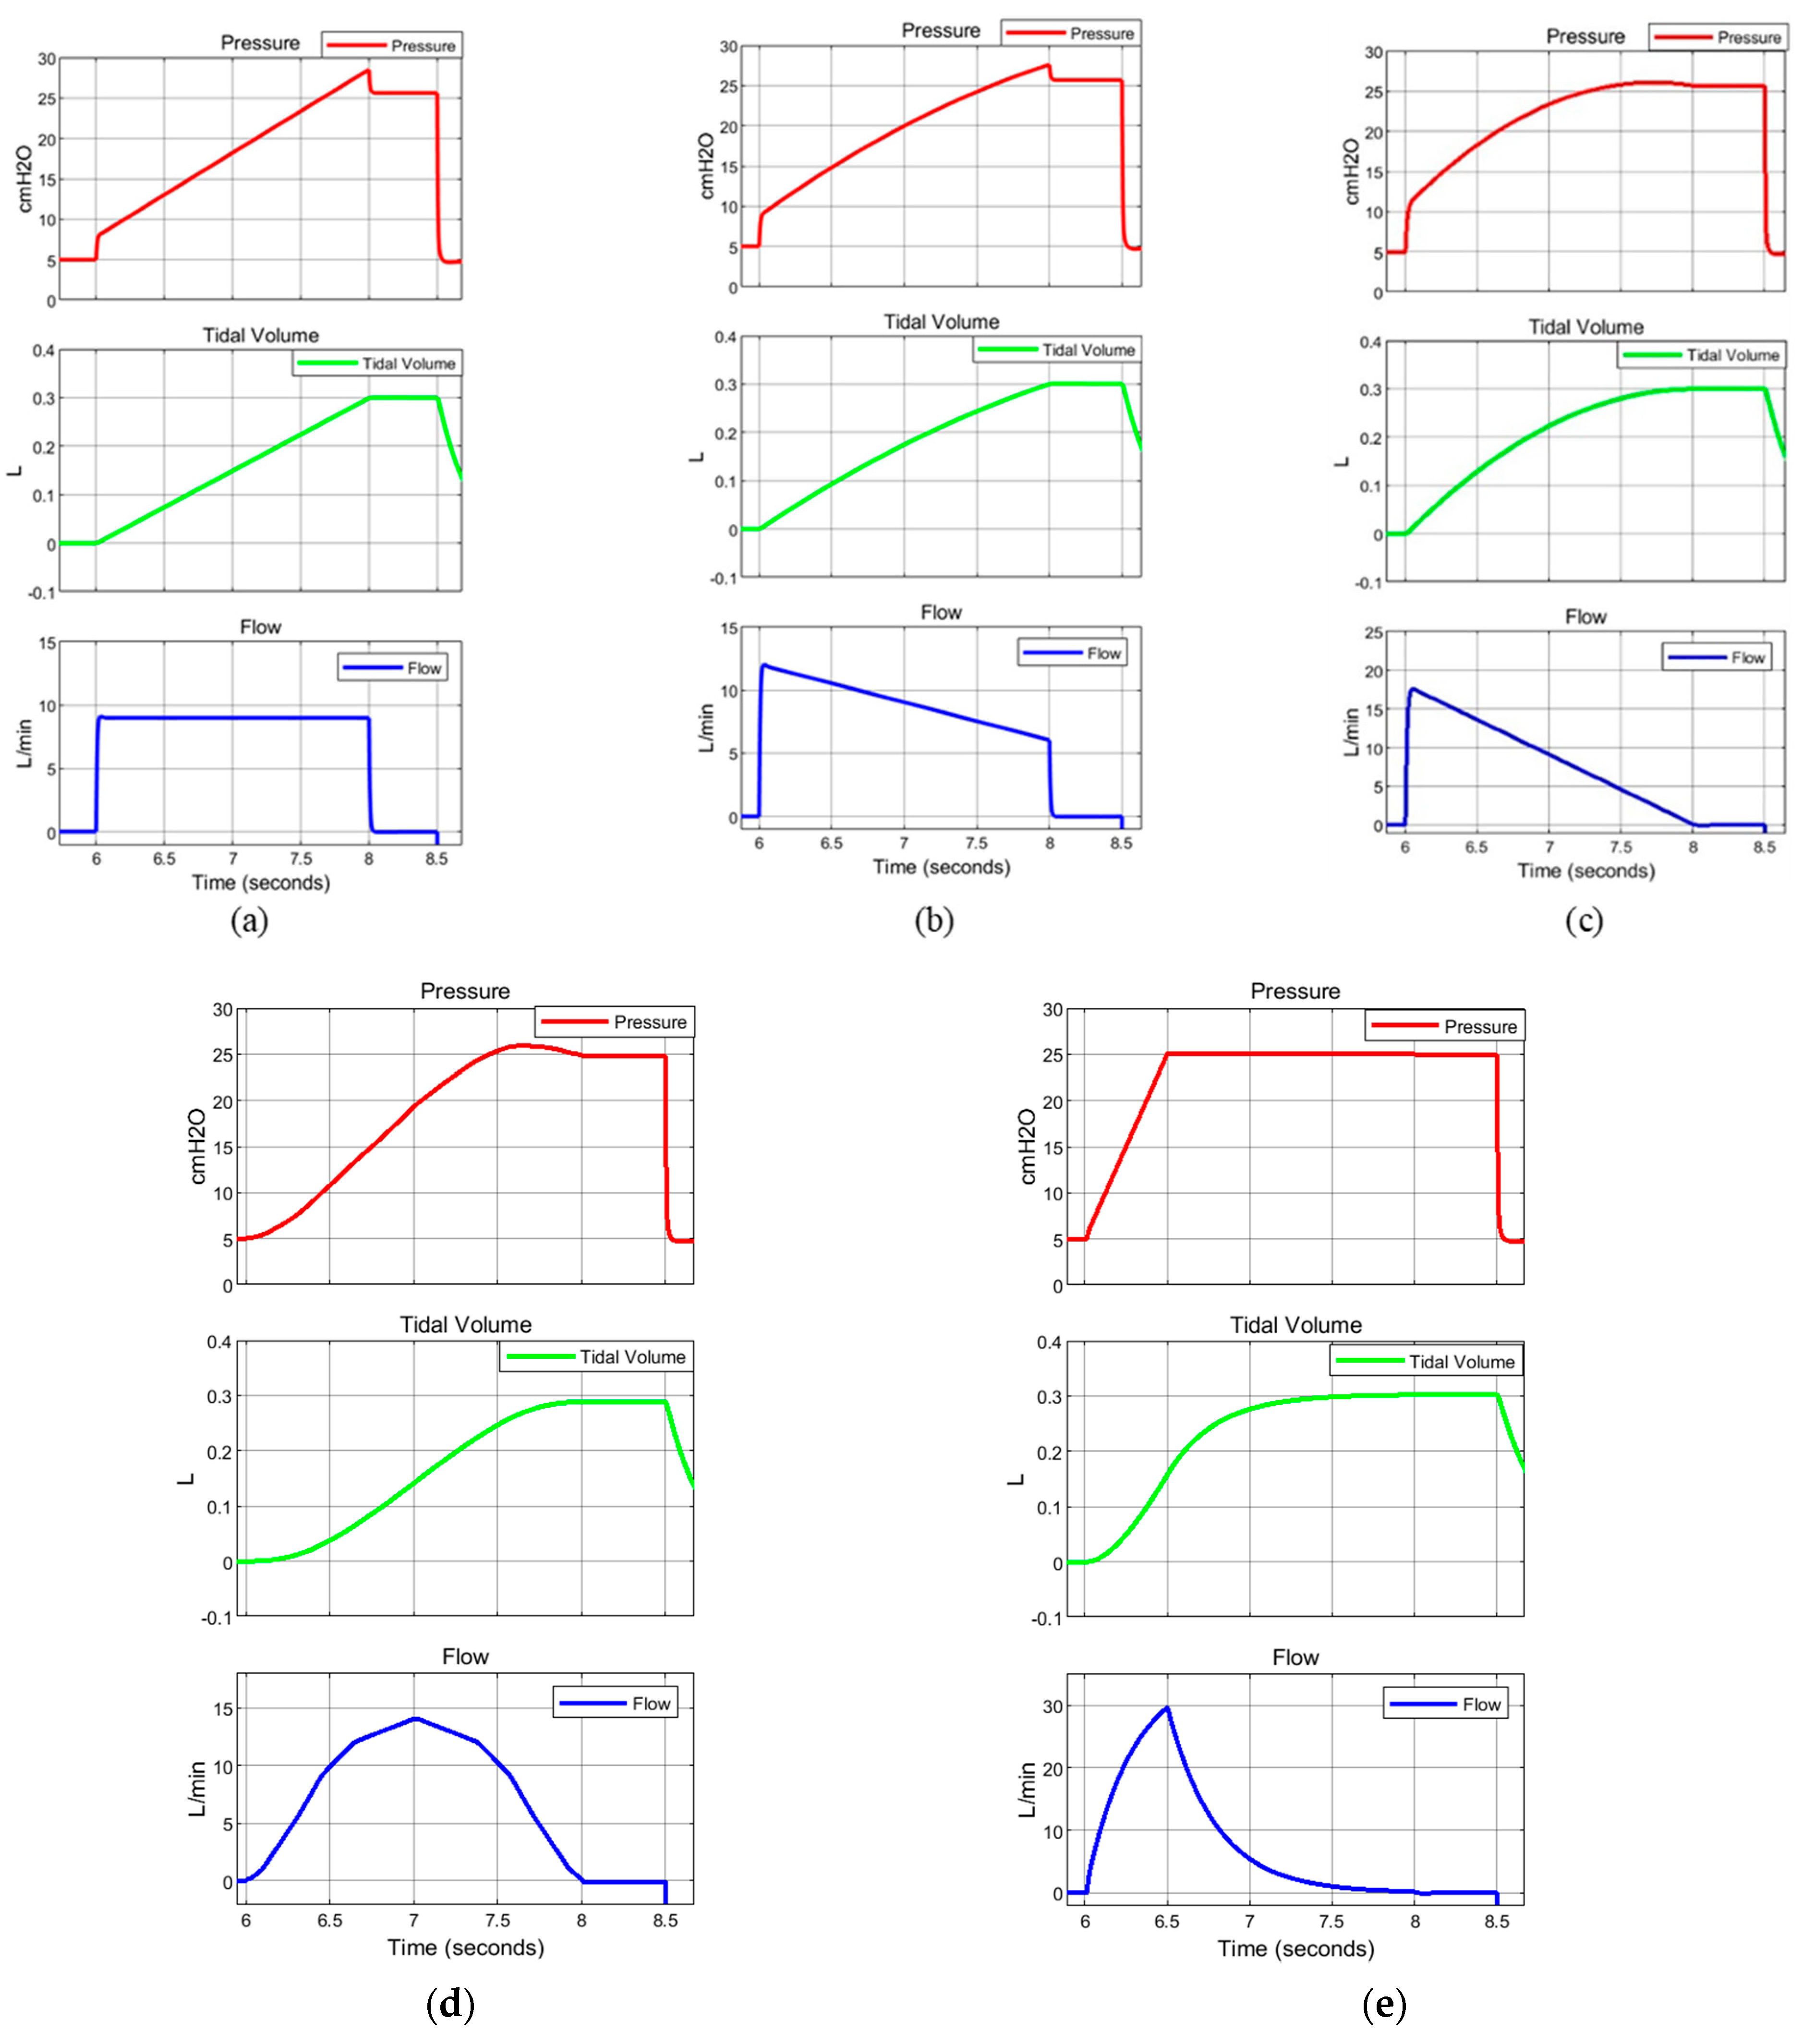
4. Simulation Code VC-CMV Mode
- The “Gas Properties” block, which allows the user to select from three gas propriety models: perfect gas, semi-perfect gas, or real gas; the specific gas constant is also set in this block;
- The “Pressure Source” block, used to simulate the air and oxygen sources (0); this block maintains a constant pressure at its outlet;
- The “Check Valve” block, which reproduces the check valves (2 and 20) and allows the flow to go in only one direction; the cracking pressure, which is the minimum upstream pressure required to open the valve, is set in this block;
- The “Reducing Valve” block, used to simulate the pressure reducing valve (3); the valve remains open when the downstream pressure is less than the set pressure, defined in the block proprieties;
- The “Pressure and Temperature Sensor” block, which reproduces the pressure sensors (4, 14, and 17) in order to monitor the pressure downstream of the pressure reducing valves, and downstream of the inspiratory and expiratory valves;
- The “Variable Orifice ISO 6358” block, used to simulate the air and oxygen metering valves (5 and 6); this block models a controlled pressure loss from port A to port B, based on the ISO 6358 standard, which can represent a valve, orifice, or restriction. The orifice opening fraction between 0 (valve closed) and 1 (maximum opening) is set by the control signal at port L. The valve properties, inside the block, can be set using the sonic conductance, the flow coefficient, or the restriction area of the corresponding valve;
- The “Constant Volume Chamber” block, used to reproduce the tank (7); the tank volume, located inside the block, can be set. The pressure in the tank is calculated according to the mass, the volume, and the temperature of the tank. This block is characterised by four ports: a sole inlet port (port A), two outlet ports (port B, connected to the downstream inspiratory valve (11), and port C, connected to the nebulizer), and the thermal conserving port associated with the thermal mass of the gas volume (port H);
- The “Two-Way Directional Valve” block, used to simulate the inspiratory and expiratory valve (11 and 19); the flow rate is calculated according to the ISO 6358 standard. The gas flows from port A to port B, and the open connection between these gas ports is determined by a positive control signal at port S. The valve properties can be set in the block using the sonic conductance, the flow coefficient, or the restriction area of the corresponding valve;
- The “Pressure Relief Valve” block, which reproduces the pressure relief valve (12); during normal operation the valve remains closed; however, if the upstream pressure is higher than the maximum pressure set in the block, the valve opens to permit gas flow;
- The “Two-Way Directional Valve” block, used to simulate the safety valve (13); during normal operation the valve is closed (the control signal is 0 at port S); however, if the system malfunctions, it opens to allow the patient to breathe out (the control signal is 1 at port S);
- The “Pipe” block, implemented in order to take into account the pressure drops in the circuit due to the presence of the heat exchanger and humidifier (15); this is possible by setting an equivalent length and an equivalent diameter in the block;
- The “Volumetric Flow Rate Sensor” block, which reproduces the flow sensor (16) in order to measure the flow rate (and tidal volume) inspired (>0) and expired (<0) by the patient.
- Two “Check Valve” blocks, used to allow the gas to flow through the upper/lower branch during inspiration/expiration, respectively; the cracking pressure, which is the minimum upstream pressure required to open the valve, is set in these blocks;
- Two “Local Restriction” blocks, which reproduce the inspiratory/expiratory resistance of the respiratory system, respectively; these blocks model the pressure loss due to a flow area restriction, the value of which can be set inside the blocks. The laminar flow pressure ratio and the cross-sectional area at the inlet/outlet port must also be defined in order to consider the type of flow conditions in the trachea and its dimensions;
- The “Translational Mechanical Converter” block (namely, a piston moving inside a cylinder), used to simulate the patient’s lungs (12);
- The “Spring” block, connected in series with the “Translational Mechanical Converter” block and used to simulate the compliance of the respiratory system.
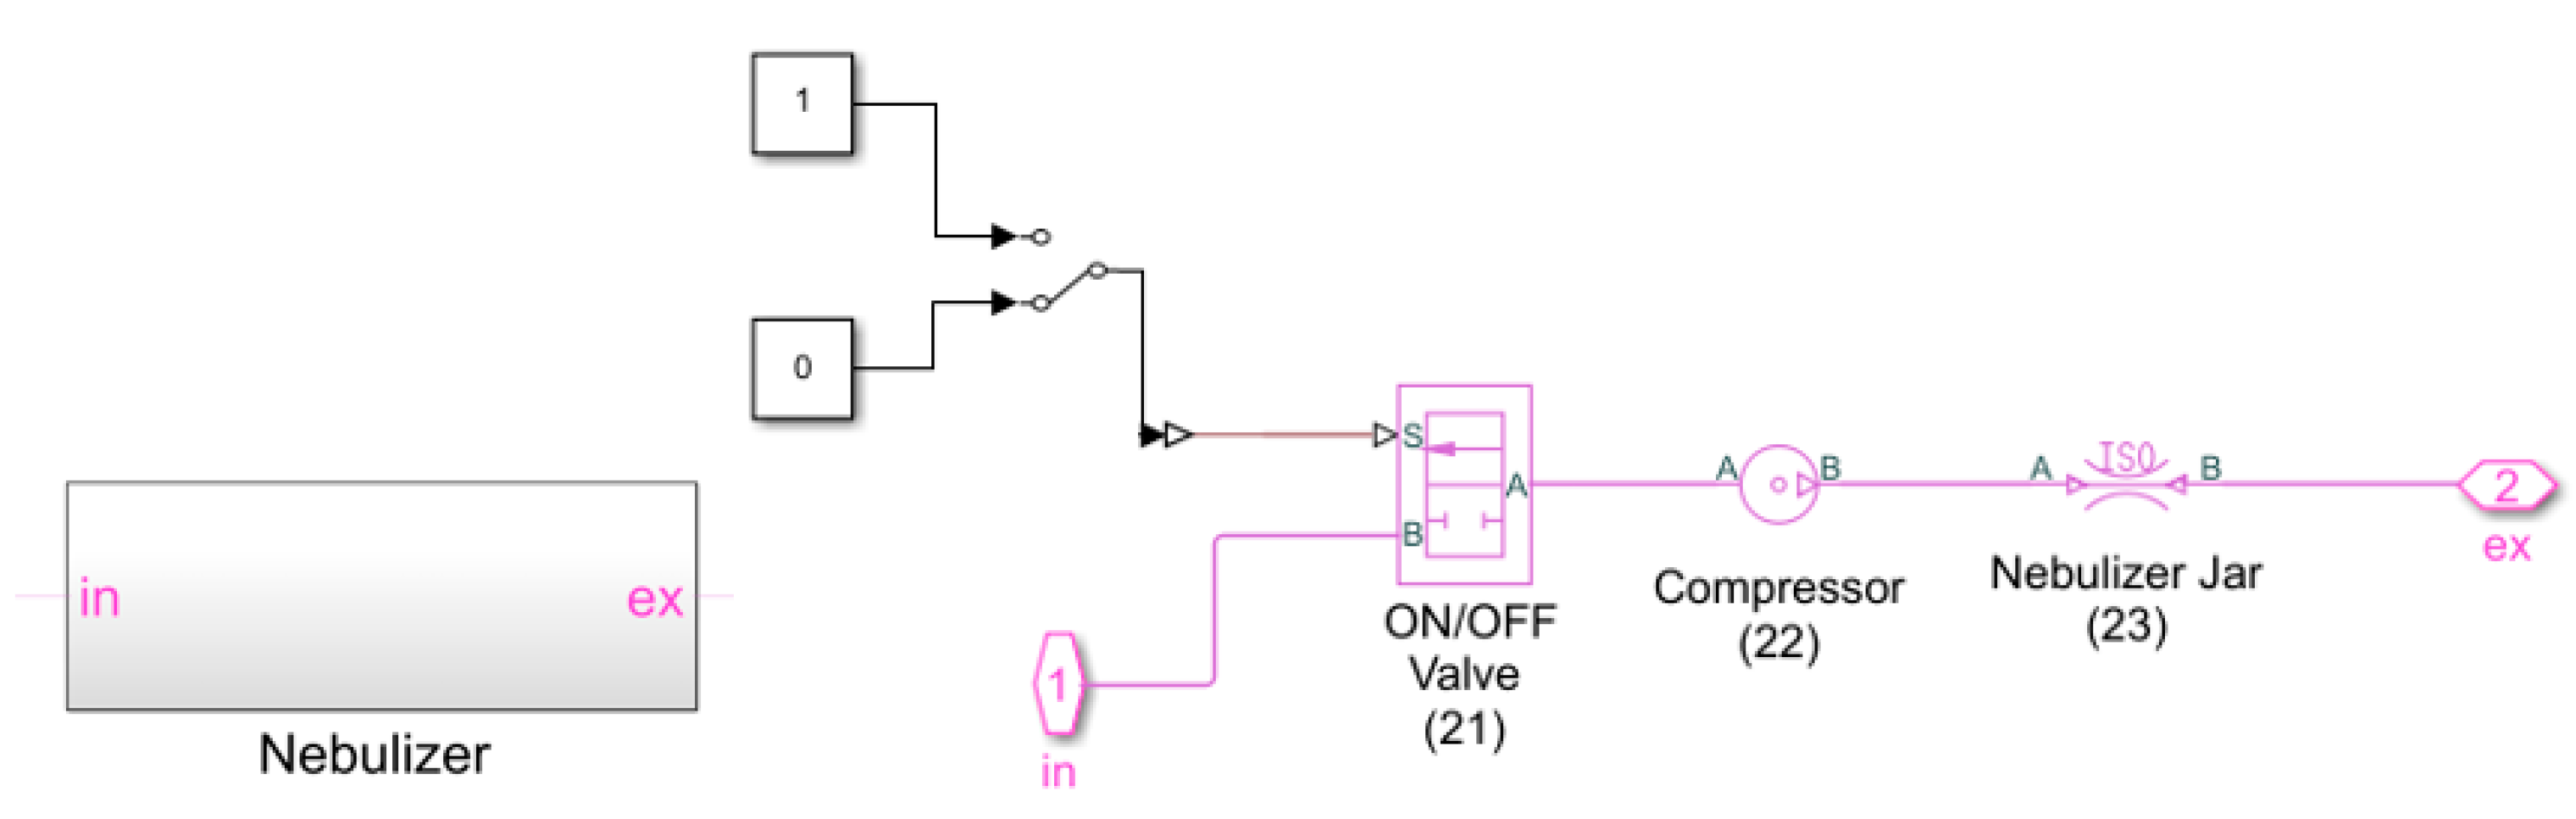
- The “Two-Way Directional Valve” block, used to simulate the ON/OFF valve (21); the control signal, at port S, being equal to either 0 or 1;
- The “Pressure Source” block, which reproduces the compressor (22); this block maintains a constant pressure at its outlet and its value can be set inside the block;
- The “Orifice ISO 6358” block, used to reproduce the nebulizer jar (23); again, the valve properties inside the block can be set using the sonic conductance, the flow coefficient, or the restriction area of the corresponding valve.
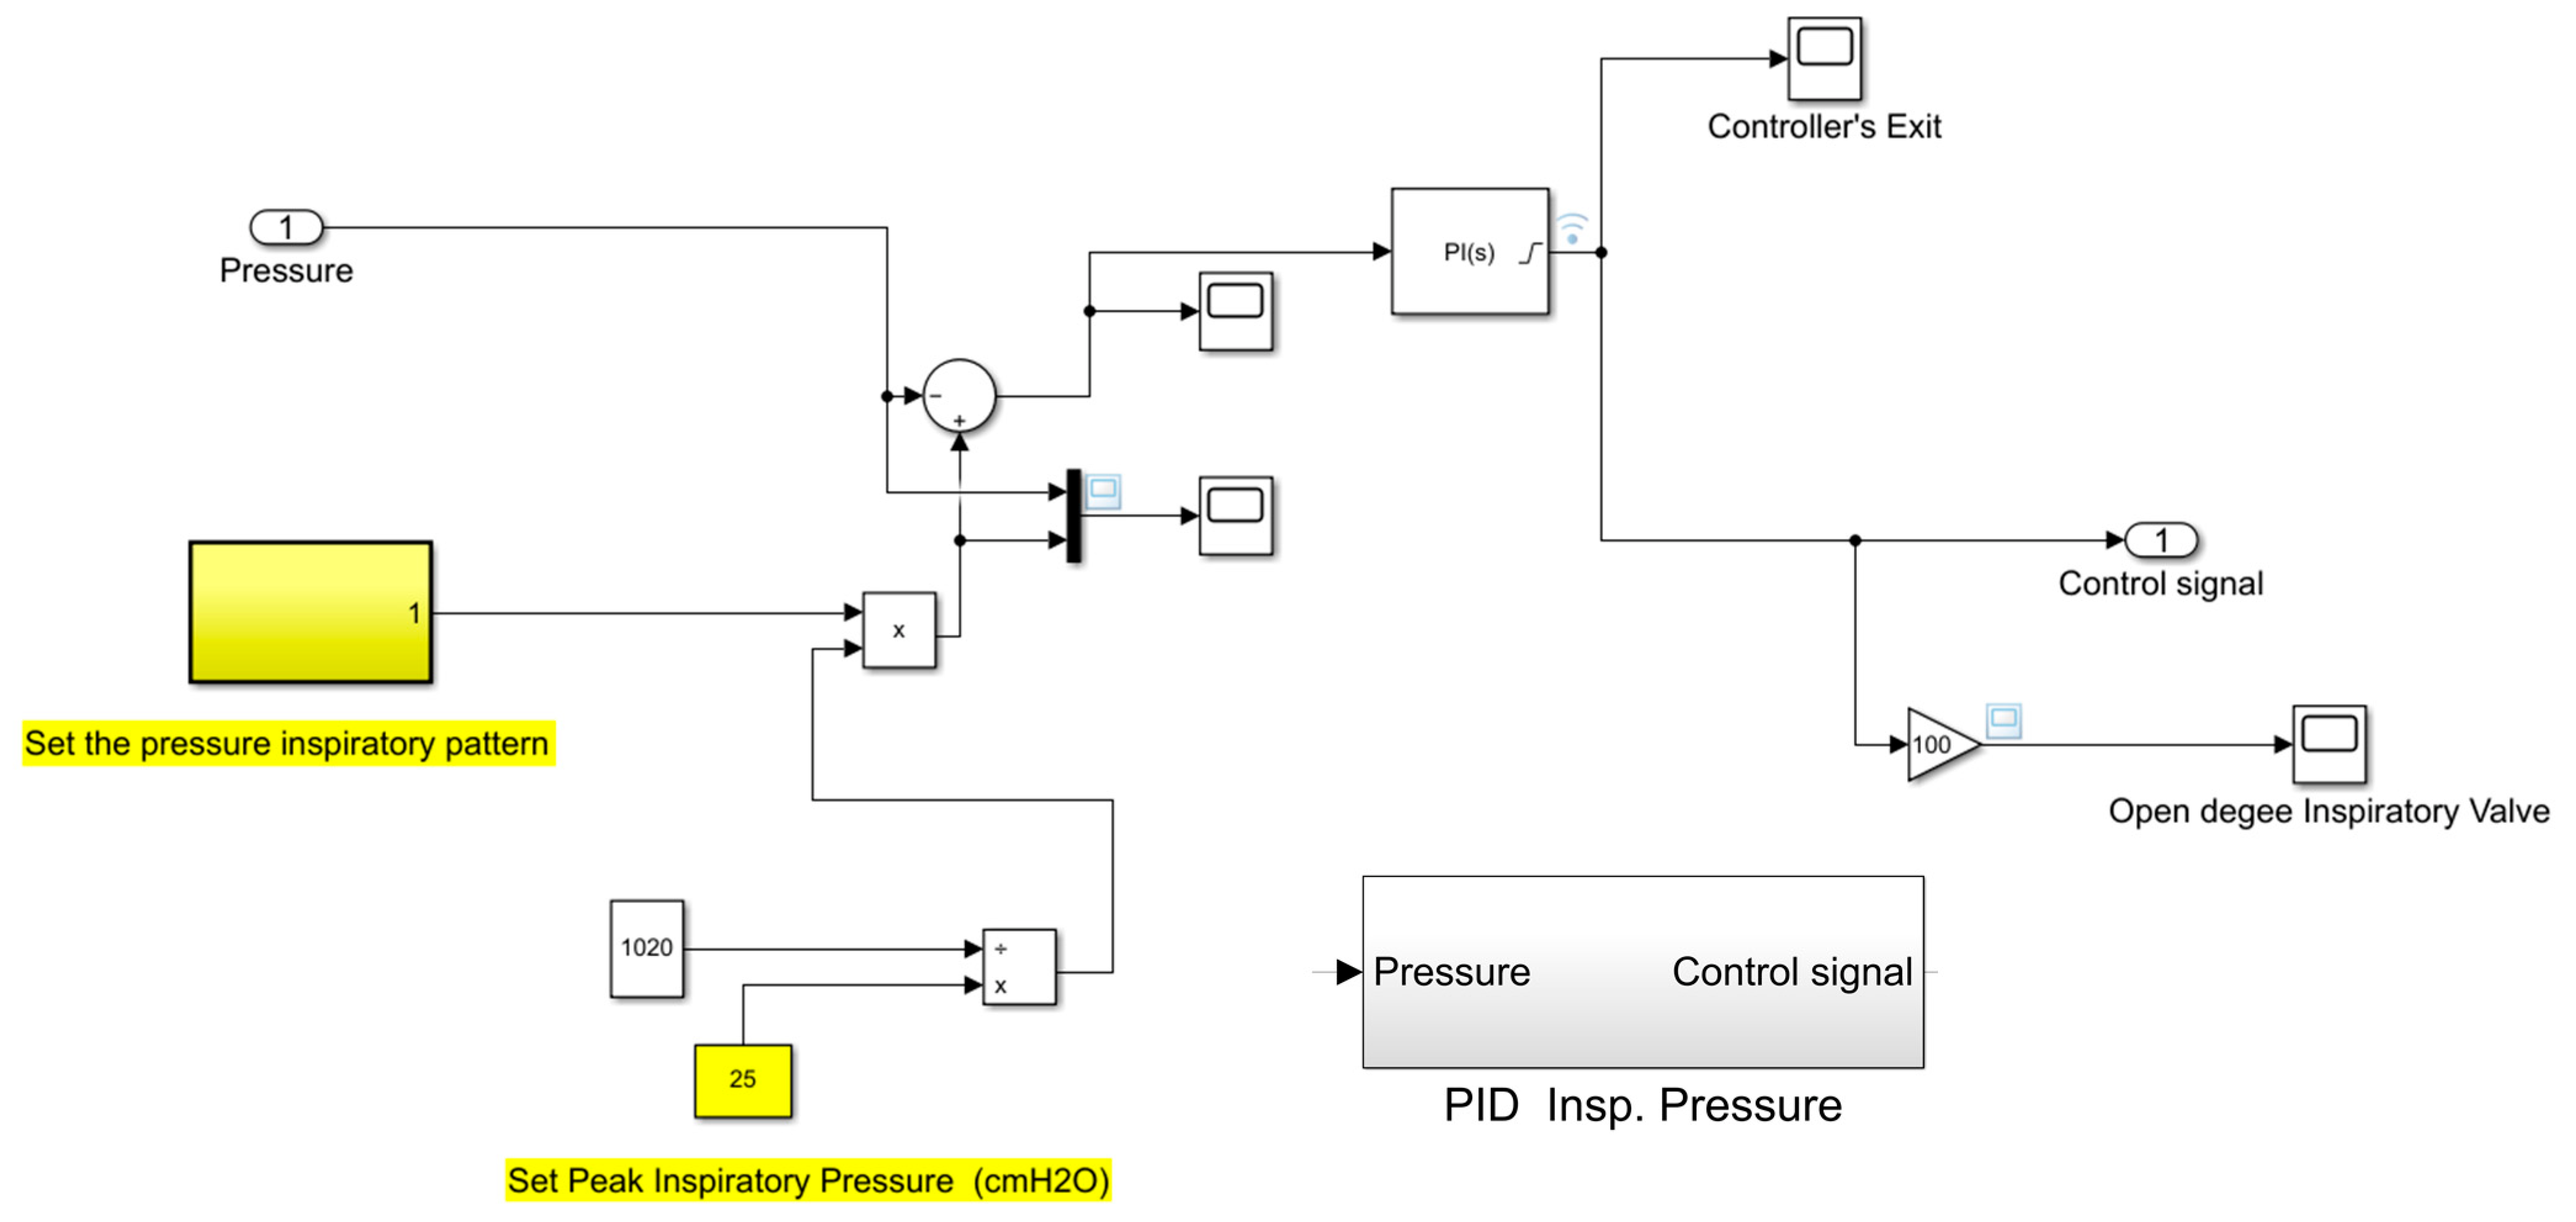
5. Simulation Code PC-CMV Mode
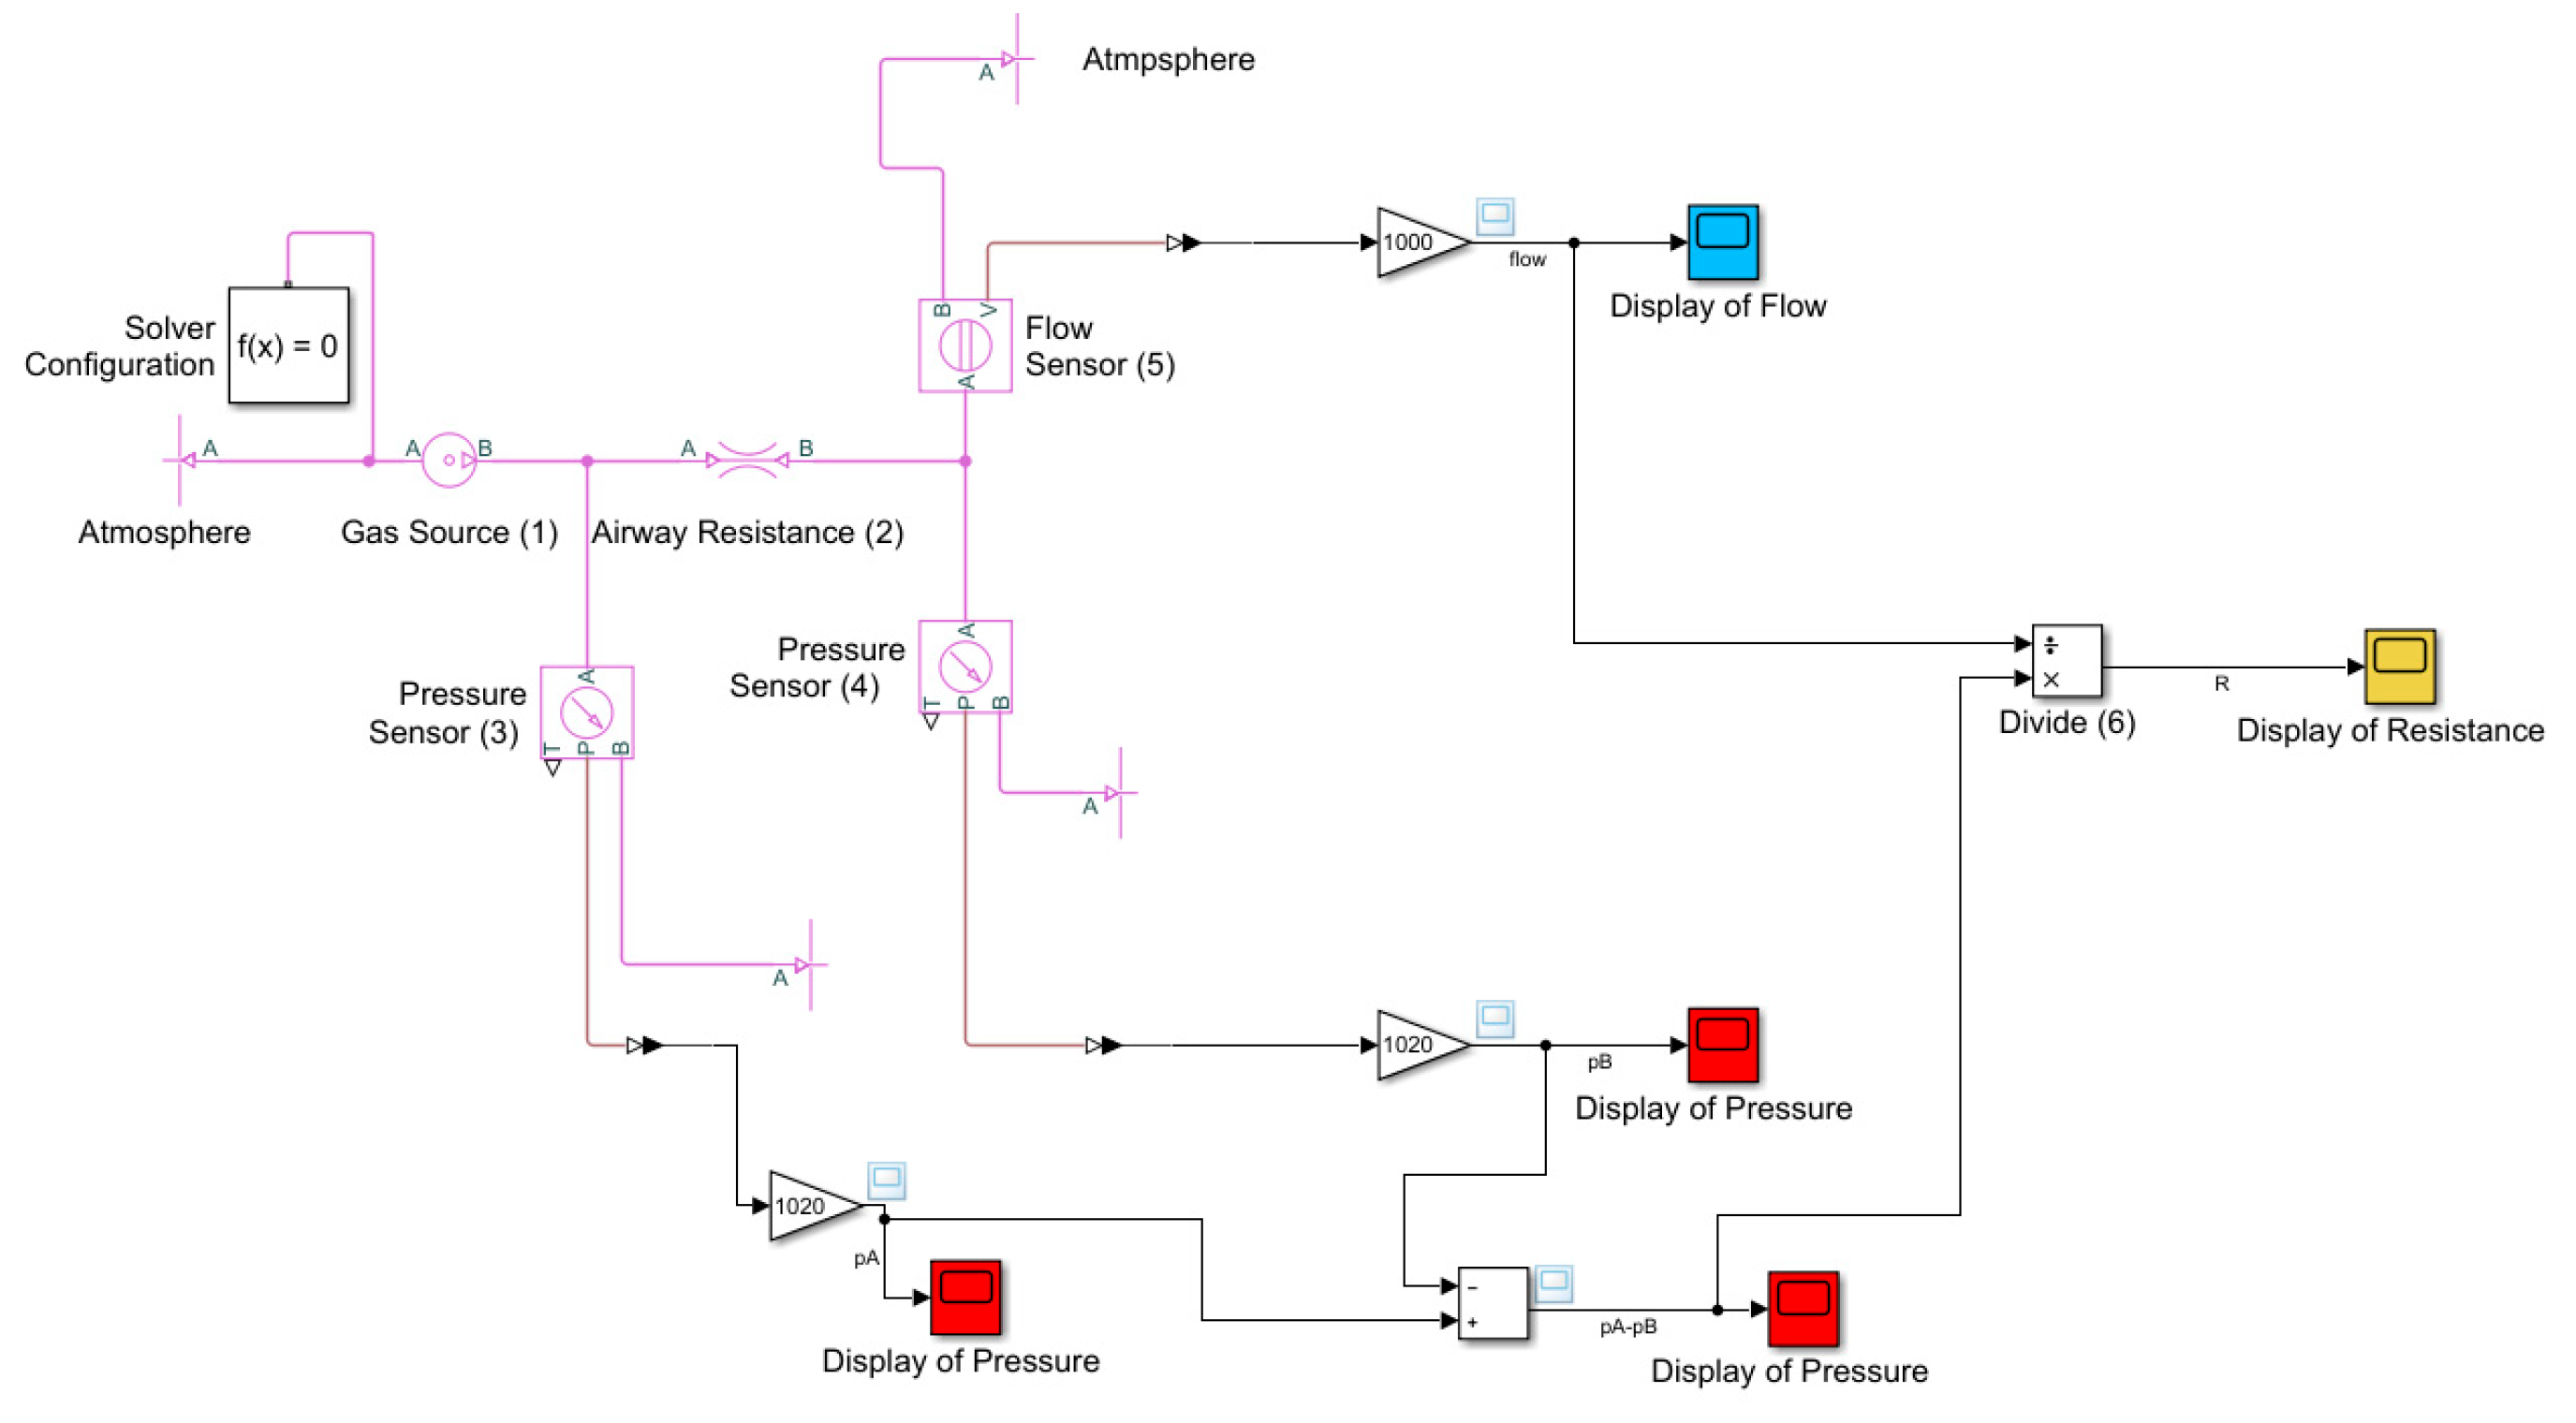
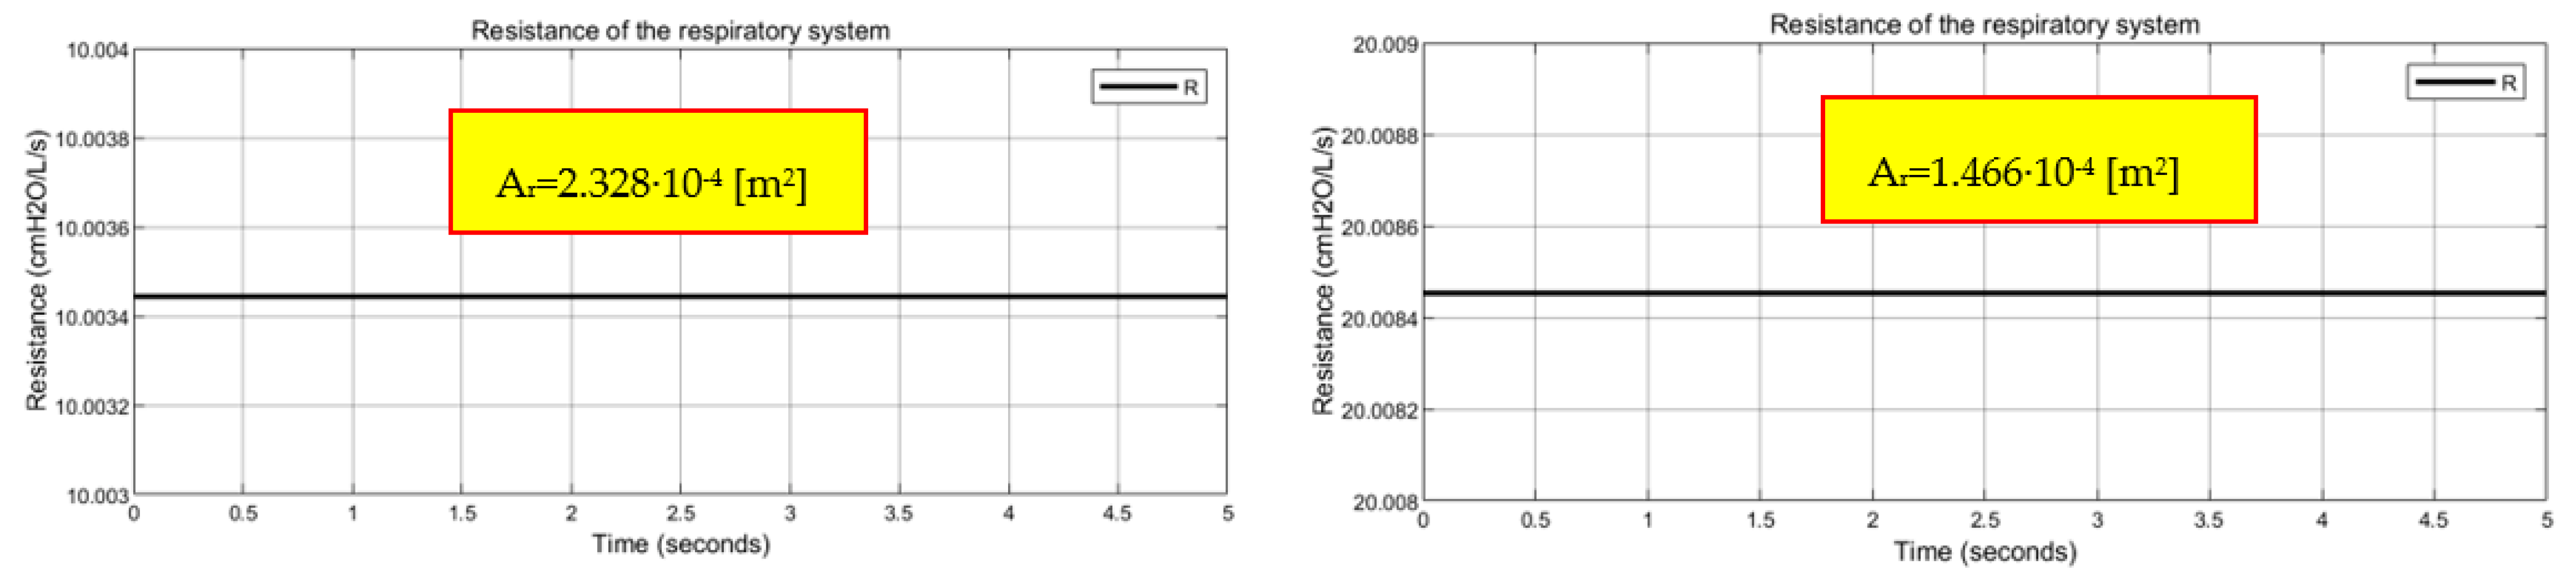
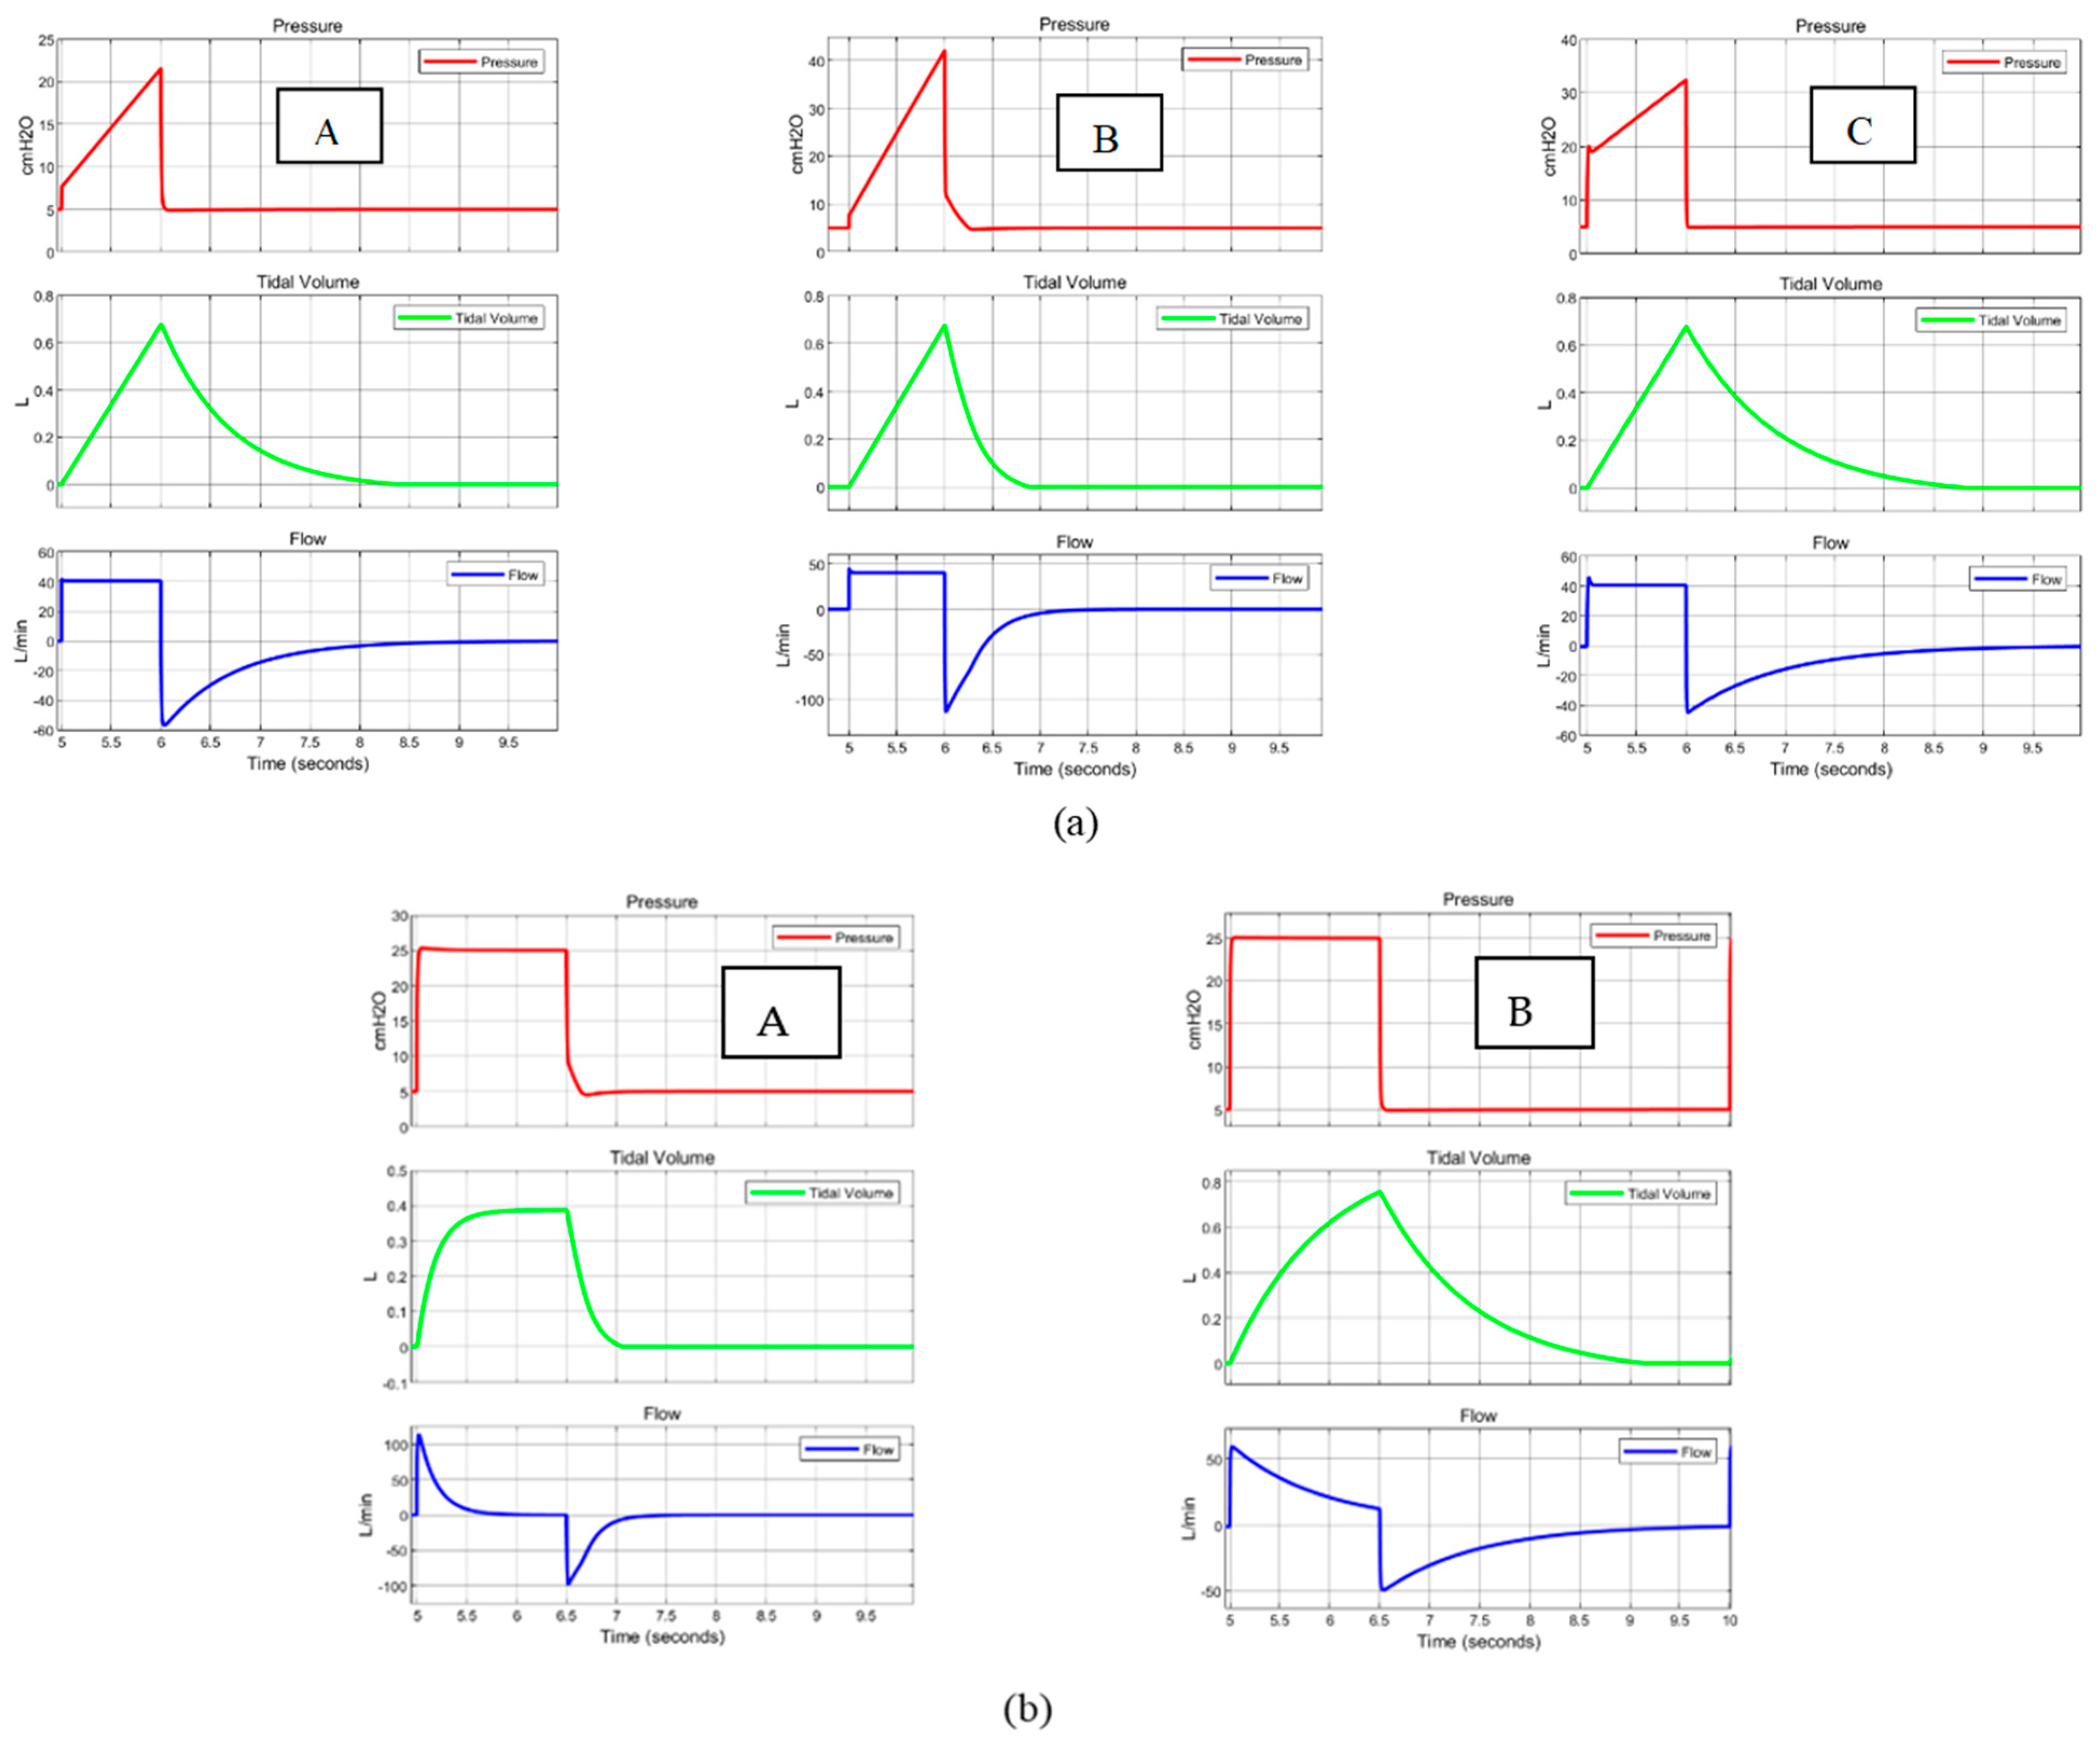
6. Simulation Code Airway Resistance
- The value of restriction area, so that different resistance values of the respiratory system can be evaluated;
- The “laminar flow pressure ratio”, a dimensionless coefficient set equal to 0.01 in order to indicate the fully developed laminar flow conditions inside the trachea;
- The value of the cross-sectional area at the inlet/outlet port, calculated according to the size of the diameter of the patient’s trachea (in the simulation code an average diameter of 25 mm has been considered, obtaining a section equal to 5 × 10⁻⁴ m2);
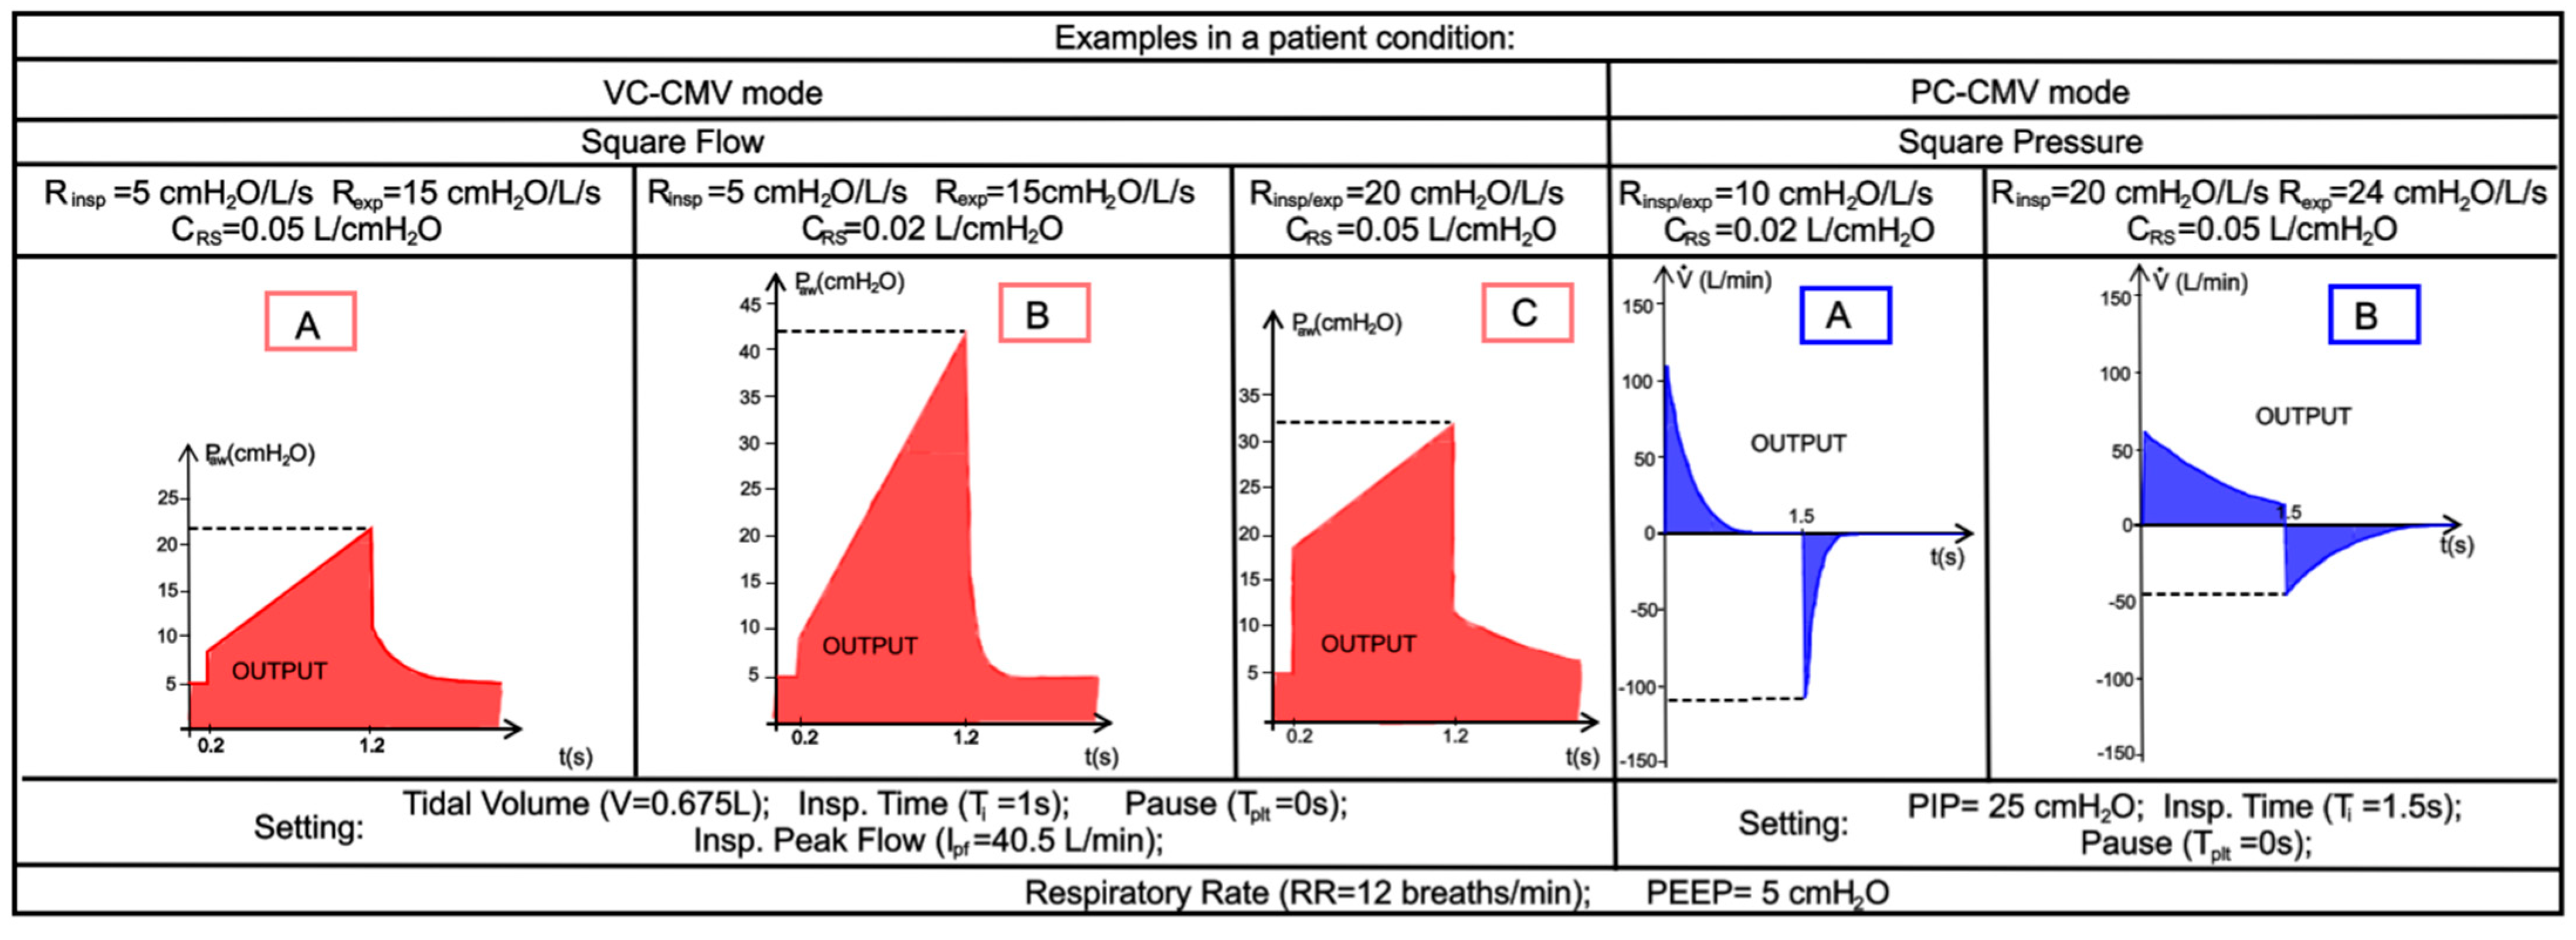
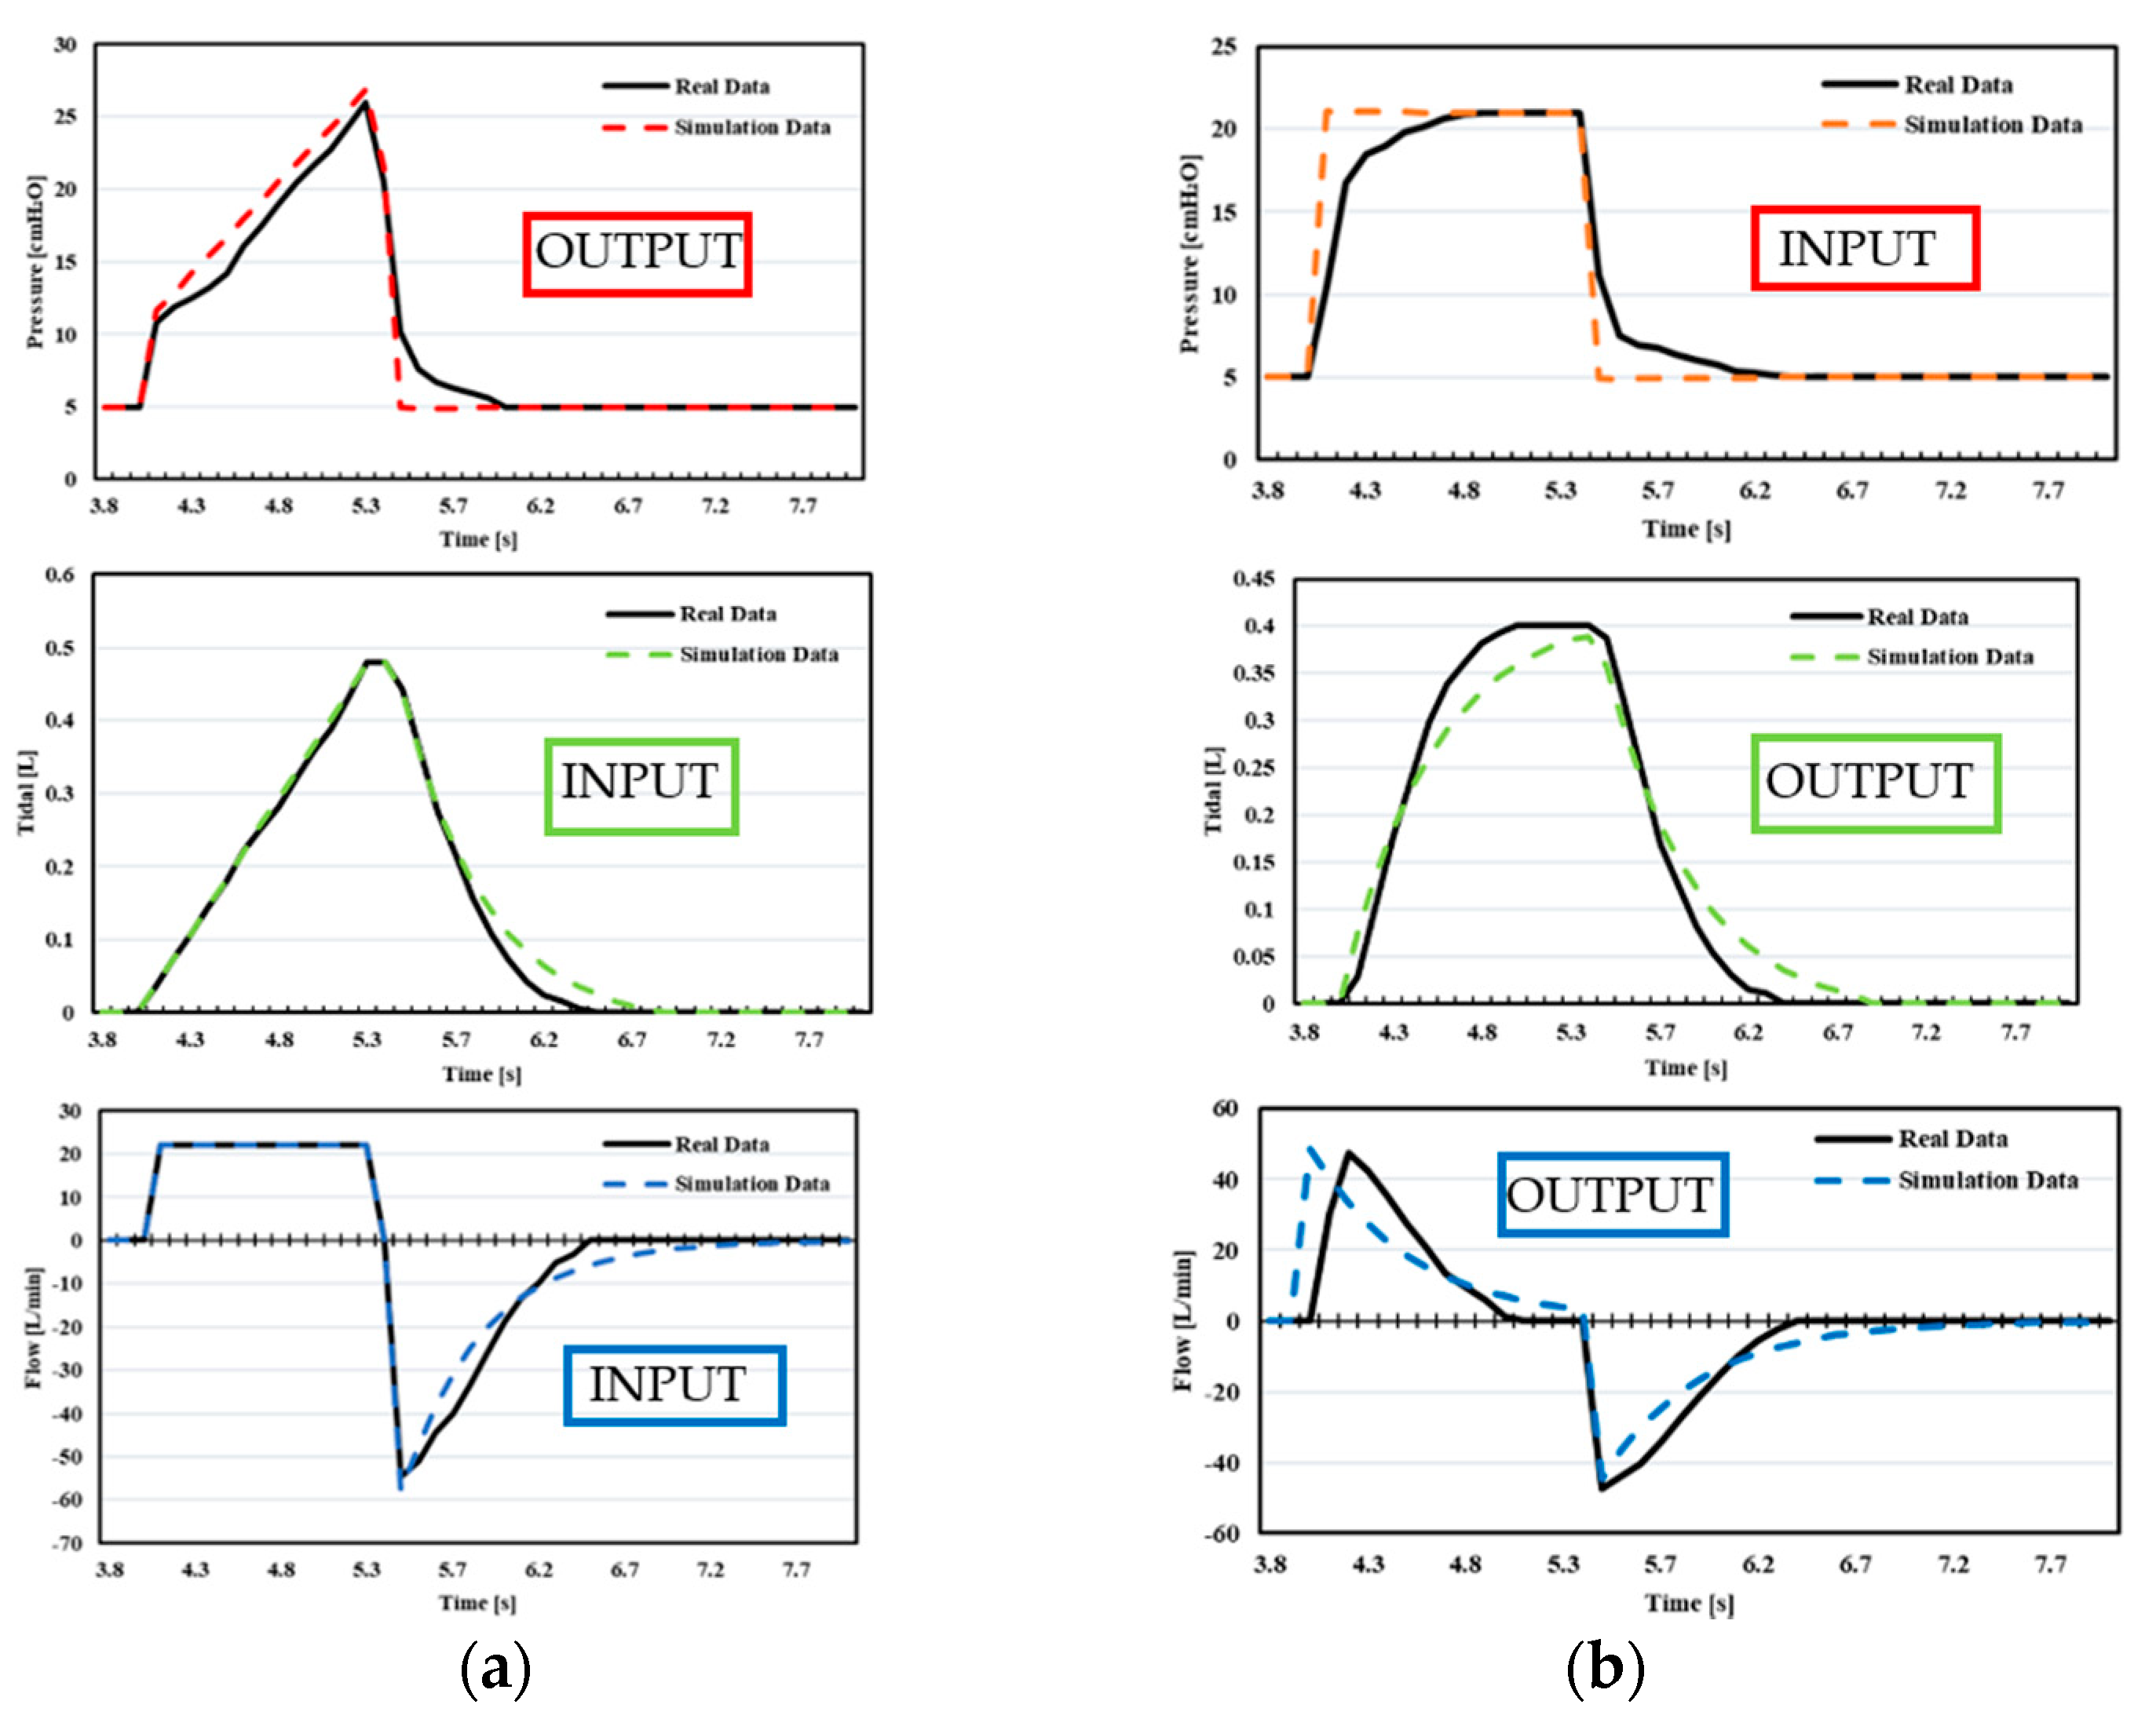
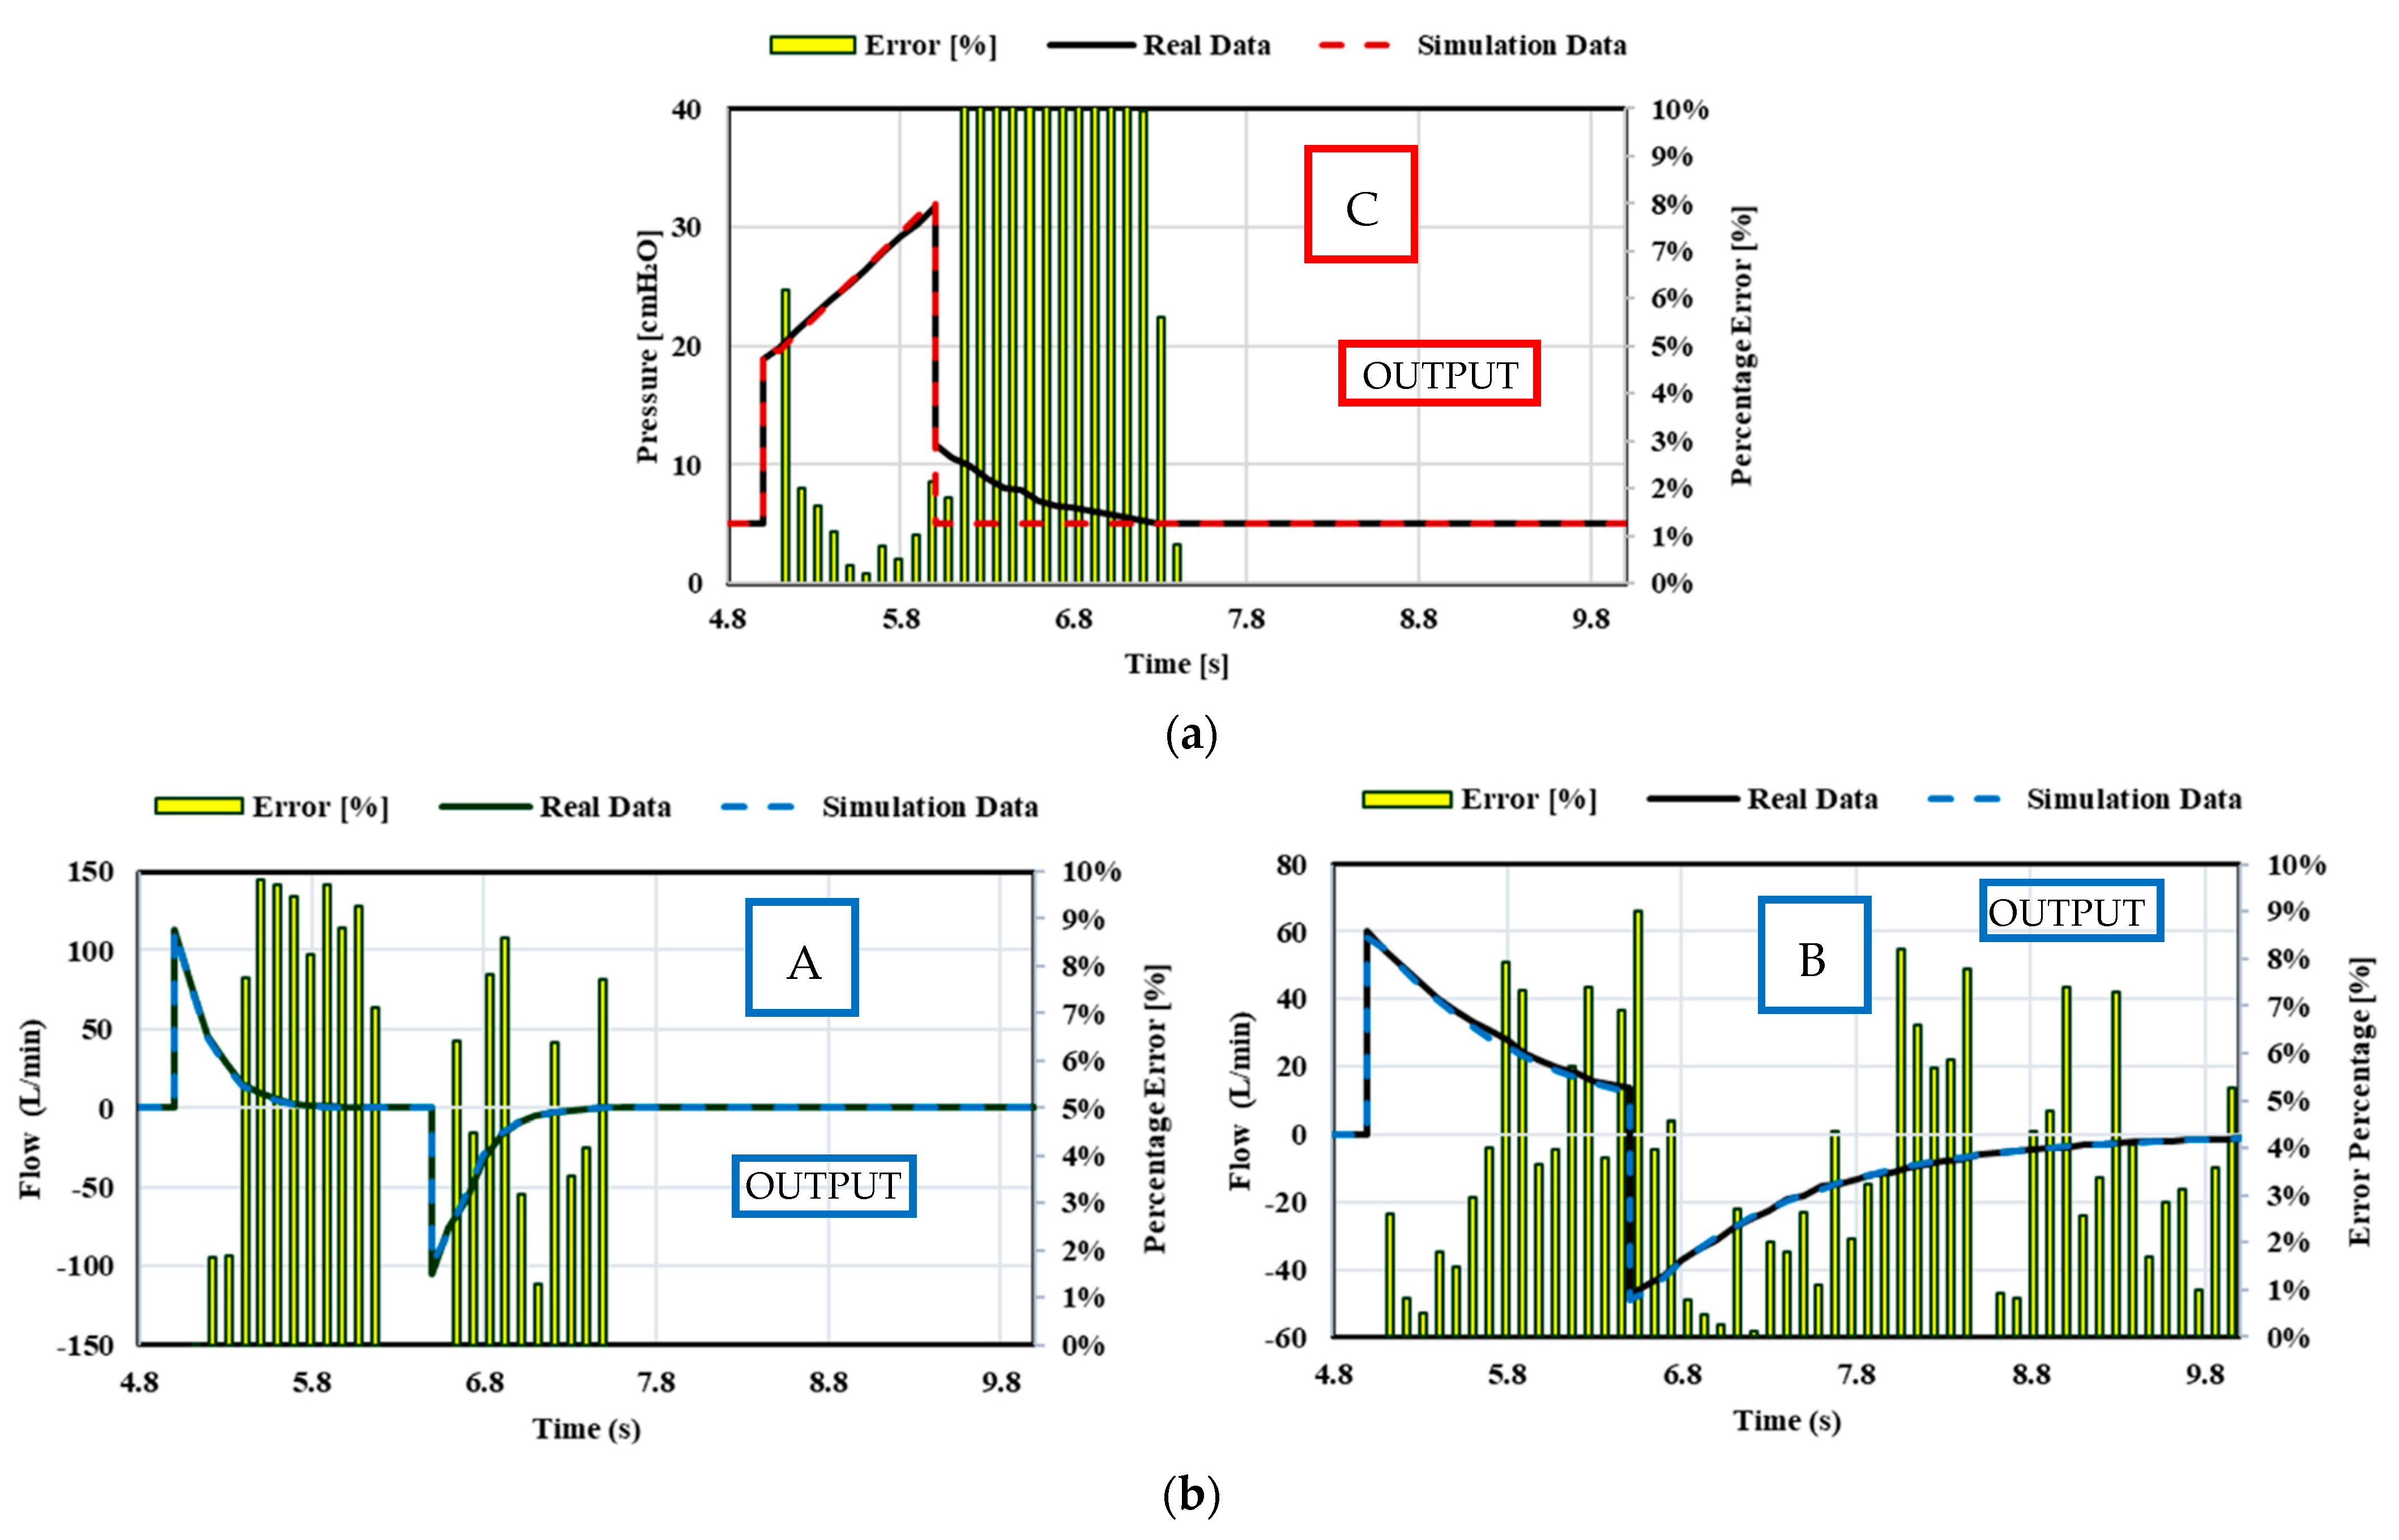
7. Validations
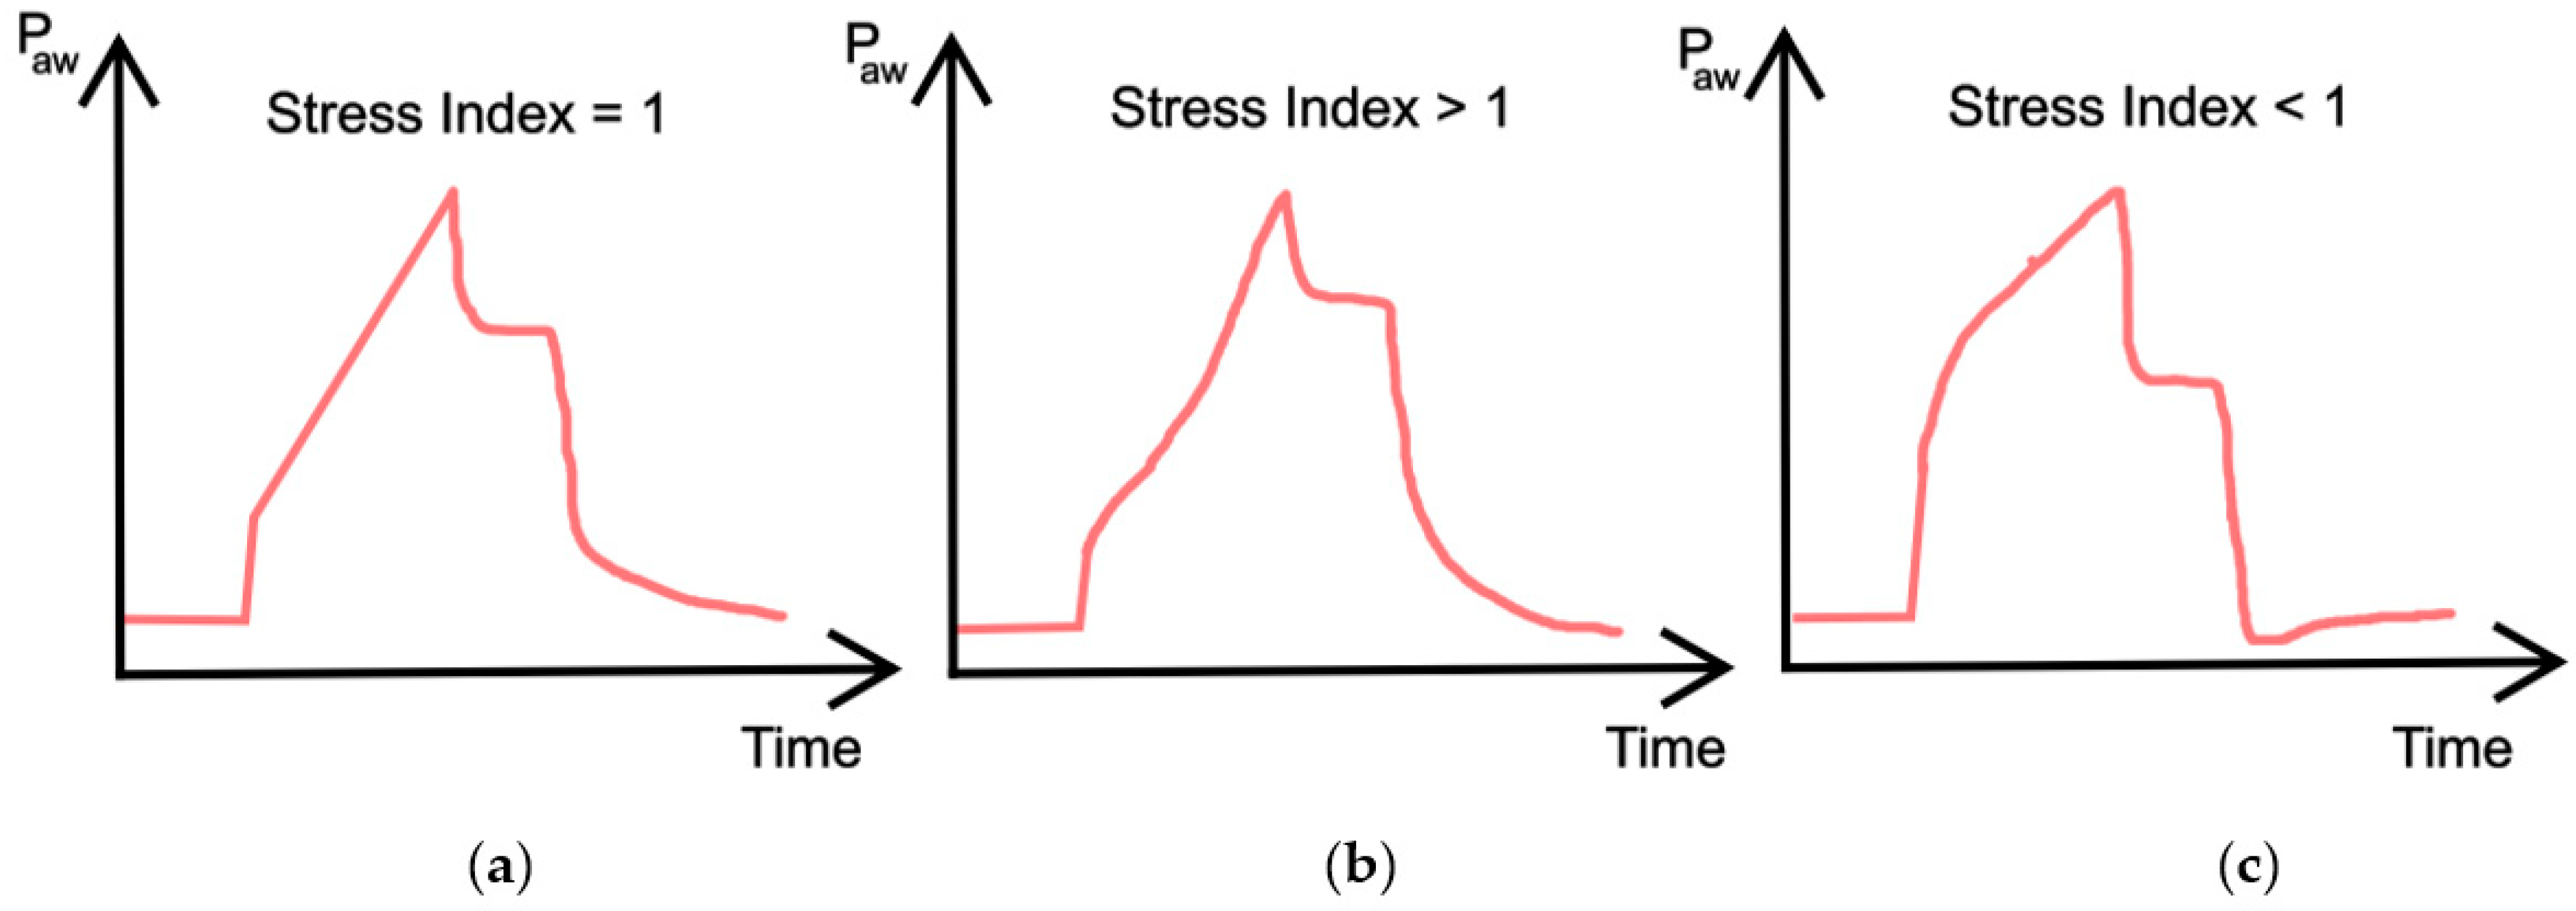
- In Case 2, during VC-CMV, the compliance does not remain constant during the inspiration. The compliance changes during inspiration due to the fact that the variation of the stress index, obtained by the pressure–time curve, has not been implemented into the Simulink model.
- In Case 2, during PC-CMV, an exponential rise has been used as the inspiratory pressure pattern, whereas in the Simulink model, a square pressure pattern has been employed.
8. Conclusions
- The analysis of the assisted–controlled ventilation modes that are employed for those patients who, despite having respiratory difficulties, are sometimes able to begin the inspiration phase independently. Therefore, the mechanical ventilator should be aware of the patient’s effort to inhale and facilitate it through the function of the inspiratory trigger. This would be made possible by including the inspiration effort of the patient into the simulation code by means of a controller, thus making the ventilator able to recognise this effort and provide the respiratory act;
- The addition of a mathematical model in the VC-CMV simulation code that takes into account compliance changes during inspiration, (i.e., stress index variation), in order to reduce the percentage error between the numerical predictions and real-life data;
- The possible use of the exponential rise in pressure pattern in the PC-CMV simulation code in order to make the model more accurate.
Author Contributions
Funding
Data Availability Statement
Conflicts of Interest
Appendix A


References
- Kobokovich, A. Ventilator Stockpiling and Availability in the US; Center for Health Security: Baltimore, MD, USA, 2020. [Google Scholar]
- Angulo, M.; Beltramelli, R.; Amarelle, L.; Alzugaray, P.; Briva, A.; Santos, C. Mechanical Risks of Ventilator Sharing in the COVID-19 Era: A Simulation-Based Study. Arch. Bronconeumol. 2020, 56, 752. [Google Scholar] [CrossRef] [PubMed]
- Solís-Lemus, J.A.; Costar, E.; Doorly, D.; Kerrigan, E.C.; Kennedy, C.H.; Tait, F.; Niderer, S.; Vincent, P.E.; Williams, S.E. A simulated single ventilator/dual patient ventilation strategy for acute respiratory distress syndrome during the COVID-19 pandemic. R. Soc. Open Sci. 2020, 7, 200585. [Google Scholar] [CrossRef] [PubMed]
- Pedersen, J.M.; Jebaei, F.; Jradi, M. Assessment of Building Automation and Control Systems in Danish Healthcare Facilities in the COVID-19 Era. Appl. Sci. 2022, 12, 427. [Google Scholar] [CrossRef]
- Campanini, M.; Lari, F.; Giorgi Pierfranceschi, M. La ventilazione non invasiva in Medicina Interna. Ital. J. Med. 2015, 3, 391–498. [Google Scholar]
- Walter, J.M.; Corbridge, T.C.; Singer, B.D. Invasive mechanical ventilation. South. Med. J. 2018, 111, 746. [Google Scholar] [CrossRef]
- Martin, J.T. Principles and Practice of Mechanical Ventilation; The McGraw-Hill Companies Inc.: New York, NY, USA, 2013. [Google Scholar]
- Cairo, J.M. Pilbeam’s Mechanical Ventilation: Physiological and Clinical Applications; Elsevier Health Sciences: St. Louis, MO, USA, 2015. [Google Scholar]
- Hickey, S.M.; Giwa, A.O. Mechanical Ventilation; StatPearls Publishing: Treasure Island, FL, USA, 2020. [Google Scholar]
- Santanilla, J.I.; Daniel, B.; Yeow, M.E. Mechanical ventilation. Emerg. Med. Clin. North Am. 2008, 26, 849–862. [Google Scholar] [CrossRef]
- Censi, F.; Calcagnini, G.; Mattei, E.; Triventi, M.; Bartolini, P. Tecnologie wireless e dispositivi medici: Aspetti normativi riguardanti la compatibilità elettromagnetica. Dell’istituto Superiore di Sanità dell’Istituto Superiore di Sanità 2010, 23, 11–16. [Google Scholar]
- GALILEO Service Manual. Available online: https://www.hamilton-medical.com (accessed on 5 June 2021).
- Dräger Infinity V500 Manual. Available online: https://www.draeger.com/en-us_us/Products/Evita-Infinity-V500-ventilator (accessed on 5 June 2021).
- Aisys CS2 User’s Reference Manual. Available online: http://www3.gehealthcare.it/ (accessed on 5 June 2021).
- Operator’s and Technical Reference Manual of Puritan Bennett 800 Series Ventilator System. Available online: https://www.medtronic.com/ (accessed on 5 June 2021).
- Specification for Rapidly Manufactured Ventilator System (RMVS). Issued by MHRA (2020). Available online: https://assets.publishing.service.gov.uk/government/uploads/system/uploads/attachment_data/file/879382/RMVS001_v4.pdf (accessed on 5 June 2021).
- Arnal, J.M.; Garnero, A.; Saoli, M.; Chatburn, R.L. Parameters for simulation of adult subjects during mechanical ventilation. Respir. Care 2018, 63, 158–168. [Google Scholar] [CrossRef] [Green Version]
- Mojoli, F.; Iotti, G.A.; Arnal, J.M.; Braschi, A. Is the ventilator switching from inspiration to expiration at the right time? Look at waveforms! Intensive Care Med. 2016, 42, 914–915. [Google Scholar] [CrossRef]
- Galbiati, C.; Abba, A.; Agnes, P.; Amaudruz, P.; Arba, M.; Ardellier-Desages, F.; Badia, C.; Batignani, G.; Bellani, G.; Bianchi, G.; et al. Mechanical Ventilator Milano (MVM): A novel mechanical ventilator designed for mass scale production in response to the COVID-19 pandemics. arXiv 2020, arXiv:2003.10405. [Google Scholar]
- Maggiali, M.; Crepaldi, M.; Pattacini, U.; Onorato, C. FI5 Ventilator; Istituto Italiano di Tecnologia: Genova, Italy, 2020. [Google Scholar]
- Grasselli, G.; Cattaneo, E.; Florio, G.; Ippolito, M.; Zanella, A.; Cortegiani, A.; Huang, J.; Pesenti, A.; Einav, S. Mechanical ventilation parameters in critically ill COVID-19 patients: A scoping review. Crit. Care 2021, 25, 1–11. [Google Scholar] [CrossRef] [PubMed]
- Botta, M.; Tsonas, A.M.; Pillay, J.; Boers, L.S.; Algera, A.G.; Bos, L.D.; Dongelmans, D.A.; Hollmann, M.W.; Horn, J.; Vlaar, A.P.J.; et al. Ventilation management and clinical outcomes in invasively ventilated patients with COVID-19 (PRoVENT-COVID): A national, multicentre, observational cohort study. Lancet Respir. Med. 2021, 9, 139–148. [Google Scholar] [CrossRef]
- Cavayas, Y.A.; Noël, A.; Brunette, V.; Williamson, D.; Frenette, A.J.; Arsenault, C.; Bellamare, P.; Lagrenade-Verdant, C.; LeGuillan, S.; Levesque, E.; et al. Early experience with critically ill patients with COVID-19 in Montreal. Can. J. Anesth. J. Can. D’anesthésie 2021, 68, 204–213. [Google Scholar] [CrossRef] [PubMed]
- Sinha, P.; Calfee, C.S.; Cherian, S.; Brealey, D.; Cutler, S.; King, C.; Killick, C.; Richards, O.; Cheema, Y.; Bailey, C.; et al. Prevalence of phenotypes of acute respiratory distress syndrome in critically ill patients with COVID-19: A prospective observational study. Lancet Respir. Med. 2020, 8, 1209–1218. [Google Scholar] [CrossRef]
- Bos, L.D.; Paulus, F.; Vlaar, A.P.; Beenen, L.F.; Schultz, M.J. Subphenotyping acute respiratory distress syndrome in patients with COVID-19: Consequences for ventilator management. Ann. Am. Thorac. Soc. 2020, 17, 1161–1163. [Google Scholar] [CrossRef]
- Diehl, J.L.; Peron, N.; Chocron, R.; Debuc, B.; Guerot, E.; Hauw-Berlemont, C.; Hermann, B.; Augy, J.L.; Younan, R.; Novara, A.; et al. Respiratory mechanics and gas exchanges in the early course of COVID-19 ARDS: A hypothesis-generating study. Ann. Intensive Care 2020, 10, 1–7. [Google Scholar] [CrossRef]
- Grasselli, G.; Tonetti, T.; Protti, A.; Langer, T.; Girardis, M.; Bellani, G.; Laffey, J.; Carrafiello, G.; Carsana, L.; Rizzuto, C.; et al. Pathophysiology of COVID-19-associated acute respiratory distress syndrome: A multicentre prospective observational study. Lancet Respir. Med. 2020, 8, 1201–1208. [Google Scholar] [CrossRef]
- Bonci, A.; De Amicis, R.; Longhi, S.; Scala, G.A.; Andreucci, A. Motorcycle lateral and longitudinal dynamic modeling in presence of tyre slip and rear traction. In Proceedings of the 2016 21st International Conference on Methods and Models in Automation and Robotics (MMAR), Miedzyzdroje, Poland, 29 August–1 September 2016; pp. 391–396. [Google Scholar]
- Bonci, A.; De Amicis, R.; Longhi, S.; Lorenzoni, E.; Scala, G.A. A motorcycle enhanced model for active safety devices in intelligent transport systems. In Proceedings of the 2016 12th IEEE/ASME International Conference on Mechatronic and Embedded Systems and Applications (MESA), Auckland, New Zealand, 29–31 August 2016; pp. 1–6. [Google Scholar]
- Bonci, A.; Longhi, S.; Scala, G.A. Towards an all-wheel drive motorcycle: Dynamic modeling and simulation. IEEE Access 2020, 8, 112867–112882. [Google Scholar] [CrossRef]
- Hernández-Santos, C.; Davizón, Y.A.; Said, A.R.; Soto, R.; Felix-Herrán, L.C.; Vargas-Martínez, A. Development of a Wearable Finger Exoskeleton for Rehabilitation. Appl. Sci. 2021, 11, 4145. [Google Scholar] [CrossRef]
- Yahya, Y.Z.; Al-Sawaff, Z.H. Design and Modeling of An Upper Limb Exoskeleton to Assist Elbow Joint Movement Using Surface Emg Signals. Biomed. Eng. Appl. Basis Commun. 2020, 32, 2050006. [Google Scholar] [CrossRef]
- Zhang, G.; Wang, J.; Yang, P.; Guo, S. Iterative learning sliding mode control for output-constrained upper-limb exoskeleton with non-repetitive tasks. Appl. Math. Model. 2021, 97, 366–380. [Google Scholar] [CrossRef]
- Giri, J.; Kshirsagar, N.; Wanjari, A. Design and simulation of AI-based low-cost mechanical ventilator: An approach. Mater. Today Proc. 2021, 47, 5886–5891. [Google Scholar] [CrossRef] [PubMed]
- Guler, H.; Ata, F. Design of a fuzzy-LabVIEW-based mechanical ventilator. Comput. Syst. Sci. Eng. 2014, 29, 219–229. [Google Scholar]
- Pasteka, R.; Santos da Costa, J.P.; Barros, N.; Kolar, R.; Forjan, M. Patient–Ventilator Interaction Testing Using the Electromechanical Lung Simulator xPULM™ during V/AC and PSV Ventilation Mode. Appl. Sci. 2021, 11, 3745. [Google Scholar] [CrossRef]
- Pasteka, R.; Forjan, M.; Sauermann, S.; Drauschke, A. Electro-mechanical lung simulator using polymer and organic human lung equivalents for realistic breathing simulation. Sci. Rep. 2019, 9, 1–12. [Google Scholar]
- El-Hadj, A.; Kezrane, M.; Ahmad, H.; Ameur, H.; Abd Rahim, S.Z.B.; Younsi, A.; Abu-Zinadah, H. Design and simulation of mechanical ventilators. Chaos Solitons Fractals 2021, 150, 111169. [Google Scholar] [CrossRef] [PubMed]
- Simulink Documentation, The MathWorks, Inc. 2019. Available online: https://www.mathworks.com/help/simulink/ (accessed on 1 June 2021).
- Matlab & Simulink. SimscapeTM User’s Guide R2019a; The MathWorks, Inc.: Natick, MA, USA, 2019. [Google Scholar]
- Chatburn, R.L.; El-Khatib, M.; Mireles-Cabodevila, E. A taxonomy for mechanical ventilation: 10 fundamental maxims. Respir. Care 2014, 59, 1747–1763. [Google Scholar] [CrossRef] [PubMed] [Green Version]
- Chatburn, R.L. Classification of ventilator modes: Update and proposal for implementation. Respir. Care 2007, 52, 301–323. [Google Scholar]
- Kacmarek, R.M.; Stoller, J.K.; Heuer, A. Egan’s Fundamentals of Respiratory Care E-Book; Elsevier Health Sciences: St. Louis, MO, USA, 2019. [Google Scholar]
- Chatburn, R.L.; Lough, M.D. Mechanical ventilation. In Pediatric Respiratory Therapy, 3rd ed.; Mandu Press LTD: Cleveland, OH, USA, 2003. [Google Scholar]
- Correger, E.; Murias, G.; Chacon, E.; Estruga, A.; Sales, B.; Lopez-Aguilar, J.; Montanya, J.; Lucangelo, U.; Garcia-Esquirol, O.; Villagra, A.; et al. Interpretation of ventilator curves in patients with acute respiratory failure. Med. Intensiva Engl. Ed. 2012, 36, 294–306. [Google Scholar] [CrossRef]
- Pupella, R.A. Mechanical Ventilation in Patient with Respiratory Failure; Springer: Singapore, 2018. [Google Scholar]
- Al Ashry, H.S.; Modrykamien, A.M. Humidification during mechanical ventilation in the adult patient. BioMed Res. Int. 2014, 2014, 715434. [Google Scholar] [CrossRef] [Green Version]
- Available online: https://drive.google.com/drive/folders/1HM67XfqYSK4togaiFIuD3qpaWvFapPqG?usp=sharing (accessed on 28 October 2021).
- Hess, D.; Kacmarek, R.M. Essentials of Mechanical Ventilation; McGraw Hill Education: New York, NY, USA, 2014. [Google Scholar]


| Control Variables | Breath Sequence | Ventilation Mode | Acronym |
|---|---|---|---|
| Pressure | CSV | Pressure Support | PS-CSV |
| CMV | Pressure Control | PC-CMV | |
| IMV | Pressure Control | PC-IMV | |
| Flow–Volume | CMV | Volume Control | VC-CMV |
| IMV | Volume Control | VC-IMV |
| Ventilation Mode | Trigger Variable | Limit Variable | Cycle Variable |
|---|---|---|---|
| Controlled | Ventilator | Ventilator | Ventilator |
| Assisted–Controlled | Patient | Ventilator | Ventilator |
| Supported | Patient | Ventilator | Patient |
| Spontaneous | Patient | Patient | Patient |
| Mode | Parameter | Symbol | Equation |
|---|---|---|---|
| VC-CMV | Tidal Volume (L) | VT | |
| Mean Inspiratory Flow (L/s) | |||
| Plateau Pressure ) | |||
| Insp. Peak Pressure | PIP | ||
| PC-CMV | Tidal Volume (L) | ||
| Inspiratory Flow (L/s) | |||
| Pressure Gradient ) | ∆P | ||
| Both modes | Total Cycle Time (s) | TCT | |
| I:E ratio | I:E | ||
| Inspiratory Time Constant (s) | |||
| Expiratory Time constant (s) | |||
| Expiratory Flow (L/s) | |||
| Insp. Resistance /L/s) | |||
| Exp. Resistance /L/s) | |||
| Compliance ) | |||
| Elastance /L) | |||
| Mean Airway Pressure ) | |||
| Primary Variable | Pressure ) | P | |
| Volume (L) | V | ||
| Flow (L/s) | |||
| Inspiratory Time (s) | |||
| Expiratory Time (s) | |||
| Respiratory Rate (breaths/min) | RR |
| Parameter | Value |
|---|---|
| Control mode | VC-CMV/PC-CMV |
| Trigger mode | Ventilator |
| O2 percentage in the gas | 20.9% |
| Nebulizer | Not activated |
| Specific gas constant | 287.1 J/kg K |
| Critical pressure ratio | 0.53 |
| Supply pressure | 2039.4 cmH2O |
| Pressure downstream of the pressure reducing valve | 306 cmH2O |
| Cracking pressure of the pressure relief valve | 80.0 cmH2O |
| Cracking pressure of the check valves | 1.02 cmH2O |
| Sonic conductance at maximum flow for the air metering valve, oxygen metering valve, inspiratory valve, and expiratory valve | 10 L/s/bar |
| Opening offset of the inspiratory and expiratory valves | −10% |
| Tank volume | 6 L |
| Temperature in the tank | 20 °C |
| Pressure drop heat exchanger + humidifier (Equivalent length and diameter) | I0.5 m × 0.01 m |
| Temperature gas heat exchanger | 27 °C |
| VC-CMV mode | ||||||||||||||
| Independent Variables | Patient Variables | Dependent Variables | ||||||||||||
| VT (L) | Ipf (L/min) | Ti (s) | RR (breaths/min) | PEEP (cmH2O) | Rinsp(cmH2O/L/s) | CRS (L/cmH2O) | τi (s) | PIP (cmH2O) | Pplt (cmH2O) | Tplt (s) | Te (s) | TCT (s) | ||
|
Square Flow | 0.3 | 9 | 2 | 10 | 5 | 20 | 0.015 | 0.3 | 28 | 25 | 0.5 | 3.5 | 6 | |
| Half Decelerating | 0.3 | 12 | 2 | 10 | 5 | 20 | 0.015 | 0.3 | 27.1 | 25 | 0.5 | 3.5 | 6 | |
| Full Decelerating | 0.3 | 18 | 2 | 10 | 5 | 20 | 0.015 | 0.3 | 25.2 | 25 | 0.5 | 3.5 | 6 | |
| Sinus Waveform | 0.3 | 14.14 | 2 | 10 | 5 | 20 | 0.015 | 0.3 | 26.3 | 25 | 0.5 | 3.5 | 6 | |
| PC-CMV mode | ||||||||||||||
| Independent Variables | Patient Variables | Dependent Variables | ||||||||||||
| PIP (cmH2O) | Slope (s) | Ti (s) | RR(breaths/min) | PEEP (cmH2O) | Rinsp(cmH2O/L/s) | CRS (L/cmH2O) | ∆P (cmH2O) | τi (s) | VT (L) | Ipf (L/min) | Tplt (s) | Te (s) | TCT (s) | |
| Ramp | 25 | 0.5 | 2 | 10 | 5 | 20 | 0.015 | 20 | 0.3 | 0.3 | 30 | 0.5 | 3.5 | 6 |
| VC-CMV | |||||||||||||||
| Square Flow | |||||||||||||||
| Independent Variables | Patient Variables | Dependent Variables | |||||||||||||
| VT (L) | Ipf (L/min) | Ti (s) | RR (breaths/min) | PEEP (cmH2O) | Rinsp(cmH2O/L/s) | Rexp(cmH2O/L/s) | CRS (L/cmH2O) | τi (s) | τe (s) | PIP (cmH2O) | Pplt (cmH2O) | Epf (L/min) | Tpltl (s) | Te (s) | TCT (s) |
| 0.48 | 22.2 | 1.3 | 15 | 5 | 15 | 17 | 0.03 | 0.45 | 0.51 | 26 | 20.5 | −54 | 0.05 | 2.65 | 4 |
| PC-CMV mode | |||||||||||||||
| Square Pressure | |||||||||||||||
| Independent Variables | Patient Variables | Dependent Variables | |||||||||||||
| PIP (cmH2O) | Ti (s) | RR (breaths/min) | PEEP (cmH2O) | Rinsp (cmH2O/L/s) | Rexp (cmH2O/L/s) | CRS (L/cmH2O) | ∆P (cmH2O) | τi/τe (s) | VT (L) | Ipf/Epf (L/min) | Tplt (s) | Te (s) | TCT (s) | ||
| 21 | 1.35 | 15 | 5 | 20 | 20 | 0.027 | 16 | 0.54 | 0.4 | ±48 | 0 | 2.65 | 4 | ||
| Parameters | ||||||
|---|---|---|---|---|---|---|
| Piston Area (A) m2 | Spring Stiffness (k) N/m | Spring Pre-Compression (x0) m | Cylinder Dead Volume(V0) L | Restriction Area to Simulate the Inspiratory Resistance (Ar,i) m2 | ||
| VC-CMV | Square Flow | 0.01 | 653 | 0.0077 | 0.077 | 0.0001466 |
| Half Decel. | 0.01 | 653 | 0.0077 | 0.077 | 0.0001466 | |
| Full Decel. | 0.01 | 653 | 0.0077 | 0.077 | 0.0001466 | |
| Sinus Waveform | 0.01 | 653 | 0.0077 | 0.077 | 0.0001466 | |
| PC-CMV | Ramp | 0.01 | 653 | 0.0077 | 0.077 | 0.0001466 |
| Parameters | |||||||
|---|---|---|---|---|---|---|---|
| Piston Area (A) m2 | Spring Stiffness (k) N/m | Spring Pre-Compression (x0) m | Cylinder Dead Volume (V0) L | Restriction Area to Simulate the Inspiratory Resistance (Ar,i) m2 | Restriction Area to Simulate the Expiratory Resistance (Ar,e) m2 | ||
| VC-CMV | Square Flow | 0.01 | 326 | 0.0153 | 0.153 | 0.0001797 | 0.000165 |
| PC-CMV | Square Pressure | 0.01 | 359 | 0.0139 | 0.139 | 0.0001466 | 0.0001466 |
| VC-CMV mode | ||||||||||||||||
| Square Flow | ||||||||||||||||
| Independent Variables | Patient Variables | Dependent Variables | ||||||||||||||
| VT (L) | Ipf (L/min) | Ti (s) | RR (breaths/min) | PEEP (cmH2O) | Rinsp(cmH2O/L/s) | Rexp(cmH2O/L/s) | CRS (L/cmH2O) | τi (s) | τe (s) | PIP (cmH2O) | Pplt (cmH2O) | Epf (L/min) | Tpltl (s) | Te (s) | TCT (s) | |
| A | 0.675 | 40.5 | 1 | 12 | 5 | 5 | 15 | 0.05 | 0.25 | 0.75 | 21.875 | 18.5 | −54 | 0 | 4 | 5 |
| B | 0.675 | 40.5 | 1 | 12 | 5 | 5 | 15 | 0.02 | 0.1 | 0.3 | 42.125 | 38.75 | −135 | 0 | 4 | 5 |
| C | 0.675 | 40.5 | 1 | 12 | 5 | 20 | 20 | 0.05 | 1 | 1 | 32 | 18.5 | −40.5 | 0 | 4 | 5 |
| PC-CMV mode | ||||||||||||||||
| Square Pressure | ||||||||||||||||
| Independent Variables | Patient Variables | Dependent Variables | ||||||||||||||
| PIP (cmH2O) | Ti (s) | RR(breaths/min) | PEEP (cmH2O) | Rinsp(cmH2O/L/s) | Rexp(cmH2O/L/s) | CRS (L/cmH2O) | ∆P (cmH2O) | τi (s) | τe (s) | VT (L) | Ipf (L/min) | Epf (L/min) | Tplt (s) | Te (s) | TCT (s) | |
| A | 25 | 1.5 | 12 | 5 | 10 | 10 | 0.02 | 20 | 0.2 | 0.2 | 0.4 | 120 | −120 | 0 | 3.5 | 5 |
| B | 25 | 1.5 | 12 | 5 | 20 | 20 | 0.05 | 20 | 1 | 1 | 0.775 | 60 | −60 | 0 | 3.5 | 5 |
| Parameters | |||||||
|---|---|---|---|---|---|---|---|
| Piston Area (A) m2 | Spring Stiffness (k) N/m | Spring Pre-Compres- sion (x0) m | Cylinder Dead Volume (V0) L | Restriction Area to Simulate the Inspiratory Resistance (Ar,i) m2 | Restriction Area to Simulate the Expiratory Resistance (Ar,e) m2 | ||
| VC-CMV | A | 0.01 | 196 | 0.0255 | 0.255 | 0.0003478 | 0.0001797 |
| B | 0.01 | 490 | 0.0102 | 0.102 | 0.0003478 | 0.0001797 | |
| C | 0.01 | 196 | 0.0255 | 0.255 | 0.0001466 | 0.0001466 | |
| PC-CMV | A | 0.01 | 490 | 0.0102 | 0.102 | 0.0002328 | 0.0002328 |
| B | 0.01 | 196 | 0.0255 | 0.255 | 0.0001466 | 0.0001466 | |
Publisher’s Note: MDPI stays neutral with regard to jurisdictional claims in published maps and institutional affiliations. |
© 2022 by the authors. Licensee MDPI, Basel, Switzerland. This article is an open access article distributed under the terms and conditions of the Creative Commons Attribution (CC BY) license (https://creativecommons.org/licenses/by/4.0/).
Share and Cite
Tamburrano, P.; Sciatti, F.; Distaso, E.; Di Lorenzo, L.; Amirante, R. Validation of a Simulink Model for Simulating the Two Typical Controlled Ventilation Modes of Intensive Care Units Mechanical Ventilators. Appl. Sci. 2022, 12, 2057. https://doi.org/10.3390/app12042057
Tamburrano P, Sciatti F, Distaso E, Di Lorenzo L, Amirante R. Validation of a Simulink Model for Simulating the Two Typical Controlled Ventilation Modes of Intensive Care Units Mechanical Ventilators. Applied Sciences. 2022; 12(4):2057. https://doi.org/10.3390/app12042057
Chicago/Turabian StyleTamburrano, Paolo, Francesco Sciatti, Elia Distaso, Luigi Di Lorenzo, and Riccardo Amirante. 2022. "Validation of a Simulink Model for Simulating the Two Typical Controlled Ventilation Modes of Intensive Care Units Mechanical Ventilators" Applied Sciences 12, no. 4: 2057. https://doi.org/10.3390/app12042057
APA StyleTamburrano, P., Sciatti, F., Distaso, E., Di Lorenzo, L., & Amirante, R. (2022). Validation of a Simulink Model for Simulating the Two Typical Controlled Ventilation Modes of Intensive Care Units Mechanical Ventilators. Applied Sciences, 12(4), 2057. https://doi.org/10.3390/app12042057