Article

Study on Corrosion Behavior of Waterborne Polyurethane Coating with High Thermal Conductivity

1
China Electric Power Research Institute, Beijing 100192, China
2
Institute for Advanced Materials and Technology, University of Science and Technology Beijing, Beijing 100083, China
3
Zhejiang Electric Power Corporation Research Institute, Hangzhou 310014, China
*
Author to whom correspondence should be addressed.
Appl. Sci. 2022, 12(4), 2021; https://doi.org/10.3390/app12042021
Submission received: 18 January 2022 / Revised: 9 February 2022 / Accepted: 11 February 2022 / Published: 15 February 2022

Abstract

:
In this paper, the effects of mixture fillers on the thermal conductivity of a coating are studied, and the optimal addition proportion was obtained. Then, the corrosion behavior of the modified waterborne polyurethane coating with high thermal conductivity is investigated by salt spray experiments, pull-off tests, EIS and SKP measurements. The result shows that the coating with 2 wt % composite fillers exhibits the most excellent thermal conductivity (1.222 W·m−1·K−1). In terms of corrosion resistance, there is an absence of obvious corrosion phenomenon for the modified coating, and the polarization resistance is still as high as 1.31 × 10⁷ Ω·cm2 at the final stage, which indicates that the incorporation of 2 wt % composite fillers also markedly enhances the corrosion resistance property of waterborne polyurethane coating. This is mainly attributed to the more compact structure and more excellent shielding action to the electrolyte. The surface Kelvin potential results further confirm the advantageous effects of mixture fillers on the corrosion protective performance. The corresponding protective mechanism of the composite coating is also proposed.

1. Introduction

With the rapid development of the power industry, the service scope of power transmission and transformation equipment gradually expands, even including the high salt spray, heavy sand, and strong sunshine environment. In this situation, the corrosion reliability problem is particularly prominent [1]. For the power equipment, such as transformers, some coatings are generally used to improve their corrosion resistance and extend the service life. However, it is noteworthy that the majority of currently commonly used coatings are solvent-based products. The emission content of volatile organic compounds (VOCs) of these coatings is around 300–500 g/L, which seriously endangers human health and regional ecological environment safety [2]. Thus, the environmentally friendly anticorrosive coating is the current main trend. Among them, the waterborne anticorrosive coating, such as waterborne polyurethane, has recently obtained increasing attention due to the low VOCs emissions [3,4].
In terms of transformers, in addition to corrosion reliability during service, they usually also face serious temperature rise problems [5,6]. The too high hot-spot temperature will accelerate the aging process of the insulation and markedly decrease the transformers’ life expectancy [7,8]. The waterborne coating promotes the environmental protection performance of anticorrosive coatings for transformers; however, their thermal conductivity is still poor, which cannot meet the heat dissipation requirement of the transformer. Especially for high-power transformers serving in the tropical climate, the over-heating faults frequently occur. Based on this situation, apparently, it is very necessary and urgent to develop a new type of low pollution, high thermal conductivity anti-corrosion coating for the power industry protection field.
On the aspect of improving the thermal conductivity of the coating, adding fillers with high thermal conductivity to the matrix is a convenient and effective method [9,10,11]. Kochetov [12] et al. studied the thermal behavior of epoxy resin added with AlN and BN, and the results showed that the AlN-filled coating exhibited a higher thermal conductivity than BN composites. Compared with the blank sample (0.168 W/m·K), the thermal conductivity of the coating with 10 wt % AlN reached 0.1987 W/m·K. Bian [13] et al. reported the synergistic effects of the BN and Al2O3 on enhancing the thermal conductivity of epoxy resin, and it was found that a composite with high thermal conductivity of 1.182 W/m·K was obtained after adding 22.5 wt % BN and 7.5 wt % Al2O3. In addition to these inorganic additives, the graphene and carbon nanotubes gained the increasing attention from academic and industrial fields due to its excellent thermal conductivity properties and good compatibility with polymer matrix [3,14]. Shi [15] et al. investigated the effects of graphene/carbon nanotube on the thermal conductivity of acrylic resin. They concluded that the coating modified with 9.9 wt % graphene nanosheets and 0.1 wt % carbon nanotubes displayed a high thermal conductivity of 2.97 W/m·K, which is related to the formation of honeycomb structure and decreasing of the interface heat resistance. Obviously, carbon nanomaterials show great advantages in improving the thermal conductivity of coatings.
It is noteworthy that the expense of the graphene and carbon nanotubes is very high, and the dispersion process of single-component graphene in coatings is very difficult and usually needs some pre-processing technology [16], which greatly limits the application of graphene coatings in the power industry. Considering the above situations, exploring a low-cost coating with high thermal conductivity is of great significance for engineering applications. In this paper, a low-cost commercial mixture of carbon nanotubes, carbon nanohorns, graphene, and ultrafine graphite powder is used to modify the thermal conductivity of waterborne polyurethane coating. Subsequently, the thermal conductivity and corrosion resistance performance are evaluated through the plate heat source method and salt spray experiment, respectively. Electrochemical impedance spectroscopy (EIS) and the scanning Kelvin probe (SKP) technique are used to analyze the corrosion failure mechanism of modified waterborne polyurethane coating.

2. Materials and Methods

2.1. Preparation of Coating

In this paper, the waterborne polyurethane coating is the raw material. The commercial mixture of carbon nanotubes, carbon nanohorns, graphene, and ultrafine graphite powder is added into polyurethane coating to modify the thermal conductivity. Figure 1 shows the topography characteristics of composite fillers. It can be seen that it includes flakes, rods, and granular substances. According to the previously published literature [15], the composites consisted of different size and shape substance could closely contact and form honeycomb structure in coating and thus cause the synergistic effects for the improvement of thermal conductivity properties. The addition ratio ranges from 1 wt % to 6 wt %. The titanium dioxide is used to adjust the paint color so that it appears as a sea gray B05 color. During the preparation of coating samples, the polyurethane curing agent is added firstly to the modified high thermal conductivity coating in a ratio of 1:5. Then, the modified coating is brushed on the surface of the Q235 sample with a roughness of Sa2.5. After the coating surface is dry, the coating thickness is tested using a coating thickness gauge. Ensure that the dry film thickness is around 100 μm by adjusting the number of brushing. After the modified coating is fully cured, the corrosion experiments are carried out. Moreover, the coating was cured as a square with a thickness of about 5 mm for thermal conductivity testing.

2.2. Thermal Conductivity Measurement

The effects of filler on the thermal conductivity of waterborne polyurethane coating are characterized by the plate heat source method. The thermal conductivity instrument (C-Therm TCi, Fredericton, NB, Canada) is employed during these tests, and the test temperature is 40 °C. To ensure the reproducibility, the thermal conductivity measurement was repeated three times at least.

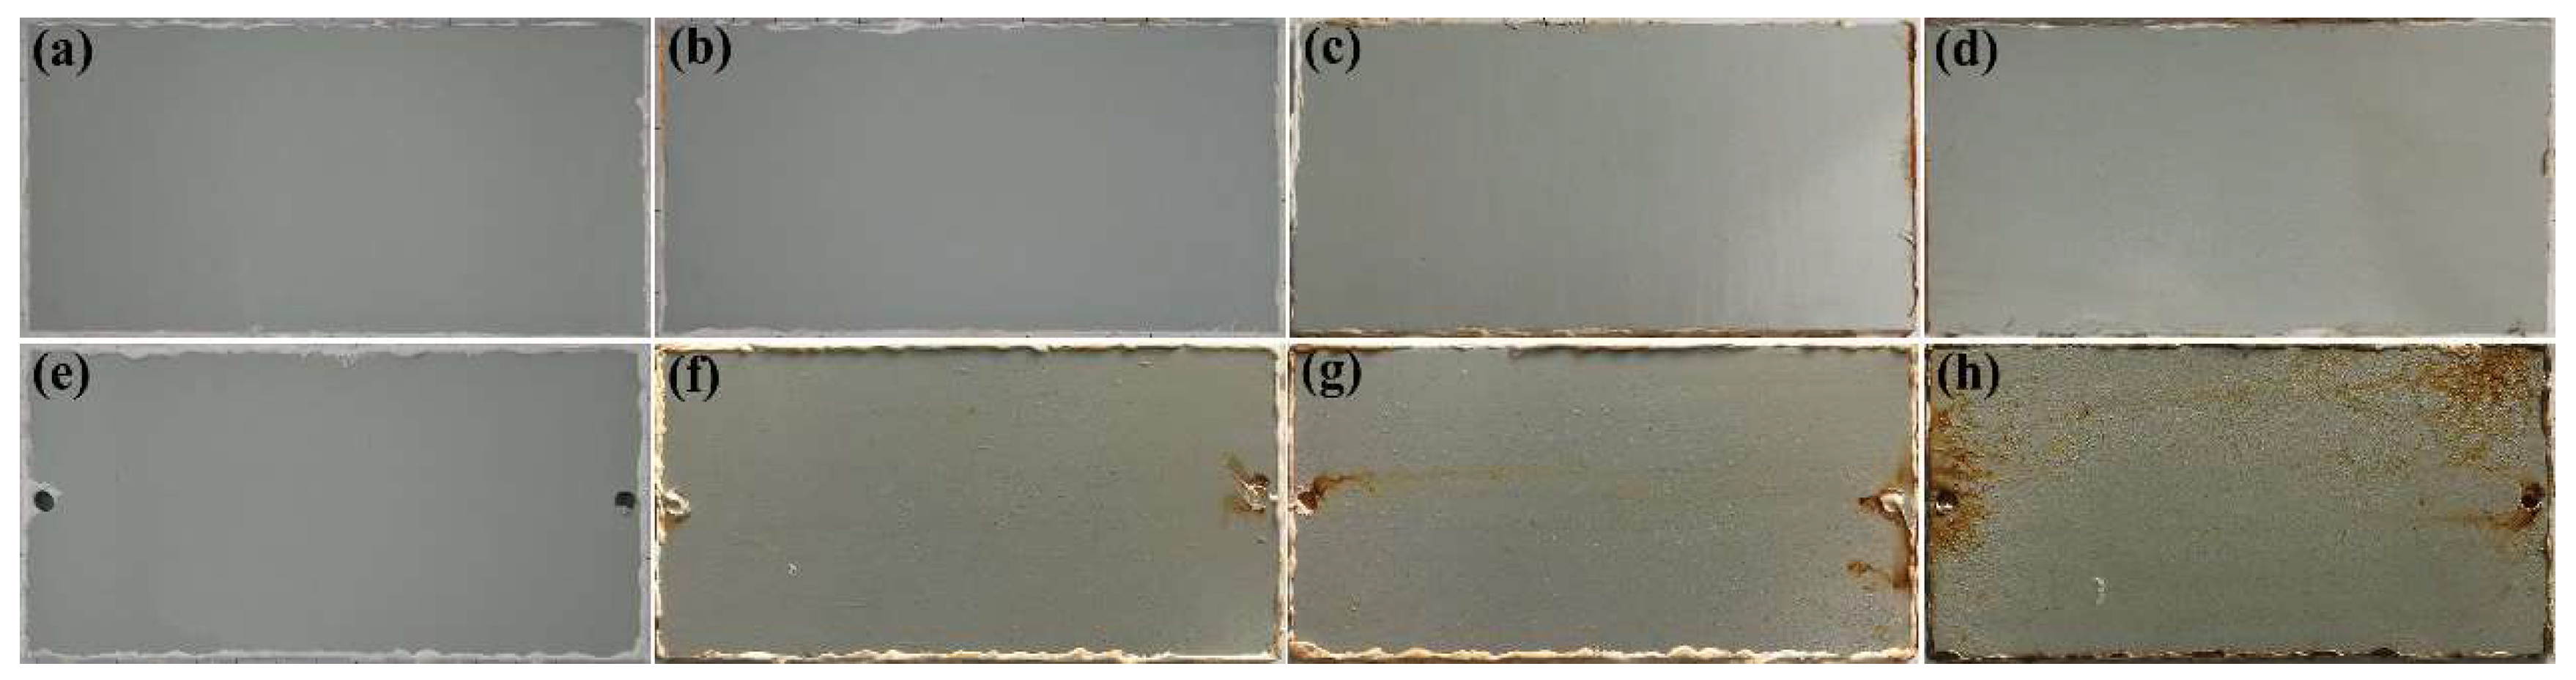
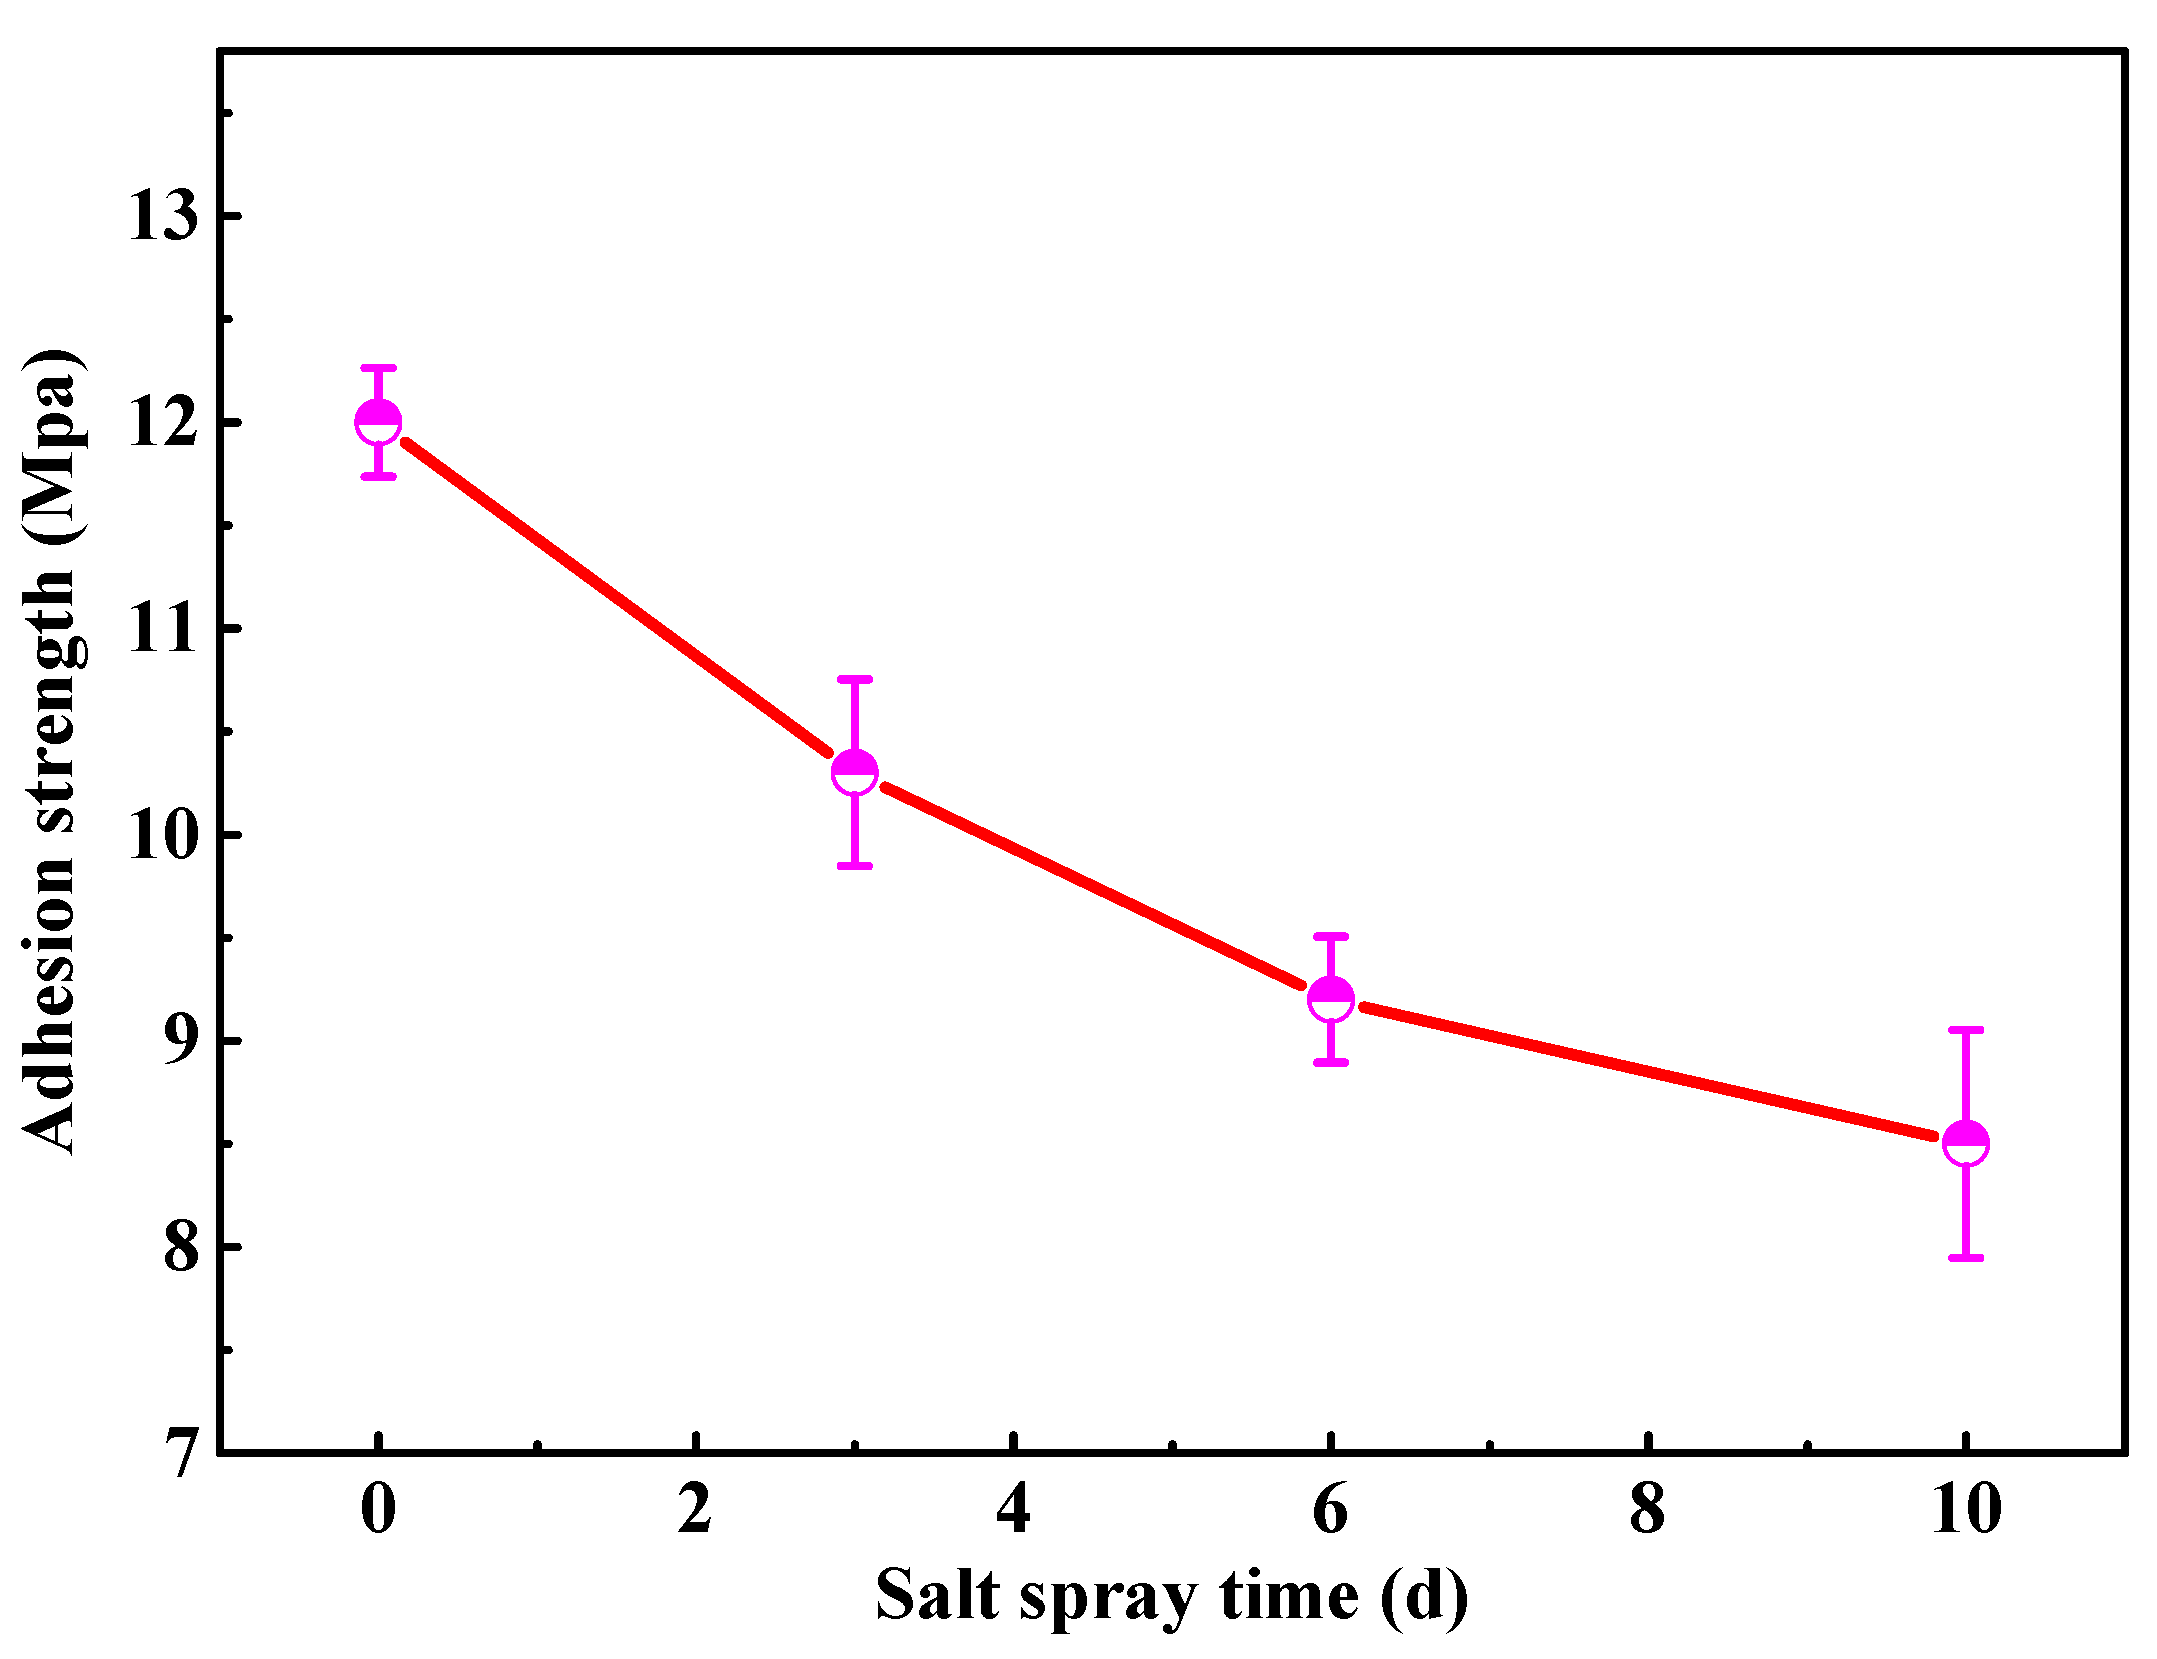
2.3. Salt Spray Experiment

To observe the corrosion resistance of the composites coating, the salt spray test is conducted according to the standard GB/T 1771-2007. The test specimens include complete specimens and crossed specimens. The concentration of NaCl solution prepared by analytical pure NaCl and deionized water is 5 wt %. The experimental temperature is 35 °C. This salt spray test cycles are 3 day (d), 6 d, and 10 d. After the salt spray test, the corrosion topography is observed, and the adhesion strength is obtained through the pull-off test.

2.4. EIS Measurement

After the salt spray experiment, an EIS test is carried out using a traditional three-electrode system and a CS410 electrochemical workstation. A platinum plate and saturated calomel electrode (SCE) function as the counter electrode and reference electrode, respectively. The area of the working electrode is 0.785 cm2. A 3.5 wt % NaCl solution is used as an electrolyte of the EIS test. The measuring frequency ranges from 100 kHz to 10 mHz, using a perturbation of 10 mV. After the electrochemical tests, Zsimpwin 3.50 software is used to fit the EIS data.

2.5. SKP Measurement

The Kelvin potential of a coating sample surface was measured using an M370 electrochemical workstation with a work distance of 150 ± 5 μm. The test area is 3000 μm × 500 μm, and the step size is 50 μm. All experiments were conducted in a stable laboratory environment at 20 °C and 50% RH.

3. Results and Discussion

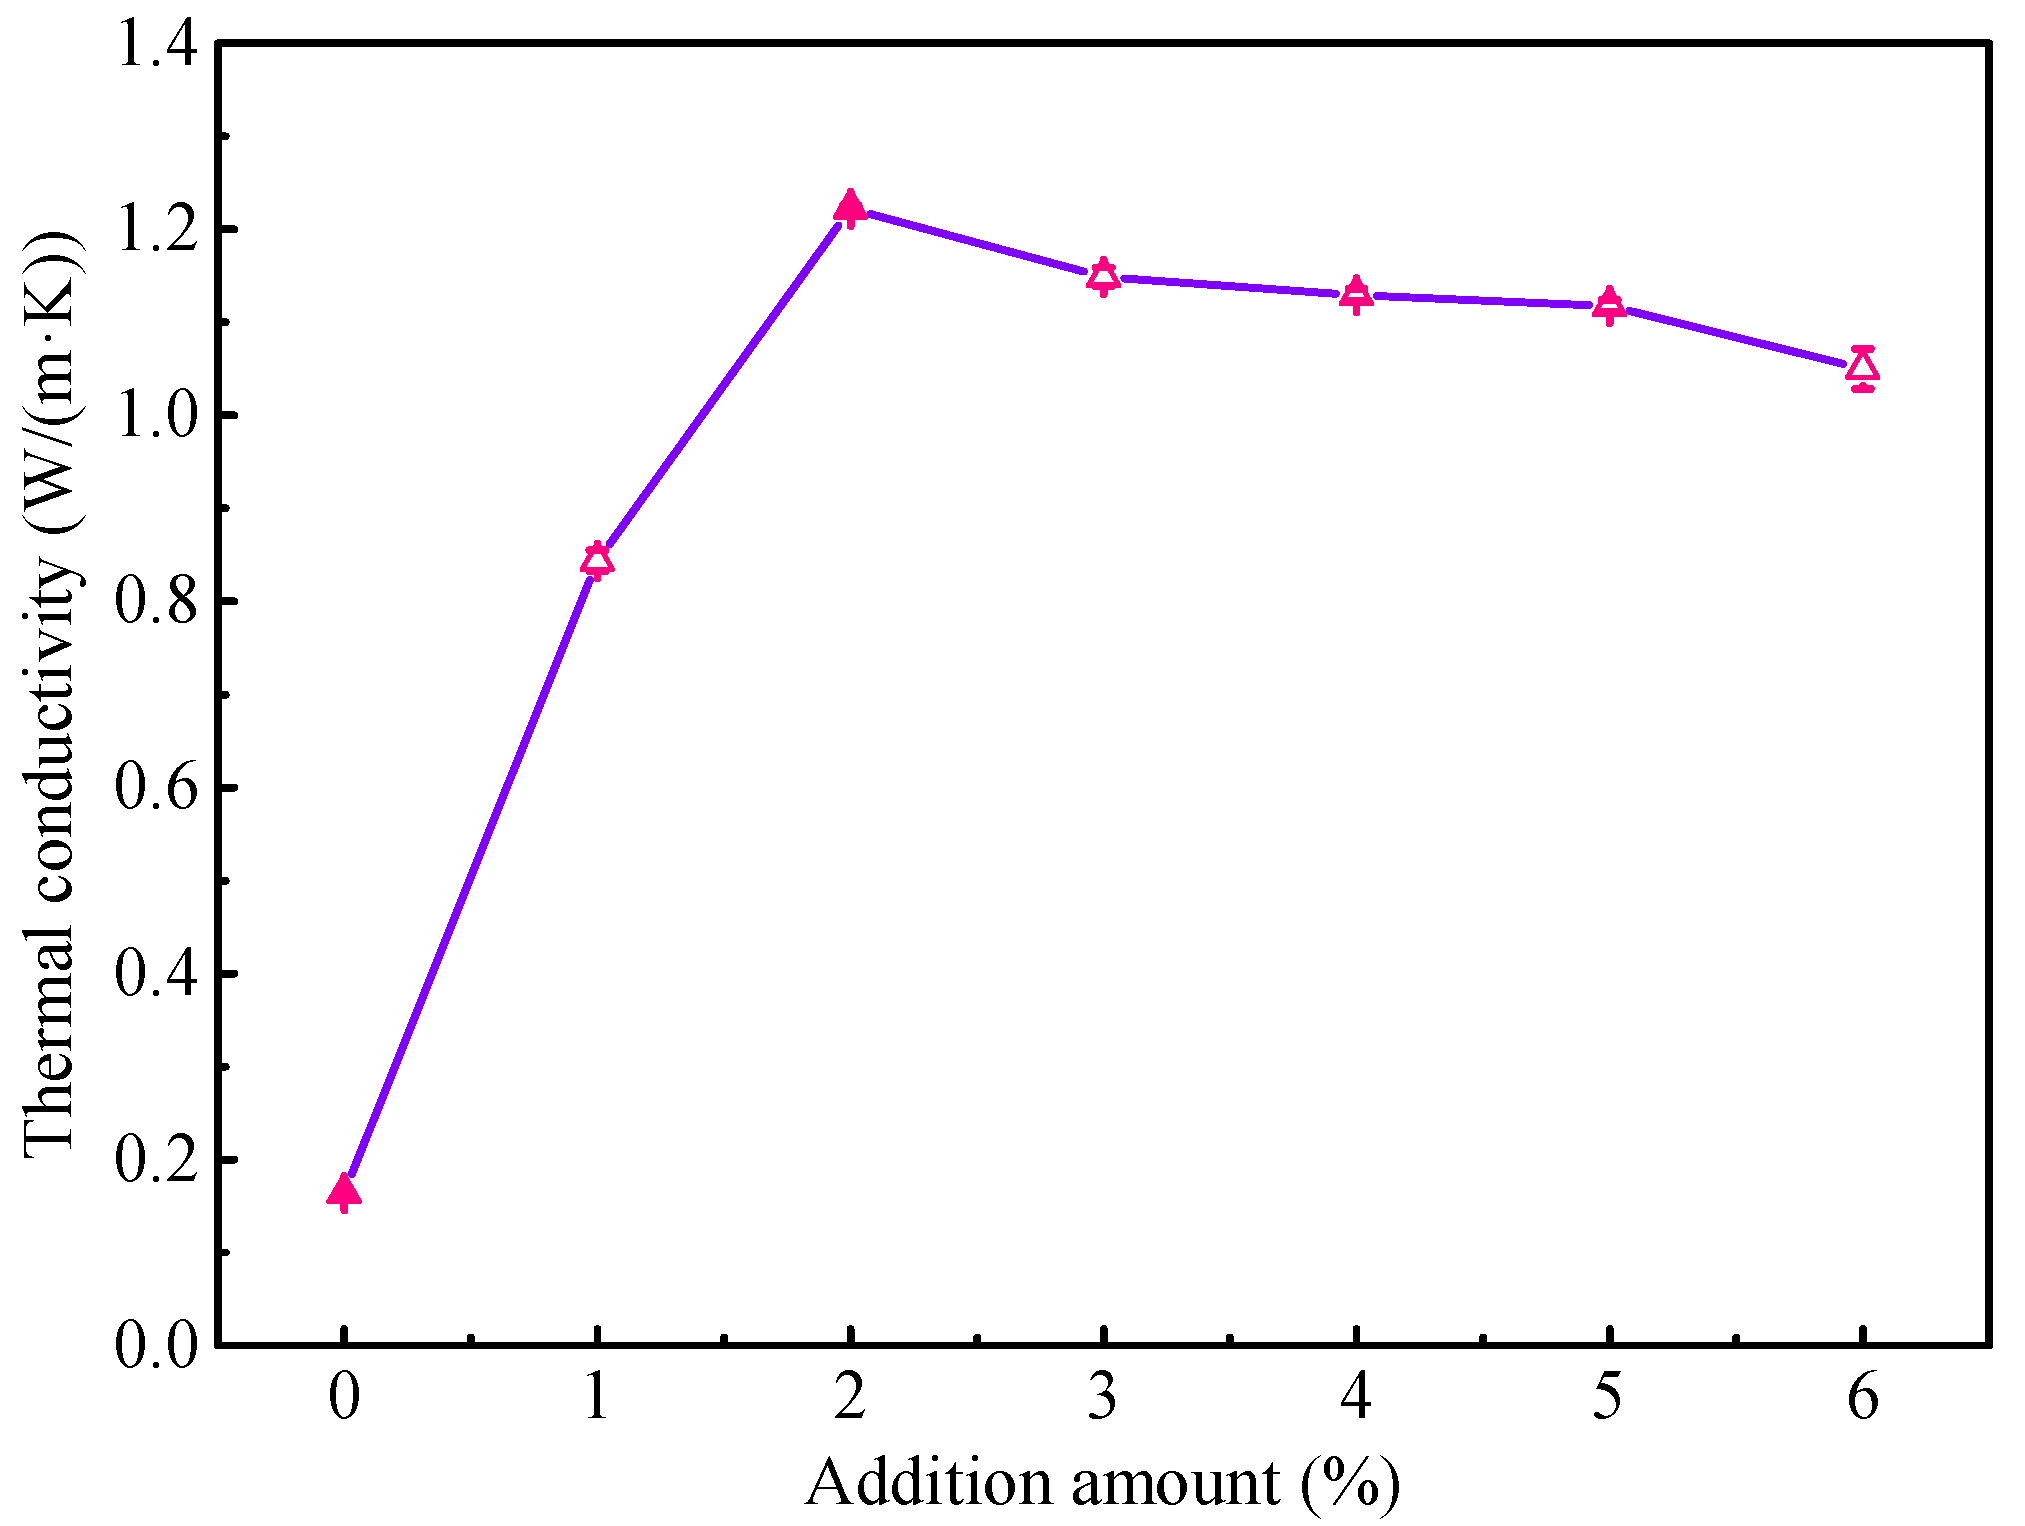
3.1. Thermal Conductivity

Figure 2 shows the thermal conductivity results of the waterborne polyurethane coating with different proportions of high thermal conductivity filler. Obviously, the waterborne polyurethane coating displays a very low thermal conductivity, and it is 0.1638 W/(m·K). When the composites fillers are added into the waterborne polyurethane coating, the thermal conductivity markedly increases. Especially for modified coating with the 2 wt % fillers, the thermal conductivity is up to 1.222 W/(m·K), which is higher than the previously reported results [17,18]. It may be attributed to the synergistic effect of different composite in fillers. As the addition amount of fillers continues to increase, the thermal conductivity has a slight decreasing trend, which may be related to the titanium dioxide added during the toning process. Overall, this result indicates that the composites fillers can be used to significantly enhance the thermal conductivity of the waterborne polyurethane coating, which is beneficial for improving the heat dissipation performance of the transformer. Subsequently, to observe the corrosion protection performance of the modified coating in the corrosive atmospheric environment, the salt spray experiment is conducted for the coating with 2 wt % fillers.

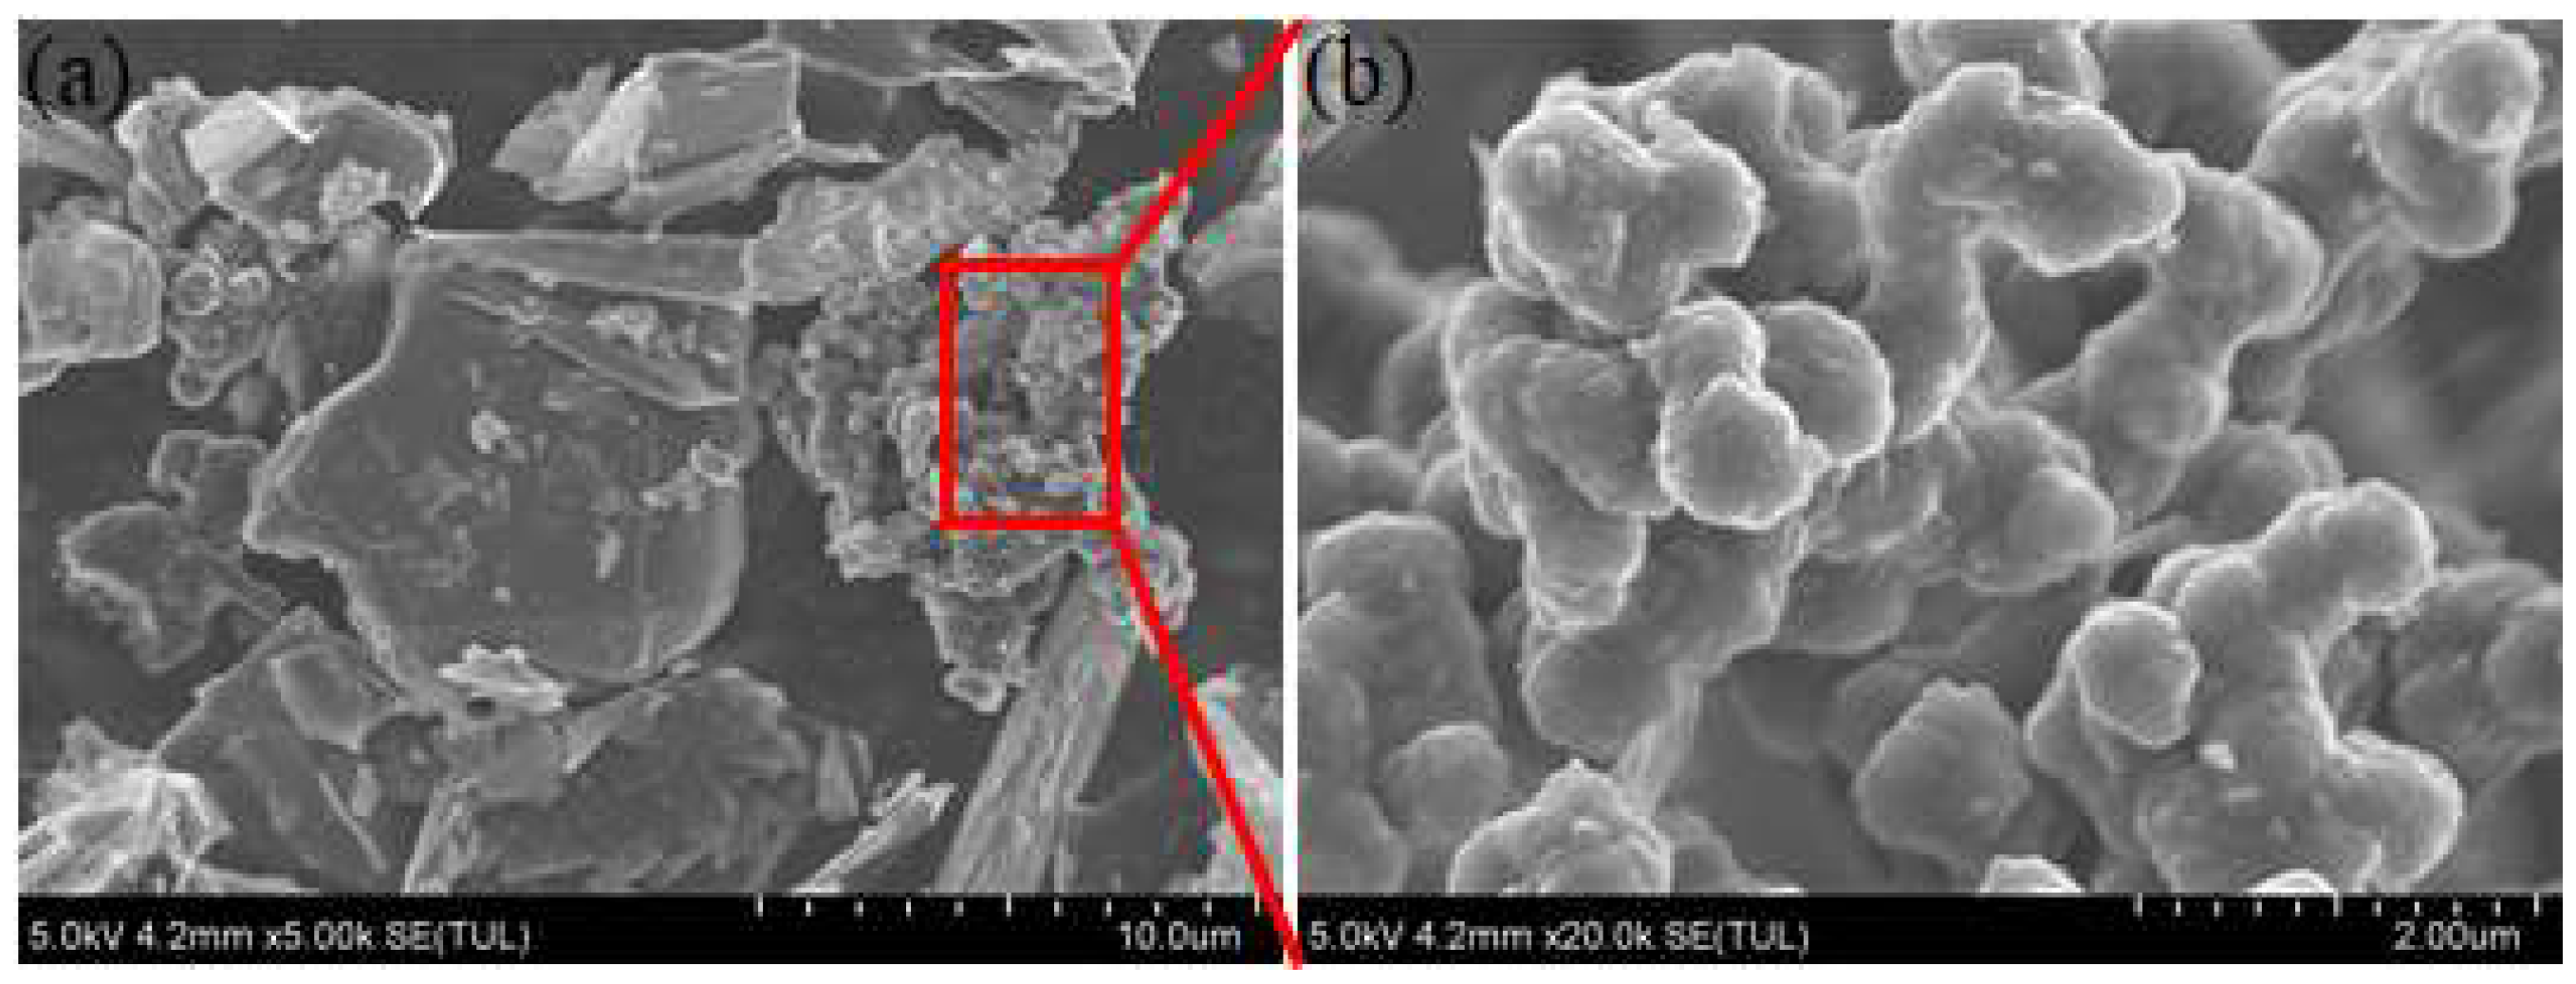
3.2. Topography Observation

The corrosion protection performance of the waterborne polyurethane coating with the best thermal conductivity is evaluated through salt spray experiments. Figure 3 shows the surface topography of the samples after the salt spray test. It can be seen that the sample surface before the salt spray test is flat and depicts a sea gray color. After 6 d of salt spray tests, there are some rust spots on the surface of the sample without a composite filler (Figure 3g). As time elapses, the rust spots evidently increase (Figure 3h), which suggests that the corrosive ions have penetrated into the substrate, causing corrosion of the substrate metal. In this case, the formed iron cations and iron oxides will diffuse outward [19], which will further damage the coating’s resistance to penetration and reduce its protective performance. However, for the coating with 2 wt % composites filler, the coating surface displays no apparent rust spots and blisters at the full stage of salt spray tests, suggesting that the modified coating can provide excellent protection performance.
Considering the importance of the coating adhesion for the service reliability, the adhesion strength of the modified coating with 2 wt % fillers is tested by the pull-off test, as shown in Figure 4. The initial adhesion strength of the modified coating is around 12 Mpa, which approaches the value of the similar waterborne polyurethane coating in the previously published study [20]. As the salt spray time extends, the coating adhesion strength gradually decreases due to the infiltration of electrolyte. After 10 d of salt spray tests, it is still up to 8.5 Mpa, indicating that the modified coating greatly inhibits the penetration of the corrosive ions, which is a basis for the superior anticorrosion performance of coating.

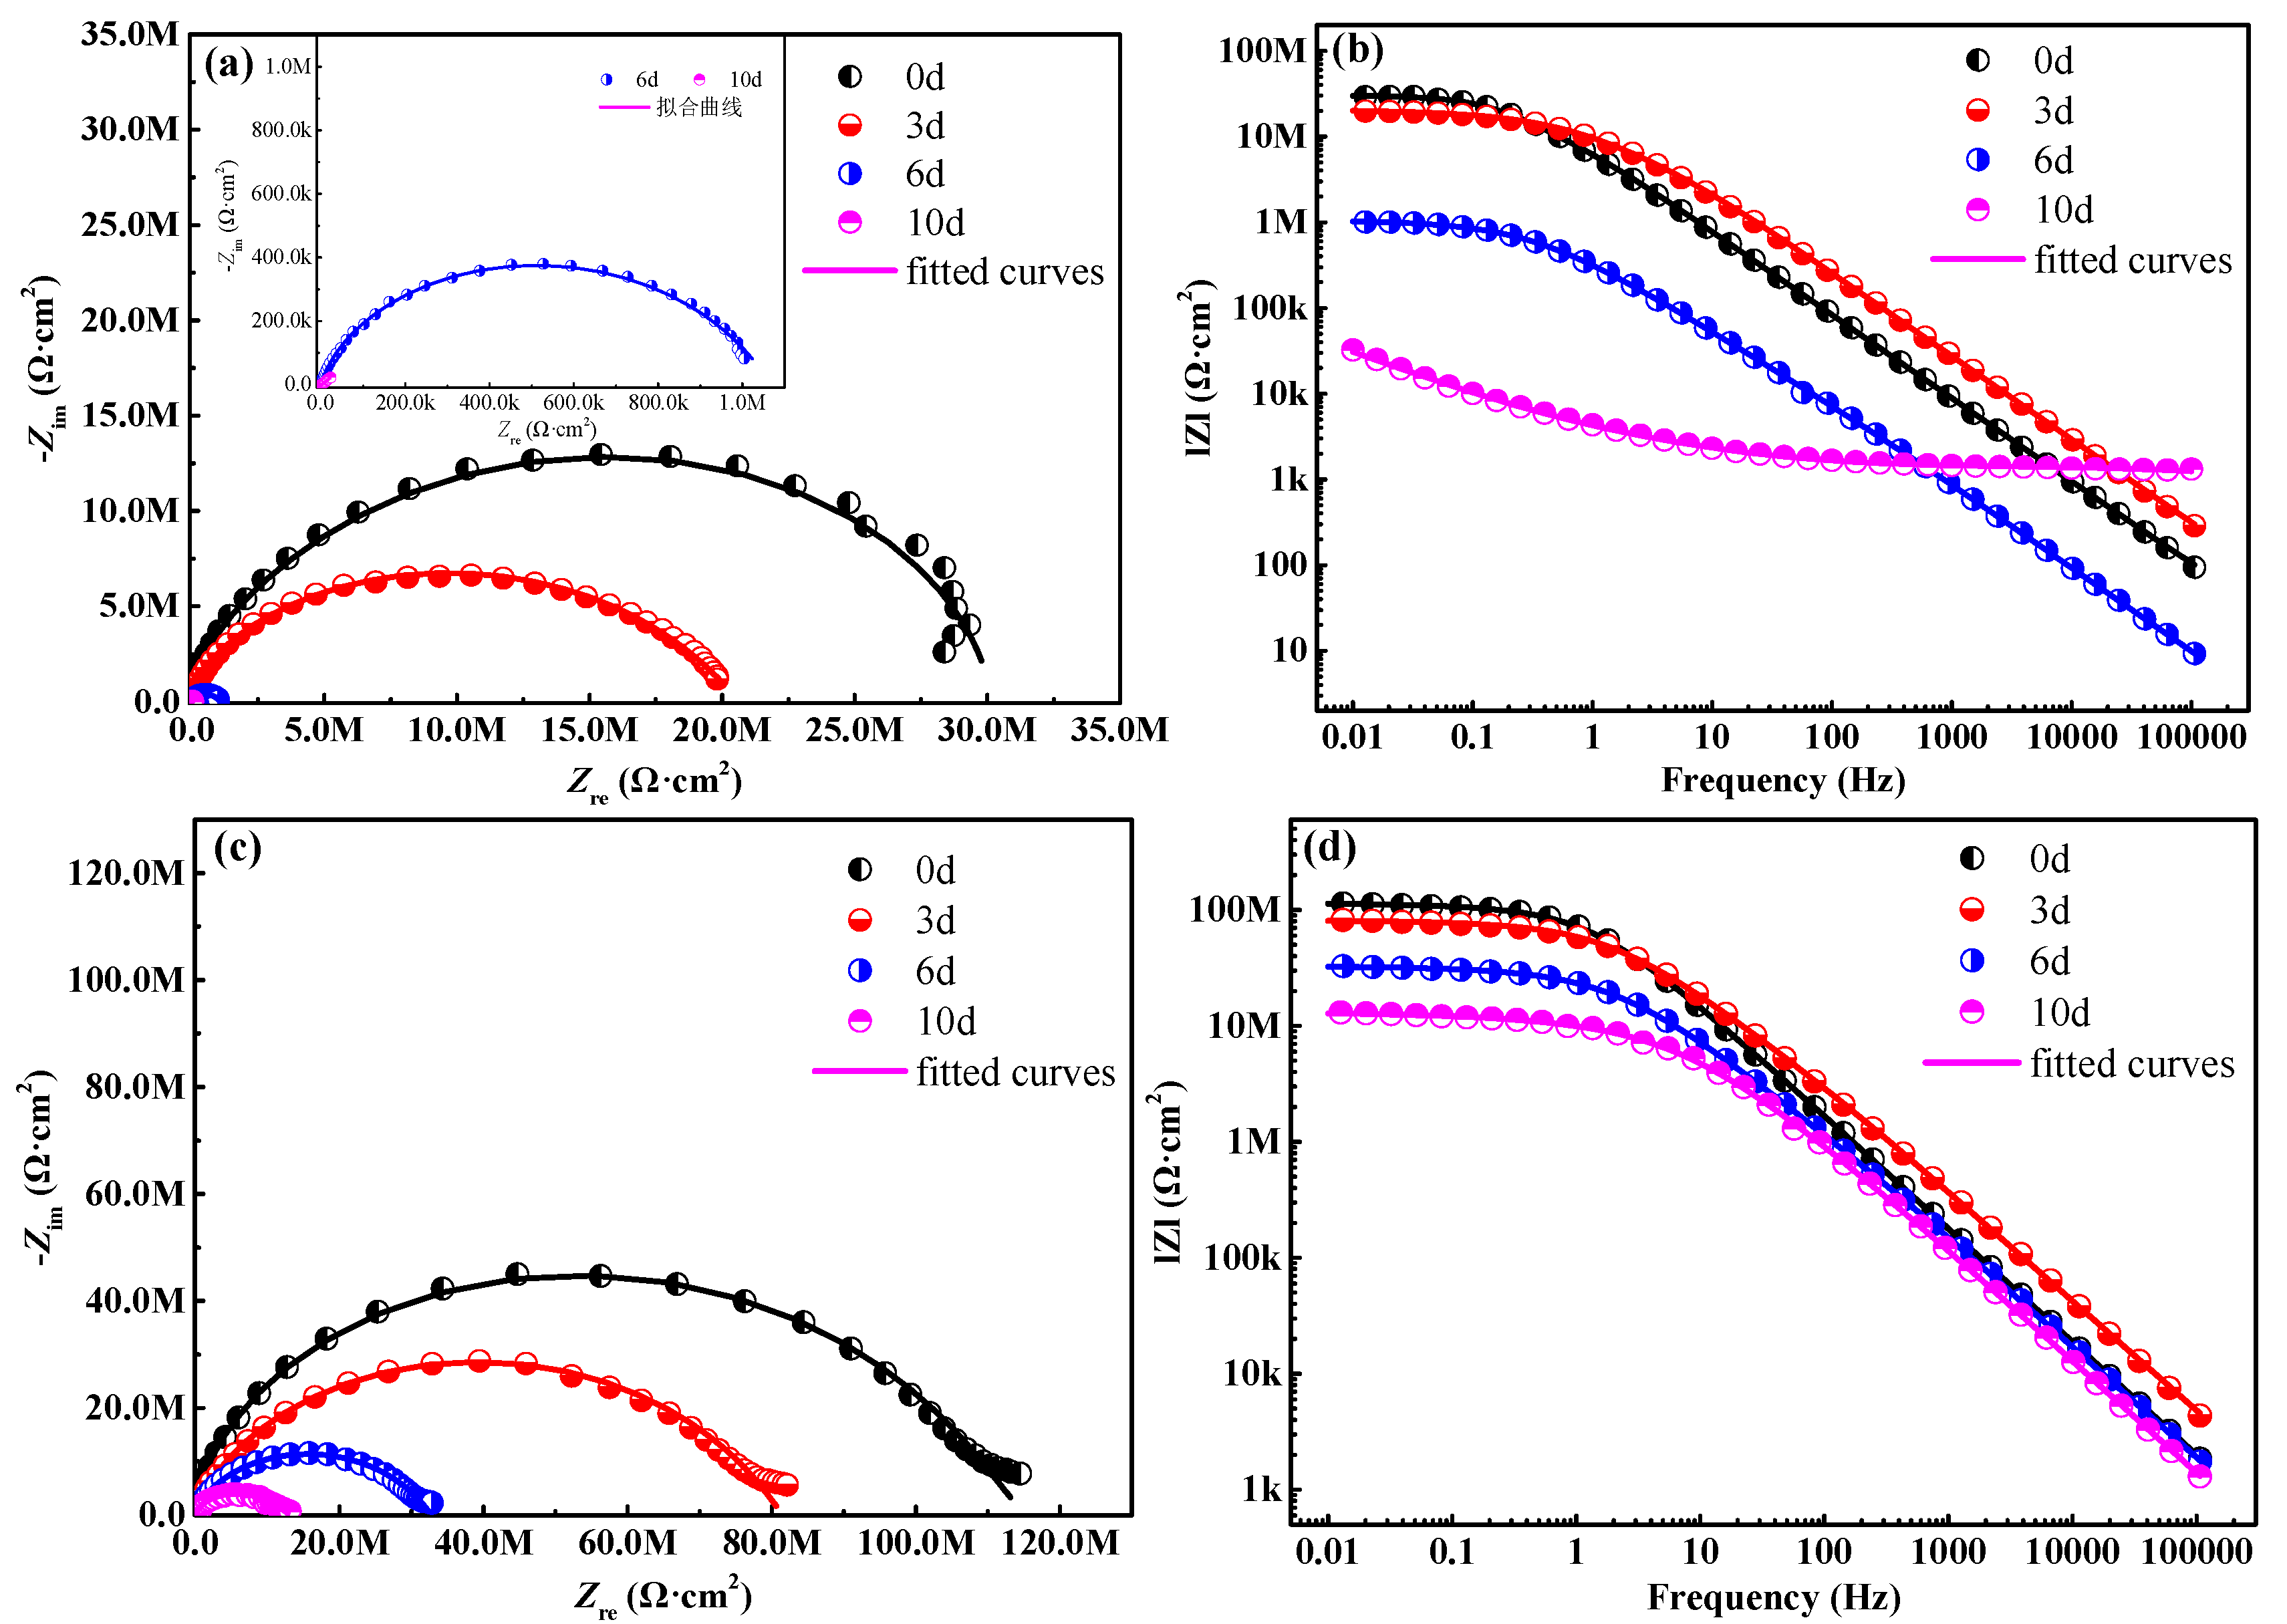
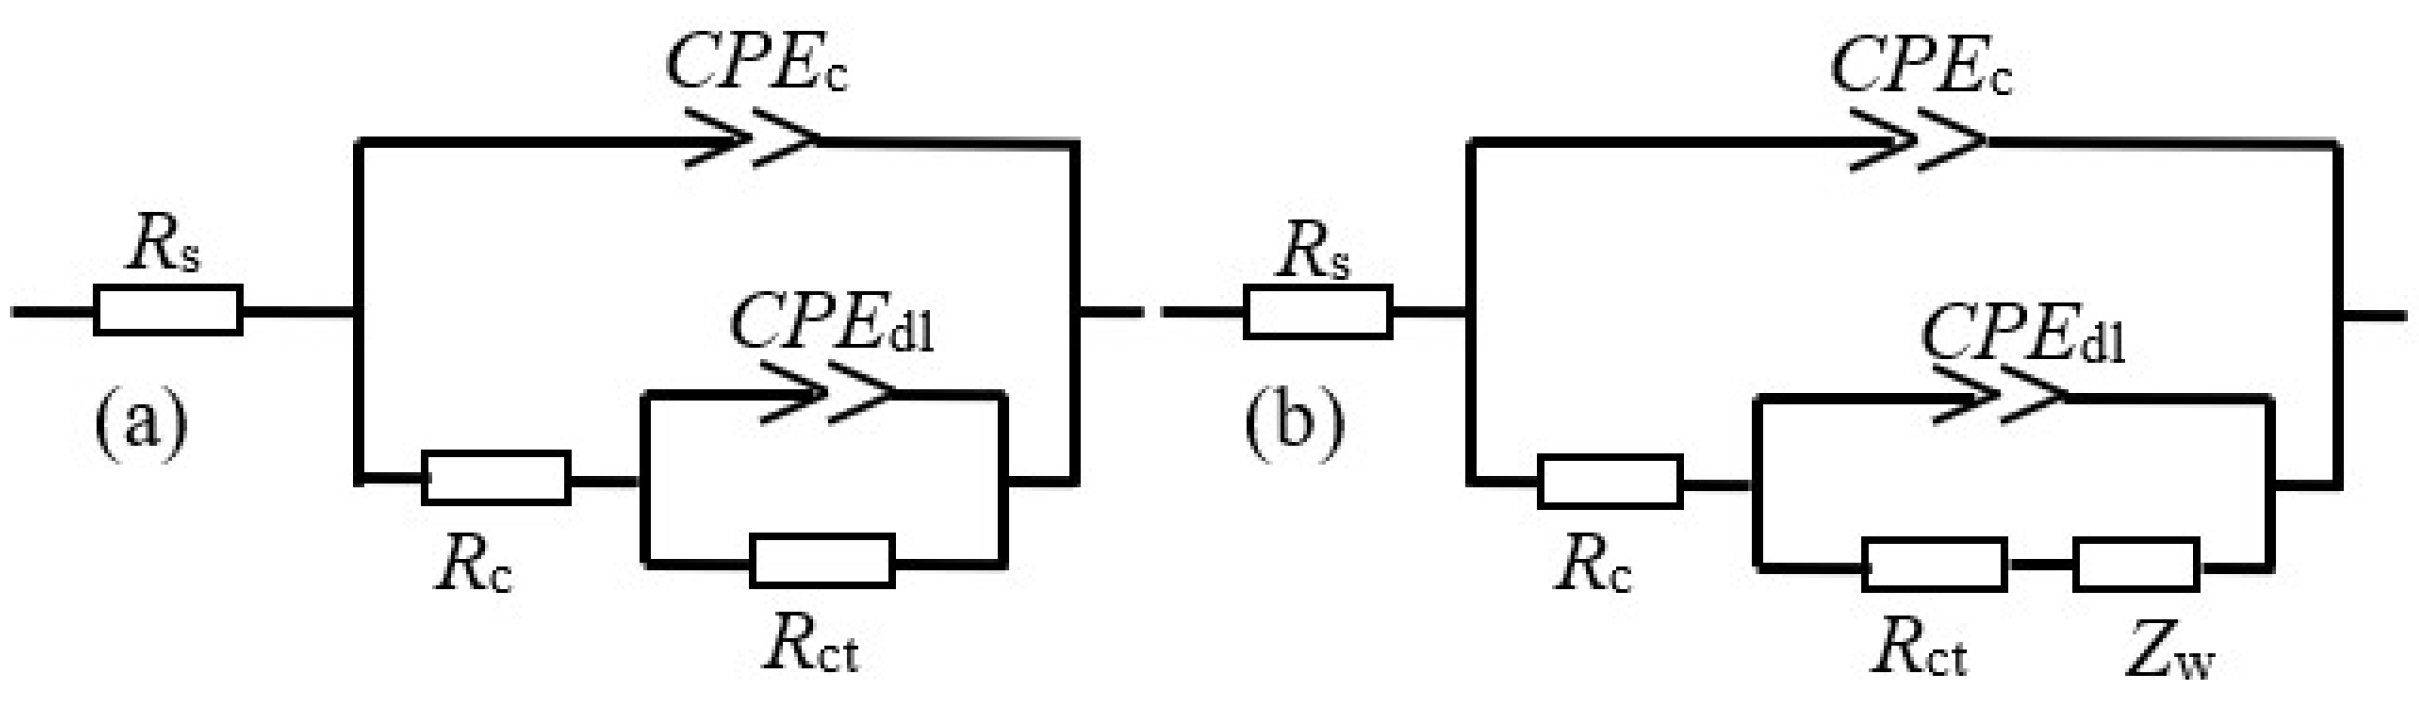
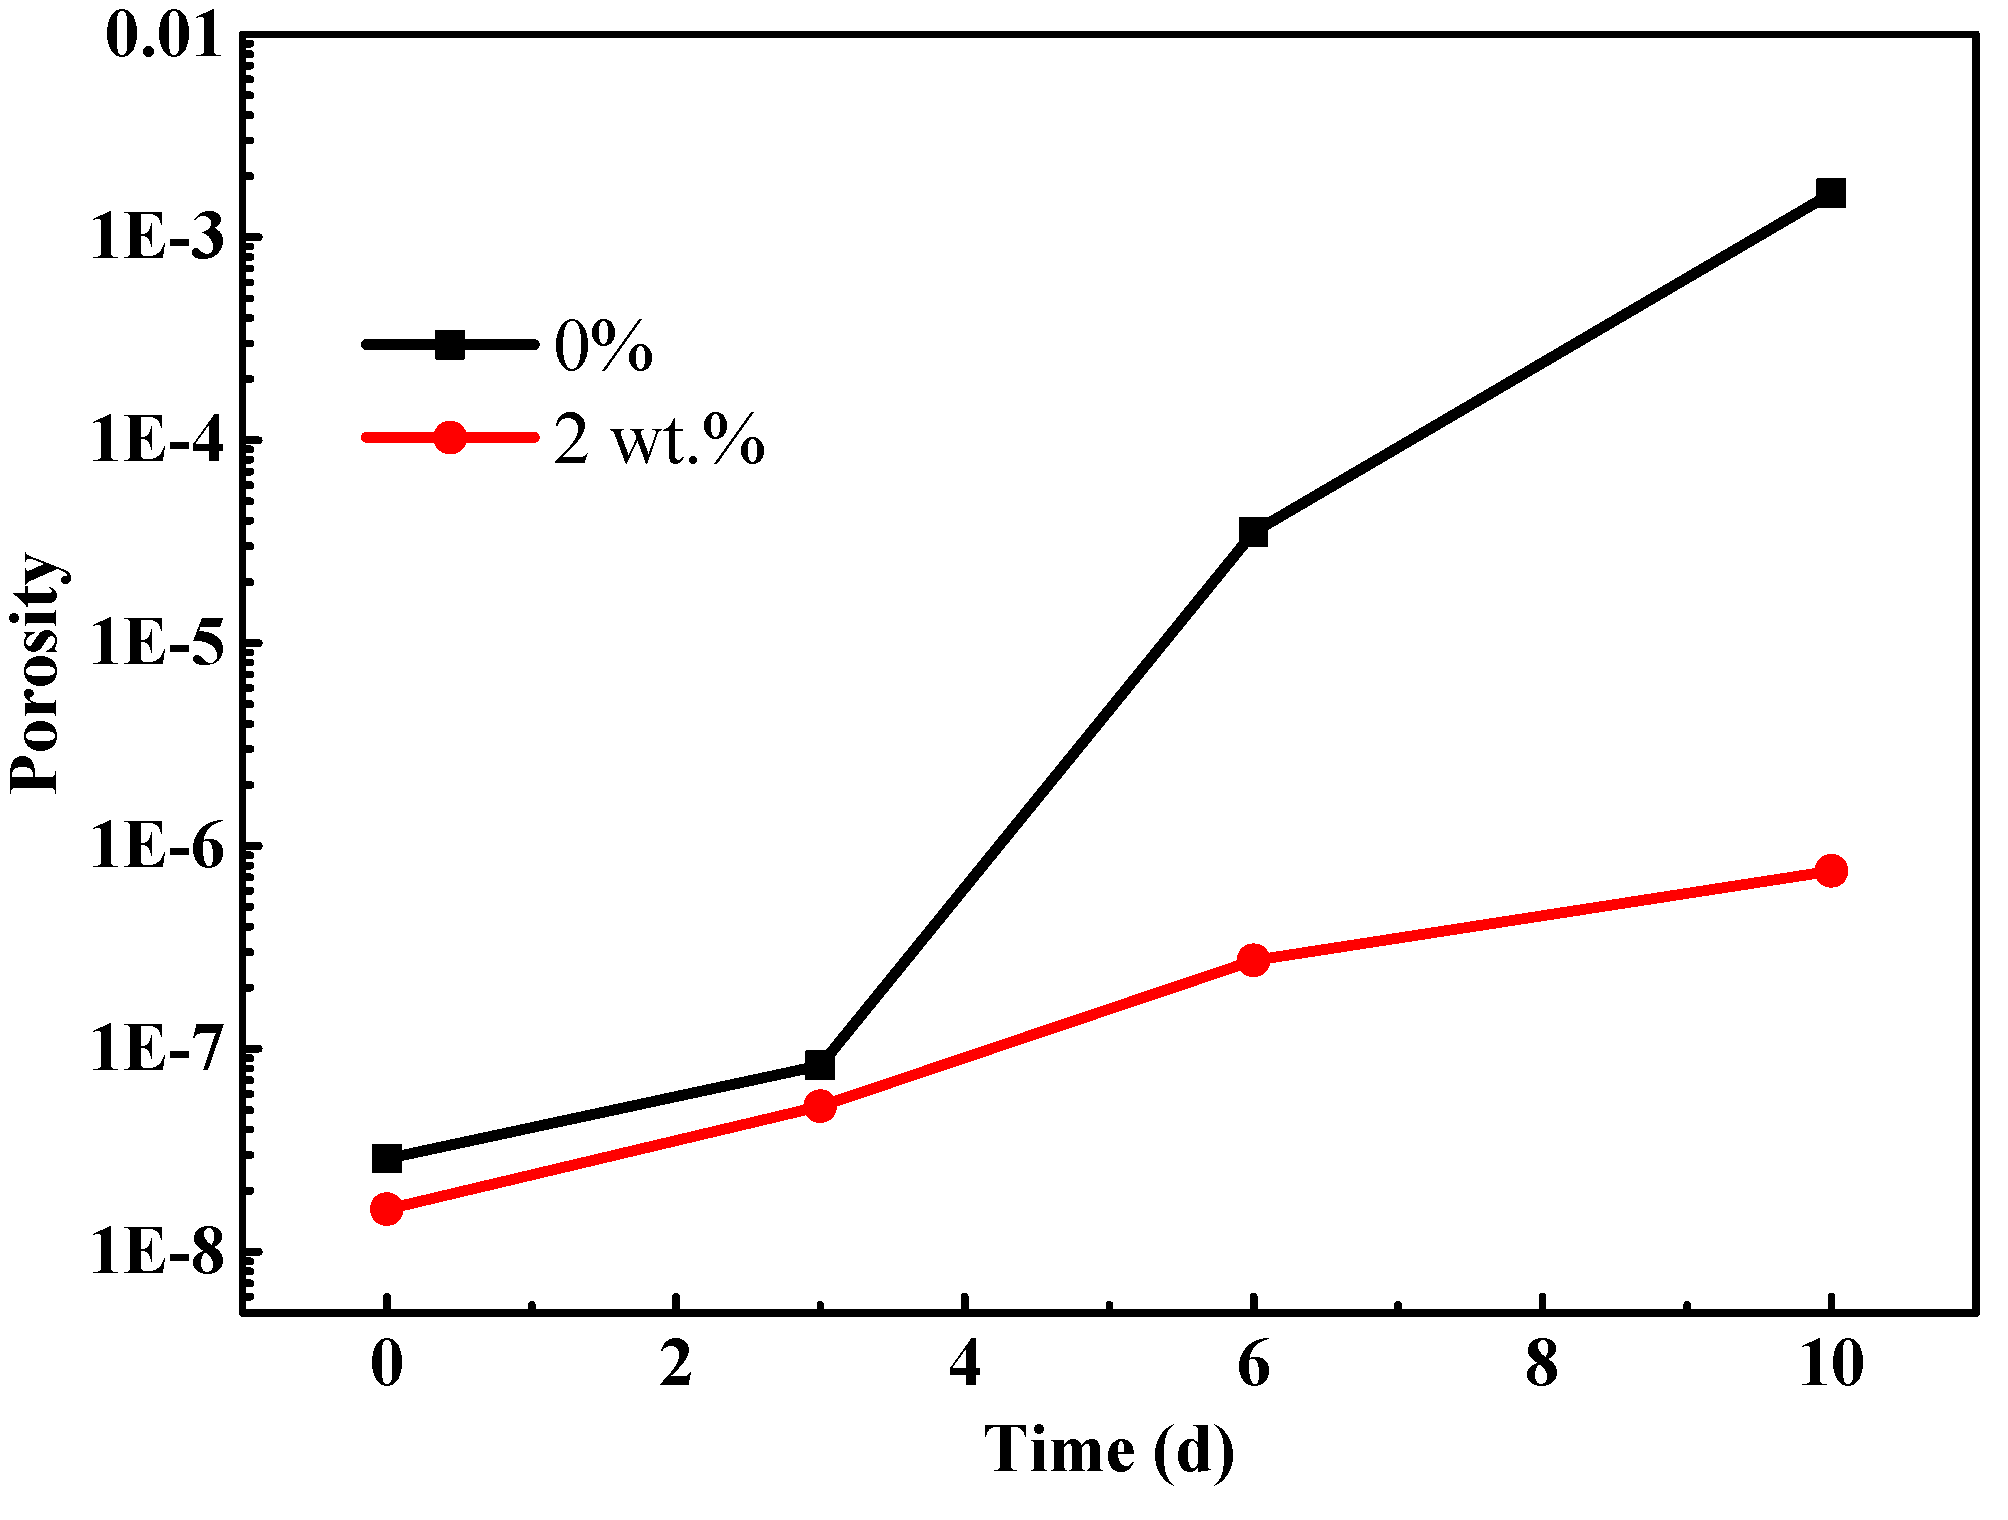
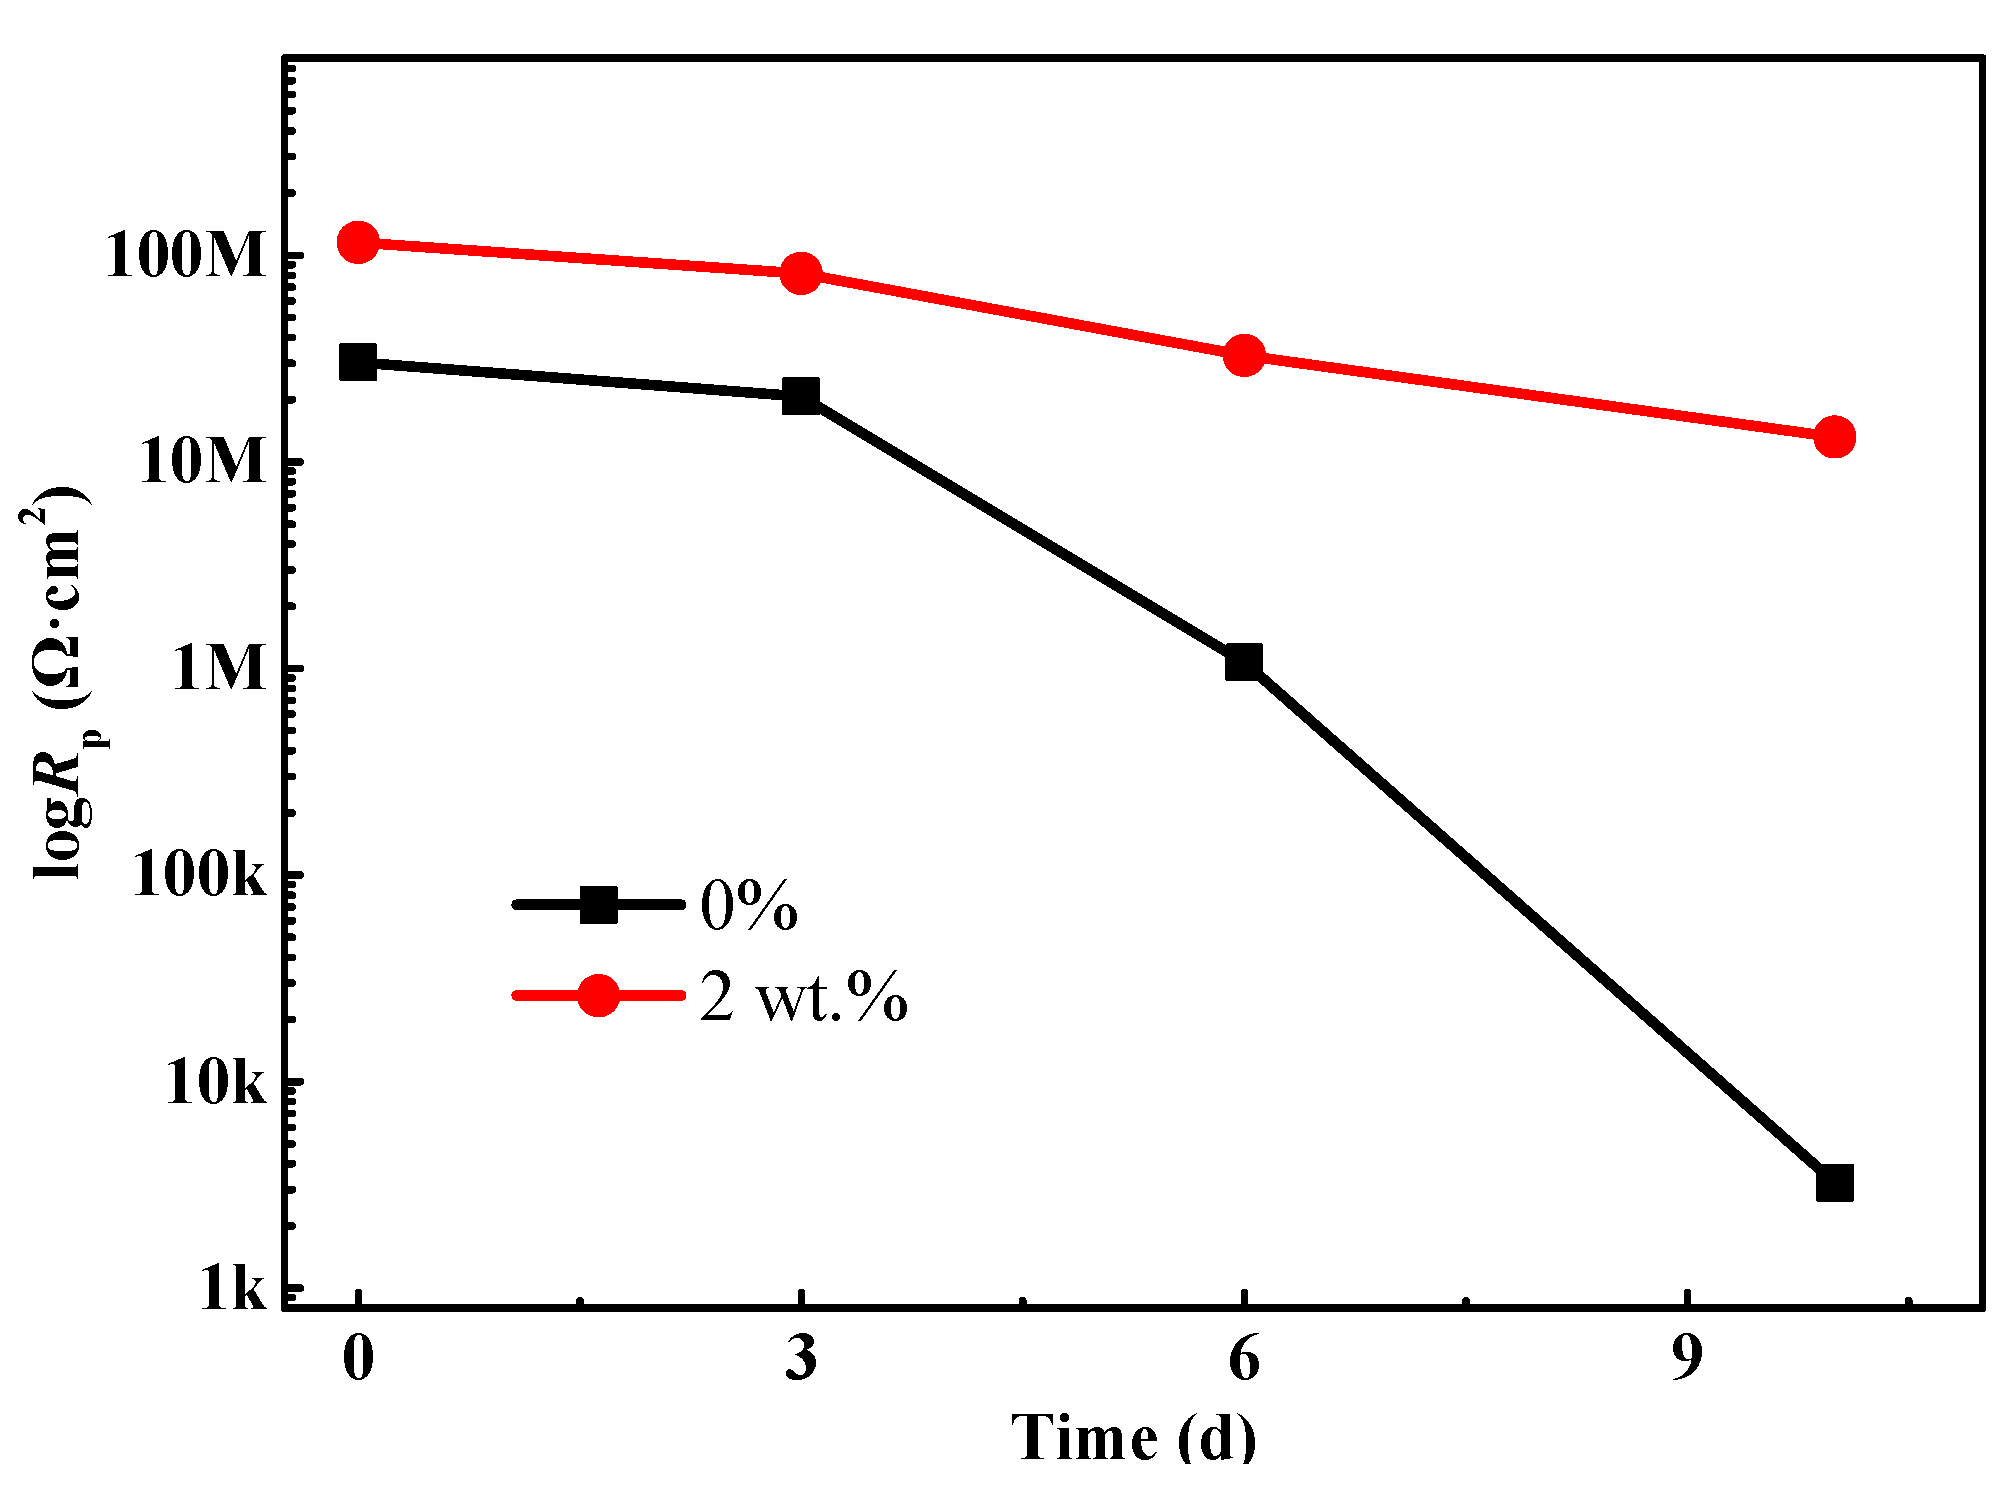
3.3. EIS Results and Analysis
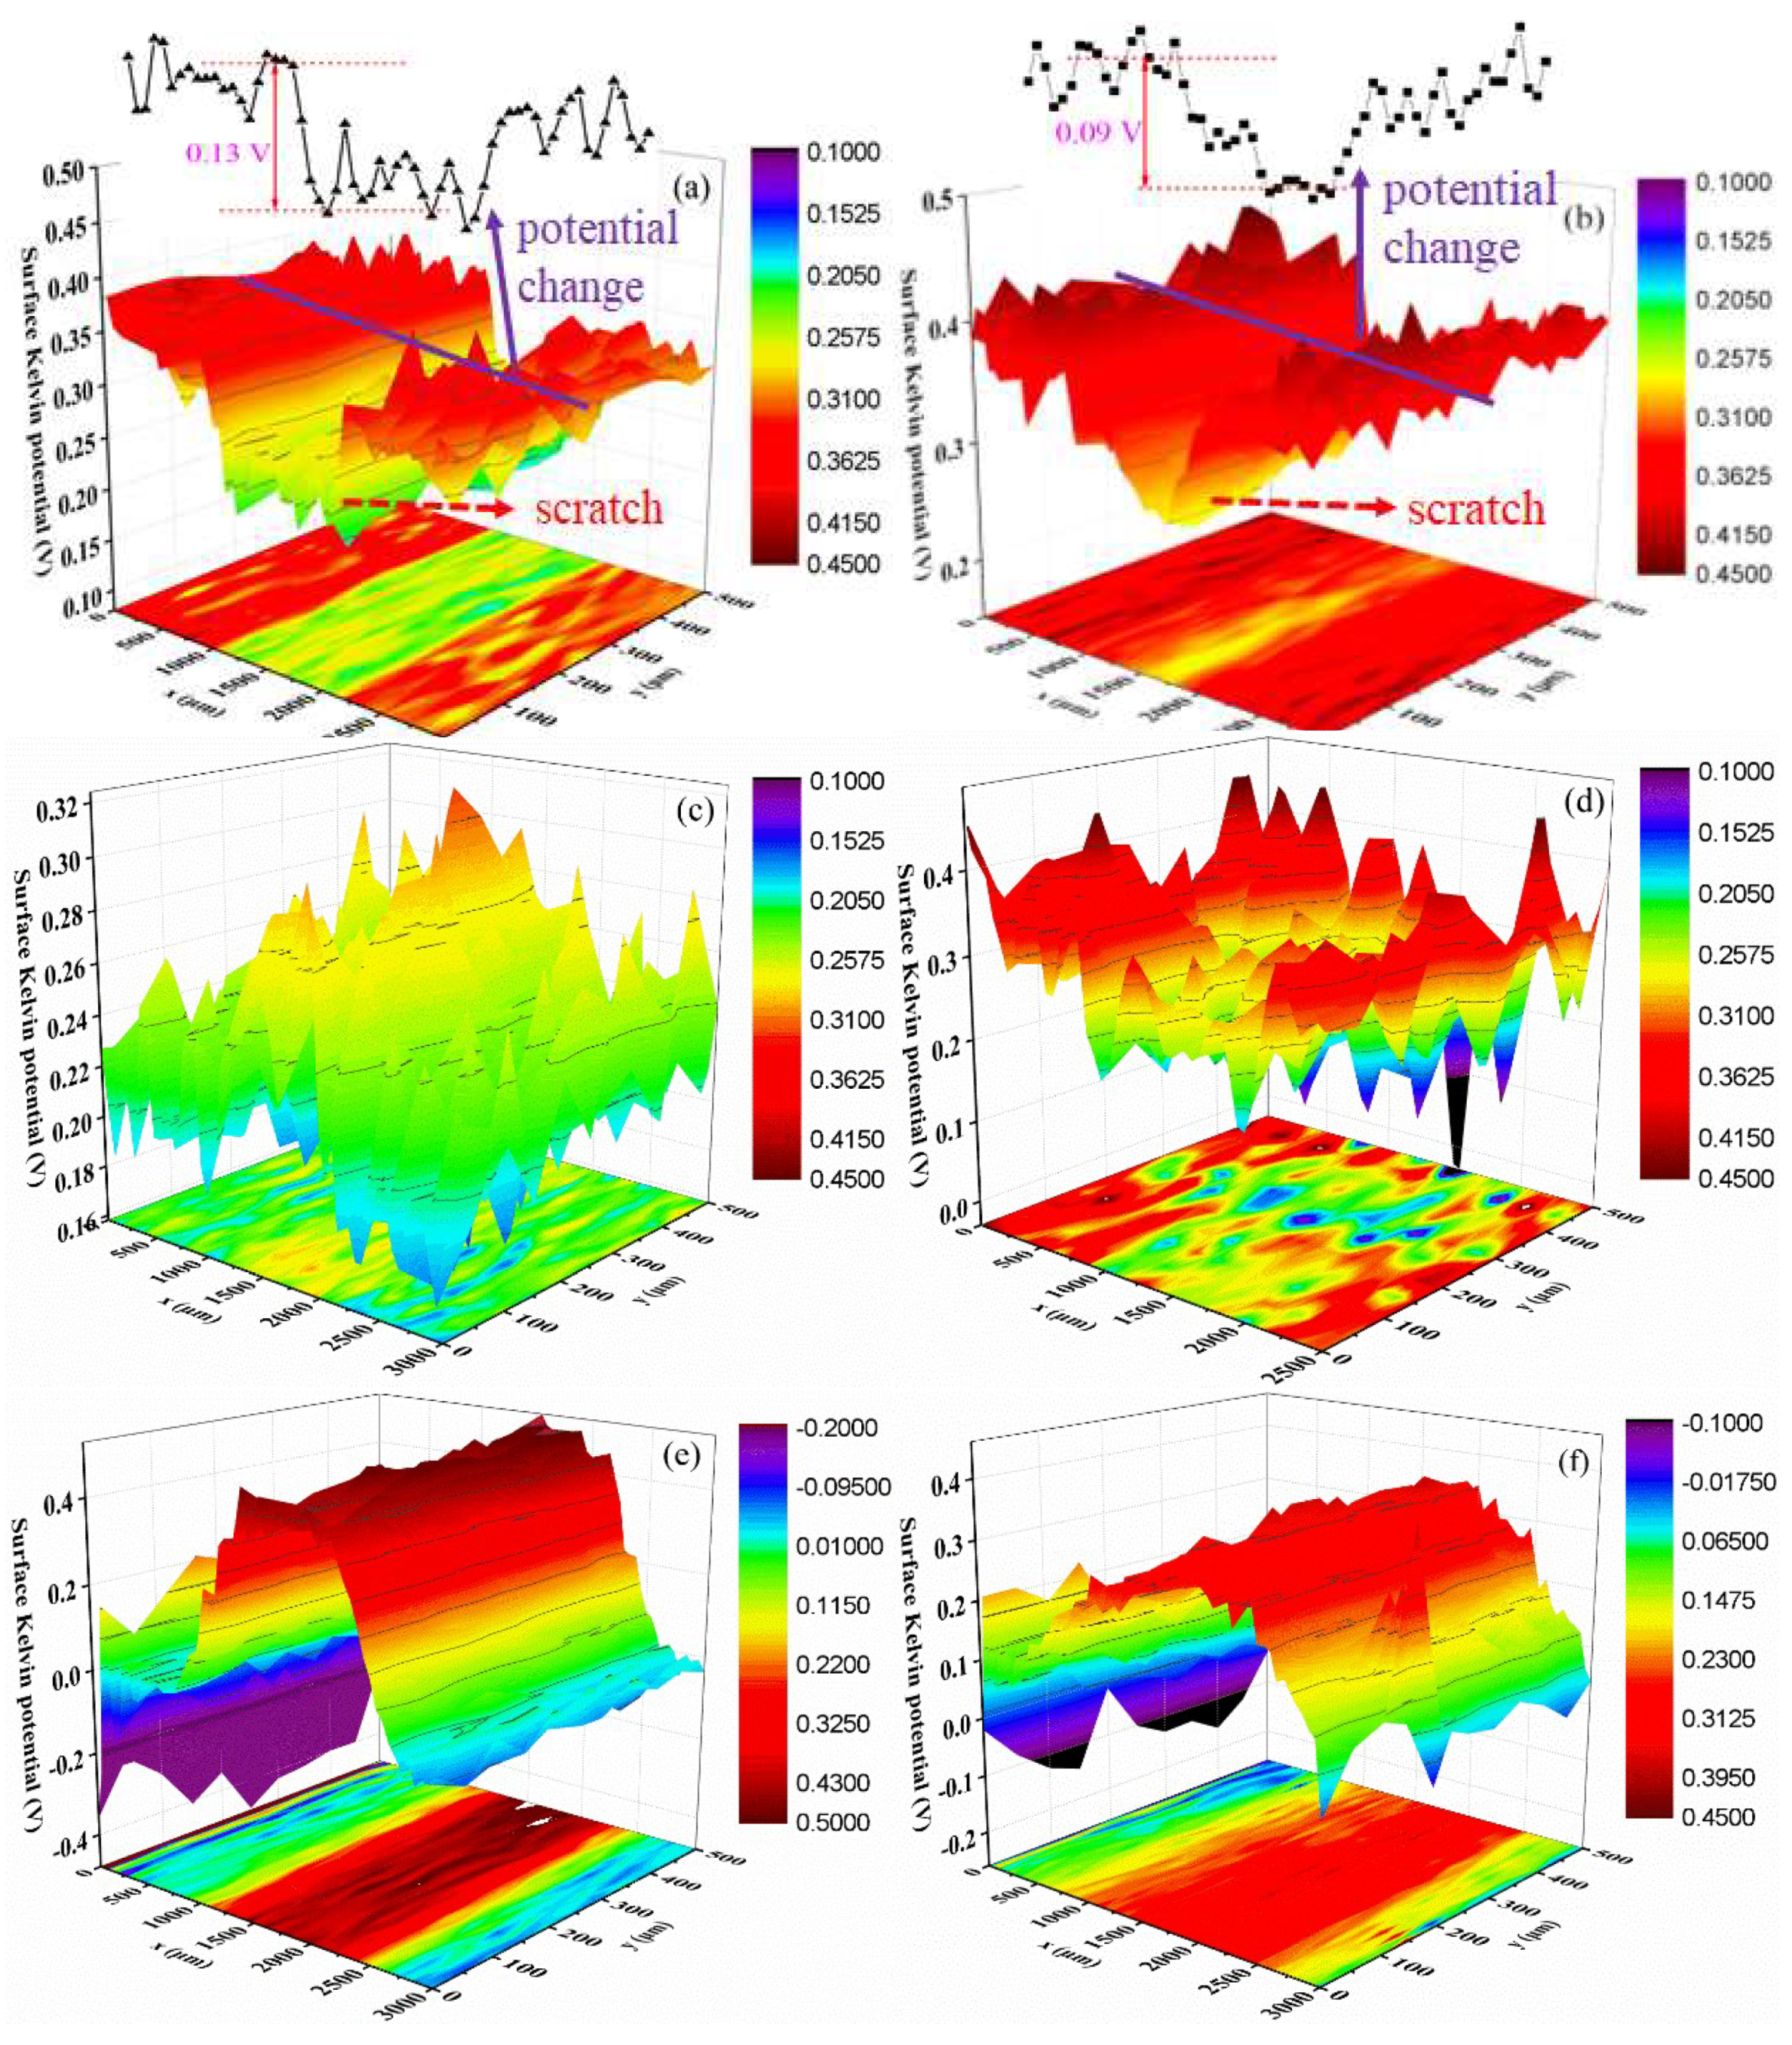
To further study the effects of composites filler on the corrosion resistance of waterborne polyurethane coating, the EIS diagram is obtained in 3.5 wt % NaCl solution, as is shown in Figure 5. Generally, larger capacitive arcs and diameters of the Nyquist diagram denote much better protective performance [21,22]. In the case of a waterborne polyurethane coating (Figure 5a), the diameter of capacitive arcs depicts a drastic downtrend as the salt spray time extends, indicating the rapid decline of the protective performance for the substrate. Two time constants are observed in this period, representing that the corrosion reactions start at the interface between the substrate and coating. After 10 d of salt spray tests, the sample suffers from severe corrosion damage (Figure 3h), and a lot of yellow rust emerges on the sample surface. The capacitive arc significantly decreases (Figure 5a). For the modified coating with 2 wt % composites filler, the diameter of the capacitive arcs in the Nyquist diagram (Figure 5c) is clearly larger than it in Figure 5a, indicating that the modified coating possesses more excellent anti-permeability to the corrosive medium.
The modulus value of the impedance (|Z|0.01 Hz) at the low frequency (0.01 Hz) can be used for evaluating the impermeable and shielding properties of the coating [23,24]. Obviously, the |Z|0.01 Hz of the waterborne polyurethane coating gradually declines from 2.85 × 10⁷ Ω·cm2 to 3.24 × 10⁴ Ω·cm2 (Figure 5b) with the extension of the salt spray time, suggesting that this coating has almost already lost the role of shielding electrolytes. In comparison, the coating samples with 2 wt % composites filler display the higher impedance modulus at 0.01 Hz during the entire salt spray test stage, and the |Z|0.01 Hz value of modified coating is still up to 1.31 × 10⁷ Ω·cm2 after 10 d of salt spray tests. These results demonstrate that the modified coating can provide more excellent protective capability for the substrate steel.
The EIS results are fitted for further elaborating the protective mechanism of the modified coating by Zsimpwin software. The equivalent circuit in Figure 6a is used to fit the EIS data of the coating samples. For the EIS curve of coating without a composite filler after 10 d of the salt spray experiment, the equivalent circuit in Figure 6b is employed due to the obstruction effects from the rust layer to the ions [25,26]. In the equivalent circuit, Rs is the solution resistance, while CPEc and Rc represent the coating capacitance and pore resistance, respectively. CPEdl and Rct correspond to the double-layer capacitance and charge transfer resistance. Zw depicts the Warburg resistance caused by the diffusion process in the electrochemical reaction.
The polarization resistance Rp (Rp = Rc + Rct) can be used to present the corrosion protective performance of the coating [27,28]. In general, the higher Rp value represents a much better corrosion resistance property. Figure 7 depicts the change trend of Rp of the coating at different stages of the salt spray test. Overall, the Rp value of the coating without composite filler shows a decreasing trend with the lengthening of salt spray time. Especially for the sample after 10 d of salt spray tests, Rp decreases to 3.24 × 10³ Ω·cm2. In this case, the protection function of the polyurethane coating is nearly ineffective. In the meantime, the corrosive ions penetrate into the interface between the coating and substrate metal and result in the severe corrosion process, which is also confirmed by the topography in Figure 3h. It is noteworthy that for the coating with 2 wt % composite fillers, the Rp value is around 1.15 × 10⁸ Ω·cm2, which is an order of magnitude larger than that of the coating without mixture fillers. Similarly, as the salt spray time further increases, the Rp value also shows a downtrend due to the infiltration effects of electrolyte. However, it is still up to 1.31 × 10⁷ Ω·cm2 for the samples that underwent 10 d of salt spray tests, implying that the modified coating still has a good physical barrier and anticorrosion capability. In addition, the literature reported that the addition of carbon materials (carbon nanotubes, carbon nanohorns, graphene, etc.) could enhance the hydrophobicity of coating, which will further impede the penetration process of aggressive medium and promote anticorrosion effects [29].
The coating porosity (P) directly affects the shielding properties and the penetration behavior of the electrolyte. It can be calculated according to Equation (1) [30,31], where Rpt represents the coating resistance when the porosity of the coating tends to infinity. It can be obtained through Equation (2). Here, d (μm) is the coating thickness. A (cm2) describes the sample area. k0 is the electric conductivity of the electrolyte. For the 3.5 wt % NaCl solution, it is around 3 S/m.
P = R pt R c
R pt = 0.01 d A k 0
Figure 8 displays the change trend of coating porosity with the salt spray time. It can be found that the coating porosity gradually increases with the increasing of salt spray time. Overall, the porosity of the modified coating with 2 wt % fillers is lower than that of the blank coating, implying that composite fillers can improve the compactness of coating and enhance the shielding property to the electrolyte. Moreover, as the salt spray test time extends, the porosity of the blank sample markedly increases, while it still remains at a low level for the modified coating sample. This phenomenon is attributed to the severe corrosion caused by penetration of an electrolyte. In comparison, there is an absence of obvious corrosion for the modified coating sample, which is verified by the topography in Figure 3d. Thus, the modified coating sample still retains excellent protective performance after 10 d of salt spray tests.

3.4. SKP Analysis

Figure 9 shows the surface Kelvin potential mapping of the coating at different stages of the salt spray test. Apparently, the surface potential of the scratch is lower than that of the nearby coating before the salt spray tests (Figure 9a,b). This is related to the release of electrons process. The coating displays an insulator characterization; thus, the electron escape process is very difficult and shows a higher surface potential. Moreover, Figure 9a shows that the potential difference between the coating and scratch is around 0.13 V for the sample without composite filler; while the waterborne polyurethane coating with 2 wt % filler shows a smaller value: 0.09 V (Figure 9b). It is mainly attributed to the enhancement of the electric conductivity due to the addition of carbon materials. According to the previously published literatures [32,33,34], the surface Kelvin potential has a linear relationship with the corrosion potential of the sample; thus, the change of the Kelvin potential can be used to examine the change law of the corrosion potential. Consequently, it can be speculated that the substrate metal of the waterborne polyurethane coating sample will suffer from more severe galvanic corrosion at the initial stage due to the higher potential difference [35]. The addition of a composites filler will improve the corrosion protection performance to some extent.
Figure 9c,d is the surface potential distribution after 3 d of salt spray tests. It can be found that the surface potential of the scratch area increases. Especially for the sample without composite filler, the surface potential of the coating and scratches reverse. This is because under the salt spray environment, the substrate metal is corroded, and a lot of corrosion products are piled on the scratch area. In this situation, the electron release process at the scratch area becomes difficult, and thus, the surface potential rises. Compared with the coating with composite filler, the coating without filler undergoes more serious corrosion damage after 3 d of the salt spray experiment due to the higher corrosion potential difference; thus, the surface potential of the scratch area significantly enhances and caused the potential reversal phenomenon. In fact, this surface potential change further confirms the advantages of the composites filler for the improvement of corrosion protection performance, which is consistent with the EIS results. As the salt spray time extends, the corrosion extent of the metal at the scratch area is aggravated. In the meantime, the amount of the corrosion products increases and becomes compact, which hinders the release process of electrons and causes the surface potential of the scratch area to further increase (Figure 9e,f).

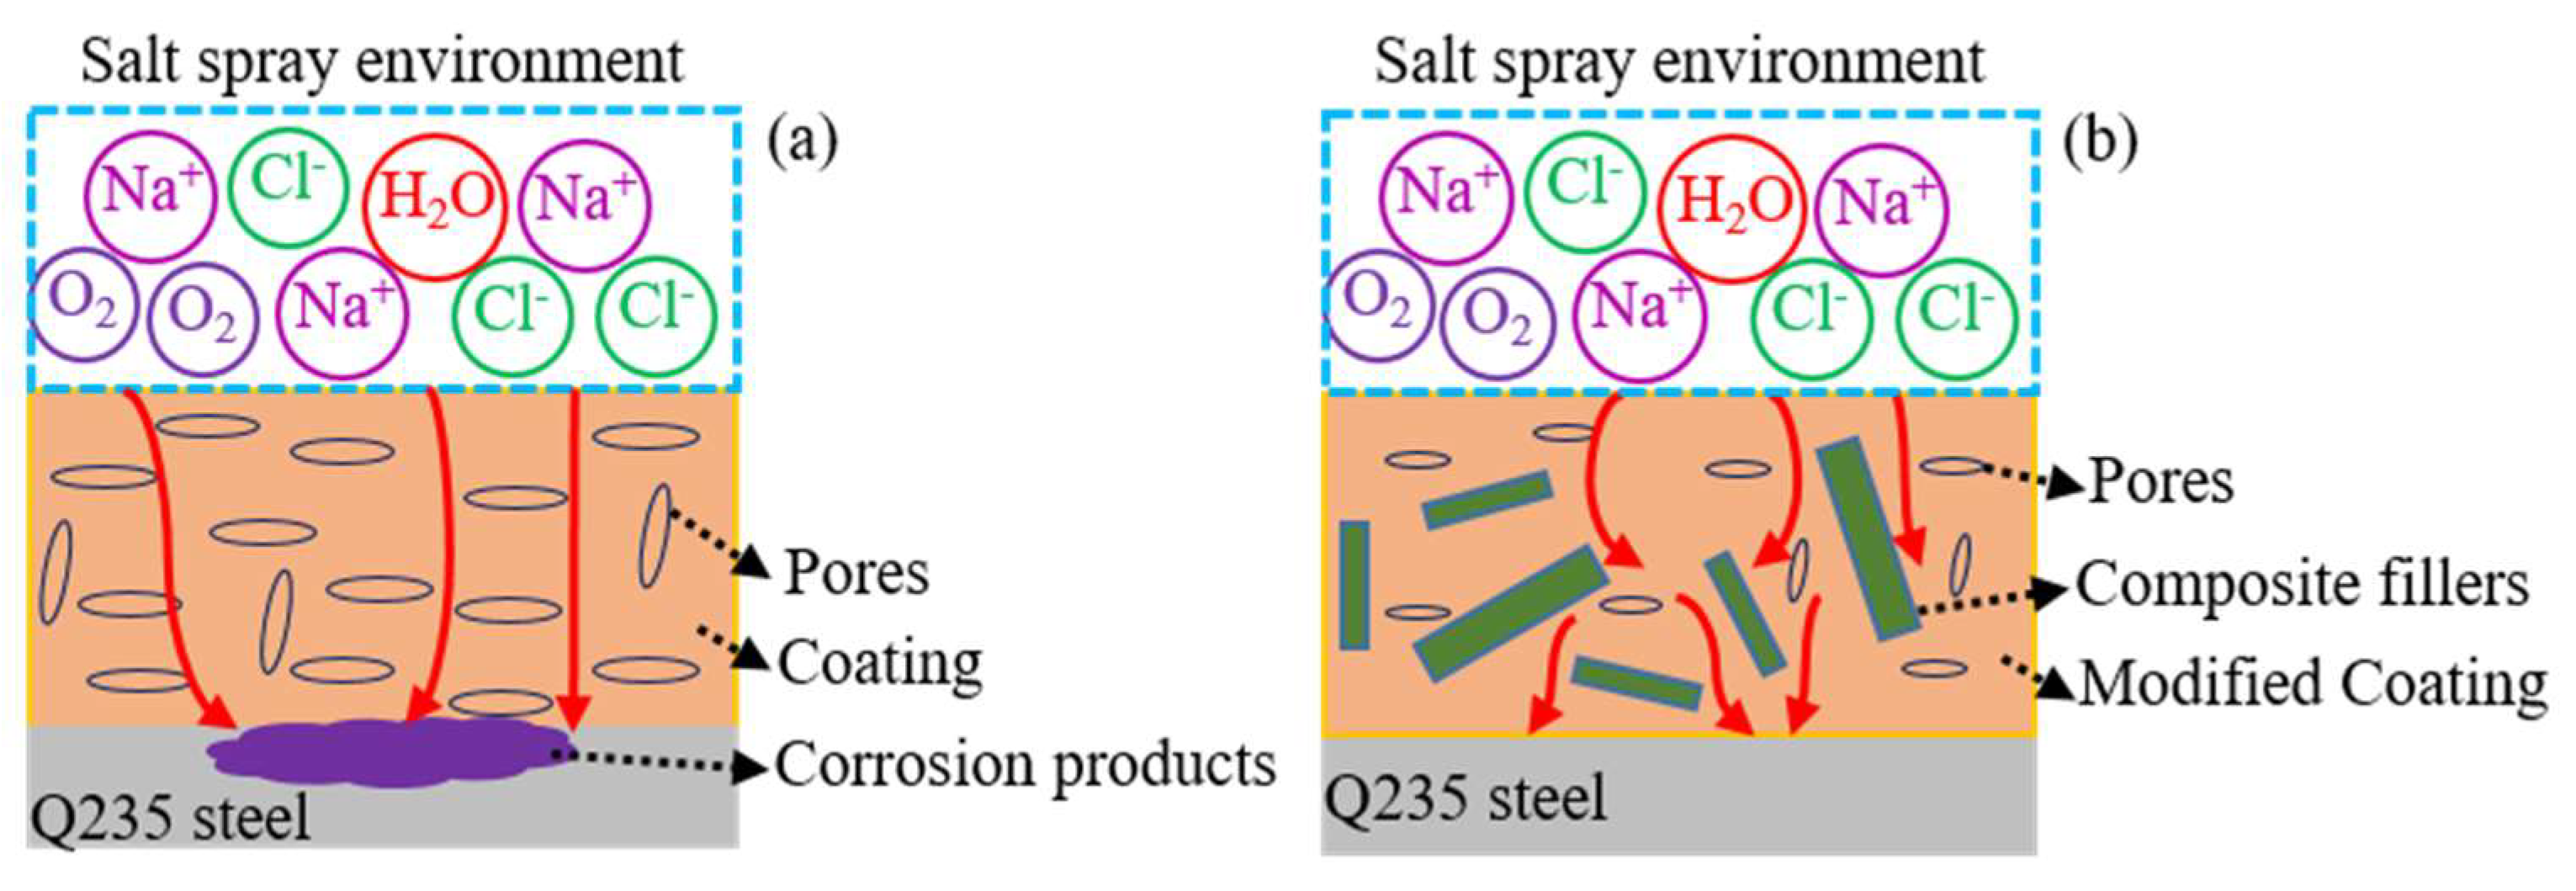
3.5. Protective Mechanism of the Composite Coating

Based on the above analysis, it can be concluded that the corrosion resistance of the waterborne polyurethane coating could be enhanced by composite fillers, and the corresponding protective mechanism is depicted in Figure 10. During the curing process of coating, some pores are formed due to the evaporation of solvent. For the waterborne polyurethane coating, the chloride ions, water, and oxygen i.e., could readily penetrate into the coating and reach the interface between the coating and Q235 steel [36,37] due to its larger size pores and bad shielding property (Figure 10a). Then, the electrochemical reactions occur on the Q235 steel surface and cause severe corrosion. Thus, the waterborne polyurethane coating shows a weak protective action for the substrate metal. After adding 2 wt % composite fillers, these fillers with different sizes are dispersed in the coating and fill some initial coating pores, which promotes the coating compactness and thus decreases the penetration channel for the corrosive ions, as is shown in Figure 10b. Moreover, the addition of fillers could affect the penetration path of the electrolyte [38] and delay the time for the corrosive ions to arrive on the Q235 surface. Therefore, it can be concluded that the incorporation of proper carbon materials could not only improve the thermal conductivity of the coating but also enhance the validly of its anticorrosion performance in the simulated marine environment.

4. Conclusions

In this paper, a waterborne polyurethane coating with high thermal conductivity is proposed, and then, its corrosion protection performance is studied through salt spray experiments, EIS measurements, and SKP tests. The results show that the addition of mixture fillers significantly improves the thermal conductivity of the coating. Especially for the modified coating with 2 wt % composite fillers, the thermal conductivity increases to 1.222 W·m−1·K−1. In terms of corrosion resistance property, the waterborne polyurethane coating undergoes apparent corrosion damage, and a great number of rust spots occur on its surface after 6 d of salt spray tests. EIS measurement results also depict that the polarization resistance sharply decreases as the salt spray time increases. The polarization resistance decays to 3.24 × 10³ Ω·cm2 when the salt spray time reaches 10 d, implying that the coating loses the protective effects on the substrate metal. However, for the modified coating, during the salt spray test, there is an absence of obvious corrosion phenomenon, and the polarization resistance is still as high as 1.31 × 10⁷ Ω·cm2 at the final stage. Overall, the incorporation of 2 wt % composite fillers markedly enhances the corrosion resistance property of waterborne polyurethane coating. This is mainly attributed to the more compact structure and more excellent shielding action to the electrolyte. The surface Kelvin potential results further confirm the advantageous effects of mixture fillers on the corrosion protective performance. The corresponding protective mechanism of the composite coating is also proposed in this work.

Author Contributions

P.Y. and J.M. conceived and designed the study; P.Y. performed the experiments and wrote the paper; R.L. and B.F. helped with drawing and analysis; K.X., J.G. and H.Z. reviewed the edited manuscript. All authors have read and agreed to the published version of the manuscript.

Funding

This work was supported by the Science and Technology project of State Grid Corporation of China (Study on performance evaluation and testing technology of environmentally friendly anti-corrosive coatings for transmission and distribution equipment, 5200-202119092A-0-0-00).

Institutional Review Board Statement

Not applicable.

Informed Consent Statement

Not applicable.

Data Availability Statement

The raw/processed data required to reproduce these findings cannot be shared at this time due to legal or ethical reasons.

Acknowledgments

We thank the staff at the same laboratory in the China Electric Power Research Institute.

Conflicts of Interest

The authors declare no conflict of interest.

References

  1. Wu, G.L.; Zhong, Y.; Ren, X.; Hao, J.; Wang, Q.; Wang, X.P. Atmospheric Corrosion State Evaluation Based on Surface Corrosion Morphology for Electrical Metal Frame Equipment in Chongqing Power Grid. Key Eng. Mater. 2019, 815, 89–95. [Google Scholar] [CrossRef]
  2. Li, N.; Jiang, Q.; Wang, F.S.; Xie, J.; Li, Y.; Li, J.; Wu, S. Emission behavior, environmental impact and priority-controlled pollutants assessment of volatile organic compounds (VOCs) during asphalt pavement construction based on laboratory experiment. J. Hazard. Mater. 2020, 398, 122904–122913. [Google Scholar] [CrossRef] [PubMed]
  3. Liu, S.; Gu, L.; Zhao, H.C.; Chen, J.; Yu, H. Corrosion Resistance of Graphene-Reinforced Waterborne Epoxy Coatings. J. Mater. Sci. Technol. 2016, 32, 425–431. [Google Scholar] [CrossRef]
  4. He, Y.J.; Boluk, Y.; Pan, J.S.; Ahniyaz, A.; Deltin, T.; Claesson, P.M. Corrosion protective properties of cellulose nanocrystals reinforced waterborne acrylate-based composite coating. Corros. Sci. 2019, 155, 186–194. [Google Scholar] [CrossRef]
  5. Yang, Z.F.; Ruan, J.J.; Huang, D.C.; Du, Z.Y.; Tang, L.Z.; Zhou, T.T. Calculation of hot spot temperature of transformer bushing considering current fluctuation. IEEE Access 2019, 7, 120441–120448. [Google Scholar] [CrossRef]
  6. Liu, G.; Zheng, Z.; Yuan, D.W.; Li, L.; Wu, W. Simulation of Fluid-Thermal Field in Oil-Immersed Transformer Winding Based on Dimensionless Least-Squares and Upwind Finite Element Method. Energies 2018, 11, 2357. [Google Scholar] [CrossRef] [Green Version]
  7. Milad, A.; Mehdi, A.; Rashid, M. Heat Analysis of the Power Transformer Bushings in the Transient and Steady States Considering the Load Variations. Appl. Therm. Eng. 2017, 121, 999–1010. [Google Scholar]
  8. Marcos, V.; Gonçalves, D.R.; Michel, B.H. Power Transformers Thermal Modeling using an Enhanced Set-Membership Multivariable Gaussian Evolving Fuzzy System. Electr. Pow. Syst. Res. 2021, 194, 107088–107099. [Google Scholar]
  9. Wang, F.Z.; Lawrence, T.D.; Yan, Q.; Huang, Z.X. Mechanical properties and thermal conductivity of graphene nanoplatelet/epoxy composites. J. Mater. Sci. 2015, 50, 1082–1093. [Google Scholar] [CrossRef]
  10. Ma, H.Q.; Gao, B.; Wang, M.Y.; Yuan, Z.Y.; Shen, J.B.; Zhao, J.Q.; Feng, Y.K. Strategies for enhancing thermal conductivity of polymer-based thermal interface materials: A review. J. Mater. Sci. 2021, 56, 1064–1086. [Google Scholar] [CrossRef]
  11. Burger, N.; Laachachi, A.; Ferriol, M.; Lutzc, M.; Toniazzo, V.; Rucha, D. Review of thermal conductivity in composites: Mechanisms, parameters and theory. Prog. Polym. Sci. 2016, 61, 1–28. [Google Scholar] [CrossRef]
  12. Kochetov, R.; Andritsch, T.; Lafont, U.; Morshuis, P.H.F.; Picken, S.J.; Smit, J.J. Thermal behaviour of epoxy resin filled with high thermal conductivity nanopowders. In Proceedings of the 2009 IEEE Electrical Insulation Conference, Montréal, QC, Canada, 31 May–3 June 2009; Institute of Electrical and Electronics Engineers (IEEE): Piscataway, NJ, USA, 2009; pp. 524–528. [Google Scholar]
  13. Bian, W.C.; Yao, T.; Chen, M.; Zhang, C.; Shao, T.; Yang, Y. The Synergistic Effects of the Micro-BN and NanoAl2O3 in Micro-nano Composites on Enhancing the Thermal Conductivity for Insulating Epoxy Resin. Compos. Sci. Technol. 2018, 168, 420–428. [Google Scholar] [CrossRef]
  14. Santosh, K.Y.; Jae, W.C. Functionalized graphene nanoplatelets for enhanced mechanical and thermal properties of polyurethane nanocomposites. Appl. Surf. Sci. 2013, 266, 360–367. [Google Scholar]
  15. Shi, Q.; Zhu, A.P. Interface regulation of graphene/carbon nanotube on the thermal conductivity and anticorrosion performance of their nanocomposite. Prog. Org. Coat. 2020, 140, 105480–105486. [Google Scholar] [CrossRef]
  16. Song, H.F.; Kang, F.Y. Recent Progress on Thermal Conduction of Graphene. Acta Phys. Chim. Sin. 2021, 37, 2101013–2101028. [Google Scholar] [CrossRef]
  17. Sung, H.S.; Kwang, H.P.; Bo, H.M.; Yong, W.C.; Gwang, H.J.; Dong, J.L.; Byung, S.K.; Kyung, W.P.; Seokwoo, J. Enhanced Thermal Conductivity of Epoxy–Graphene Composites by Using Non-Oxidized Graphene Flakes with Non-Covalent Functionalization. Adv. Mater. 2013, 25, 732–737. [Google Scholar] [CrossRef]
  18. Zhu, D.H.; Qi, Y.; Yu, W.; Chen, L.F.; Wang, M.Z.; Xie, H.Q. Enhanced Thermal Conductivity for Graphene Nanoplatelets/Epoxy Resin Composites. J. Thermal Sci. Eng. Appl. 2018, 10, 11011–11015. [Google Scholar] [CrossRef]
  19. Biedenkopf, P.; Spiegel, M.; Grabke, H.J. High temperature corrosion of low and high alloy steels under molten carbonate fuel cell conditions. Mater. Corros. 1997, 48, 477–488. [Google Scholar] [CrossRef]
  20. Zhao, Z.H.; Guo, L.; Feng, L.; Lu, H.; Xu, Y.; Wang, J.N.; Xiang, B.; Zou, X.F. Polydopamine functionalized graphene oxide nanocomposites reinforced the corrosion protection and adhesion properties of waterborne polyurethane coatings. Eur. Polym. J. 2019, 120, 109249–109261. [Google Scholar] [CrossRef]
  21. Liu, Z.; Li, X.; Cheng, Y. Understand the occurrence of pitting corrosion of pipeline carbon steel under cathodic polarization. Electrochim. Acta 2012, 60, 259–263. [Google Scholar] [CrossRef]
  22. Hinderliter, B.R.; Croll, S.G.; Tallma, D.E.; Su, Q.; Bierwagen, G.P. Interpretation of EIS data from accelerated exposure of coated metals based on modeling of coating physical properties. Electrochim. Acta 2006, 51, 4505–4515. [Google Scholar] [CrossRef]
  23. Fu, T.; Tang, X.B.; Cai, Z.K.; Zuo, Y.; Tang, Y.M.; Zhao, X.H. Correlation research of phase angle variation and coating performance by means of Pearson’s correlation coefficient. Prog. Org. Coat. 2020, 139, 105459–105467. [Google Scholar] [CrossRef]
  24. Zhang, F.Y.; Liu, W.Q.; Liang, L.Y.; Wang, S.; Shi, H.Y.; Xie, Y.K.; Yang, M.P.; Pi, K. The effect of functional graphene oxide nanoparticles on corrosion resistance of waterborne polyurethane. Colloid. Surface A 2020, 591, 124565–124574. [Google Scholar] [CrossRef]
  25. Ye, Y.W.; Zhang, D.W.; Liu, T.; Liu, Z.Y.; Liu, W.; Pu, J.B.; Chen, H.; Zhao, H.C.; Li, X.G. Improvement of anticorrosion ability of epoxy matrix in simulate marine environment by filled with superhydrophobic POSS-GO nanosheets. J. Hazard. Mater. 2019, 364, 244–255. [Google Scholar] [CrossRef] [PubMed]
  26. Zhou, S.G.; Wu, Y.M.; Zhao, W.J.; Yu, J.J.; Jiang, F.W.; Ma, L.Q. Comparative corrosion resistance of graphene sheets with different structures in waterborne epoxy coatings. Colloid. Surf. A 2018, 556, 273–283. [Google Scholar] [CrossRef]
  27. Shi, P.; Niu, B.; Shanshan, E.; Chen, Y.; Li, Q. Preparation and characterization of PLA coating and PLA/MAO composite coatings on AZ31 magnesium alloy for improvement of corrosion resistance. Surf. Coat. Technol. 2015, 262, 26–32. [Google Scholar] [CrossRef]
  28. Yi, P.; Zhu, L.J.; Dong, C.F.; Xiao, K. Corrosion and interfacial contact resistance of 316L stainless steel coated with magnetron sputtered ZrN and TiN in the simulated cathodic environment of a proton-exchange membrane fuel cell. Surf. Coat. Technol. 2019, 363, 198–202. [Google Scholar] [CrossRef]
  29. Ye, Y.W.; Zhang, D.W.; Liu, T. Superior corrosion resistance and self-healable epoxy coating pigmented with silanzied trianiline-intercalated graphene. Carbon 2019, 142, 164–176. [Google Scholar] [CrossRef]
  30. Armstrong, R.D.; Wright, D. Polymer protective coatings—The distinction between coating porosity and the wetted metal area. Electrochim. Acta 1993, 38, 1799–1801. [Google Scholar] [CrossRef]
  31. Zhu, Y.F.; Xiong, J.P.; Tang, Y.M.; Zuo, Y. EIS study on failure process of two polyurethane composite coatings. Prog. Org. Coat. 2010, 69, 7–11. [Google Scholar] [CrossRef]
  32. Yi, P.; Xiao, K.; Ding, K.K.; Dong, C.F.; Li, X.G. Surface failure mechanism of PCB-ENIG in typical outdoor atmospheric environments. Mater. Res. Bull. 2017, 91, 179–188. [Google Scholar] [CrossRef]
  33. Yi, P.; Xiao, K.; Dong, C.F.; Zou, S.W.; Li, X.G. Effects of mould on electrochemical migration behaviour of immersion silver finished printed circuit board. Bioelectrochemistry 2018, 119, 203–210. [Google Scholar] [CrossRef] [PubMed]
  34. Ding, K.K.; Xiao, K.; Dong, C.F.; Zou, S.W.; Yi, P.; Li, X.G. Initial Corrosion Behavior and Mechanism of PCB–HASL in Typical Outdoor Environments in China. J. Electron. Mater. 2015, 44, 4405–4417. [Google Scholar] [CrossRef]
  35. Reddy, B.; Sykes, J.M. Degradation of organic coatings in a corrosive environment: A study by scanning Kelvin probe and scanning acoustic microscope. Prog. Org. Coat. 2005, 52, 280–287. [Google Scholar] [CrossRef]
  36. Wang, L.D.; Wu, W.D.; Sun, W.; Yang, Z.Q.; Wang, S.L.; Liu, G.C. Partially dehydrated zinc hydroxide sulfate nanoplates reinforced coating for corrosion protection. Chem. Eng. J. 2019, 373, 8–22. [Google Scholar] [CrossRef]
  37. Liu, T.; Wei, J.Y.; Ma, L.W.; Liu, S.; Zhang, D.W.; Zhao, H.C. Effect of polyaniline-based plate on the anticorrosion performance of epoxy coating. Prog. Org. Coat. 2021, 151, 106109–106119. [Google Scholar] [CrossRef]
  38. Nurul, H.O.; Mokhtar, C.I.; Mazli, M.; Nabihah, S.; Kok, E.K.; Rafida, A.J. Graphene-based polymer nanocomposites as barrier coatings for corrosion protection. Prog. Org. Coat. 2019, 135, 82–99. [Google Scholar]
Figure 1. The topography of the mixture fillers (a) and the magnification picture of the red triangle box region (b).
Applsci 12 02021 g001
Figure 2. The thermal conductivity results of waterborne polyurethane coating.
Applsci 12 02021 g002
Figure 3. The surface topography of the samples at different period of salt spray test; (ad) the topography of the coating with composites fillers after 0 d, 3 d, 6 d, and 10 d, respectively; (eh) the topography of the coating without fillers after 0 d, 3 d, 6 d, and 10 d, respectively.
Applsci 12 02021 g003
Figure 4. The adhesion strength of the modified waterborne polyurethane coating.
Applsci 12 02021 g004
Figure 5. Nyquist and Bode curves of the coating sample, (a,b) the coating without composites filler, (c,d) the coating with 2 wt % composites filler.
Applsci 12 02021 g005
Figure 6. The equivalent electrical circuit for the coating samples in different stages.
Applsci 12 02021 g006
Figure 7. The change trend of the polarization resistance (Rp) of the waterborne polyurethane coating.
Applsci 12 02021 g007
Figure 8. The change trend of coating porosity with the salt spray time.
Applsci 12 02021 g008
Figure 9. Surface Kelvin potential mapping of samples after salt spray tests with different periods, (a) 0%, 0 d; (b) 2 wt %, 0 d; (c) 0%, 3 d; (d) 2 wt %, 3 d; (e) 0%, 10 d; (f) 2 wt %, 10 d.
Applsci 12 02021 g009
Figure 10. The protective mechanism of the composite coating on the substrate metal, (a) waterborne polyurethane coating; (b) modified composite coating.
Applsci 12 02021 g010
Publisher’s Note: MDPI stays neutral with regard to jurisdictional claims in published maps and institutional affiliations.

