
Quinine Charge Transfer Complexes with 2,3-Dichloro-5,6-Dicyano-Benzoquinone and 7,7,8,8-Tetracyanoquinodimethane: Spectroscopic Characterization and Theoretical Study

 , , ,
, , ,  ,
,
Abstract
:1. Introduction
2. Materials and Methods
2.1. Reagents and Materials
2.2. Instruments
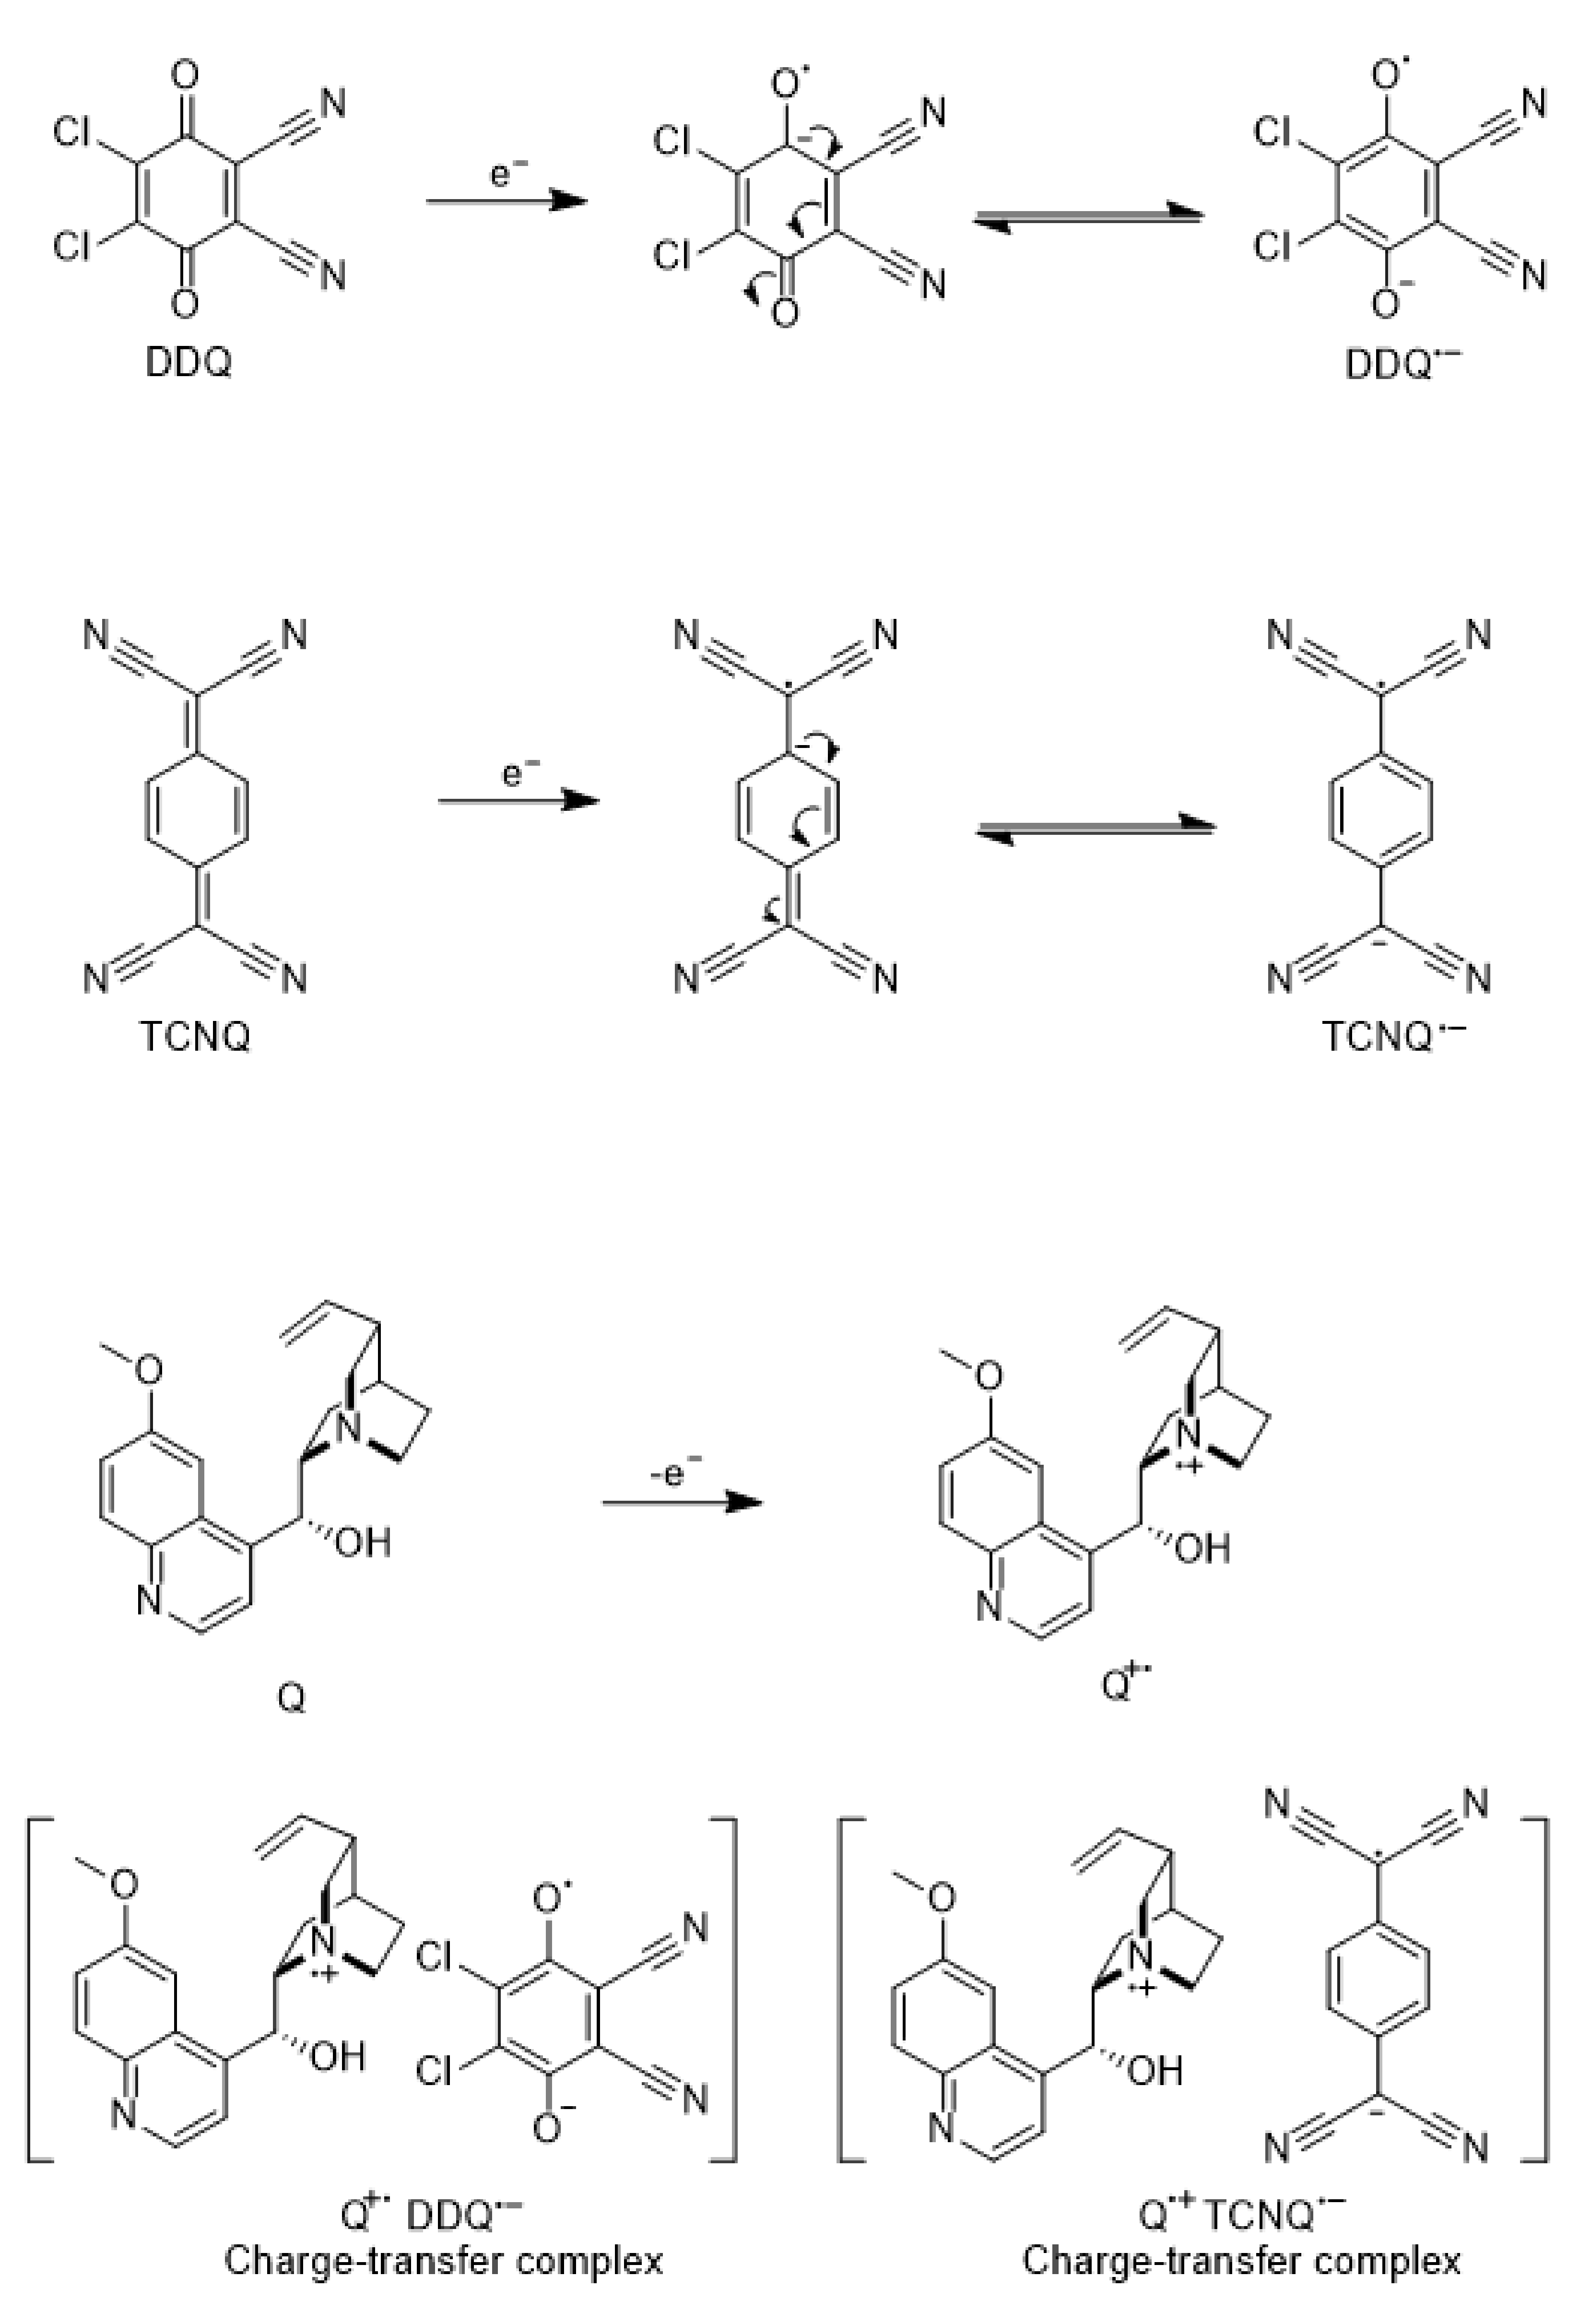
2.3. Synthesis Procedure: Synthesis of Q-DDQ Charge-Transfer Complex
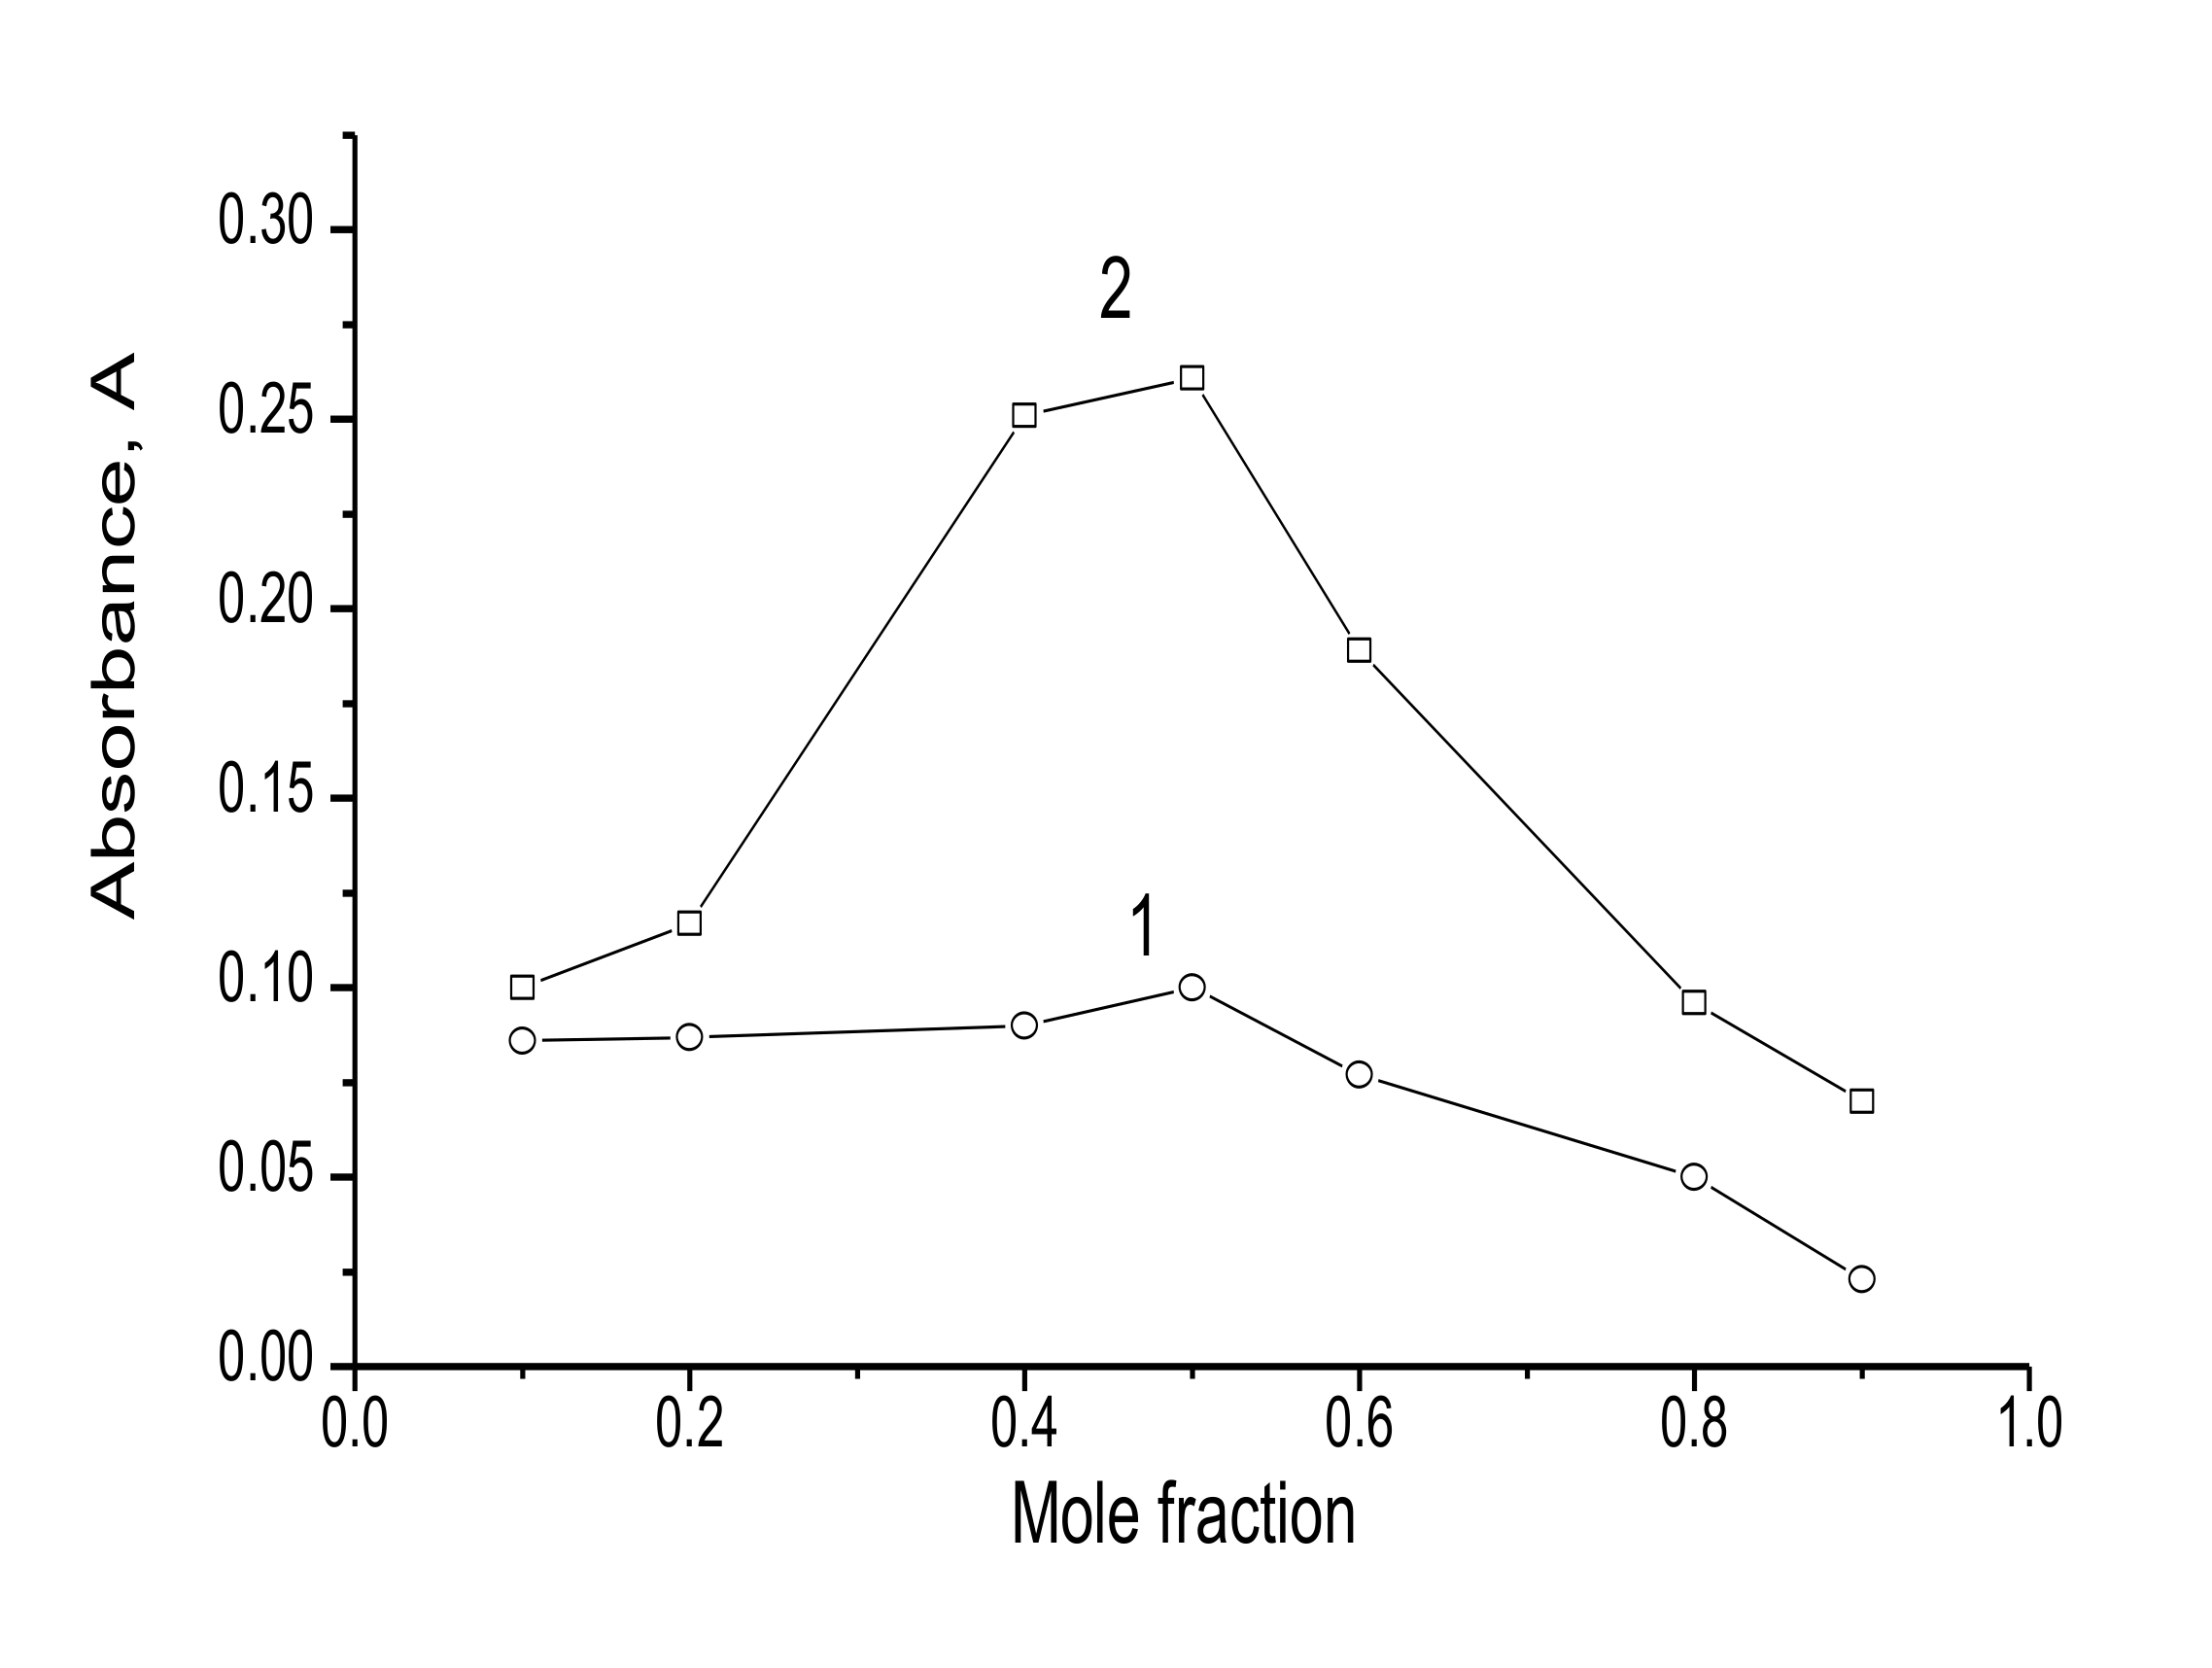
2.4. Stoichiometry
2.5. Quantum Chemical Calculations
3. Results
3.1. Charge Transfer Complex in Solution
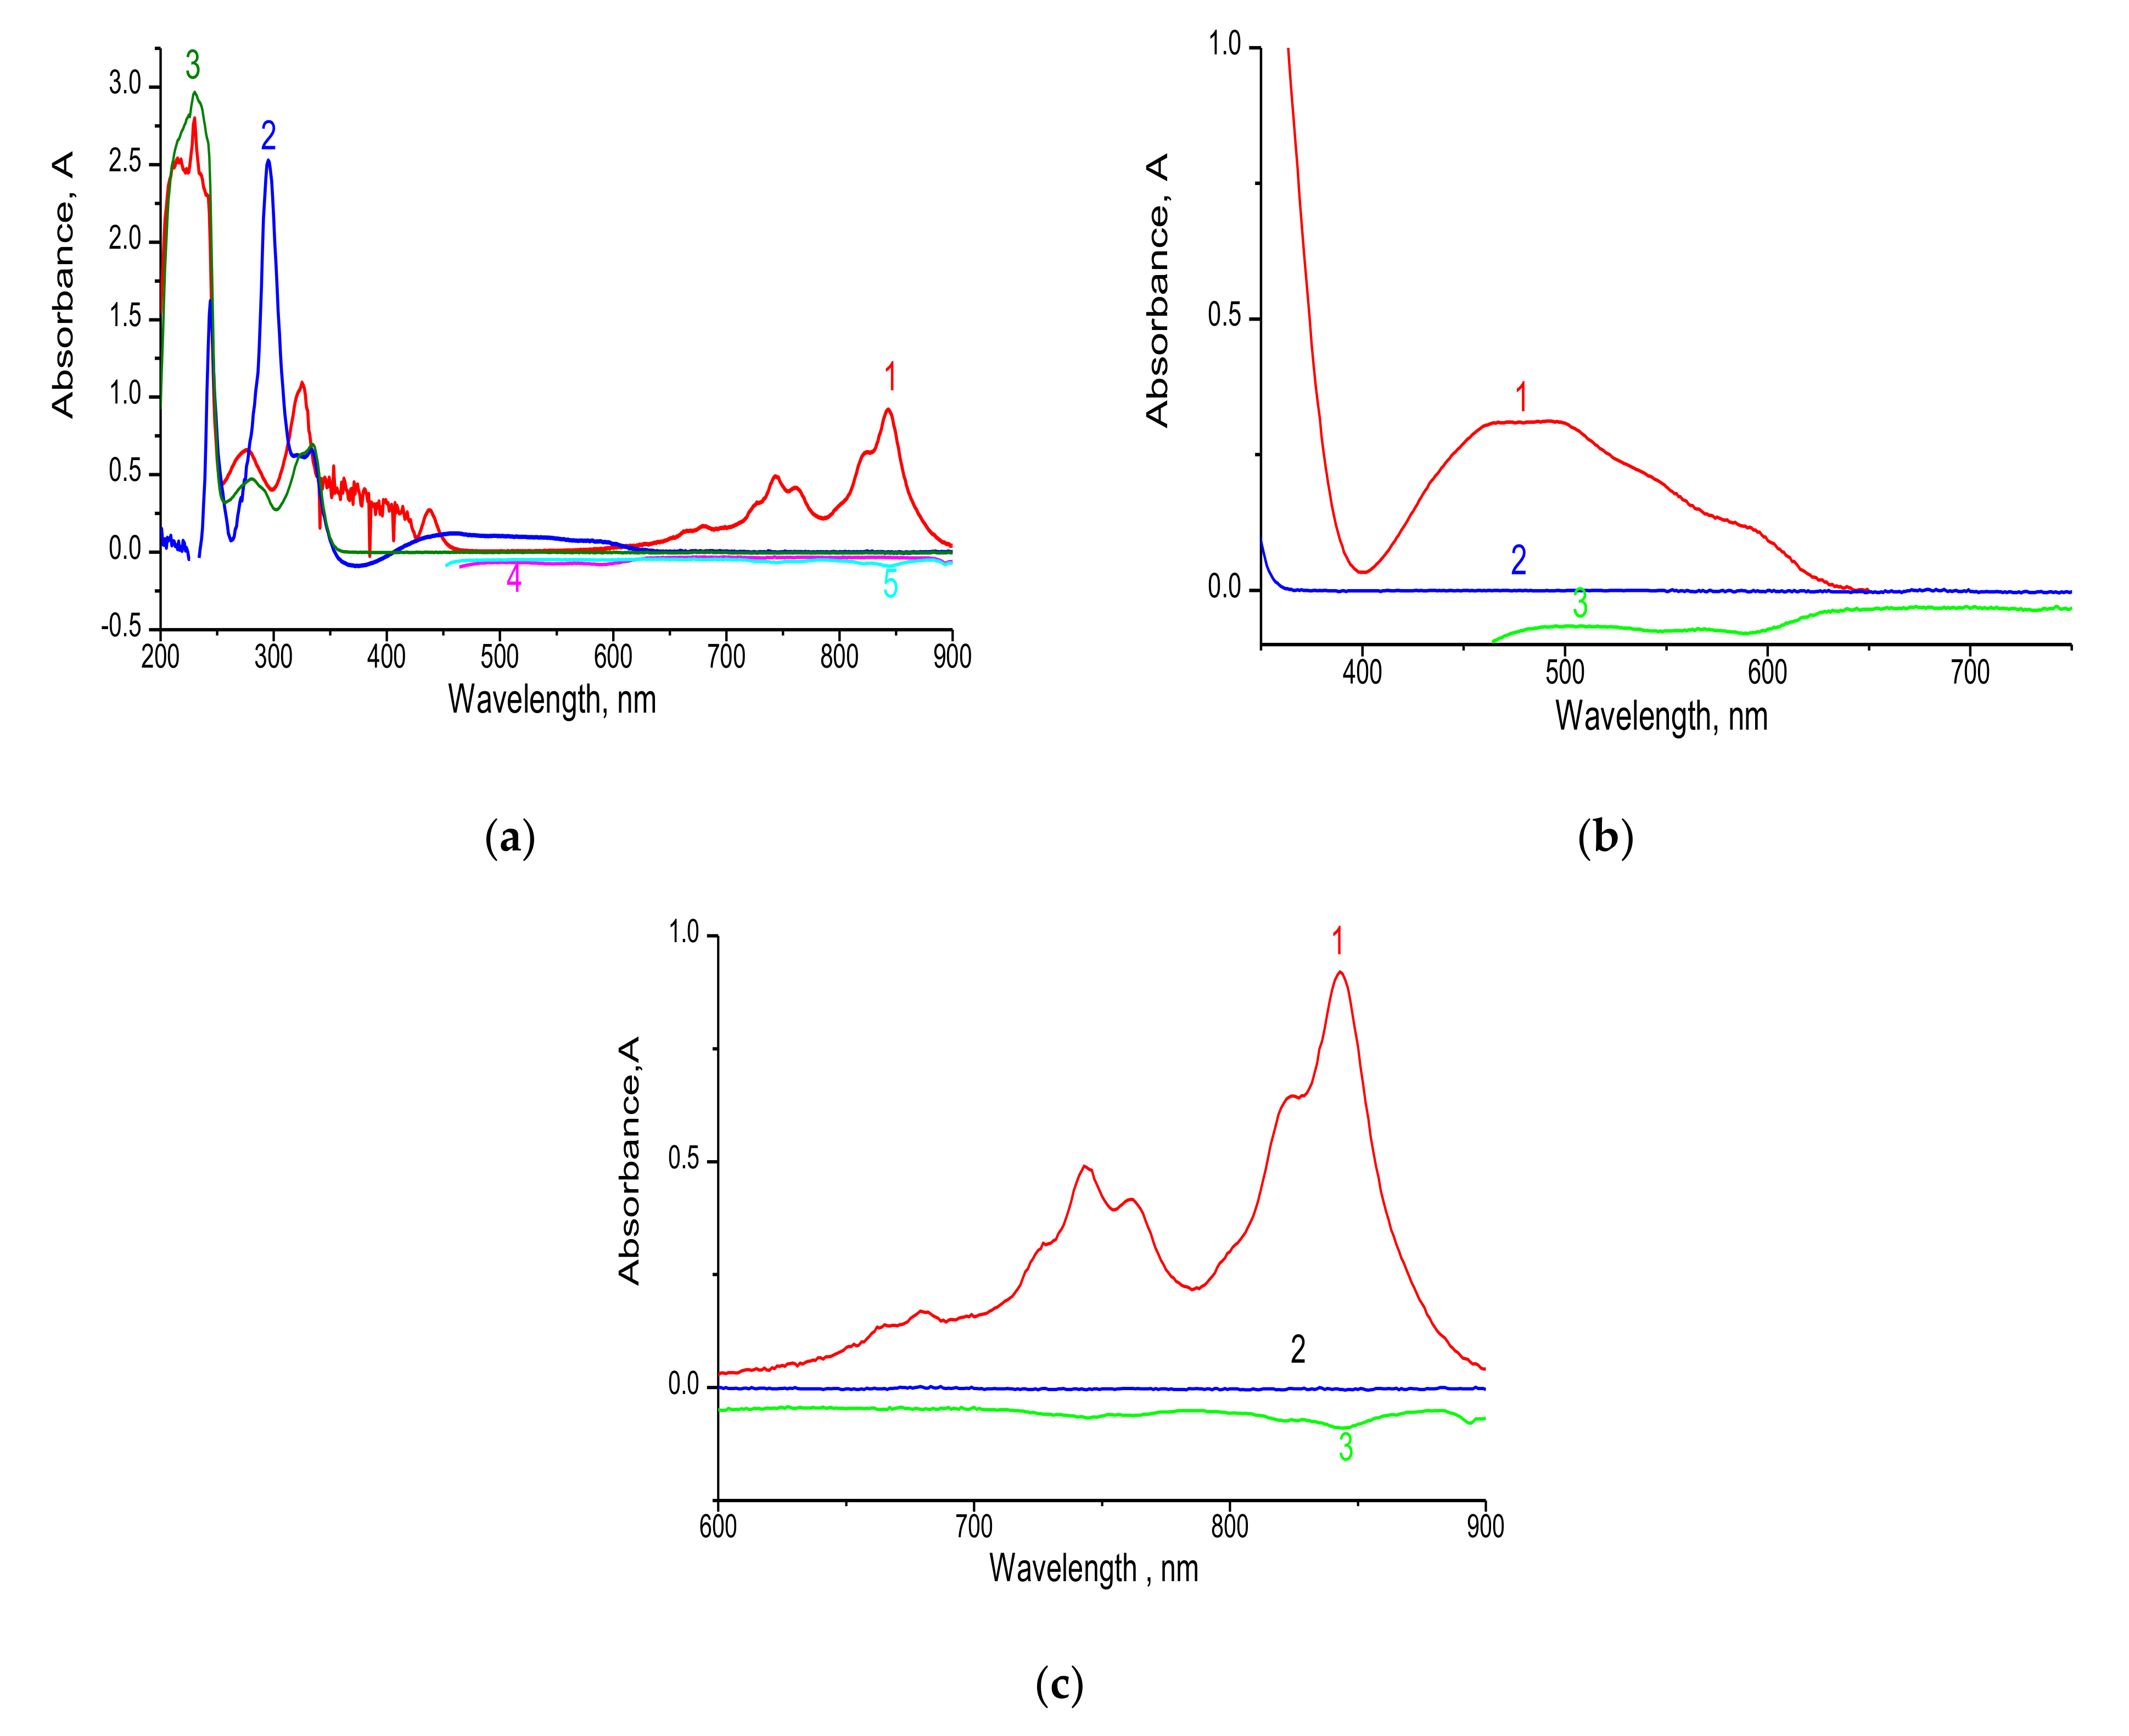
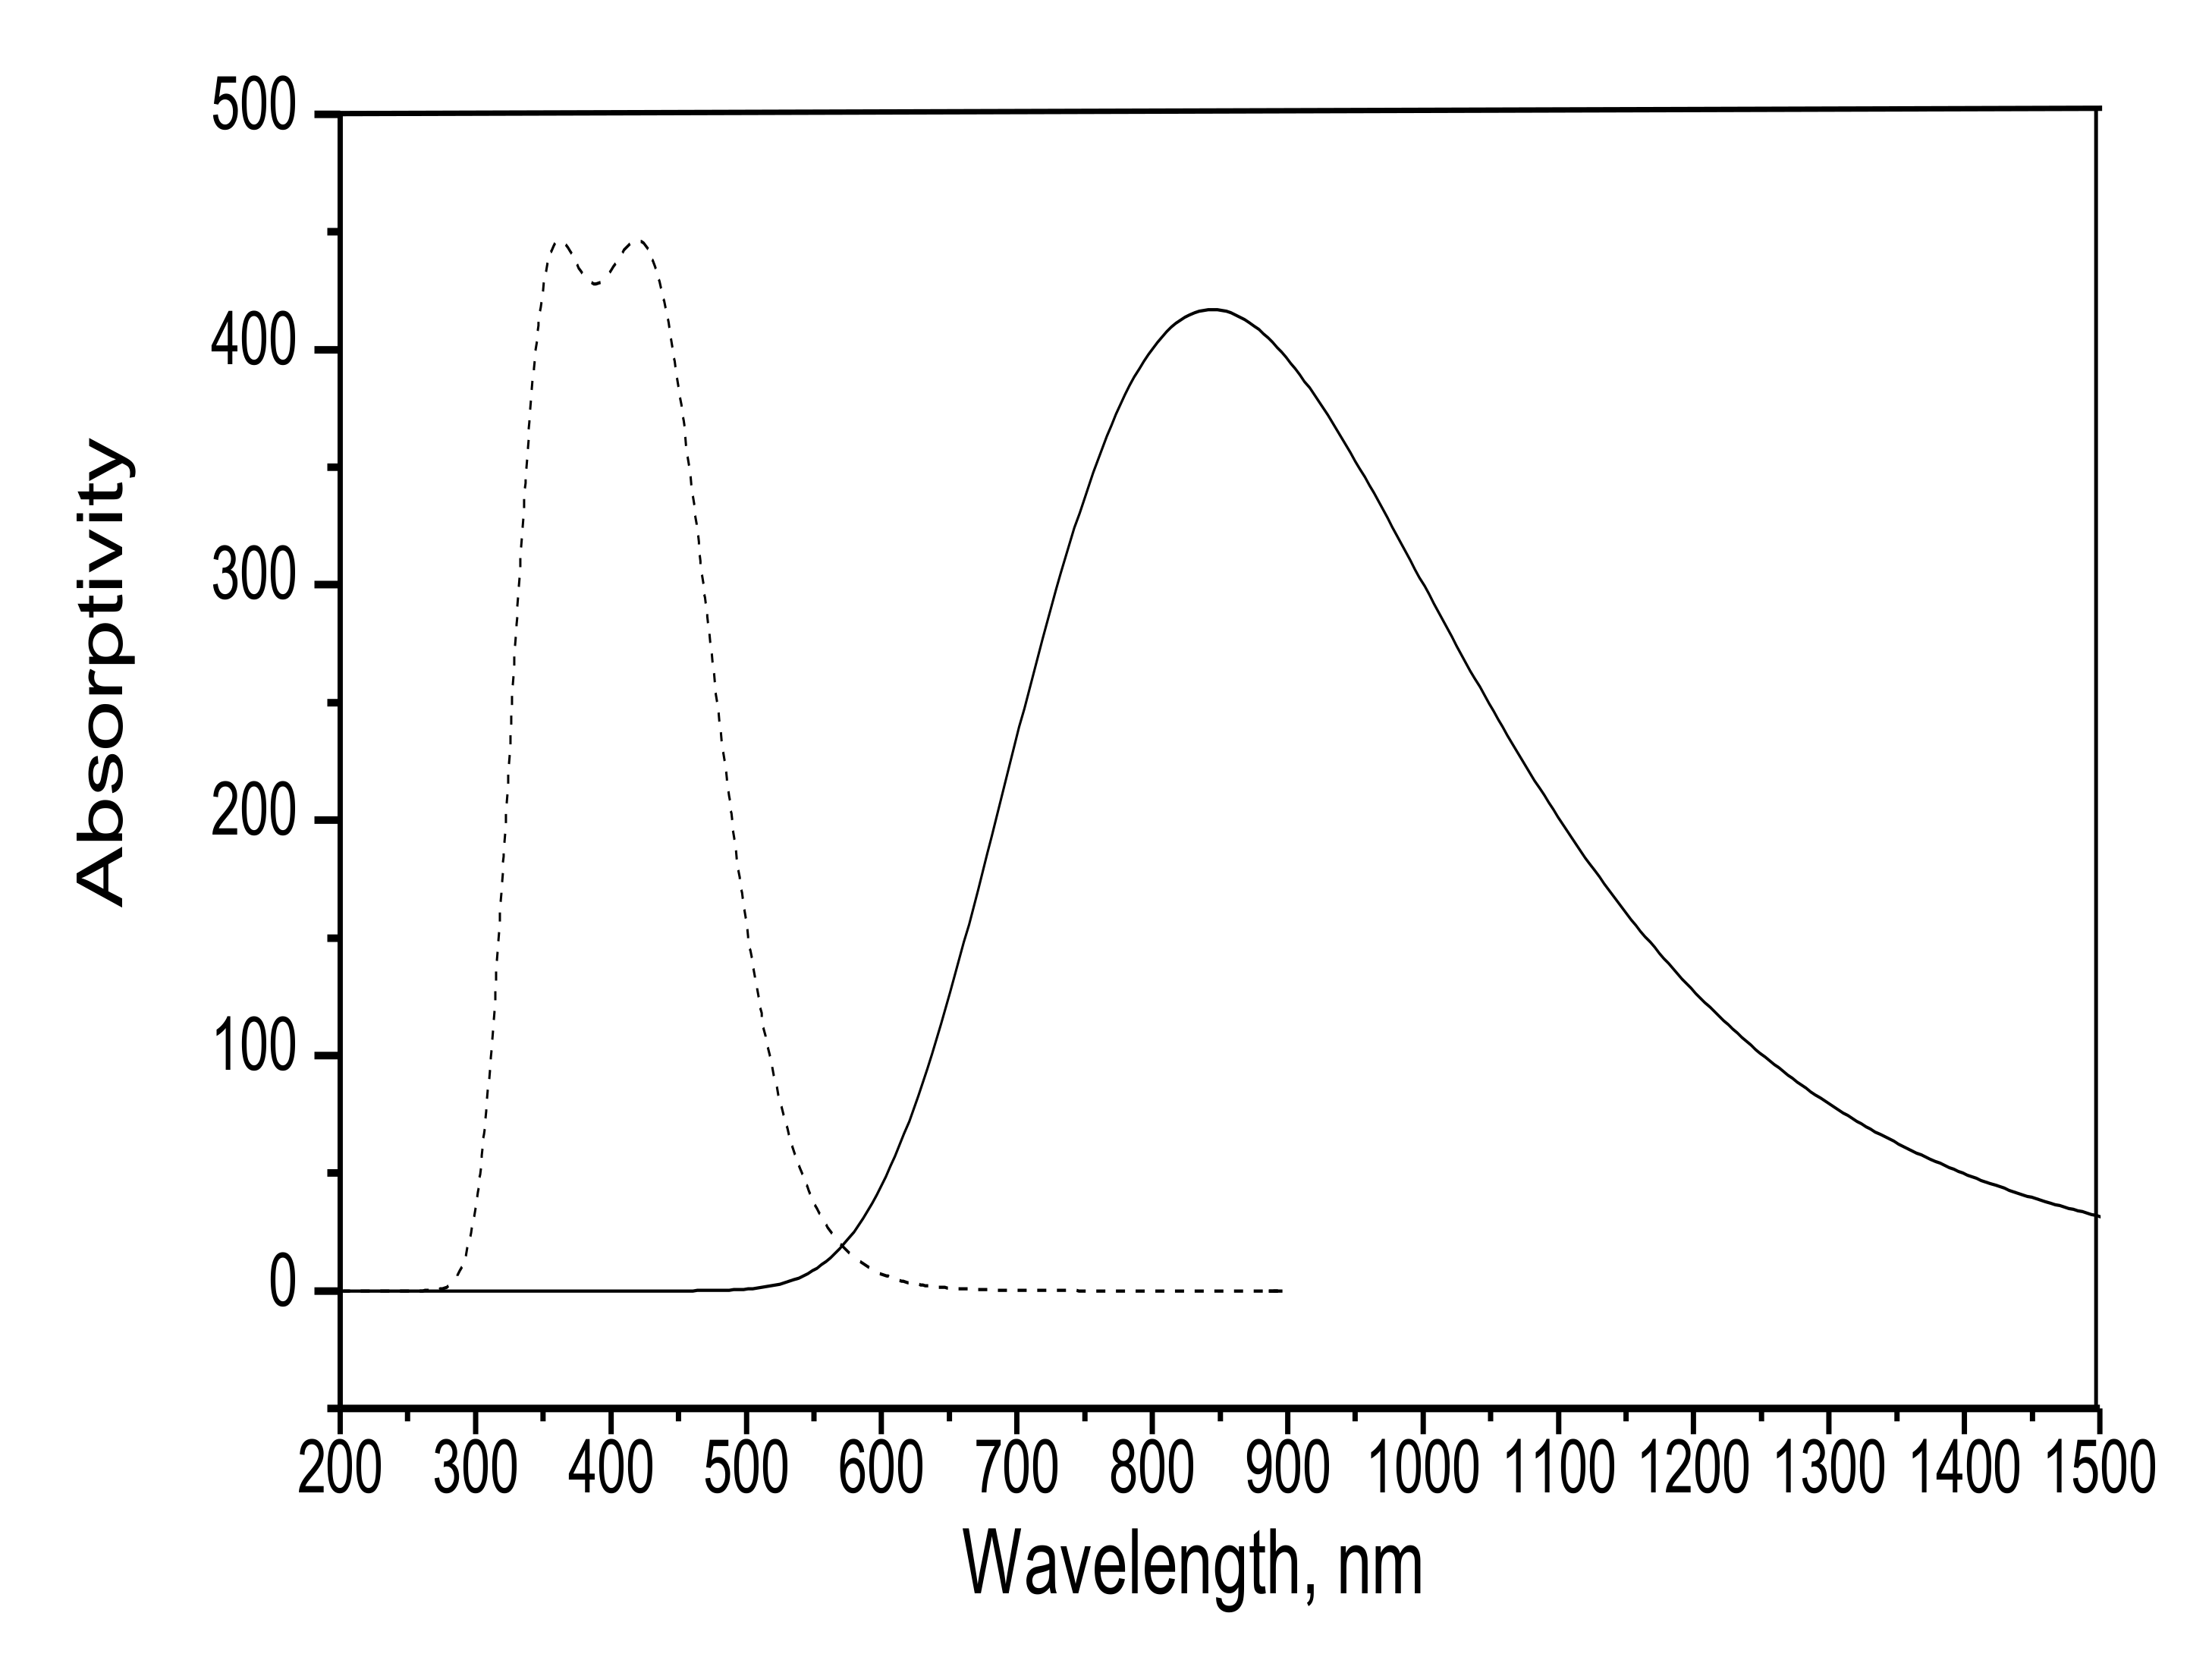
3.1.1. Electronic Spectra
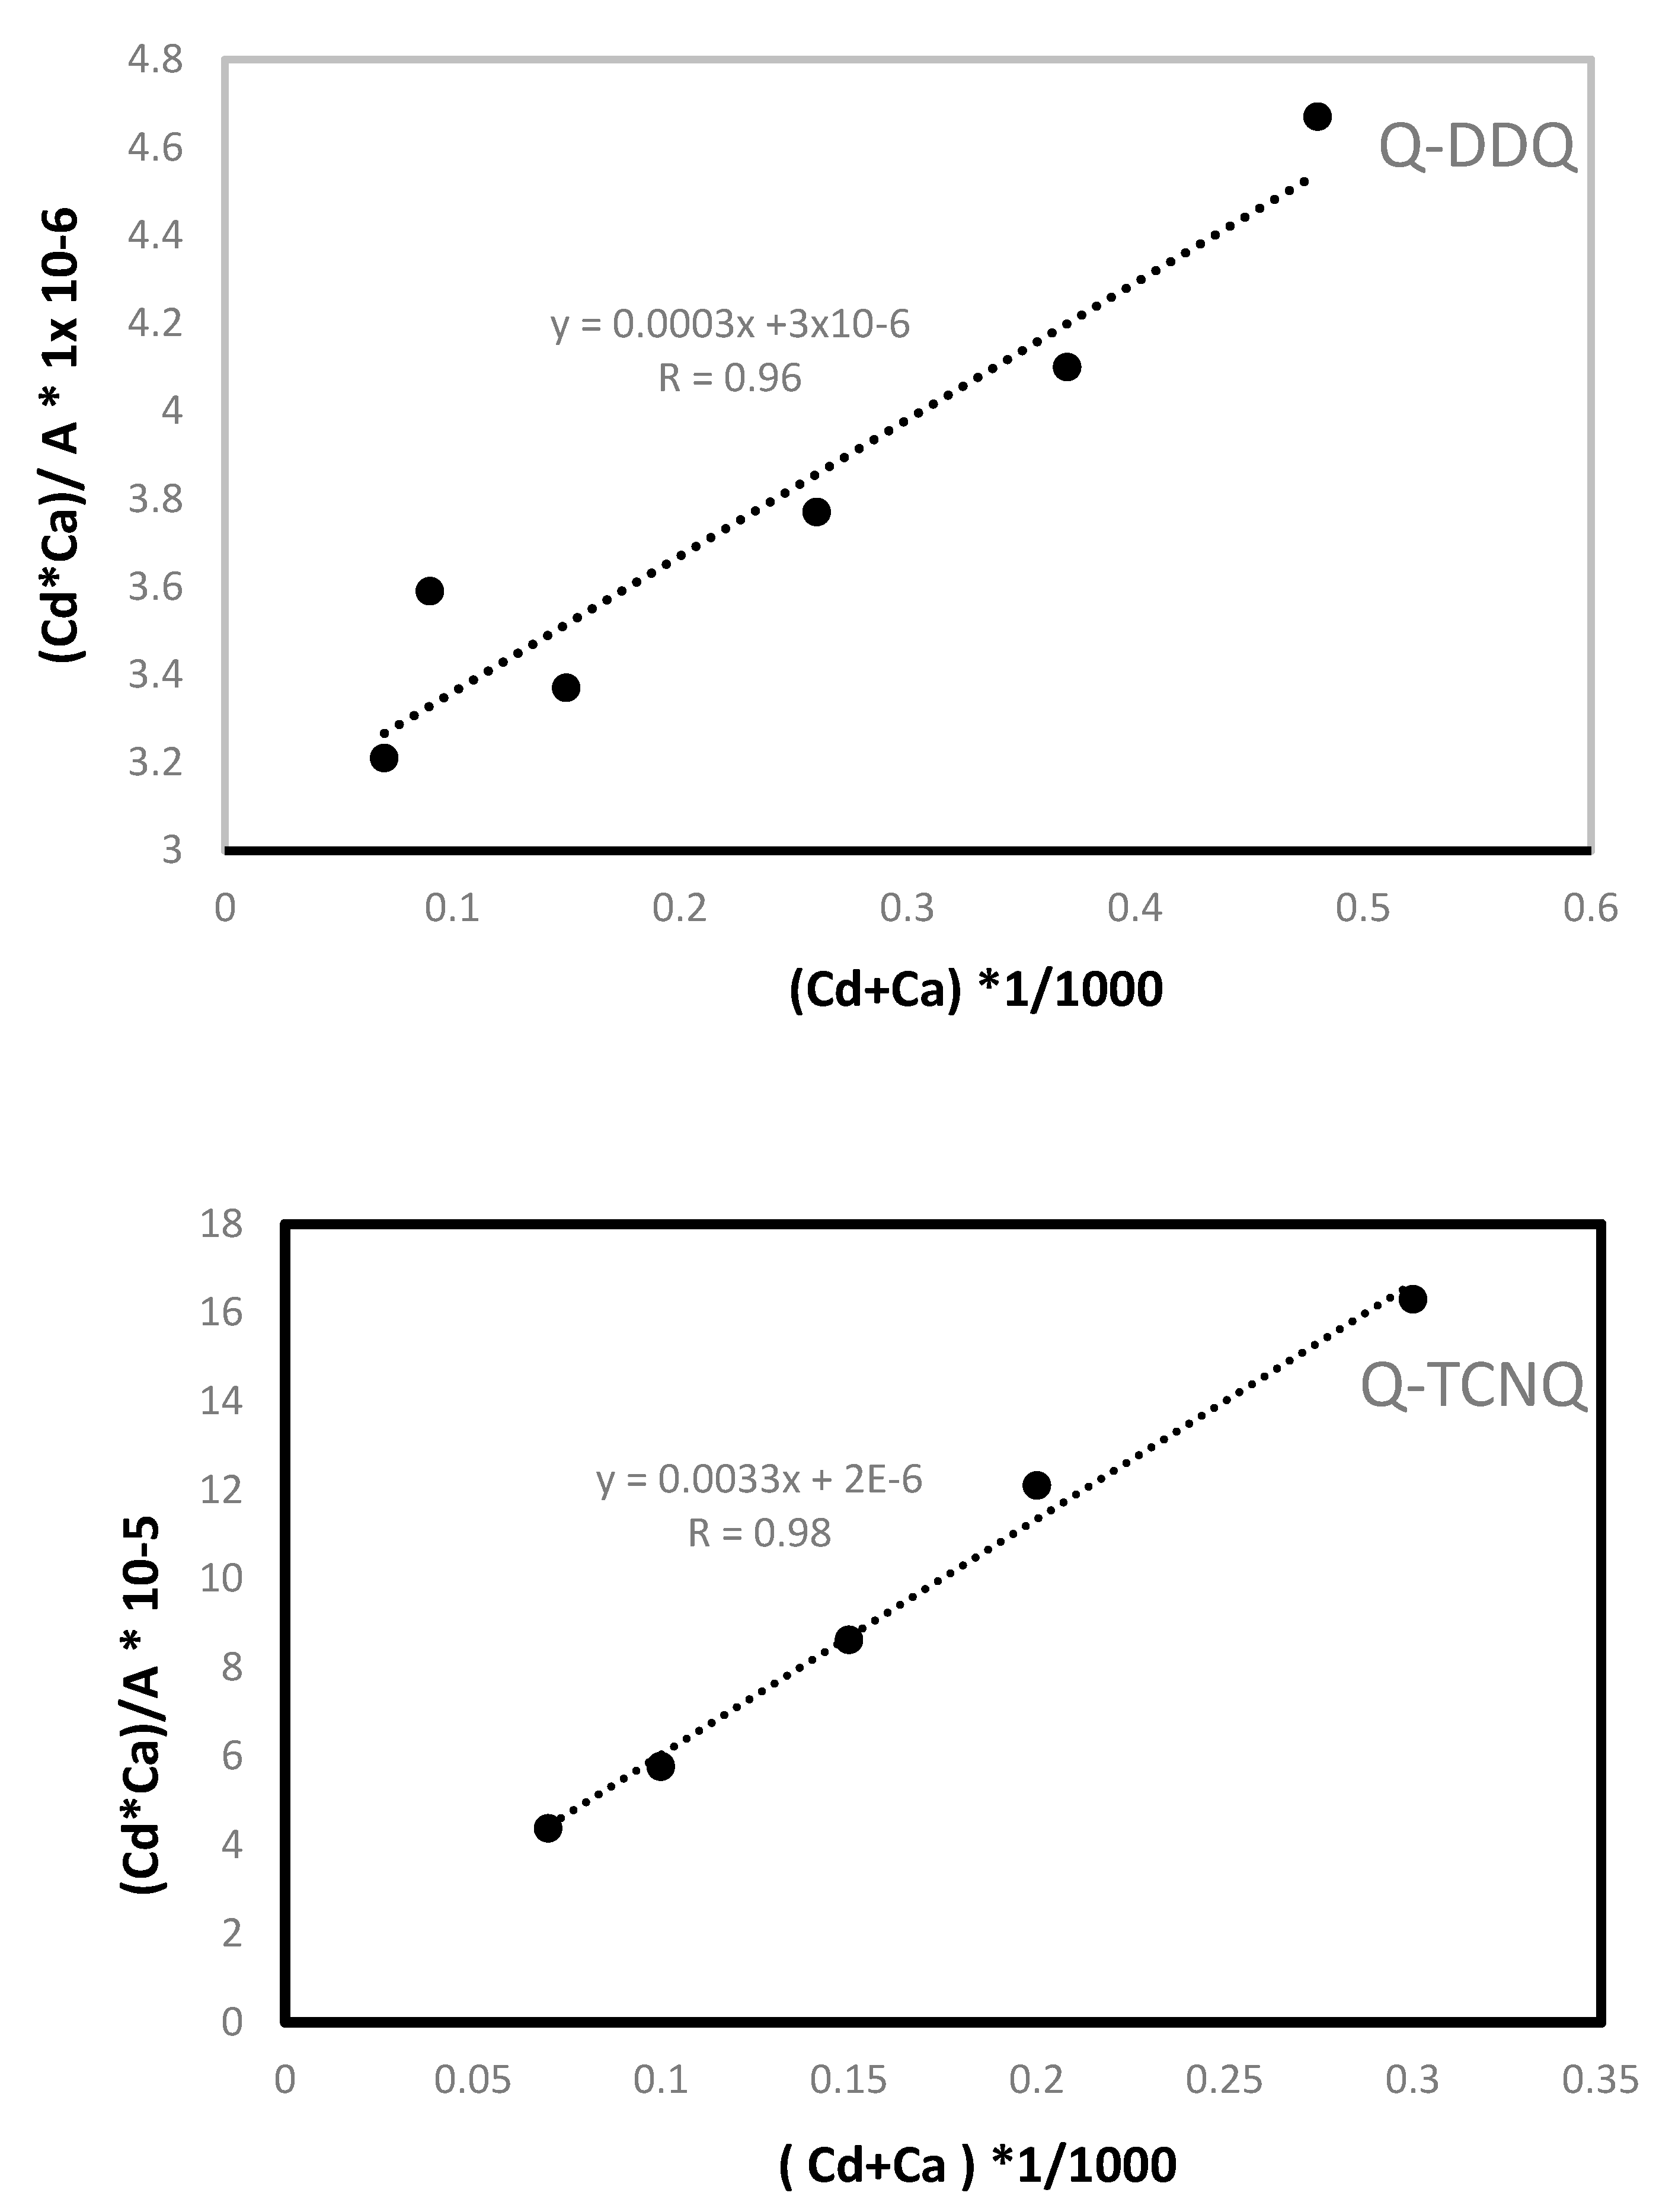
3.1.2. Stoichiometry and Formation Constant
3.1.3. Spectroscopic Physical Parameters
3.2. Investigation of Synthesized CT Complex
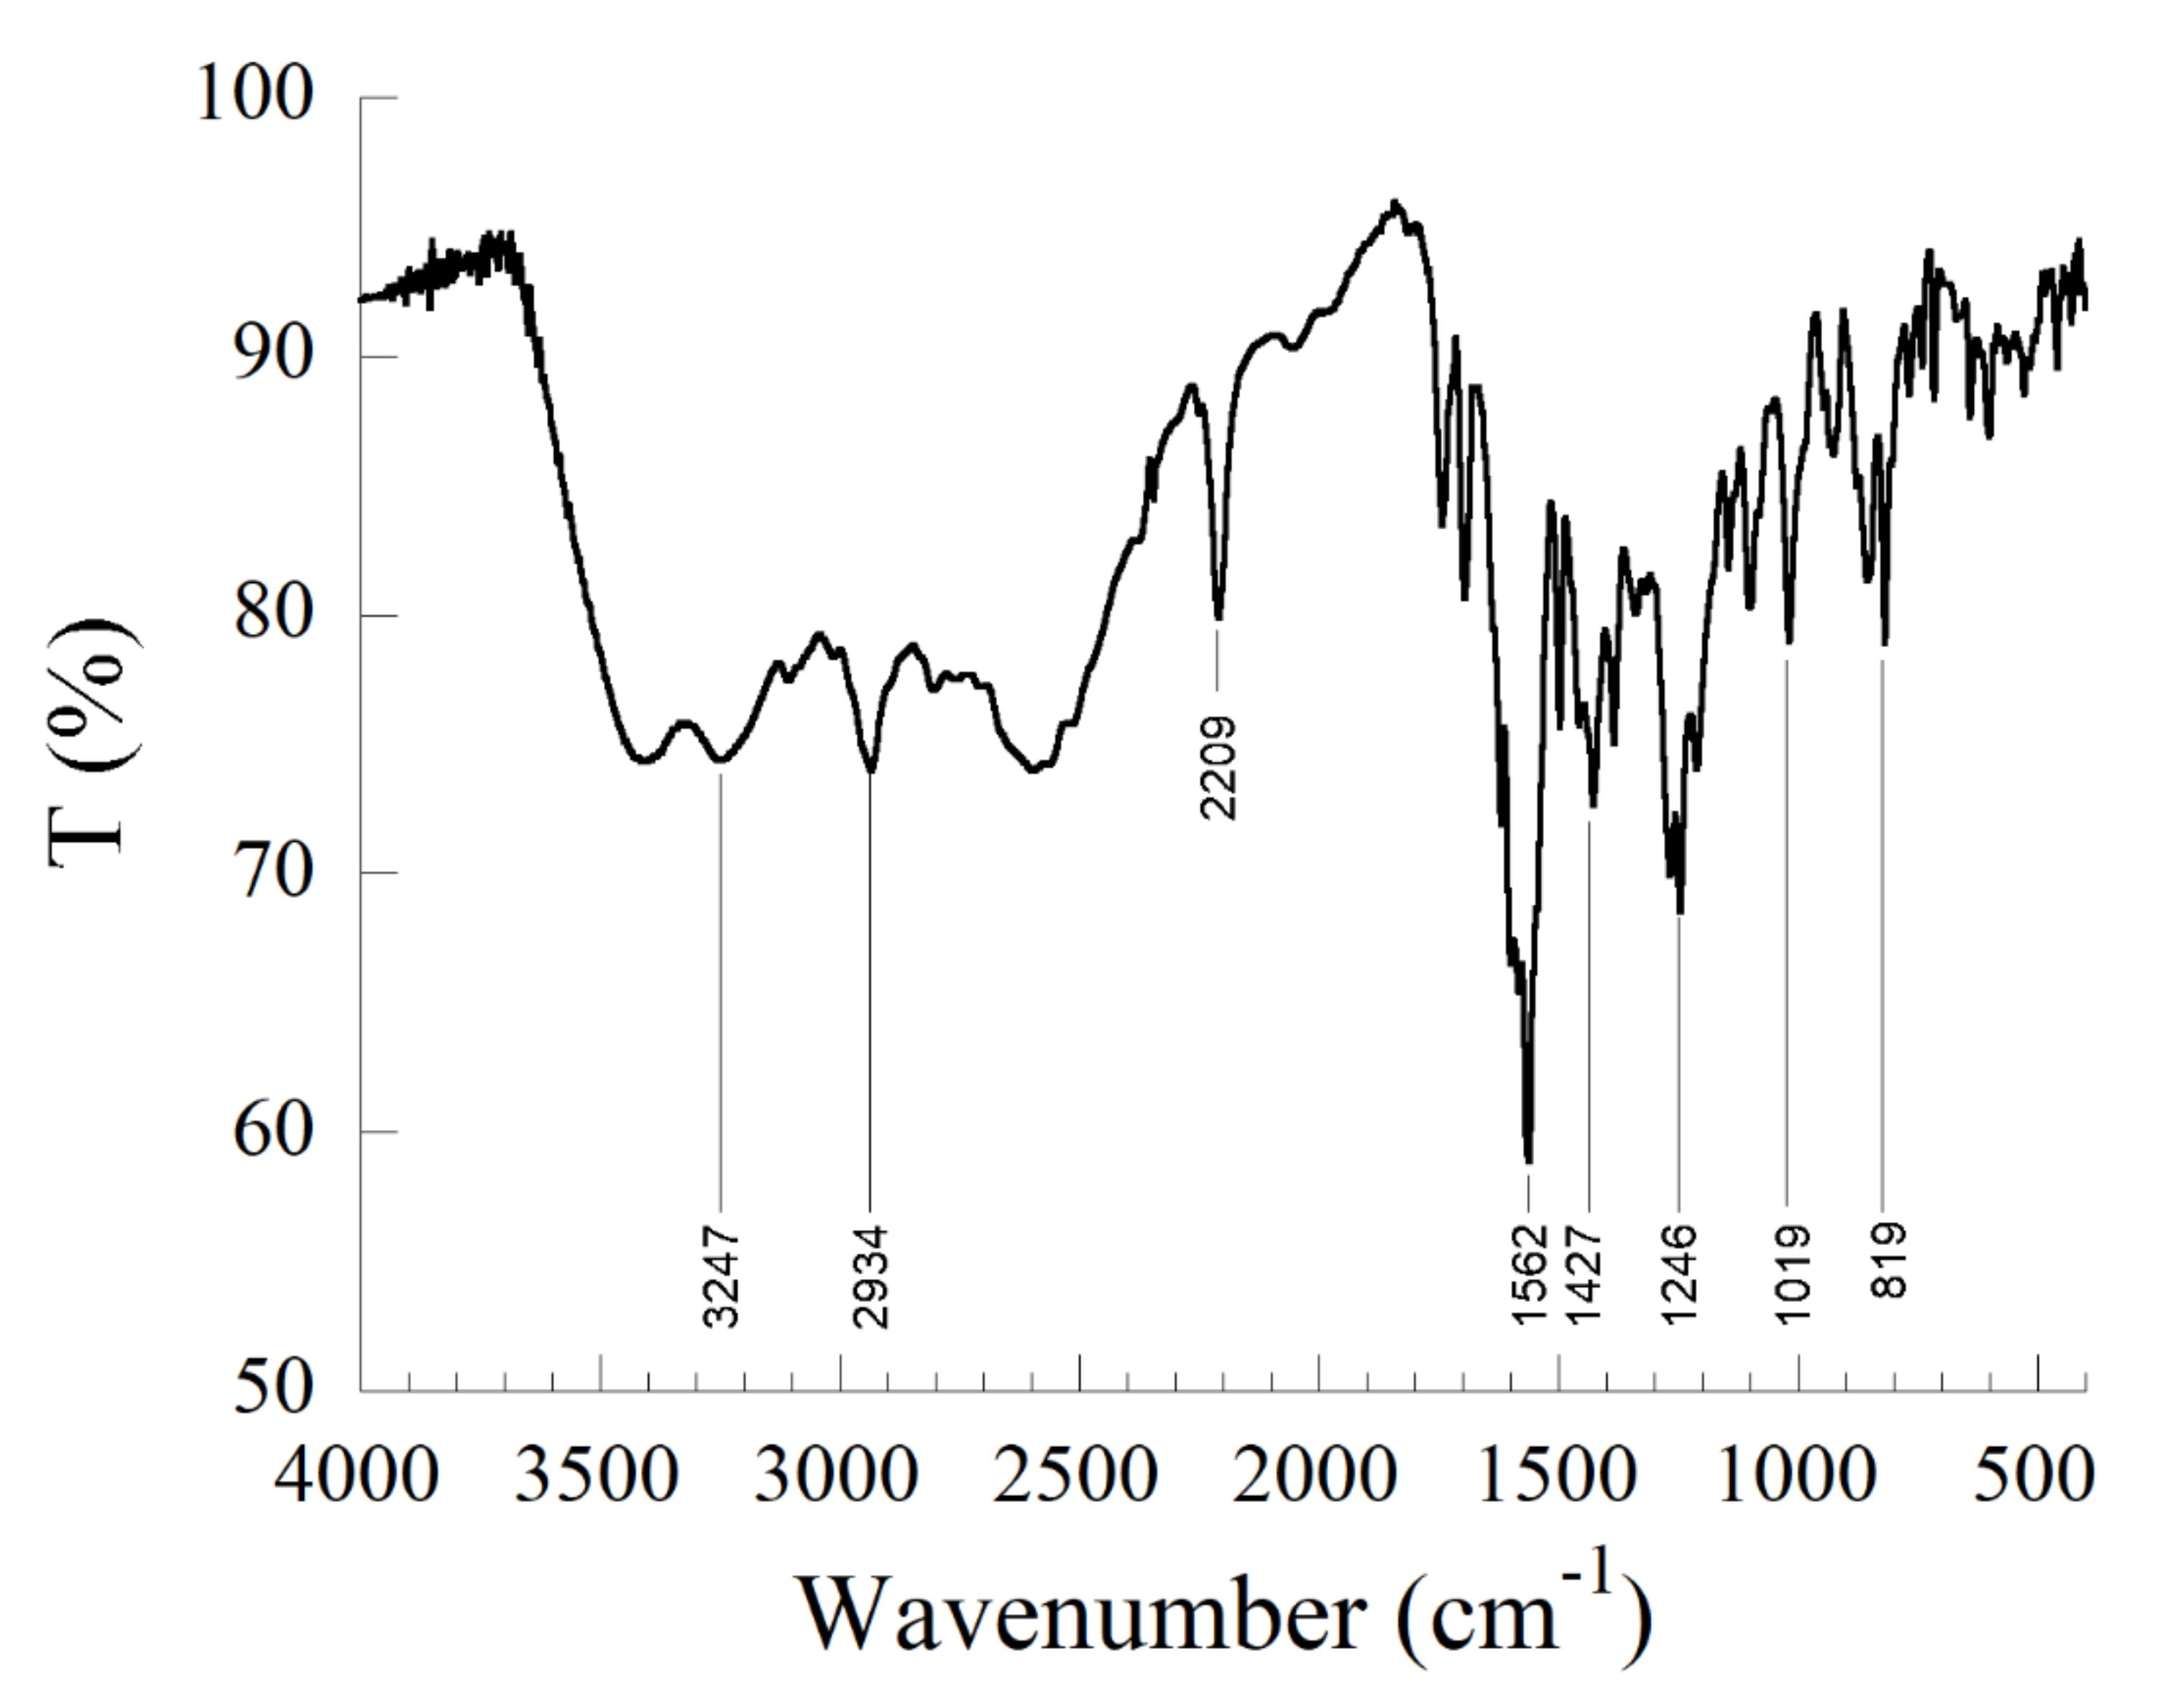
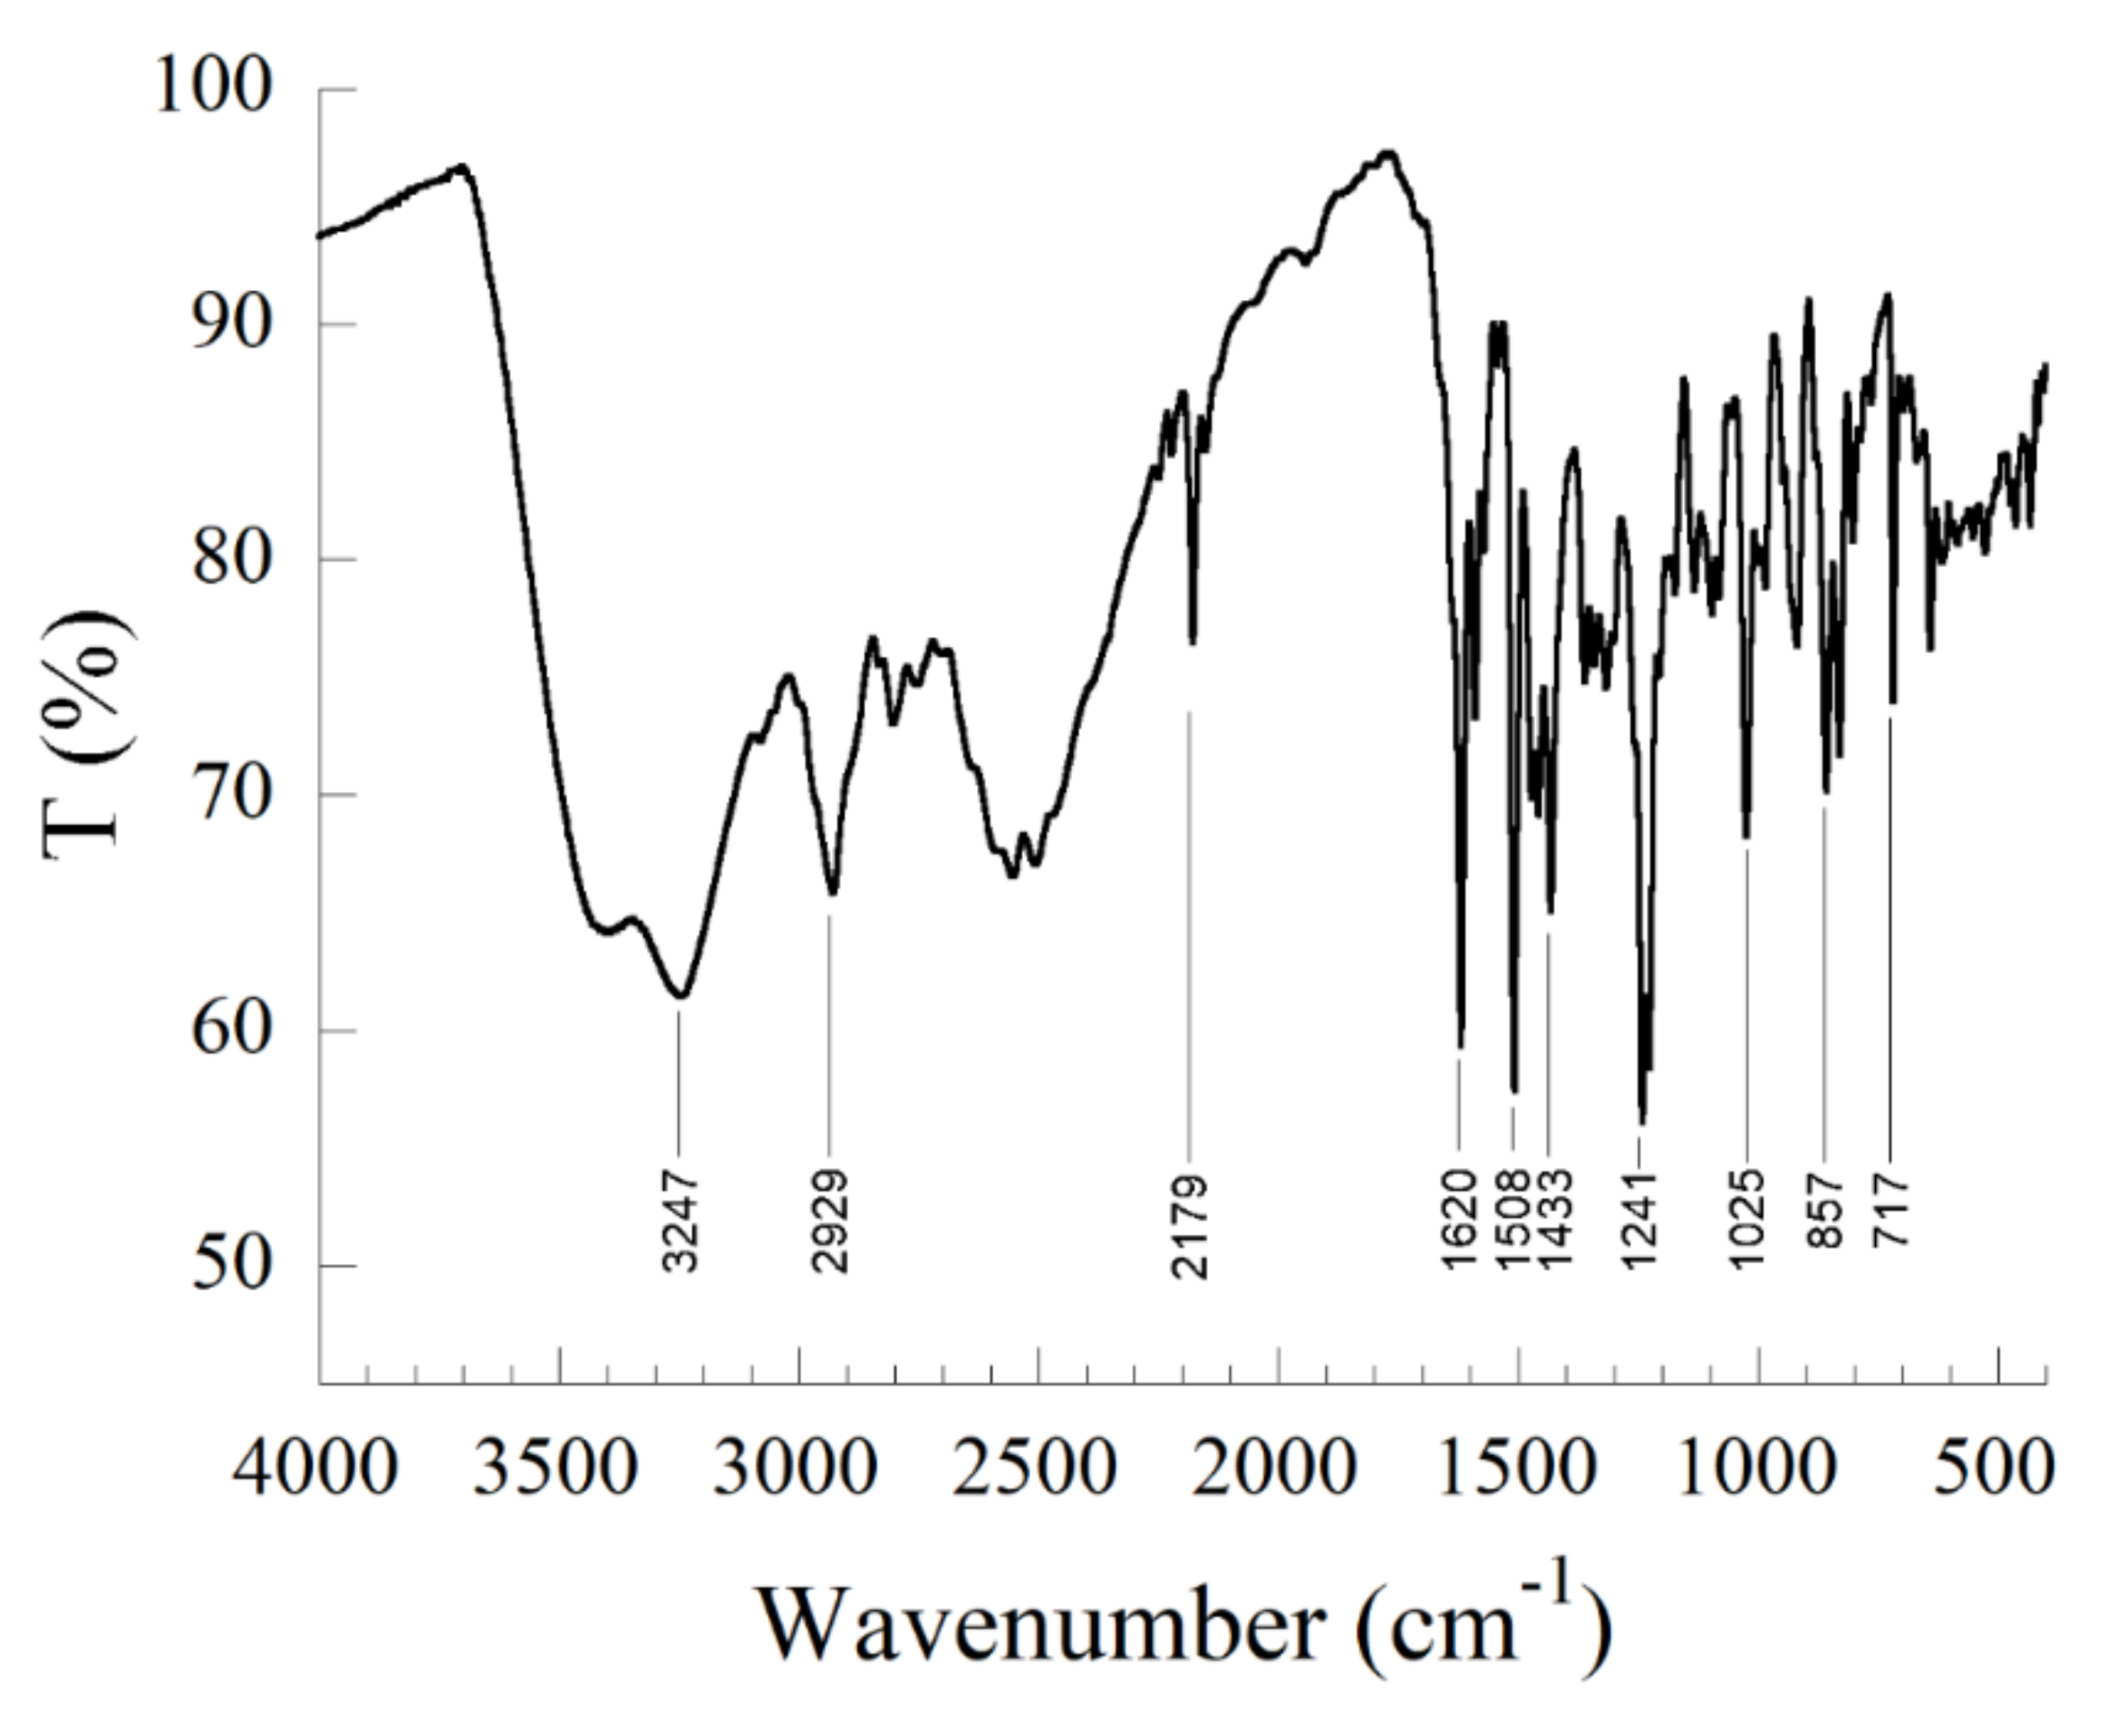
3.2.1. Infrared
3.2.2. NMR
1H NMR
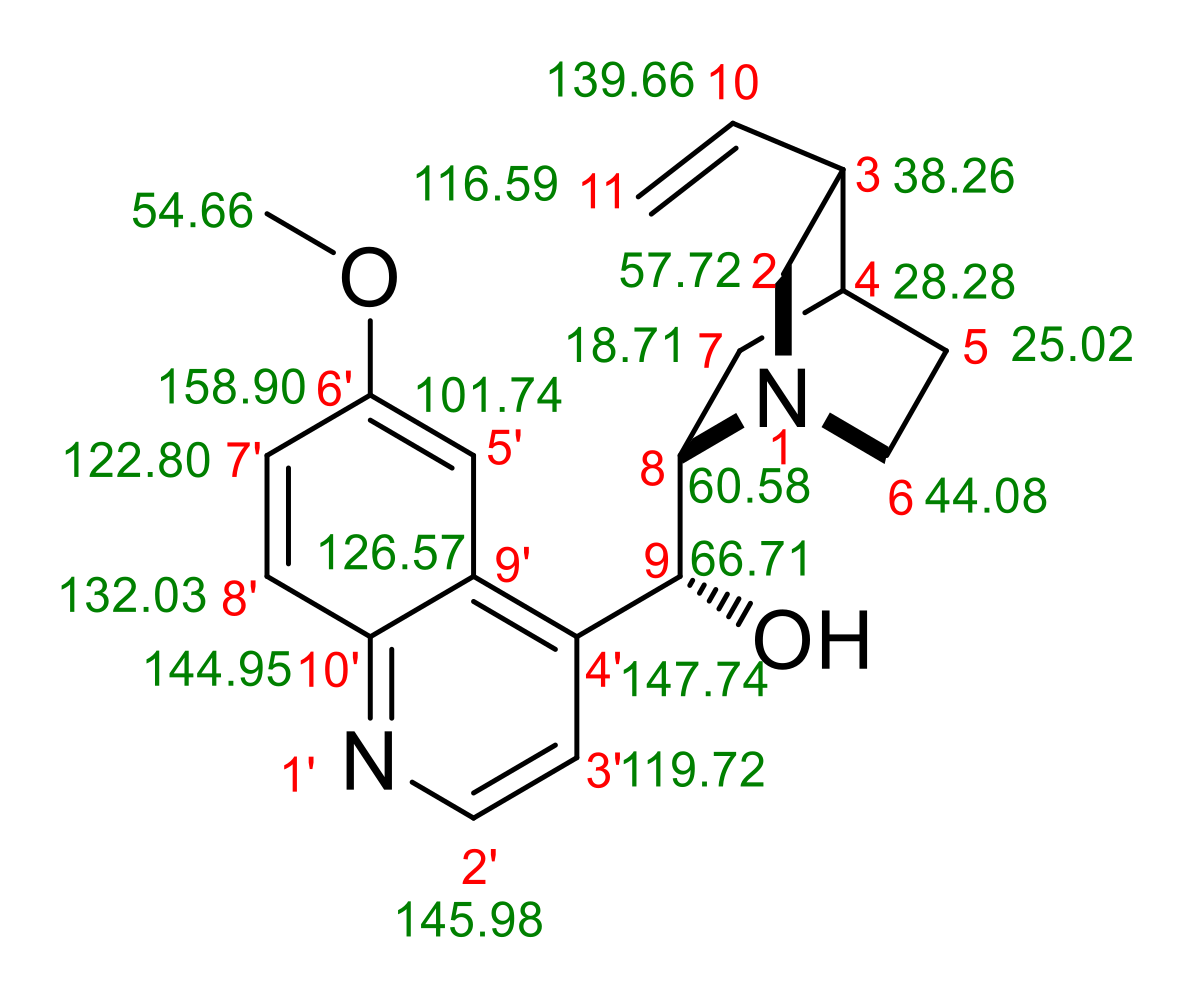
13C NMR
Mass Spectrometry
3.3. Computational Studies
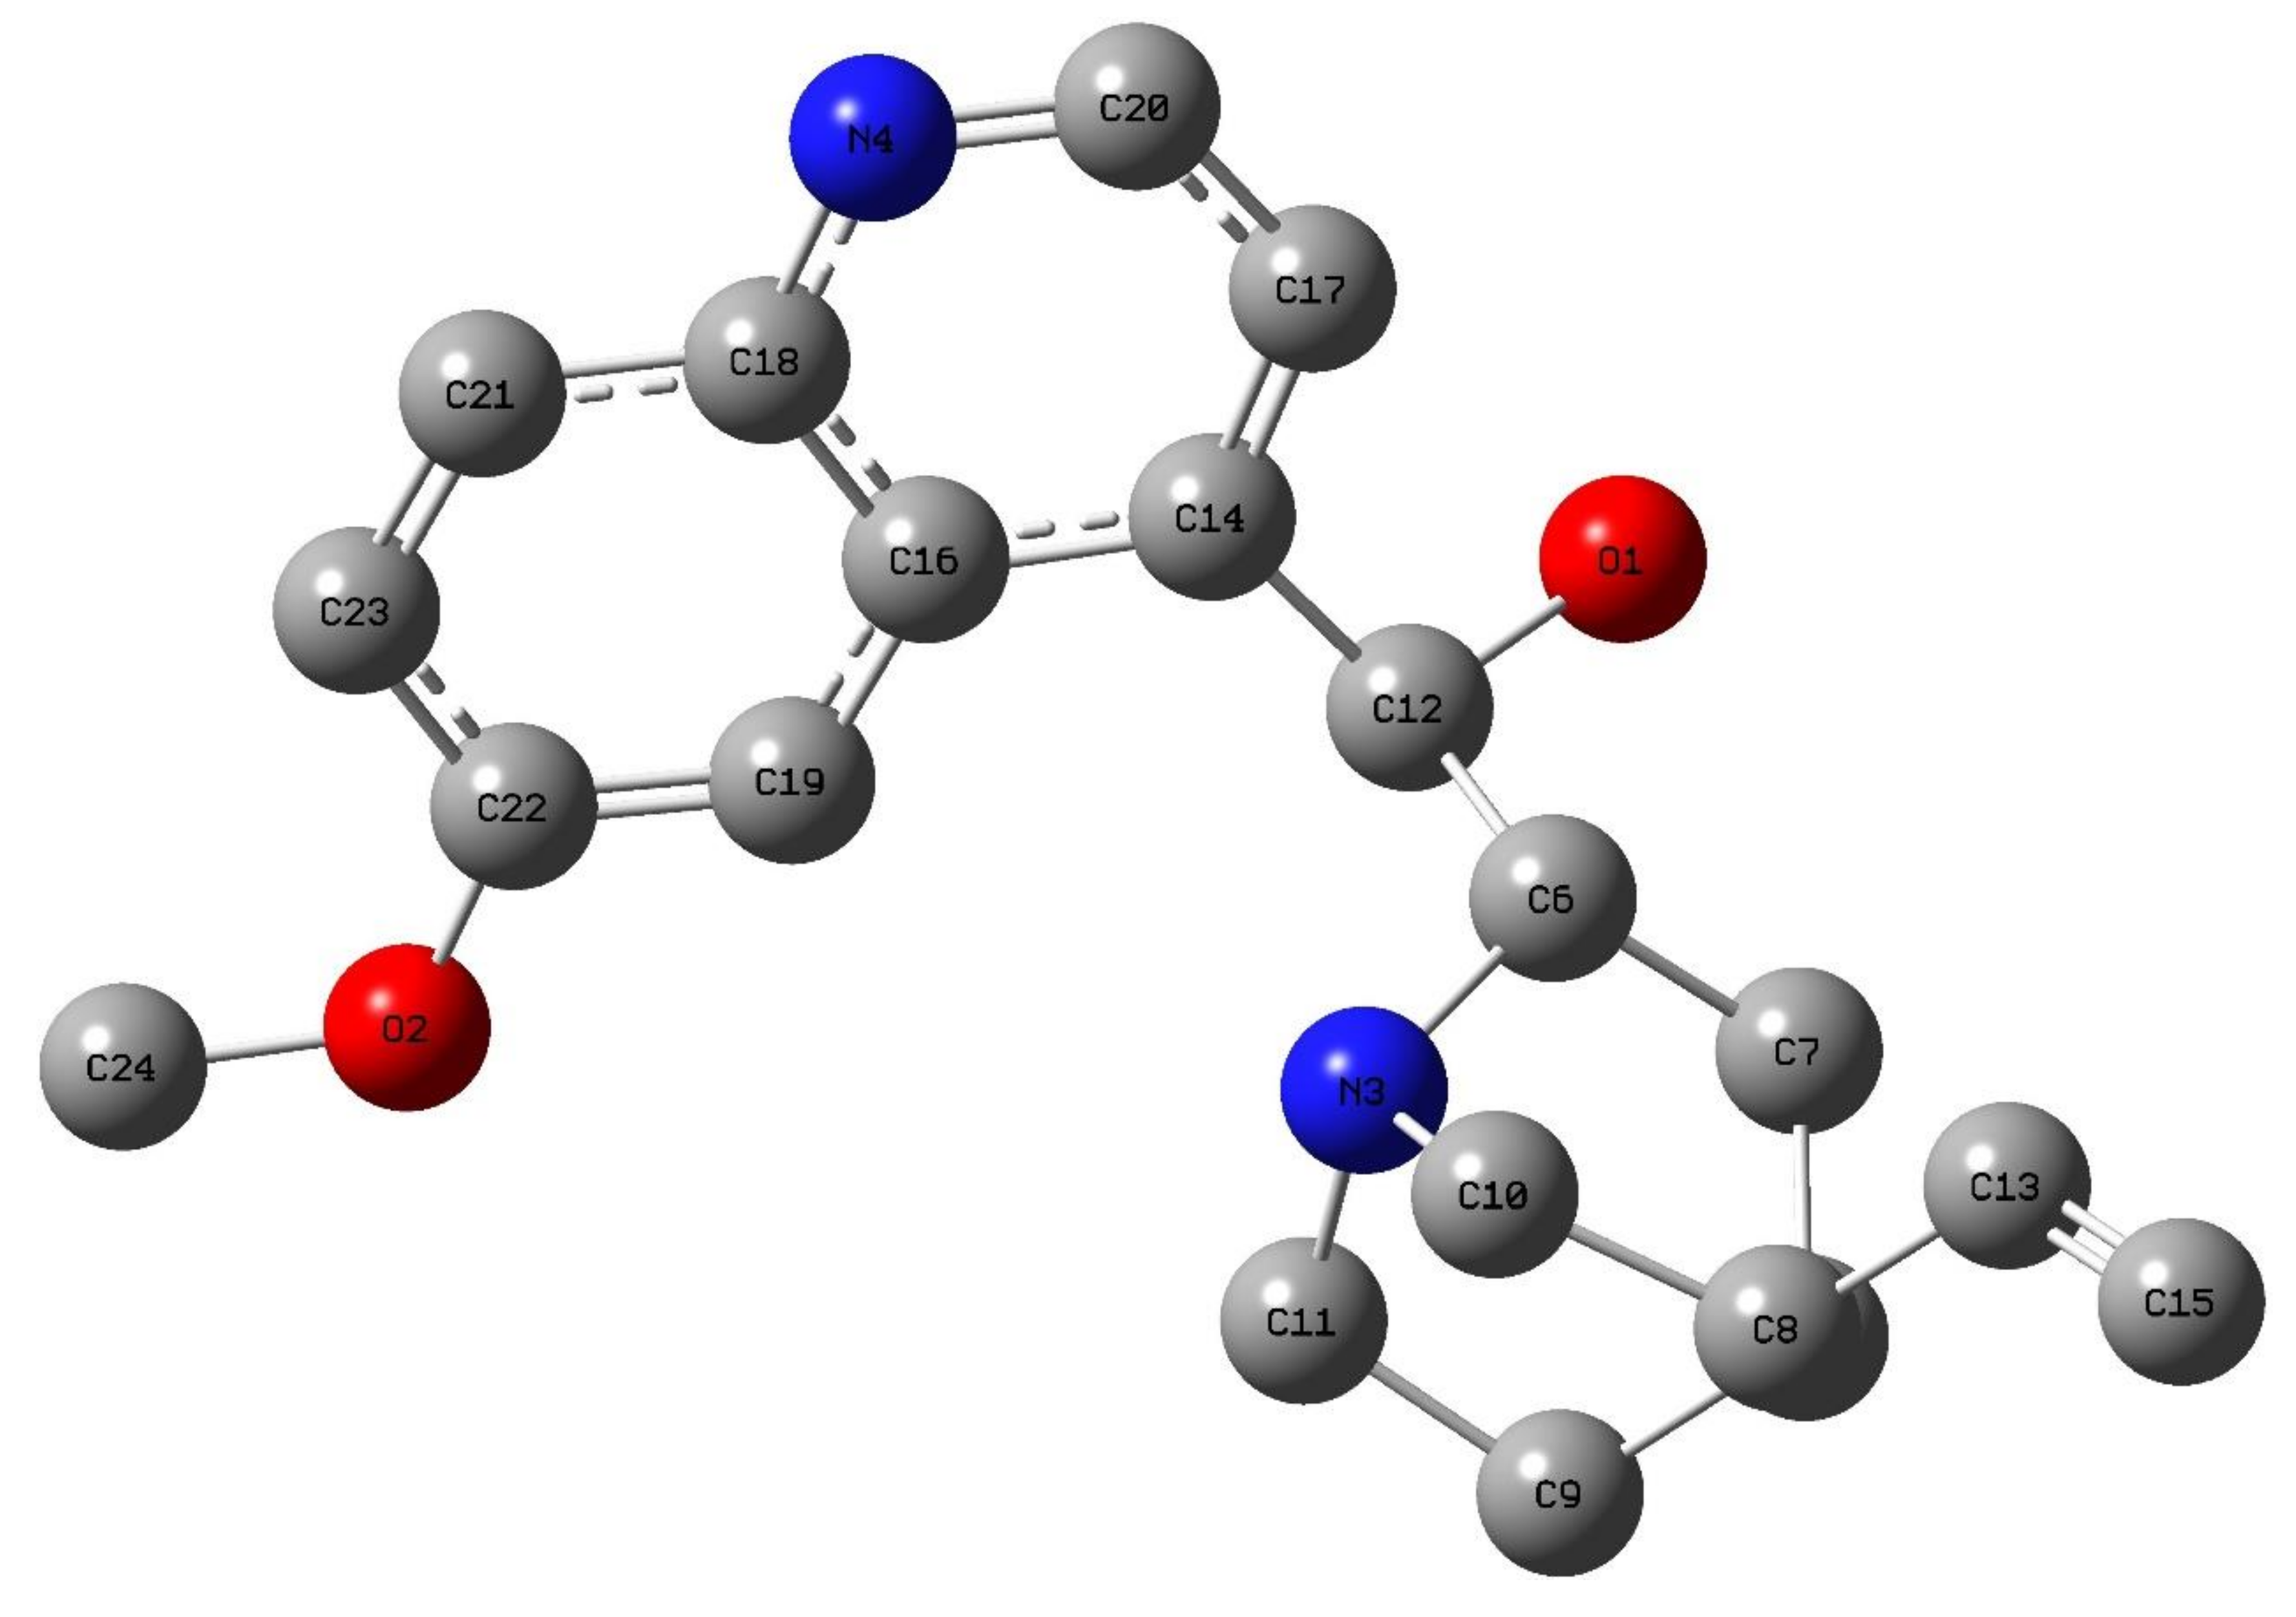
3.3.1. Geometry Optimization
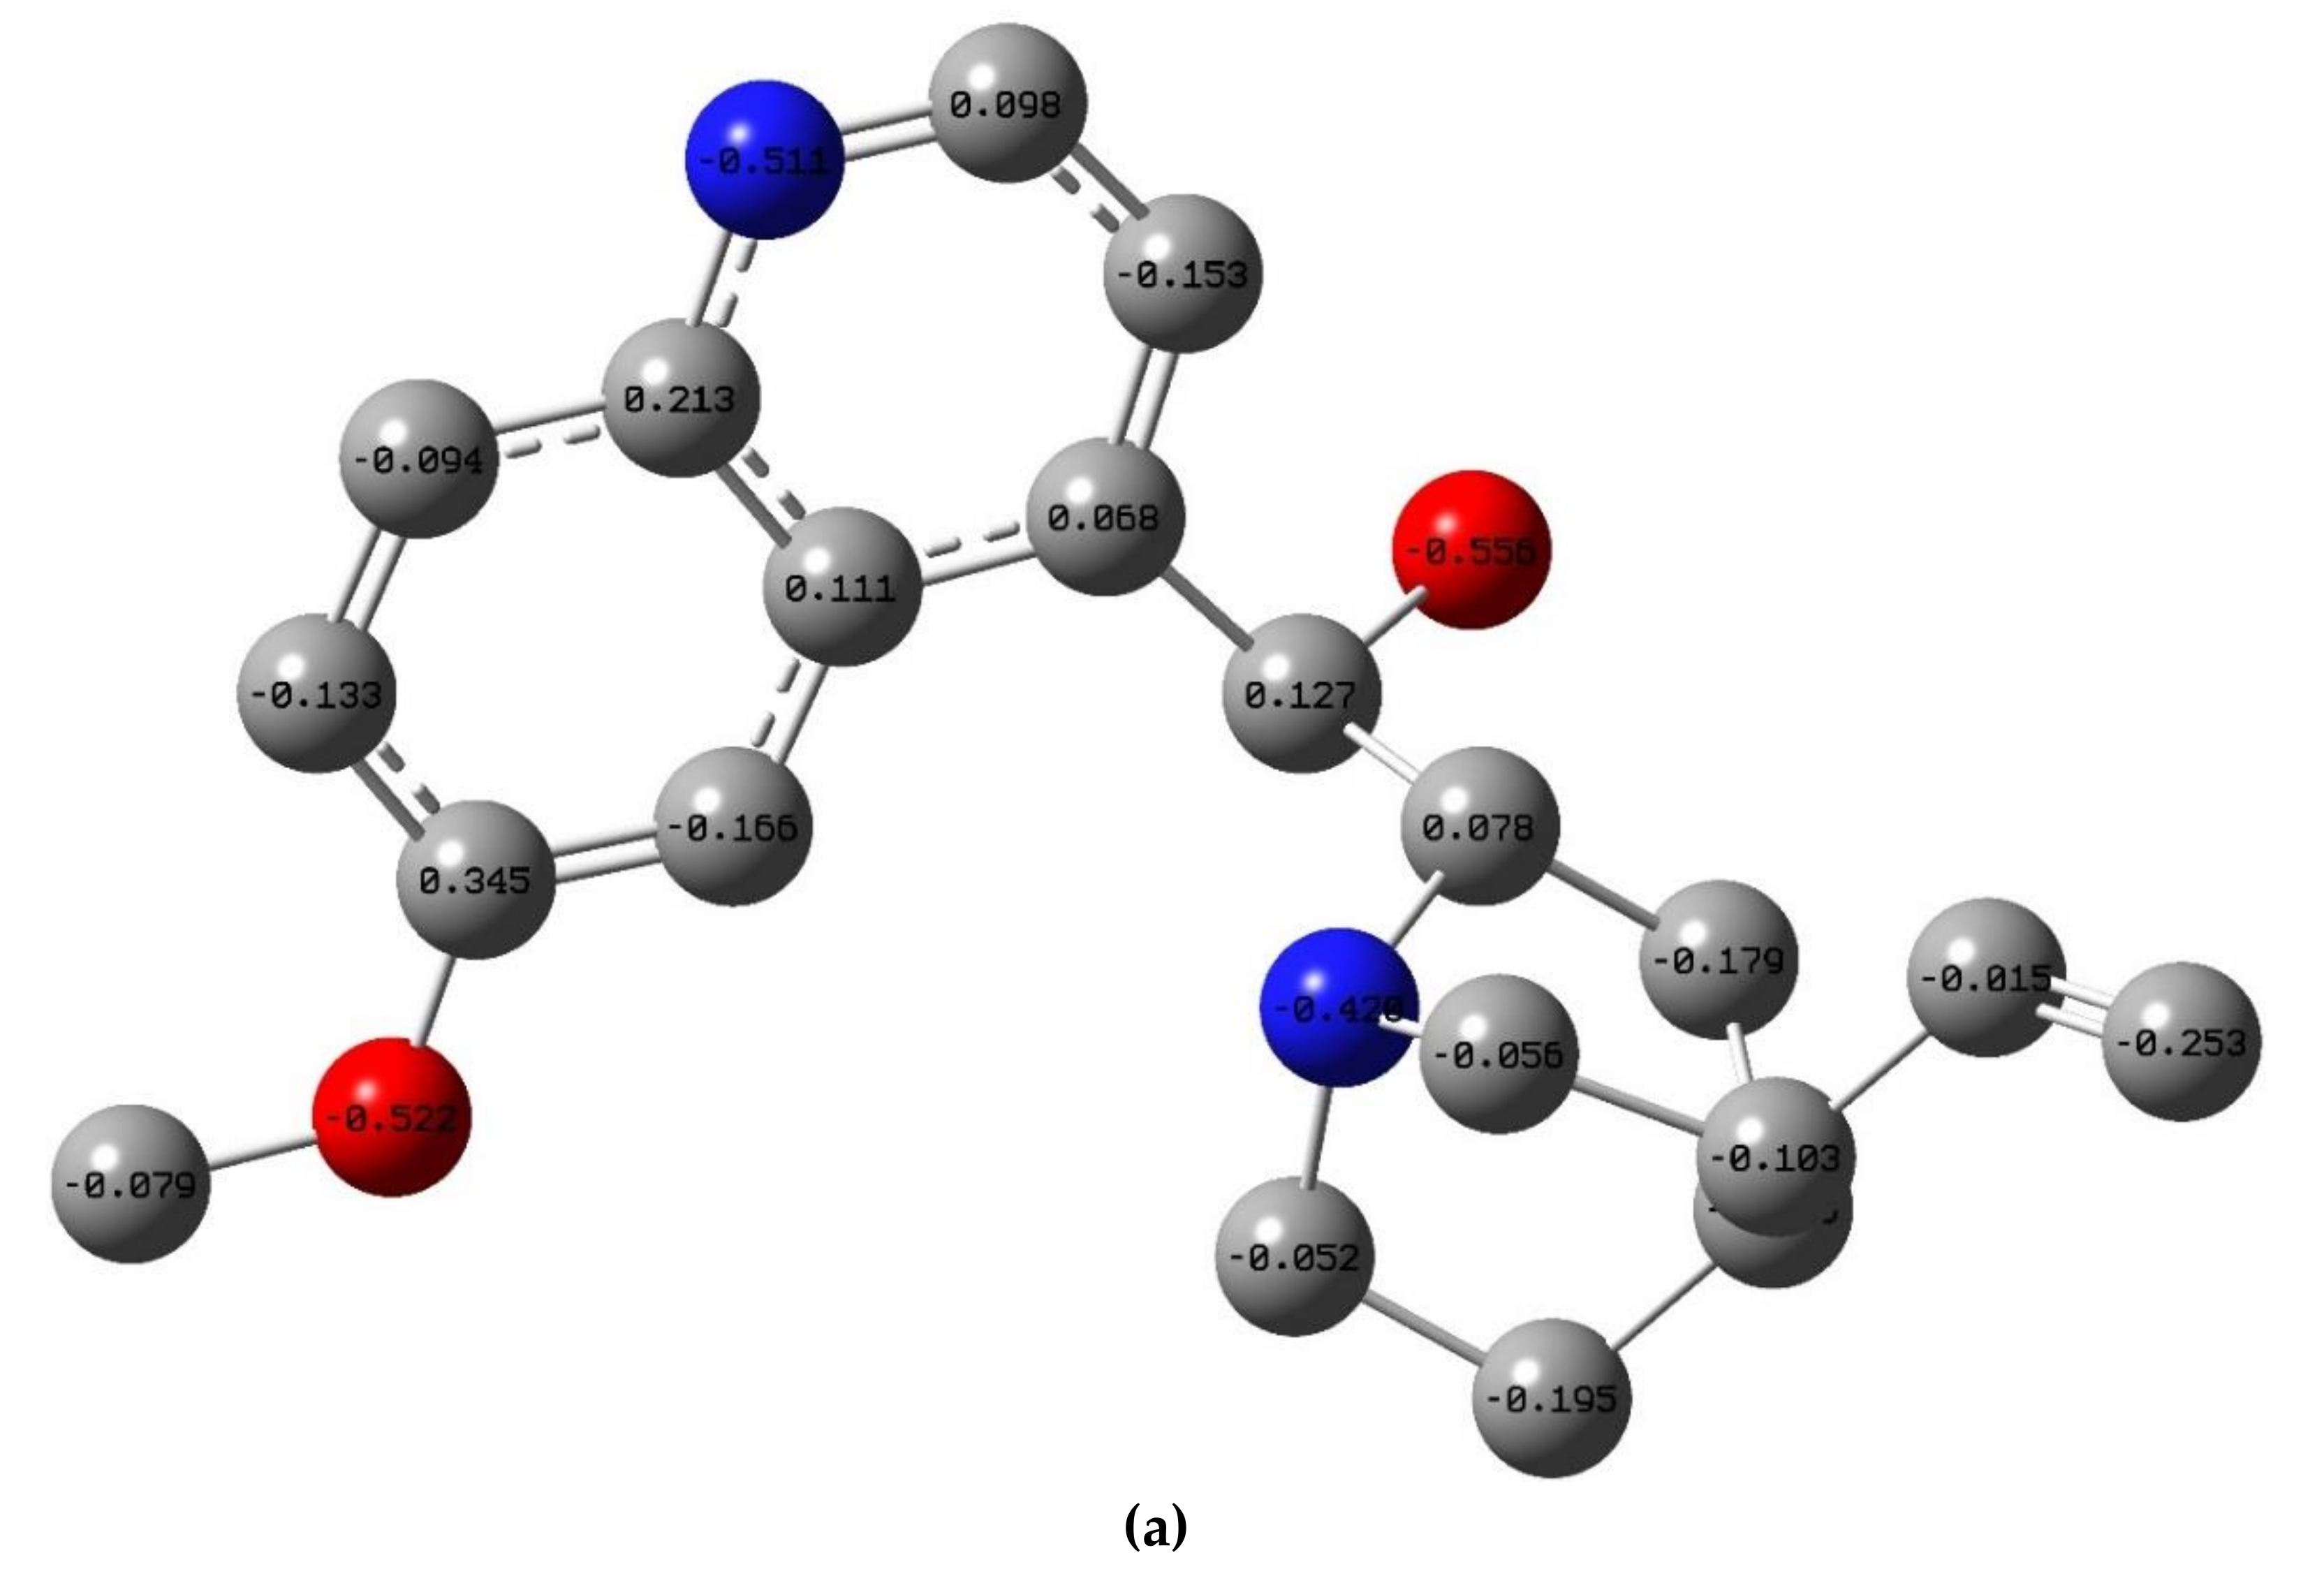
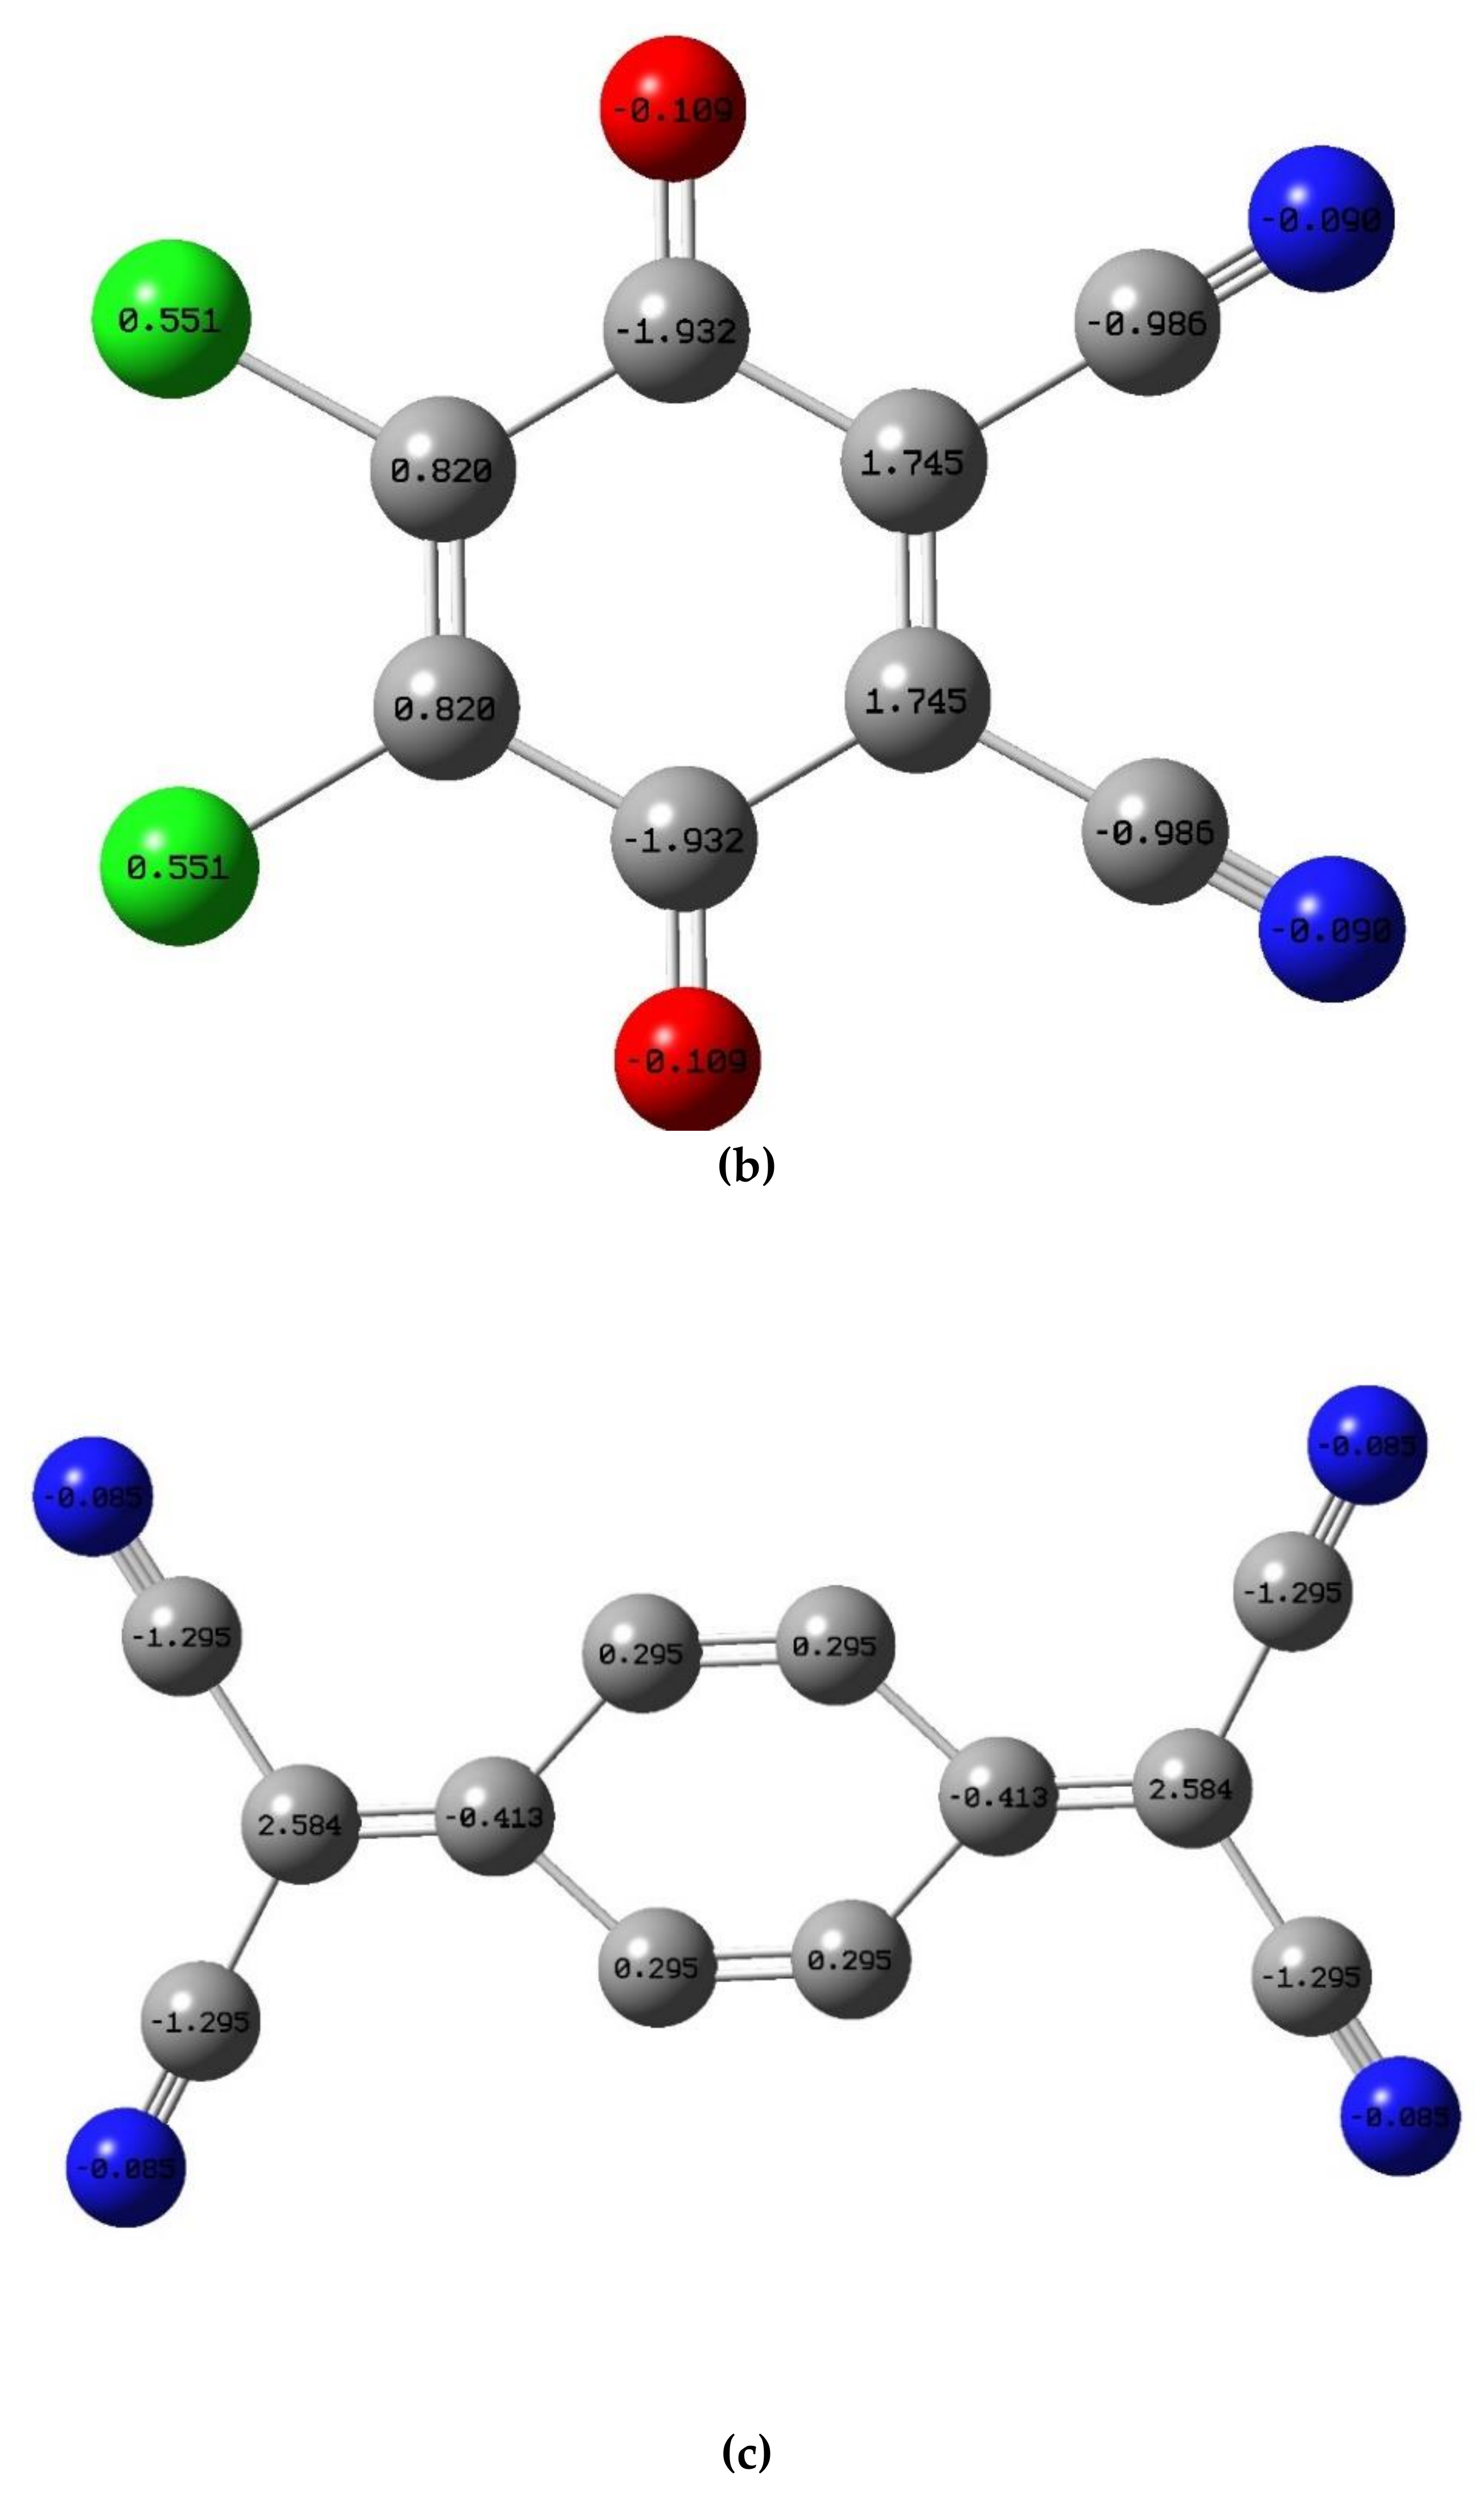
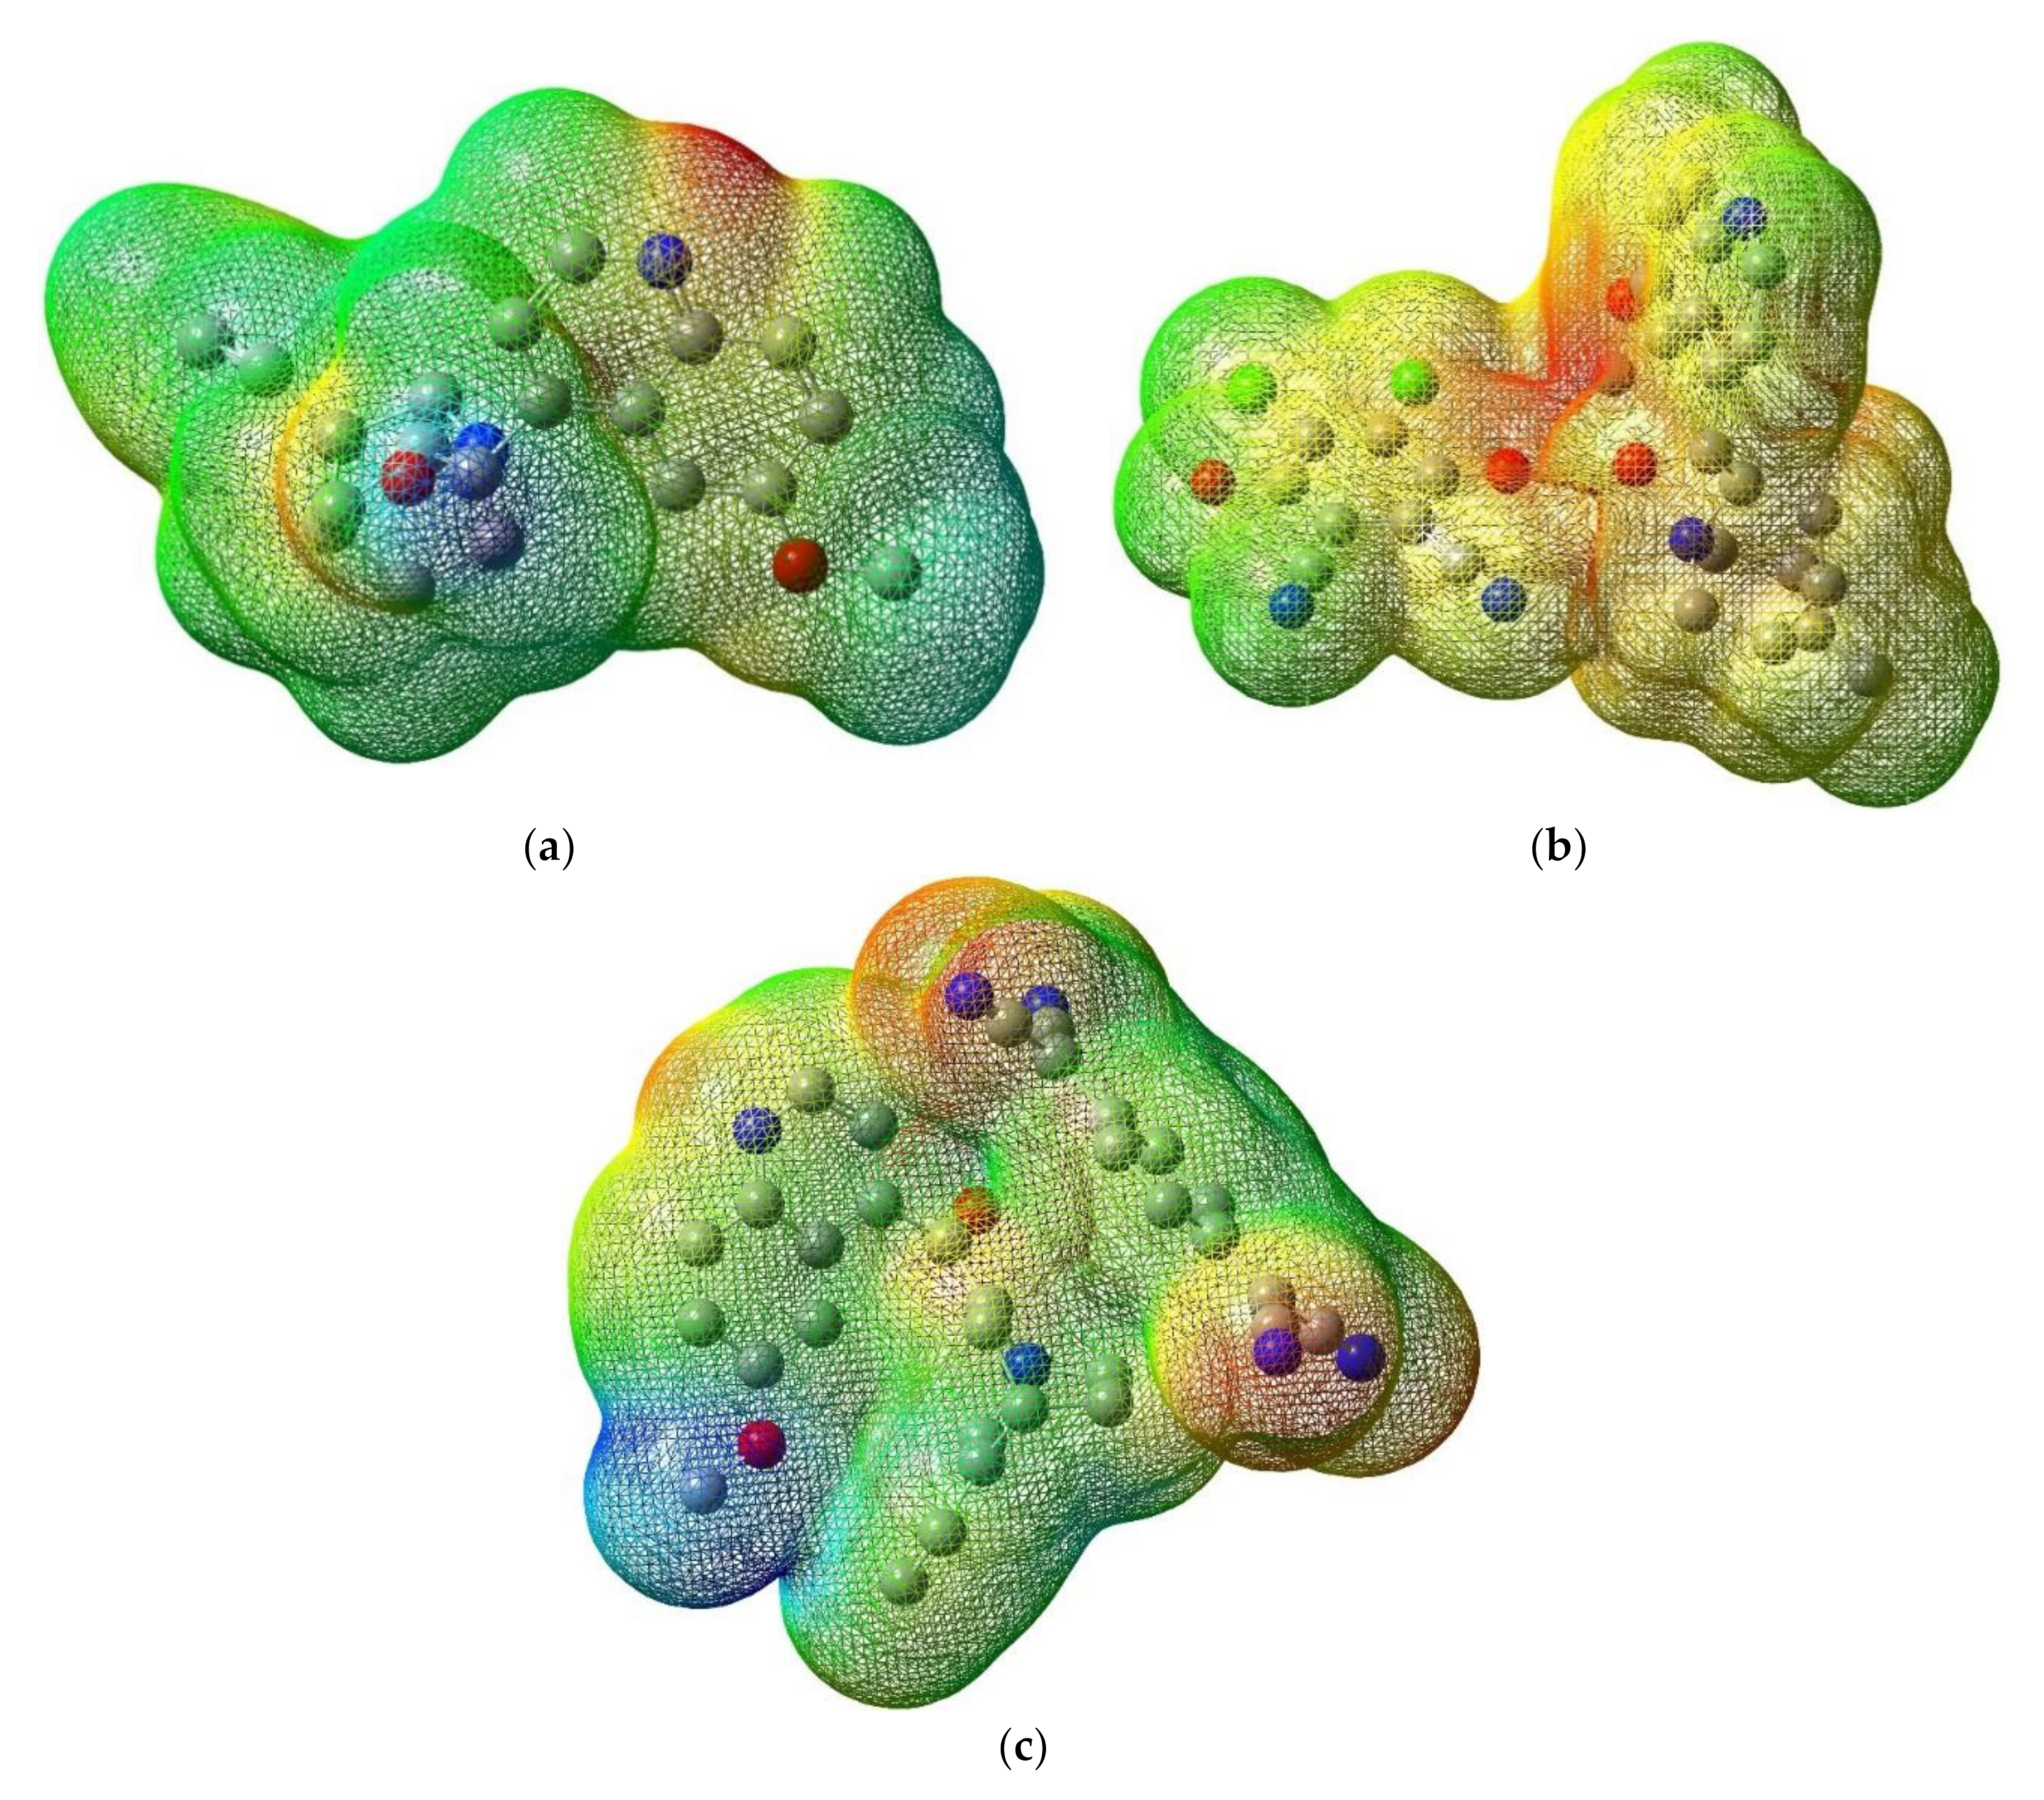
3.3.2. Molecular Electrostatic Potential
3.3.3. Vibrational Spectral Analysis
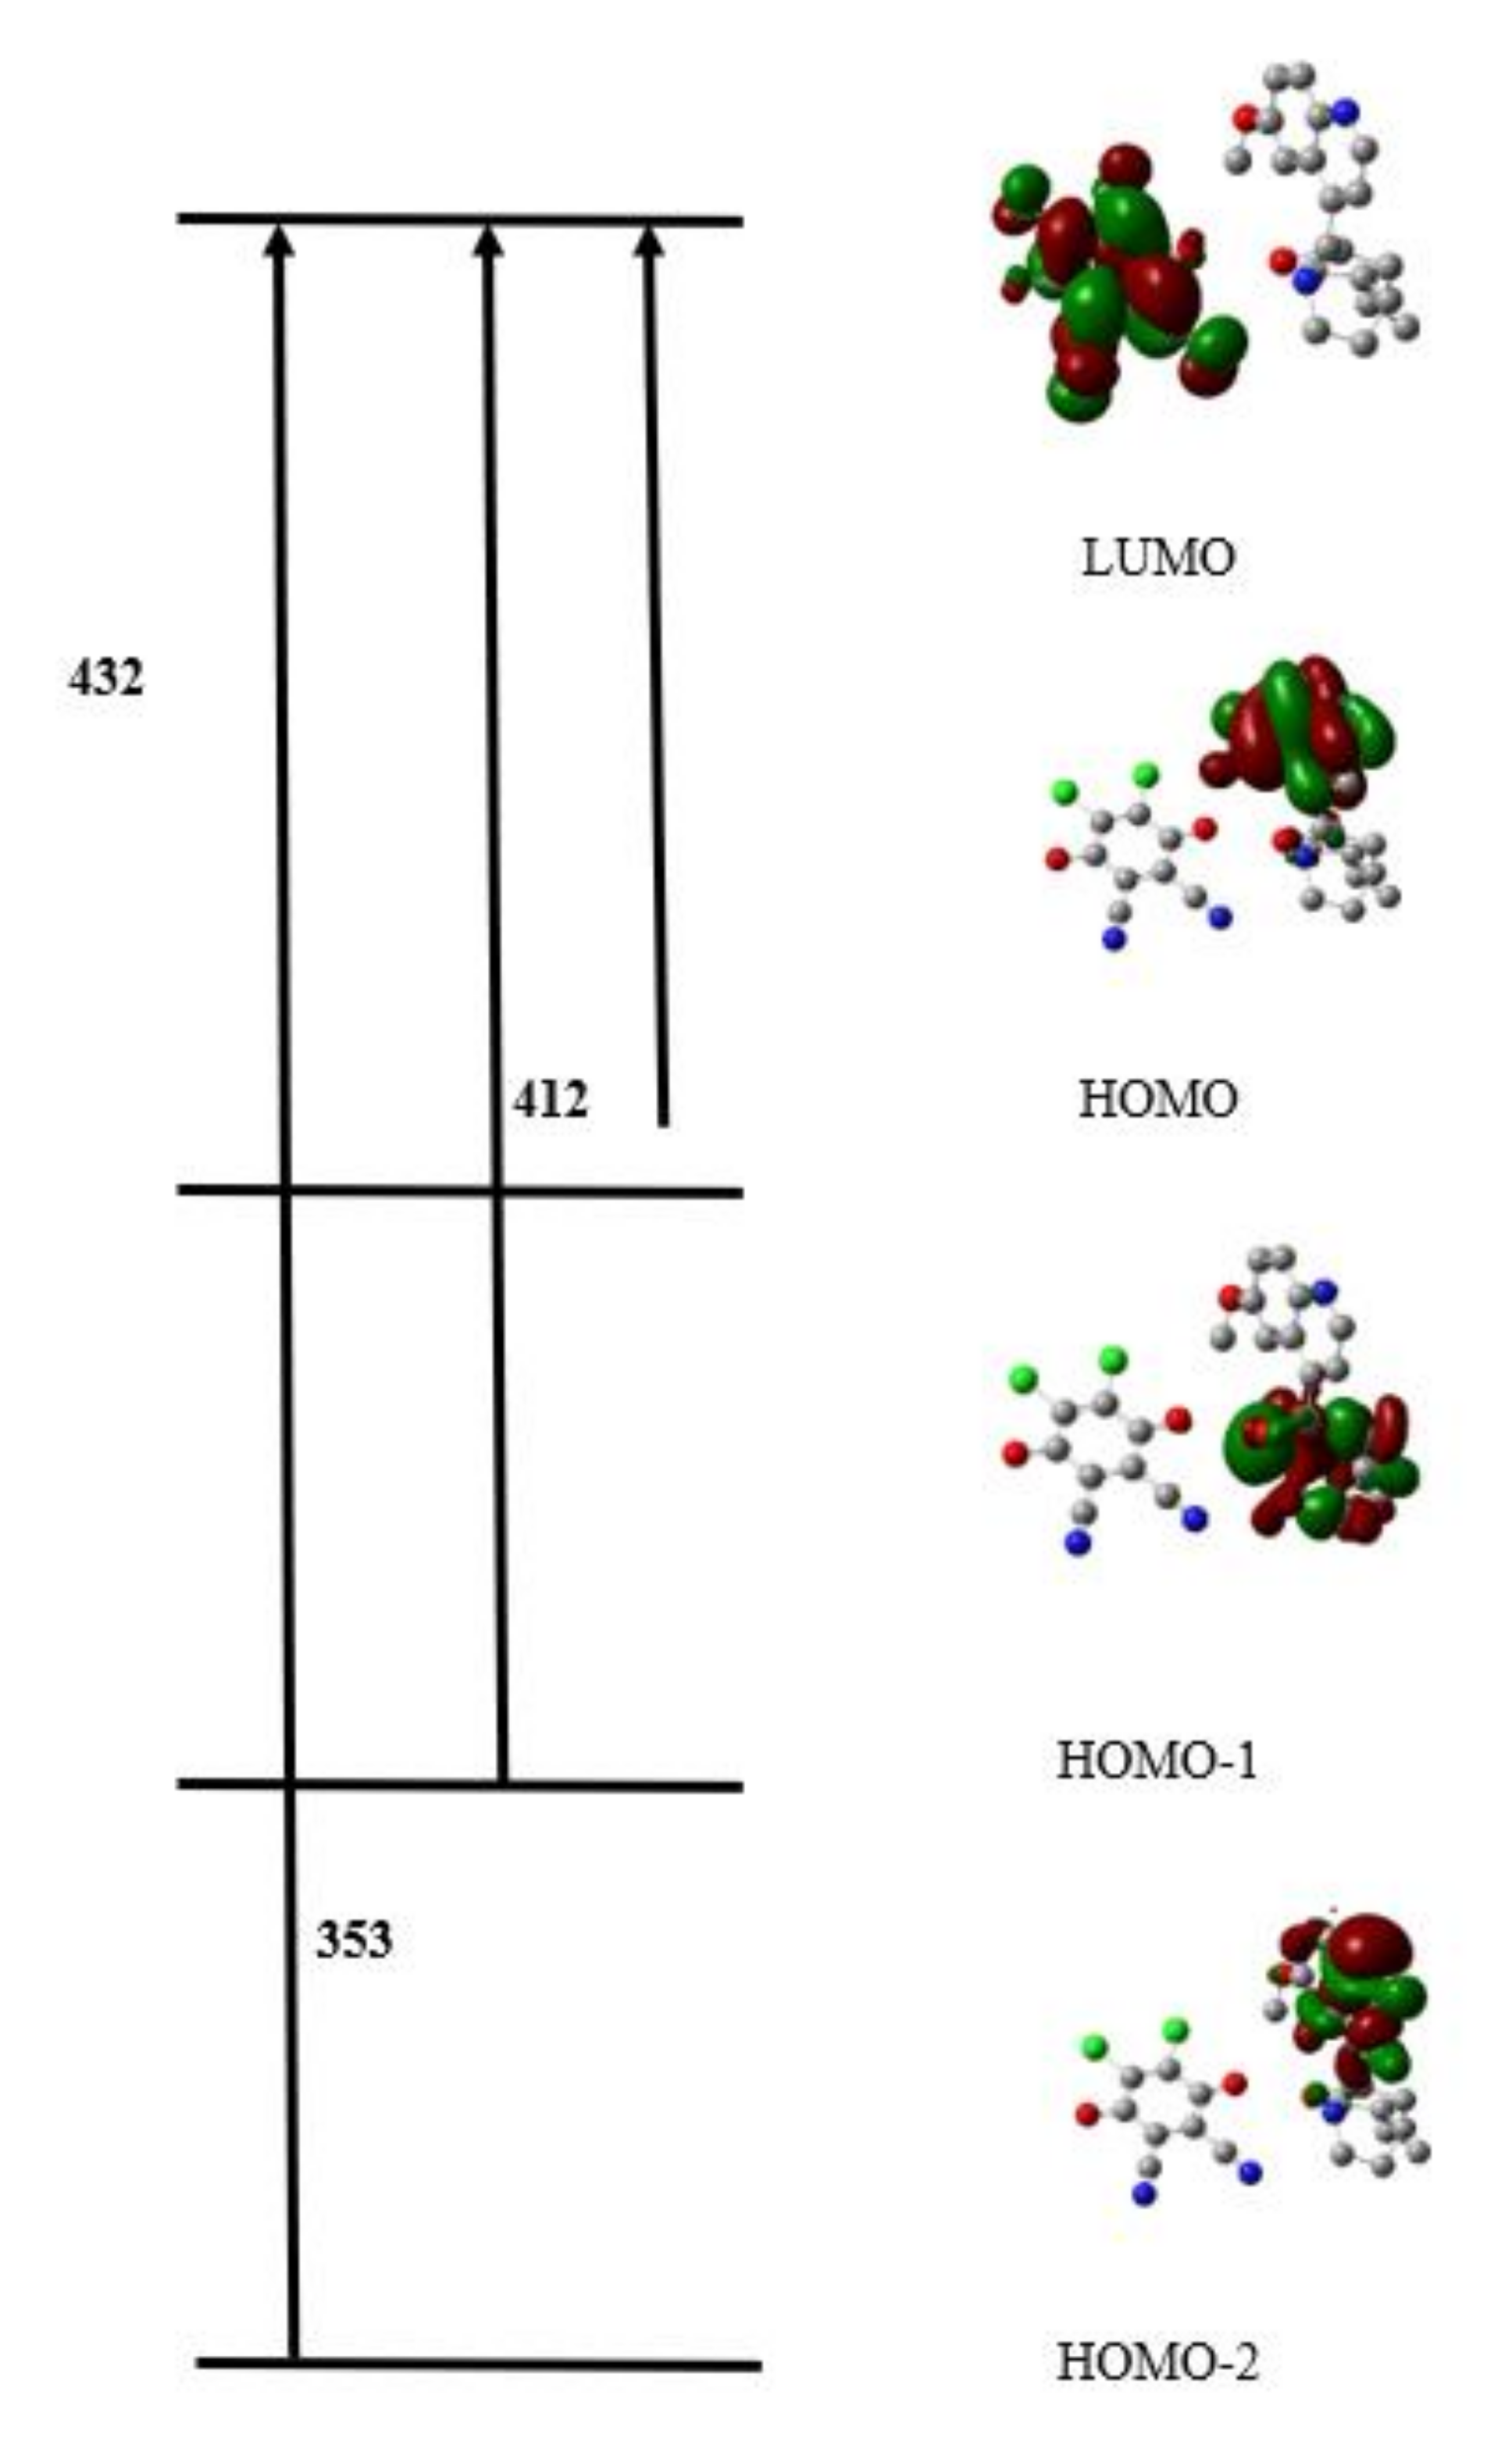
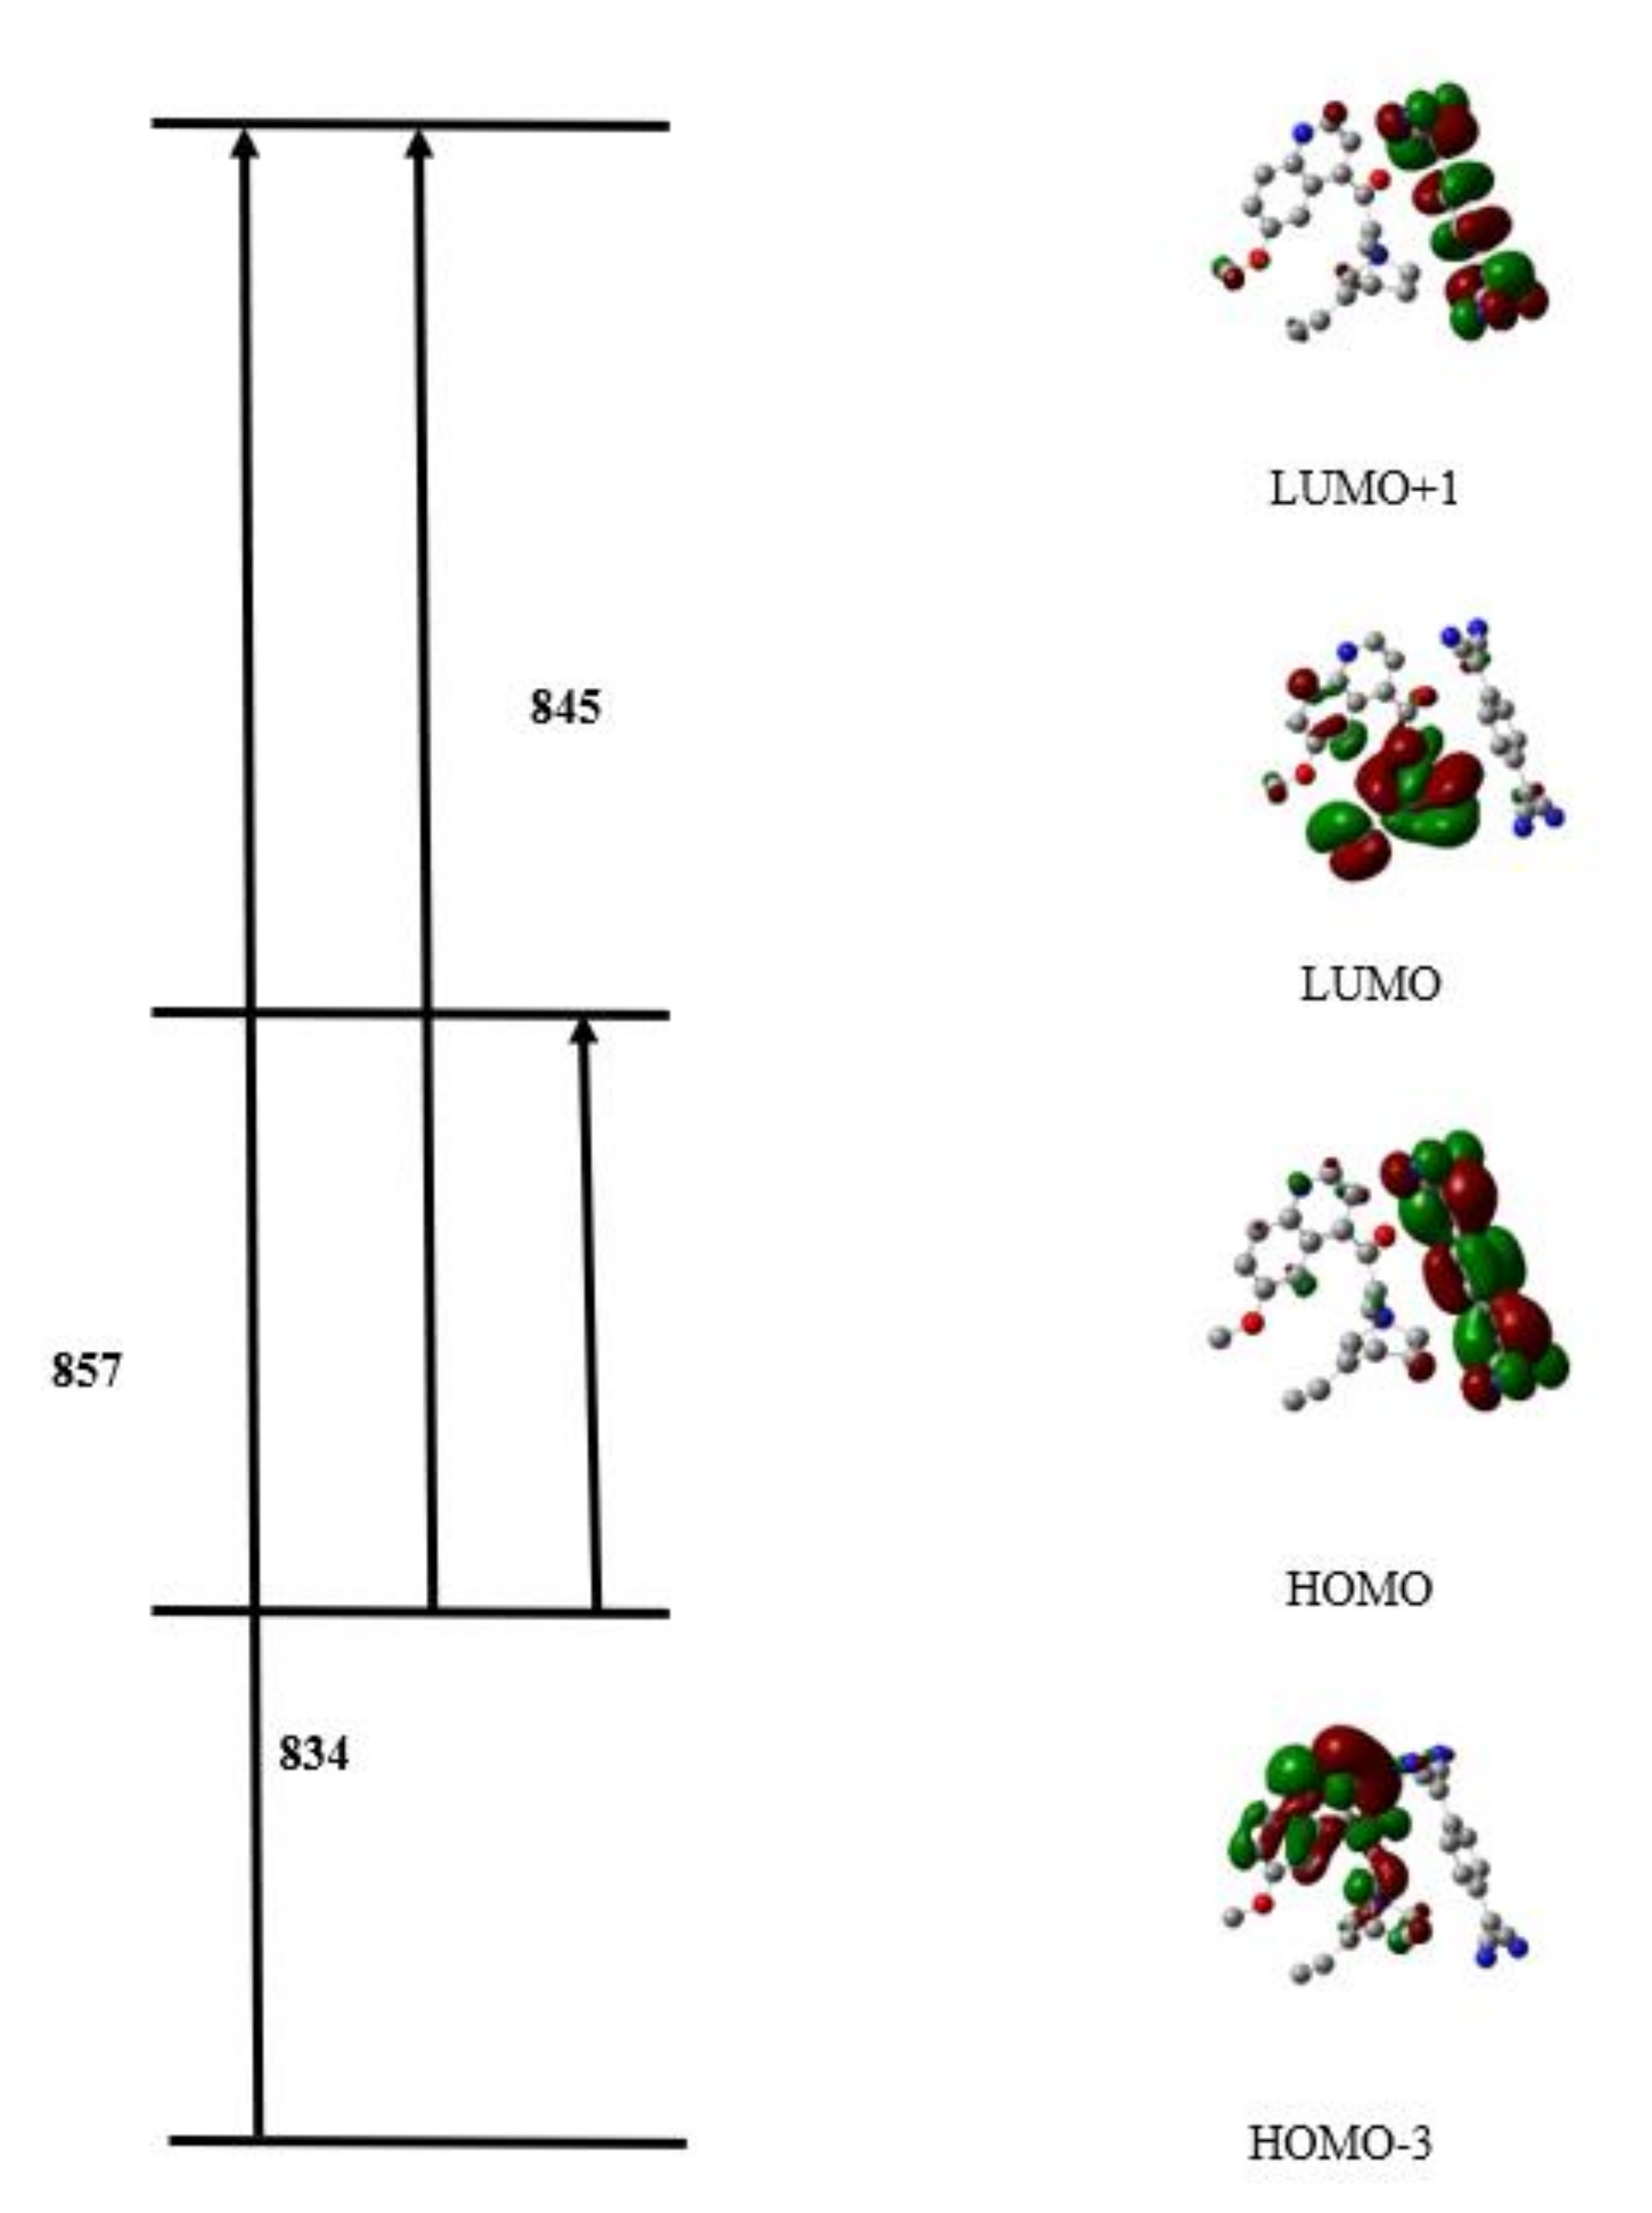
3.3.4. Quantum Chemical Parameters and Frontier Molecular Orbitals
3.3.5. Fukui Indices Analysis
4. Conclusions
Supplementary Materials
Author Contributions
Funding
Institutional Review Board Statement
Informed Consent Statement
Data Availability Statement
Acknowledgments
Conflicts of Interest
References
- Mulliken, R.S. Structures of Complexes Formed by Halogen Molecules with Aromatic and with Oxygenated Solvents1. J. Am. Chem. Soc. 1950, 72, 600–608. [Google Scholar] [CrossRef]
- Mulliken, R.S. Molecular Compounds and their Spectra. III. The Interaction of Electron Donors and Acceptors. J. Phys. Chem. 1952, 56, 801–822. [Google Scholar] [CrossRef]
- Refat, M.S.; El-Sayed, M.Y.; Adam, A.M.; Saad, H.A.; Eldaroti, H.H. Charge transfer complexes as a semiconductor models: Outline of spectroscopic studies on electron donor-acceptor complexes of hexane-1, 6-diol with different π-acceptors. Int. J. Electrochem. Sci. 2013, 8, 4234–4259. [Google Scholar]
- AlQaradawi, S.Y.; Mostafa, A.; Bengali, A.A. Charge-transfer complexes formed in the reaction of 2-amino-4-ethylpyridine with π-electron acceptors. J. Mol. Struct. 2016, 1106, 10–18. [Google Scholar] [CrossRef]
- Wu, L.; Wu, F.; Sun, Q.; Shi, J.; Xie, A.; Zhu, X.; Dong, W. A TTF–TCNQ complex: An organic charge-transfer system with extraordinary electromagnetic response behavior. J. Mater. Chem. C 2021, 9, 3316–3323. [Google Scholar] [CrossRef]
- Darwish, I.A.; Khalil, N.Y.; Alsaif, N.A.; Herqash, R.N.; Sayed, A.Y.; Abdel-Rahman, H.M. Charge-Transfer Complex of Linifanib with 2,3-dichloro-3,5-dicyano-1,4-benzoquinone: Synthesis, Spectroscopic Characterization, Computational Molecular Modelling and Application in the Development of Novel 96-microwell Spectrophotometric Assay. Drug Des. Dev. Ther. 2021, ume 15, 1167–1180. [Google Scholar] [CrossRef]
- Adam, A.M.A.; Refat, M.S. A comparison of charge-transfer complexes of iodine with some antibiotics formed through two different approaches (liquid-liquid vs solid-solid). J. Mol. Liq. 2021, 329, 115560. [Google Scholar] [CrossRef]
- Spectroscopy and Structure of Molecular Complexes; Yarwood, J. (Ed.) Springer: Boston, MA, USA, 1973; pp. 1–594. [Google Scholar]
- Basha, M.T.; Alghanmi, R.M.; Soliman, S.M.; Alharby, W.J. Synthesis, spectroscopic, thermal, structural characterization and DFT/TD-DFT computational studies for charge transfer complexes of 2, 4-diamino pyrimidine with some benzoquinone acceptors. J. Mol. Liq. 2020, 309, 113210. [Google Scholar] [CrossRef]
- Soltani, S.; Magri, P.; Rogalski, M.; Kadri, M. Charge-transfer complexes of hypoglycemic sulfonamide with π-acceptors: Experimental and DFT-TDDFT studies. J. Mol. Struct. 2018, 1175, 105–116. [Google Scholar] [CrossRef]
- Abdallah, A.M.; Frag, E.Y.; Tamam, R.H.; Mohamed, G.G. Gliclazide charge transfer complexes with some ben-zoquinone acceptors: Synthesis, structural characterization, thermal analyses, DFT studies, evaluation of anticancer ac-tivity and utility for determination of gliclazide in pure and dosage forms. J. Mol. Struct. 2021, 1234, 130153. [Google Scholar] [CrossRef]
- Madrahimov, S.; Mostafa, A.; Yempally, V.; Fadlallah, J.; AlQaradawi, S.Y. Electronic, infrared, mass spectrometry and thermal studies on the reaction of 2-amino-6-methylpyridine with π-acceptors. J. Mol. Struct. 2020, 1199, 127021. [Google Scholar] [CrossRef]
- Mohamed, M.E.; Frag, E.Y.; Hathoot, A.A.; Shalaby, E.A. Spectrophotometric determination of fenoprofen calcium drug in pure and pharmaceutical preparations. Spectroscopic characterization of the charge transfer solid complexes. Spectrochim. Acta Part A Mol. Biomol. Spectrosc. 2018, 189, 357–365. [Google Scholar] [CrossRef] [PubMed]
- Alam, K.; Khan, I.M. Crystallographic, dynamic and Hirshfeld surface studies of charge transfer complex of imidazole as a donor with 3,5-dinitrobenzoic acid as an acceptor: Determination of various physical parameters. Org. Electron. 2018, 63, 7–22. [Google Scholar] [CrossRef]
- Takahashi, K.; Horino, K.; Komura, T.; Murata, K. Photovoltaic Properties of Porphyrin Thin Films Mixed with o-Chloranil. Bull. Chem. Soc. Jpn. 1993, 66, 733–738. [Google Scholar] [CrossRef]
- Datta, A.S.; Chattaraj, S.B.; Chakrabortty, A.; Lahiri, S.C. Studies on the weak interactions and CT complex formations between chloranilic acid, 2,3-dichloro-5,6-dicyano-p-benzoquinone, tetracyanoethylene and papaverine in acetonitrile and their thermodynamic properties, theoretically, spectrophotometrically aided by FTIR. Spectrochim. Acta Part A Mol. Biomol. Spectrosc. 2015, 146, 119–128. [Google Scholar] [CrossRef]
- Khan, I.M.; Alam, K.; Alam, M.J. Exploring charge transfer dynamics and photocatalytic behavior of designed donor-acceptor complex: Characterization, spectrophotometric and theoretical studies (DFT/TD-DFT). J. Mol. Liqu. 2020, 310, 113213. [Google Scholar] [CrossRef]
- Adam, A.M.; Saad, H.A.; Alsuhaibani, A.M.; Refat, M.S.; Hegab, M.S. Charge-transfer chemistry of azithromycin, the antibiotic used worldwide to treat the coronavirus disease (COVID-19). Part II: Complexation with several π-acceptors (PA, CLA, CHL). J. Mol. Liqu. 2021, 325, 115121. [Google Scholar] [CrossRef]
- Adam, A.M.A.; Eldaroti, H.H.; Hegab, M.S.; Refat, M.S.; Al-Humaidi, J.Y.; Saad, H.A. Measurements and correlations in solution-state for charge transfer products caused from the 1:2 complexation of TCNE acceptor with several important drugs. Spectrochim. Acta Part A Mol. Biomol. Spectrosc. 2018, 211, 166–177. [Google Scholar] [CrossRef]
- Gross, E.K.; Dobson, J.F.; Petersilka, M. Density functional theory of time-dependent phenomena. In Density Functional Theory II; Springer: Berlin/Heidelberg, Germany, 1996; pp. 81–172. [Google Scholar]
- Job, P. Advanced physicochemical experiments. Edinburgh: Oliner and Boyd. Ann. Chem. 1964, 1963, 97. [Google Scholar]
- Foster, R. Organic Charge-Transfer Complexes; Academic Press: London, UK, 1969; pp. 51–387. [Google Scholar]
- Benesi, H.A.; Hildebrand, J.H.J. A spectrophotometric investigation of the interaction of iodine with aromatic hydro-carbons. J. Am. Chem. Soc. 1949, 71, 2703–2707. [Google Scholar] [CrossRef]
- Aloisi, G.G.; Pignataro, S. Molecular complexes of substituted thiophens with σ and π acceptors. Charge transfer spectra and ionization potentials of the donors. J. Chem. Soc. 1973, 69, 534–539. [Google Scholar] [CrossRef]
- Briegleb, G.; Czekalla, J. Electron transfer by light absorption and emission in electron donor-acceptor complexes. Angew. Chem. 1960, 72, 401–413. [Google Scholar] [CrossRef]
- Bürgi, T.; Baiker, A. Conformational Behavior of Cinchonidine in Different Solvents: A Combined NMR and ab Initio Investigation. J. Am. Chem. Soc. 1998, 120, 12920–12926. [Google Scholar] [CrossRef]
- Sen, A.; Bouchet, A.; Lepère, V.; Barbu-Debus, K.; Scuderi, D.; Piuzzi, F.; Zehnacker-Rentien, A. Conformational Analysis of Quinine and Its Pseudo Enantiomer Quinidine: A Combined Jet-Cooled Spectroscopy and Vibrational Circular Di-chroism Study. J. Phys. Chem. A 2012, 116, 8334–8344. [Google Scholar] [CrossRef]
- Casida, M.E. Recent Advances in Density Functional Methods. In Time-Dependent Density Functional Response Theory for Molecules, Part I; Chong, D.P., Ed.; World Scientific: Singapore, 1995; pp. 155–192. [Google Scholar]
- Yousef, T.A.; Ezzeldin, E.; Abdel-Aziz, H.A.; Al-Agamy, M.H.; Mostafa, G.A. Charge Transfer Complex of Neostigmine with 2,3-Dichloro-5,6-Dicyano-1,4-Benzoquinone: Synthesis, Spectroscopic Characterization, Antimicrobial Activity, and Theoretical Study. Drug Des. Dev. Ther. 2020, ume 14, 4115–4129. [Google Scholar] [CrossRef]

| Ca, M | Cd, M | A, Absorbance | (Cd*Ca)/A | Cd + Ca |
|---|---|---|---|---|
| (Q-DDQ) | ||||
| 0.000441 | 0.000277 | 0.038 | 3.21221 × 10⁻⁶ 3.2 × 10⁻⁶ | 0.000718 |
| 0.000441 | 0.000554 | 0.068 | 3.58902 × 10⁻⁶ 3.5 × 10⁻⁶ | 0.000995 |
| 0.000441 | 0.001108 | 0.145 | 3.36625 × 10⁻⁶ 3.5 × 10⁻⁶ | 0.001549 |
| 0.000441 | 0.002217 | 0.259 | 3.77086 × 10⁻⁶ 3.77 × 10⁻⁶ | 0.002658 |
| 0.000441 | 0.003325 | 0.357 | 4.10297 × 10⁻⁶ 4.1 × 10⁻⁶ | 0.003766 |
| 0.000441 | 0.004433 | 0.418 | 4.67231 × 10⁻⁶ 4.67 × 10⁻⁶ | 0.004874 |
| (Q-TCNQ) | ||||
| 0.00049 | 0.0000277 | 0.031 | 4.37741 × 10⁻⁶ 4.377 × 10⁻⁶ | 0.000767 |
| 0.00049 | 0.000554 | 0.047 | 5.77445 × 10⁻⁶ 5.77 × 10⁻⁶ | 0.001044 |
| 0.00049 | 0.001108 | 0.063 | 8.61585 × 10⁻⁶ 8.61 × 10⁻⁶ | 0.001598 |
| 0.00049 | 0.002217 | 0.09 | 1.20622 × 10⁻⁶ 1.2 × 10⁻⁵ | 0.002706 |
| 0.00049 | 0.002771 | 0.11 | 1.23363 × 10⁻⁶ 1.233 × 10⁻⁵ | 0.003261 |
| Parameters | Q-DDQ | Q-TCNQ |
|---|---|---|
| Wavelength, nm | 480 | 843 |
| Molar extension (ε), mol L−1 Cm−1 | 0.33 × 10³ | 0.3 × 10³ |
| Formation constant (K), L mol−1 | 0.1 × 10³ | 1.6 × 10³ |
| Oscillator strength (f) | 0.989 | 0.163 |
| Transition dipole moment (μ, Debye) | 10.09 | 5.41 |
| Energy: hv (ev) | 2.56 | 1.47 |
| Ionization potential: Ip(ev) | 8.91 | 7.57 |
| Resonance energy: RN(ev) | 0.112 | 0.194 |
| Dissociation energy: W(ev) | 4.45 | 3.3 |
| Gibbs free energy: ΔG (kJ mol−1) | −3.1 × 10³ | −4.2 × 10³ |
| Quinine | Quinine-DDQ | Quinine-TCNQ |
|---|---|---|
| 1.45 (1H, t, J = 10 Hz, H4) | 1.50 (1H, t, J = 10.0 Hz, H4) | 1.50 (1H, t, J = 10 Hz, H4) |
| 1.96 (1H, dt, J = 10, 3 Hz, H5a) 2.07 (1H, d, J = 2 Hz, H5b) | 1.91 (1H, dt, J = 10.0, 3.0, Hz, H5a) 2.56 (1H, sept., J = 1.5 Hz, H5b) | 1.91 (1H, dt, J = 10, 2 Hz, H5a) 2.56 (1H, sept., J = 1.5 Hz, H5b) |
| 2.16-2.23 (2H, m, H7a,b) | 2.08-2.10 (2H, m, H7a,b) | 2.08-2.10 (2H, m H7a,b) |
| 2.84 (1H, q, J = 5 Hz, H3) | 2.77 (1H, q, J = 5 Hz, H3) | 2.77 (1H, q, J = 5 Hz, H3) |
| 3.17 (1H, ddd, J = 10, 5, 1.5 Hz, 6a) | 3.18 (1H, ddd, J = 10, 5, 1.5 Hz, H6a) | 3.18 (1H, ddd, J = 10.5, 5, 2 Hz, H6a) |
| 3.26 (1H, dt, J = 11.5, 3.5 Hz, H6b) | 3.27 (1H, dt, J = 11.5, 3.5 Hz, H6b) | 3.27 (1H, dt, J = 10.5, 3.5 Hz, H6b) |
| 3.56 (2H, ddd, J = 12.5, 8.5, 7.5 Hz, H2ab) | 3.58 (1H, t, J = 9 Hz, H2a) 3.68 (1H, t, J = 6 Hz, H2b) | 3.58 (1H, ddd, J = 12.5, 8.5, 7.5 Hz, H2a) 3.68 (1H, ddd, J = 12.5, 8.5, 7.5 Hz, H2b) |
| 3.71 (3H, s OCH3) | 4.17 (3H, s OCH3) | 4.17 (3H, s OCH3) |
| 4.33 (1H, t, J = 10 Hz, H8) | 4.05 (1H, t, J = 10 Hz, H8) | 4.05 (1H, t, J = 8.5 Hz, H8) |
| 4.92 (1H, d, J = 7.5 Hz, H11) | 5.02 (1H, d, J = 7.5 Hz, H11) | 5.02 (1H, d, J = 7.5 Hz, H11) |
| 5.07 (1H, J = 12.5 Hz, H11) | 5.14 (1H, J = 12.5 Hz, H11) | 5.14 (1H, J = 12 Hz, H11) |
| 5.77 (1H, ddd, J = 12.5, 7, 5 Hz H10) | 5.85 (1H, ddd, J = 12.5, 7, 5 Hz, H10) | 5.85 (1H, ddd, J = 12, 7, 5 Hz, H10) |
| 6.37 (1H, br s OH) | 6.94 (1H, br s OH) | 6.94 (1H, br s OH) |
| 6.56 (1H, s H9) | 6.55 (1H, dd, J = 6.5, 1.5 H9) | 6.55 (1H, d, J = 3 Hz, H9) |
| 7.02 (1H, dd, J = 6.5, 1.5 H7ʹ) | 7.79 (1H, dd, J = 9, 2 Hz, H7ʹ) | 7.79 (1H, dd, J = 6.5, 2 Hz, H7ʹ) |
| 7.32 (1H, d, J = 2 Hz, H3ʹ) | 7.96 (1H, d, J = 4.0 Hz, H3′) | 7.96 (1H, d, J = 2 Hz, H3ʹ) |
| 7.69 (1H, d, J = 3.2 Hz, H5ʹ) | 8.09 (1H, m, H5ʹ) | 8.10 (1H, d, J = 3 Hz, H5ʹ) |
| 7.72 (1H, d, J = 6.5 Hz, H8ʹ) | 8.32 (1H, dd, J = 9.5, 4.7 Hz, H8ʹ) | 8.32 (1H, d, J = 6.5 Hz, H8ʹ) |
| 8.67 (1H, d, J = 3.2 Hz, H2ʹ) | 9.10 (1H, dd, J = 4.0, 1.0 Hz, H2ʹ) | 9.10 (1H, d, J = 3.2 Hz, H2ʹ) |
| No. | Chemical Shifts (ppm) | Assignment | |
|---|---|---|---|
| Quinine | Q-DDQ Charge Transfer Complex | ||
| 1 | 174.32 | DDQ | |
| 2 | 172.02 | DDQ | |
| 3 | 171.09 | DDQ | |
| 4 | 161.89 | DDQ | |
| 5 | 159.48 | DDQ | |
| 6 | 158.90 | 159.45 | 6′ |
| 7 | 147.74 | 150.86 | 4′ |
| 8 | 145.98 | 144.66 | 2′ |
| 9 | 144.95 | 138.95 | 10′ |
| 10 | 139.66 | 136.24 | 10 |
| 11 | 132.03 | 129.24 | 8′ |
| 12 | 126.57 | 126.78 | 9′ |
| 13 | 122.80 | 119.80 | 7ʹ |
| 14 | 119.72 | 116.33 | 3′ |
| 15 | 116.59 | 113.75 | 11 |
| 16 | 101.74 | 102.88 | 5′ |
| 17 | 101.70 | DDQ | |
| 18 | 87.82 | DDQ | |
| 19 | 66.71 | 65.85 | 9 |
| 20 | 60.58 | 58.77 | 8 |
| 21 | 57.72 | 57.68 | 2 |
| 22 | 54.66 | 53.03 | MeO |
| 23 | 44.08 | 42.71 | 6 |
| 24 | 40.43 | DDQ | |
| 25 | 38.26 | 36.79 | 3 |
| 26 | 28.28 | 26.67 | 4 |
| 27 | 25.02 | 23.81 | 5 |
| 28 | 18.71 | 17.63 | 7 |
| No. | Chemical Shifts (ppm) | Assignments | |
|---|---|---|---|
| Quinine | Quinine-TCNQ Charge Transfer Complex | ||
| 1 | 161.94 | TCNQ | |
| 2 | 158.90 | 158.06 | 6′ |
| 3 | 153.08 | TCNQ | |
| 4 | 147.74 | 146.84 | 4′ |
| 5 | 145.98 | 146.26 | 2′ |
| 6 | 144.95 | 142.94 | 10′ |
| 7 | 139.66 | 138.99 | 10 |
| 8 | 132.03 | 130.66 | 8′ |
| 9 | 129.45 | TCNQ | |
| 10 | 125.82 | TCNQ | |
| 11 | 126.57 | 125.78 | 9′ |
| 12 | 124.66 | TCNQ | |
| 13 | 124.02 | TCNQ | |
| 14 | 122.80 | 122.42 | 7′ |
| 15 | 121.11 | TCNQ | |
| 16 | 119.72 | 119.15 | 3′ |
| 17 | 118.07 | TCNQ | |
| 18 | 116.59 | 116.19 | 11 |
| 19 | 114.53 | TCNQ | |
| 20 | 102.10 | TCNQ | |
| 21 | 101.74 | 102.03 | 5′ |
| 22 | 66.71 | 65.54 | 9 |
| 23 | 60.58 | 58.99 | 8 |
| 24 | 57.72 | 57.17 | 2 |
| 25 | 54.66 | 52.89 | MeO |
| 26 | 44.08 | 42.69 | 6 |
| 27 | 40.43 | TCNQ | |
| 28 | 38.26 | 36.77 | 3 |
| 29 | 28.28 | 26.72 | 4 |
| 30 | 25.48 | TCNQ | |
| 31 | 25.02 | 23.84 | 5 |
| 32 | 18.71 | 17.62 | 7 |
| Total Energy (ev) | Quinine | Quinine-DDQ | Quinine-TNCQ |
|---|---|---|---|
| EHOMO(ev) | −5.56 | −5.94 | −7.58 |
| ELUMO(ev) | −1.28 | −2.67 | −5.36 |
| Gap,ΔE | 4.28 | 3.27 | 2.22 |
| Dipole moment, (Debye) | 2.74 | 3.84 | 3.08 |
| Chemical potential (ev) | −3.42 | −4.30 | −6.47 |
| Electronegativity | 3.42 | 4.30 | 6.47 |
| Global Hardness | 2.14 | 1.64 | 1.11 |
| Global Electrophilicity Index | 2.73 | 5.67 | 18.86 |
| Softness | 1.07 | 0.82 | 0.56 |
| Global softness | 0.47 | 0.61 | 0.90 |
Publisher’s Note: MDPI stays neutral with regard to jurisdictional claims in published maps and institutional affiliations. |
© 2022 by the authors. Licensee MDPI, Basel, Switzerland. This article is an open access article distributed under the terms and conditions of the Creative Commons Attribution (CC BY) license (https://creativecommons.org/licenses/by/4.0/).
Share and Cite
Mostafa, G.A.E.; Yousef, T.A.; Gaballah, S.T.; Homoda, A.M.; Al-Salahi, R.; Aljohar, H.I.; AlRabiah, H. Quinine Charge Transfer Complexes with 2,3-Dichloro-5,6-Dicyano-Benzoquinone and 7,7,8,8-Tetracyanoquinodimethane: Spectroscopic Characterization and Theoretical Study. Appl. Sci. 2022, 12, 978. https://doi.org/10.3390/app12030978
Mostafa GAE, Yousef TA, Gaballah ST, Homoda AM, Al-Salahi R, Aljohar HI, AlRabiah H. Quinine Charge Transfer Complexes with 2,3-Dichloro-5,6-Dicyano-Benzoquinone and 7,7,8,8-Tetracyanoquinodimethane: Spectroscopic Characterization and Theoretical Study. Applied Sciences. 2022; 12(3):978. https://doi.org/10.3390/app12030978
Chicago/Turabian StyleMostafa, Gamal A. E., Tarek A. Yousef, Samir T. Gaballah, Atef M. Homoda, Rashad Al-Salahi, Haya I. Aljohar, and Haitham AlRabiah. 2022. "Quinine Charge Transfer Complexes with 2,3-Dichloro-5,6-Dicyano-Benzoquinone and 7,7,8,8-Tetracyanoquinodimethane: Spectroscopic Characterization and Theoretical Study" Applied Sciences 12, no. 3: 978. https://doi.org/10.3390/app12030978
APA StyleMostafa, G. A. E., Yousef, T. A., Gaballah, S. T., Homoda, A. M., Al-Salahi, R., Aljohar, H. I., & AlRabiah, H. (2022). Quinine Charge Transfer Complexes with 2,3-Dichloro-5,6-Dicyano-Benzoquinone and 7,7,8,8-Tetracyanoquinodimethane: Spectroscopic Characterization and Theoretical Study. Applied Sciences, 12(3), 978. https://doi.org/10.3390/app12030978