Article

Effect of Sodium on Methanogens in a Two-Stage Anaerobic System

1
School of Environmental Science and Engineering, Huazhong University of Science and Technology, Luoyu Road 1037, Wuhan 430074, China
2
Advanced Environmental Biotechnology Centre, Nanyang Environment and Water Research Institute, Nanyang Technological University, 1 Cleantech Loop, Singapore 637141, Singapore
3
School of Civil and Environmental Engineering, Nanyang Technological University, 50 Nanyang Avenue, Singapore 639798, Singapore
*
Authors to whom correspondence should be addressed.
Appl. Sci. 2022, 12(3), 956; https://doi.org/10.3390/app12030956
Submission received: 13 December 2021 / Revised: 6 January 2022 / Accepted: 12 January 2022 / Published: 18 January 2022

Abstract

:
This study evaluated the effects of sodium on anaerobic biomass from the second-stage reactor of a two-stage anaerobic digester. The results indicated that methanogens showed a relatively high sodium tolerance of 2.4 g Na+ L−1. Microbial community analysis showed that viable Methanomicrobiales was the most abundant population by a combined propidium monoazide cross-linking quantitative polymerase chain reaction technique. There was a population shift towards higher abundance of Thermotoga (0.02%), Clostridium (2.50%) and Methanoculleus (13.80%). Biomass activity in relation to increased sodium concentrations was investigated with the adenosine triphosphate test coupled with extracellular polymeric substances measurement. The results showed biomass activity decreased from 33 to 16 µg g−1 volatile suspended solids as sodium concentrations increased from 1.3 to 9.1 g Na+ L−1. Higher EPS production, particularly a greater predominance of carbohydrates, was stimulated by higher sodium concentrations. This study provides insights into the superiority of sodium tolerance of two-stage anaerobic digester in compared with a single-stage anaerobic system.

Highlights:
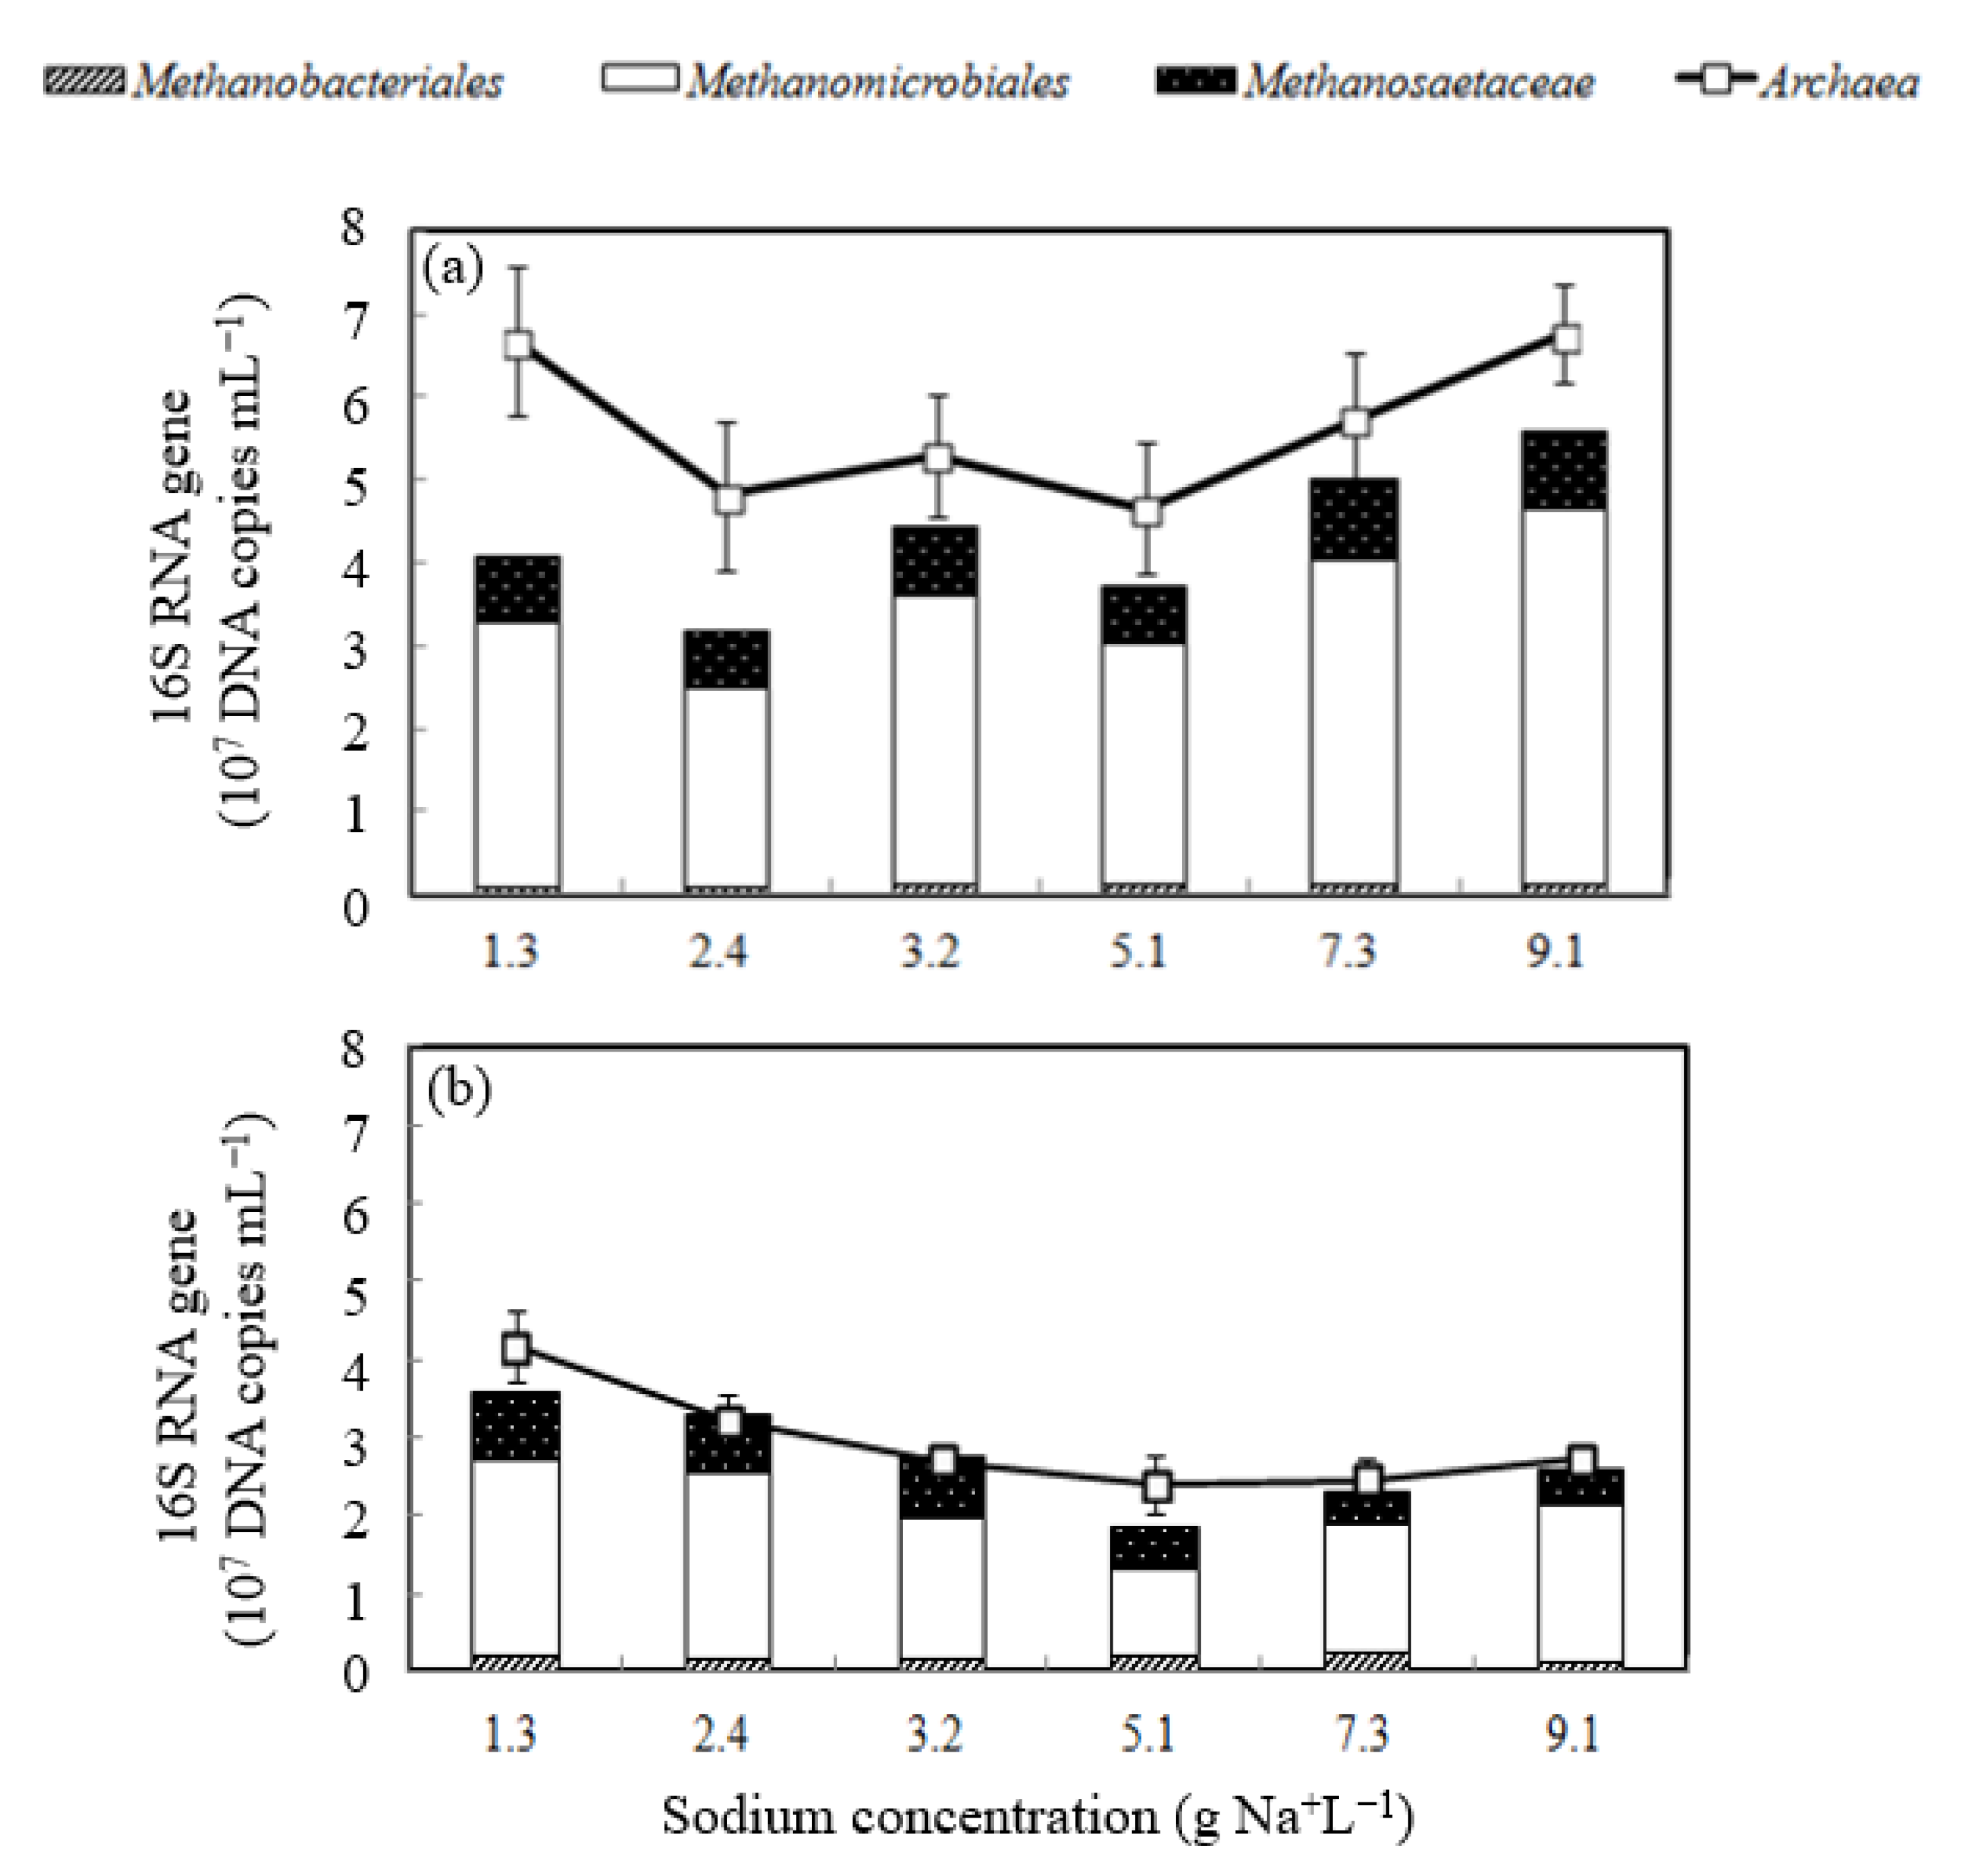
  • Methanomicrobiales was the most abundant methanogen in the second-stage reactor;
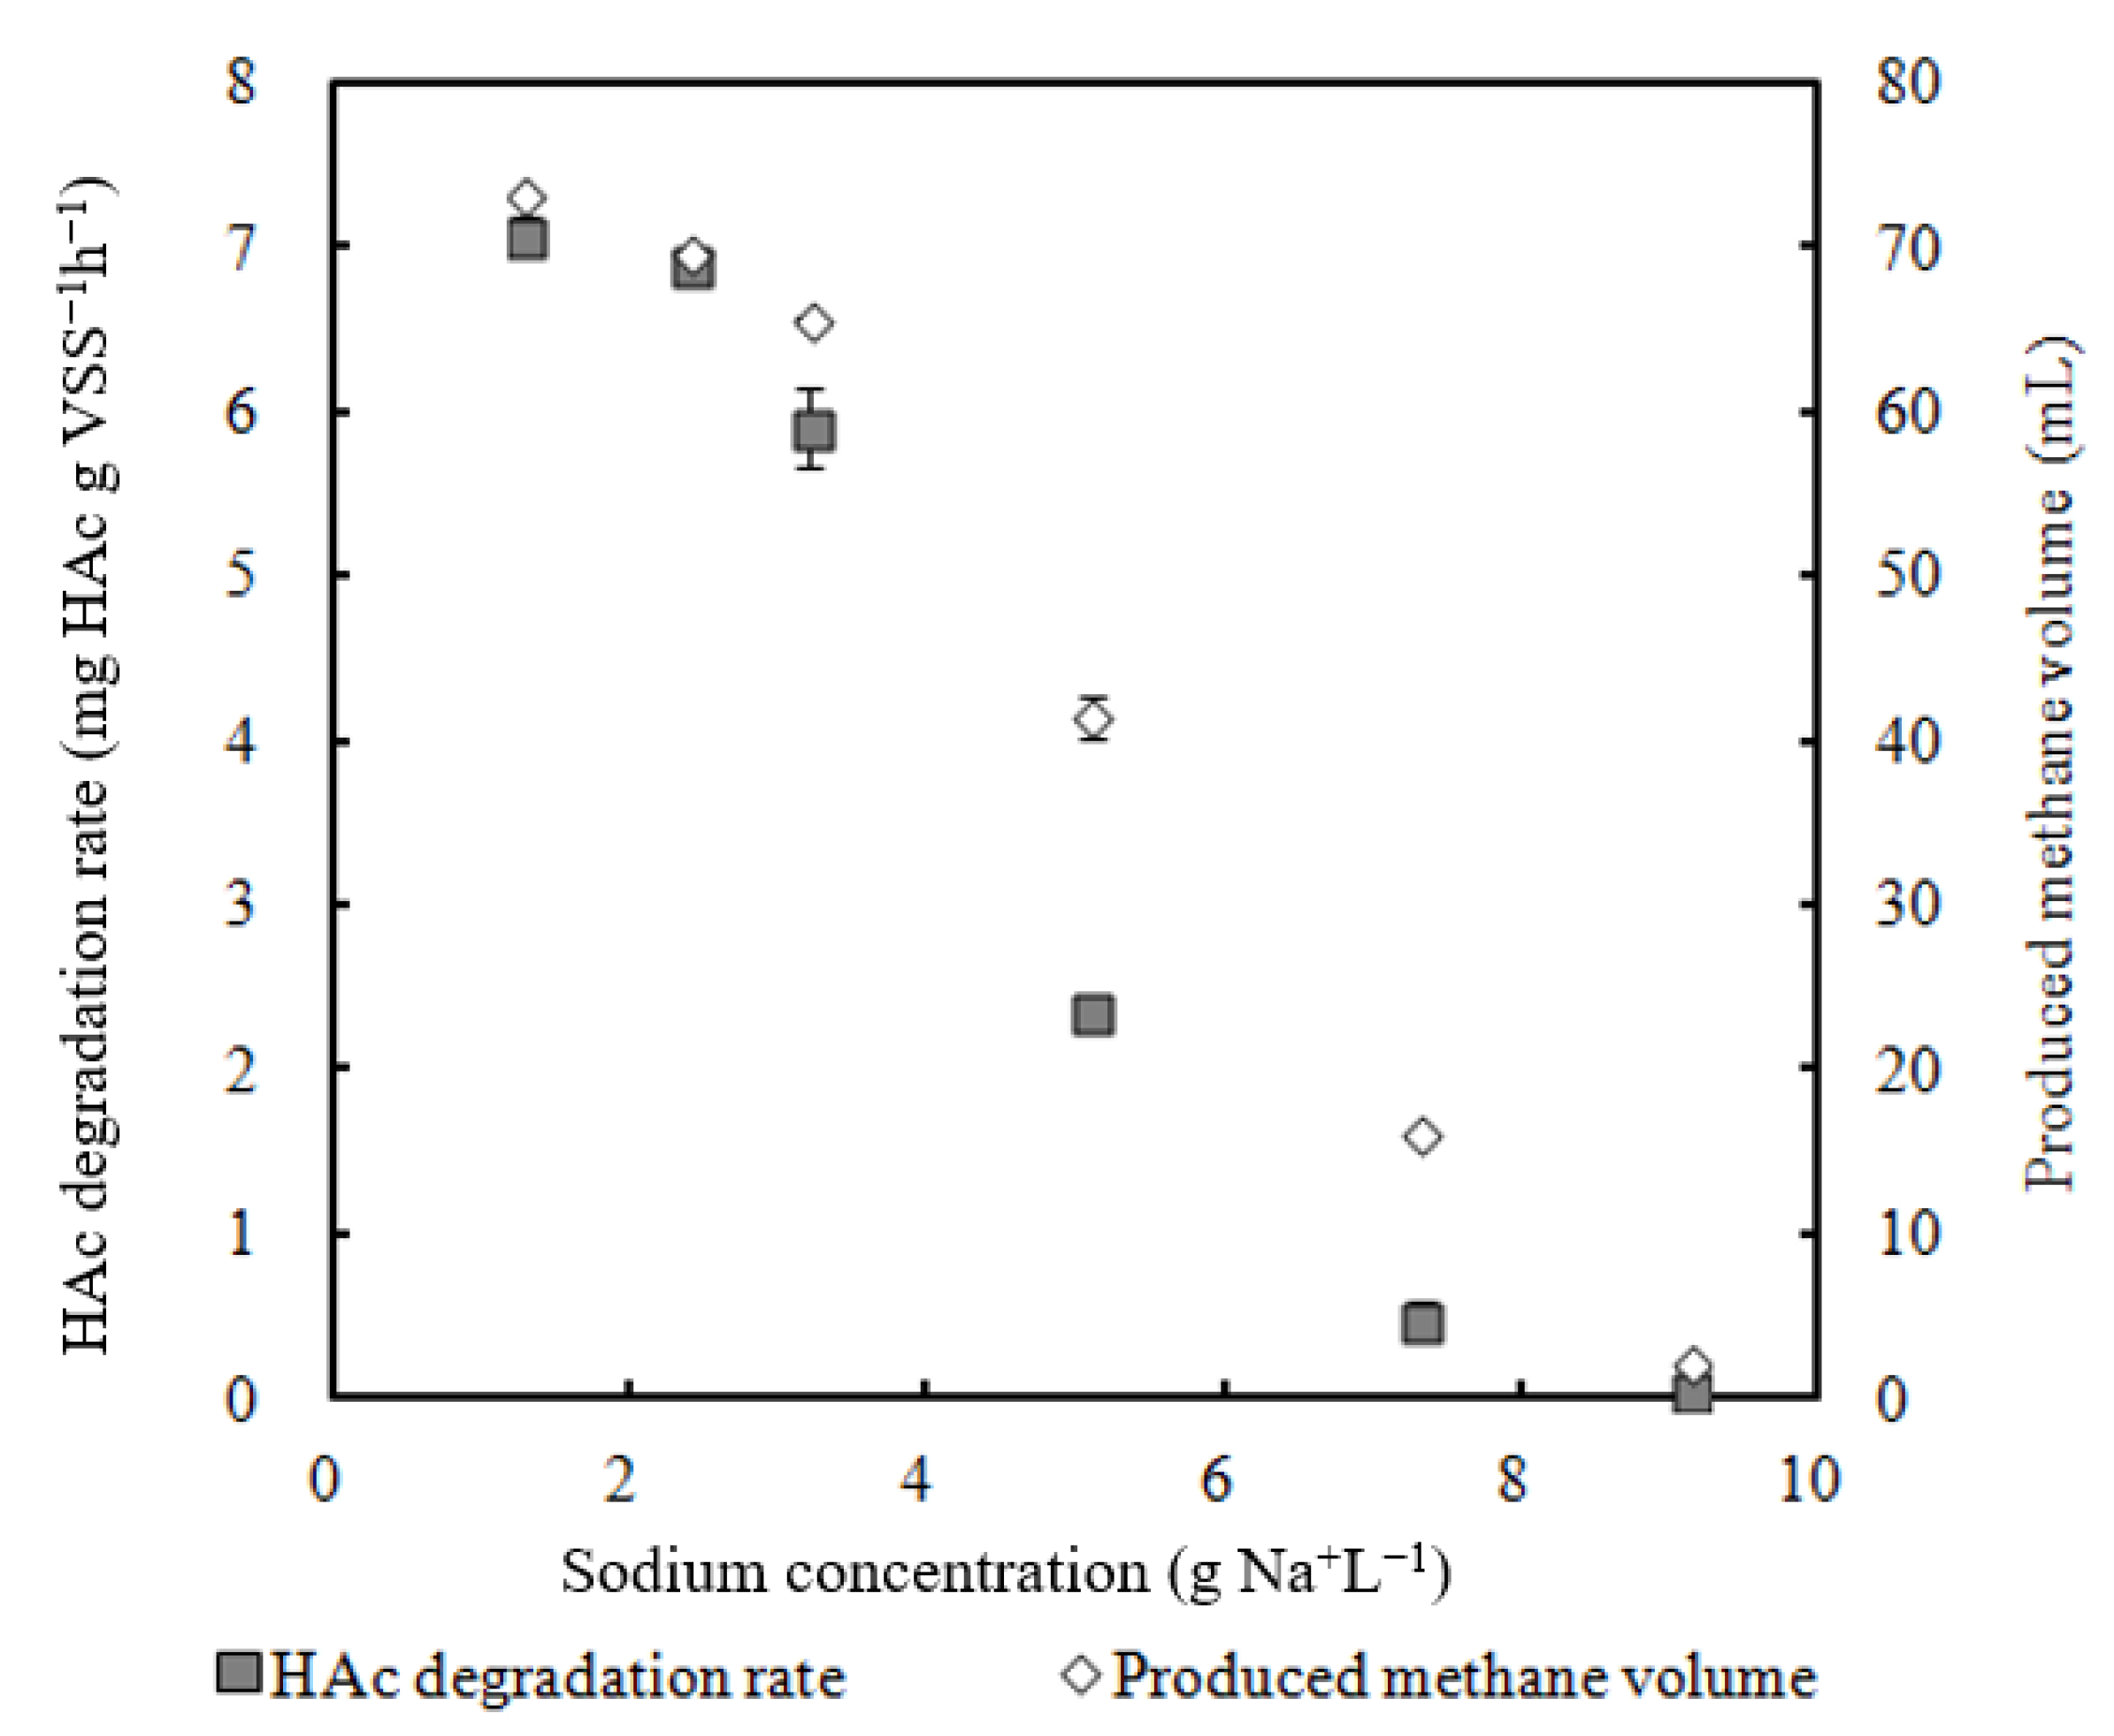
  • 2.4 g Na+ L −1 sodium did not have obvious inhibition on the HAc degradation rate;
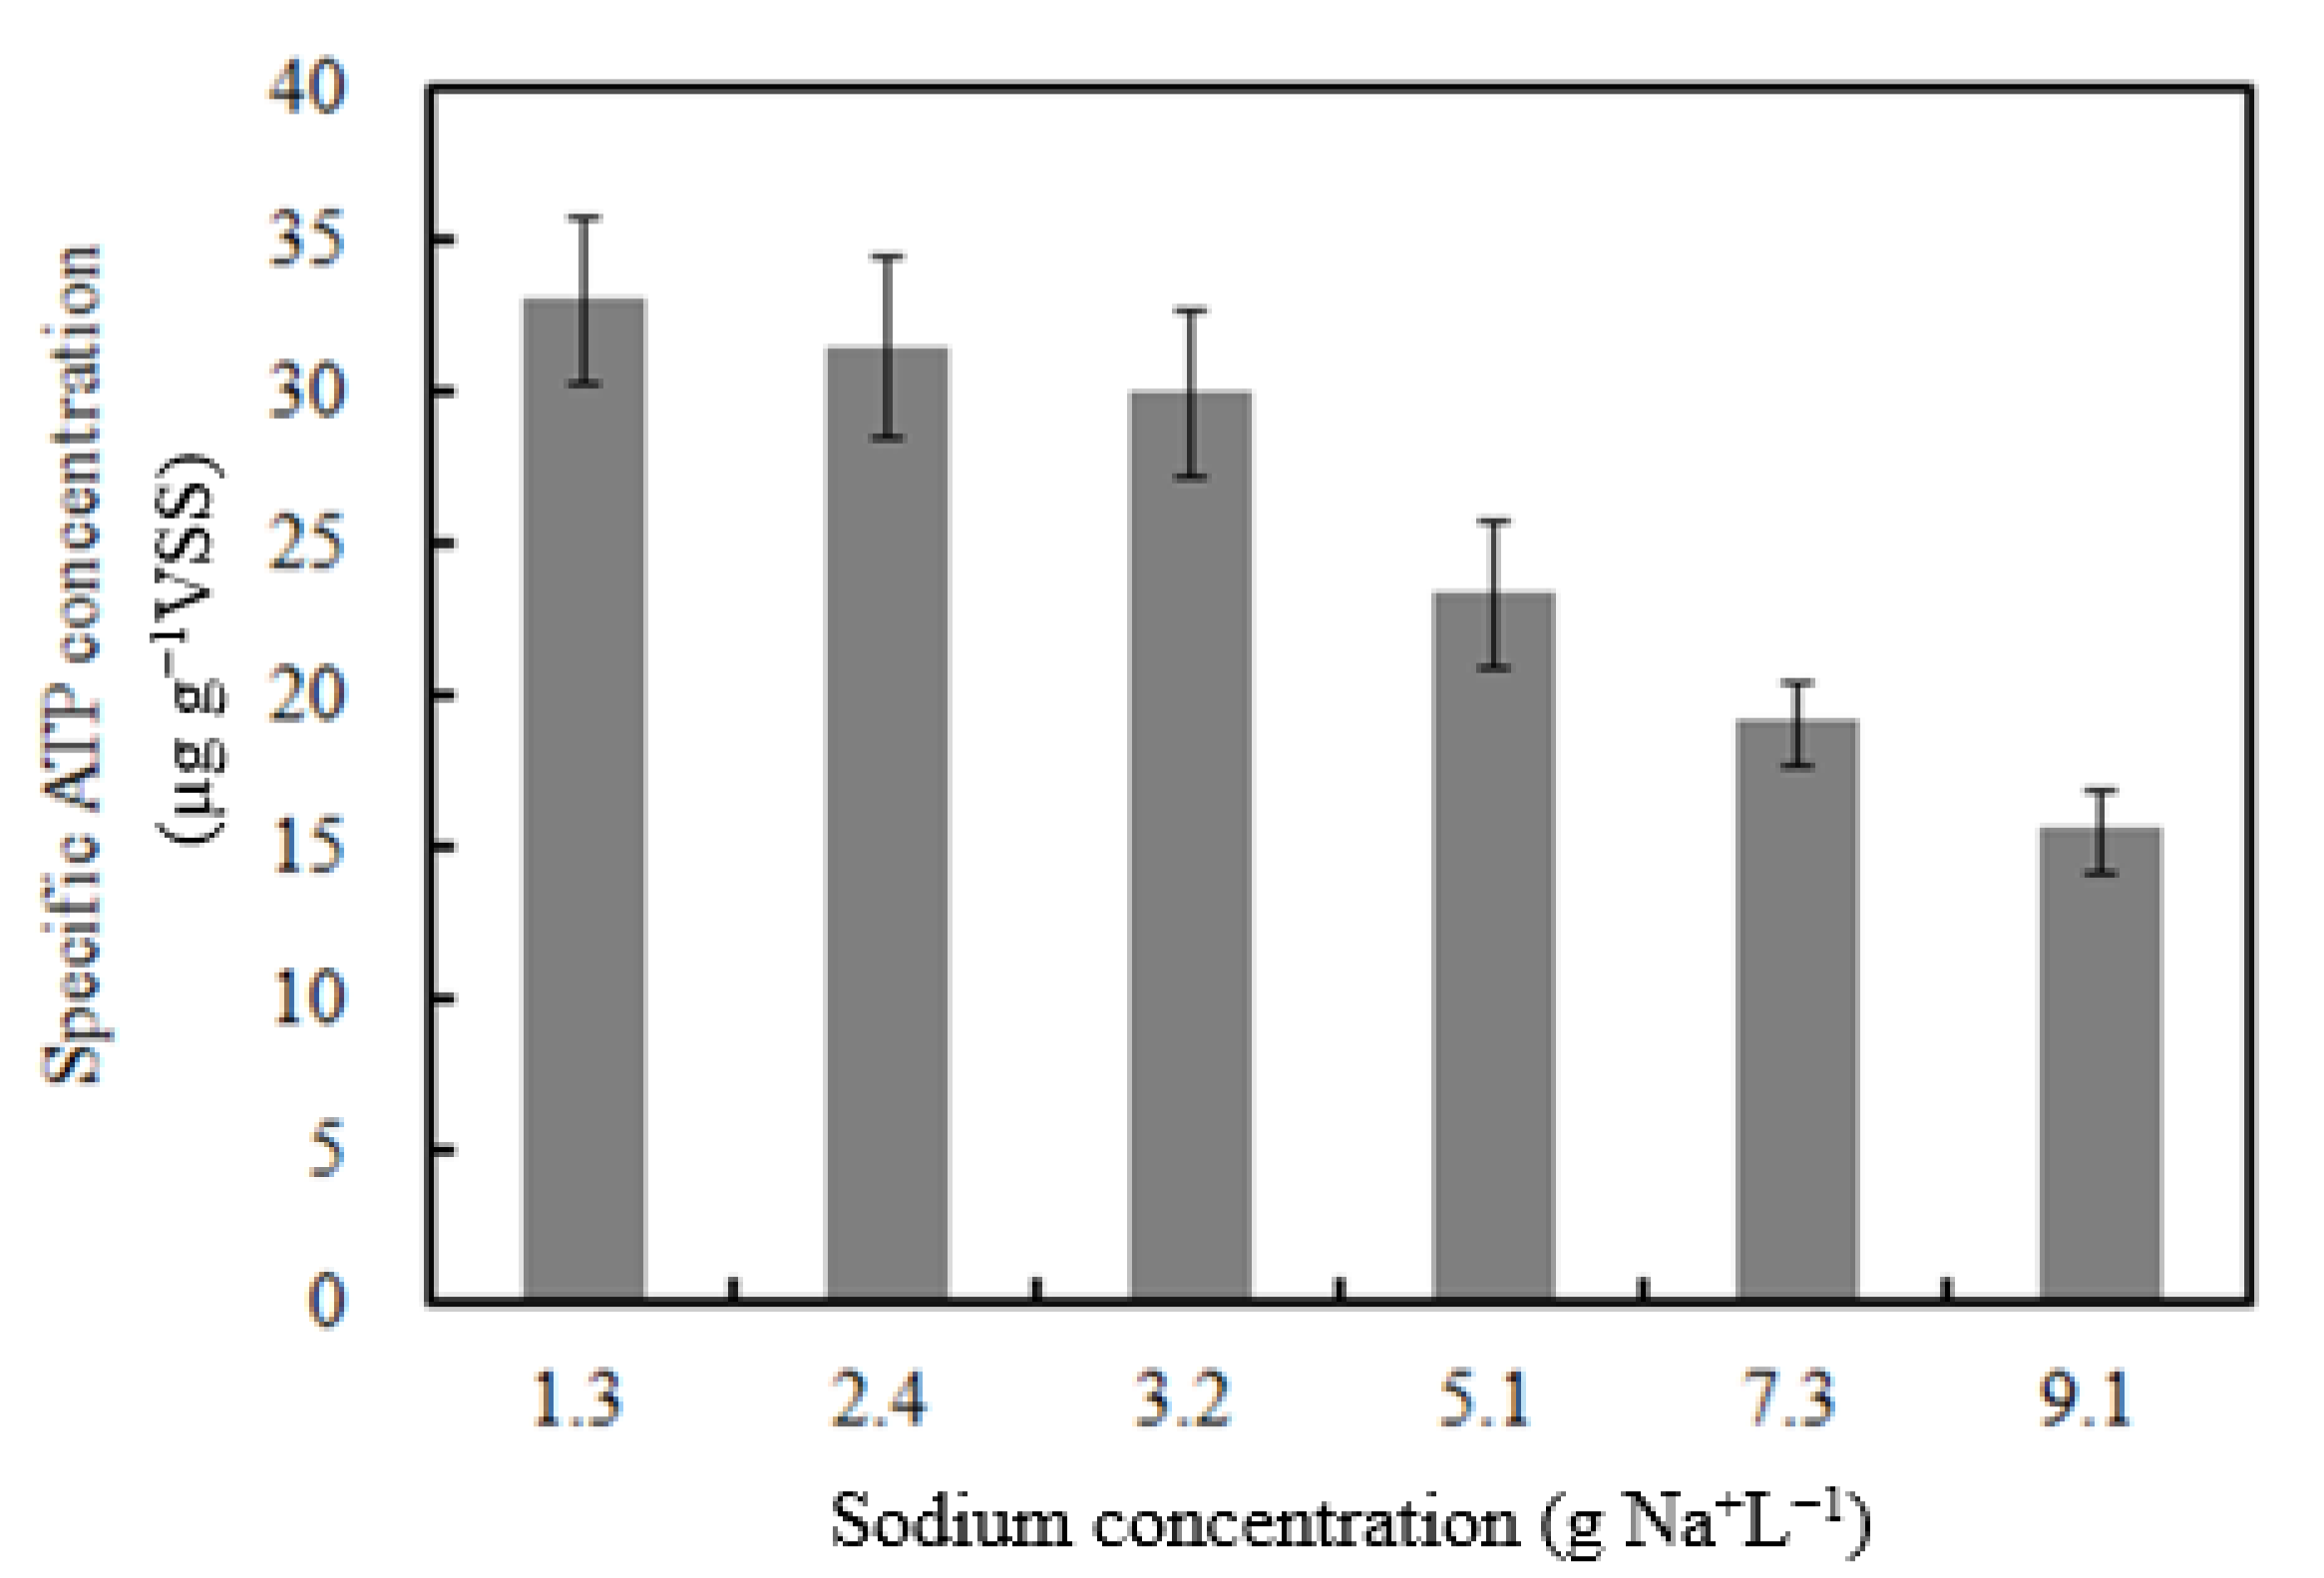
  • Biomass activity decreased with Na content increased from 1.3 to 9.1 g Na+ L−1;
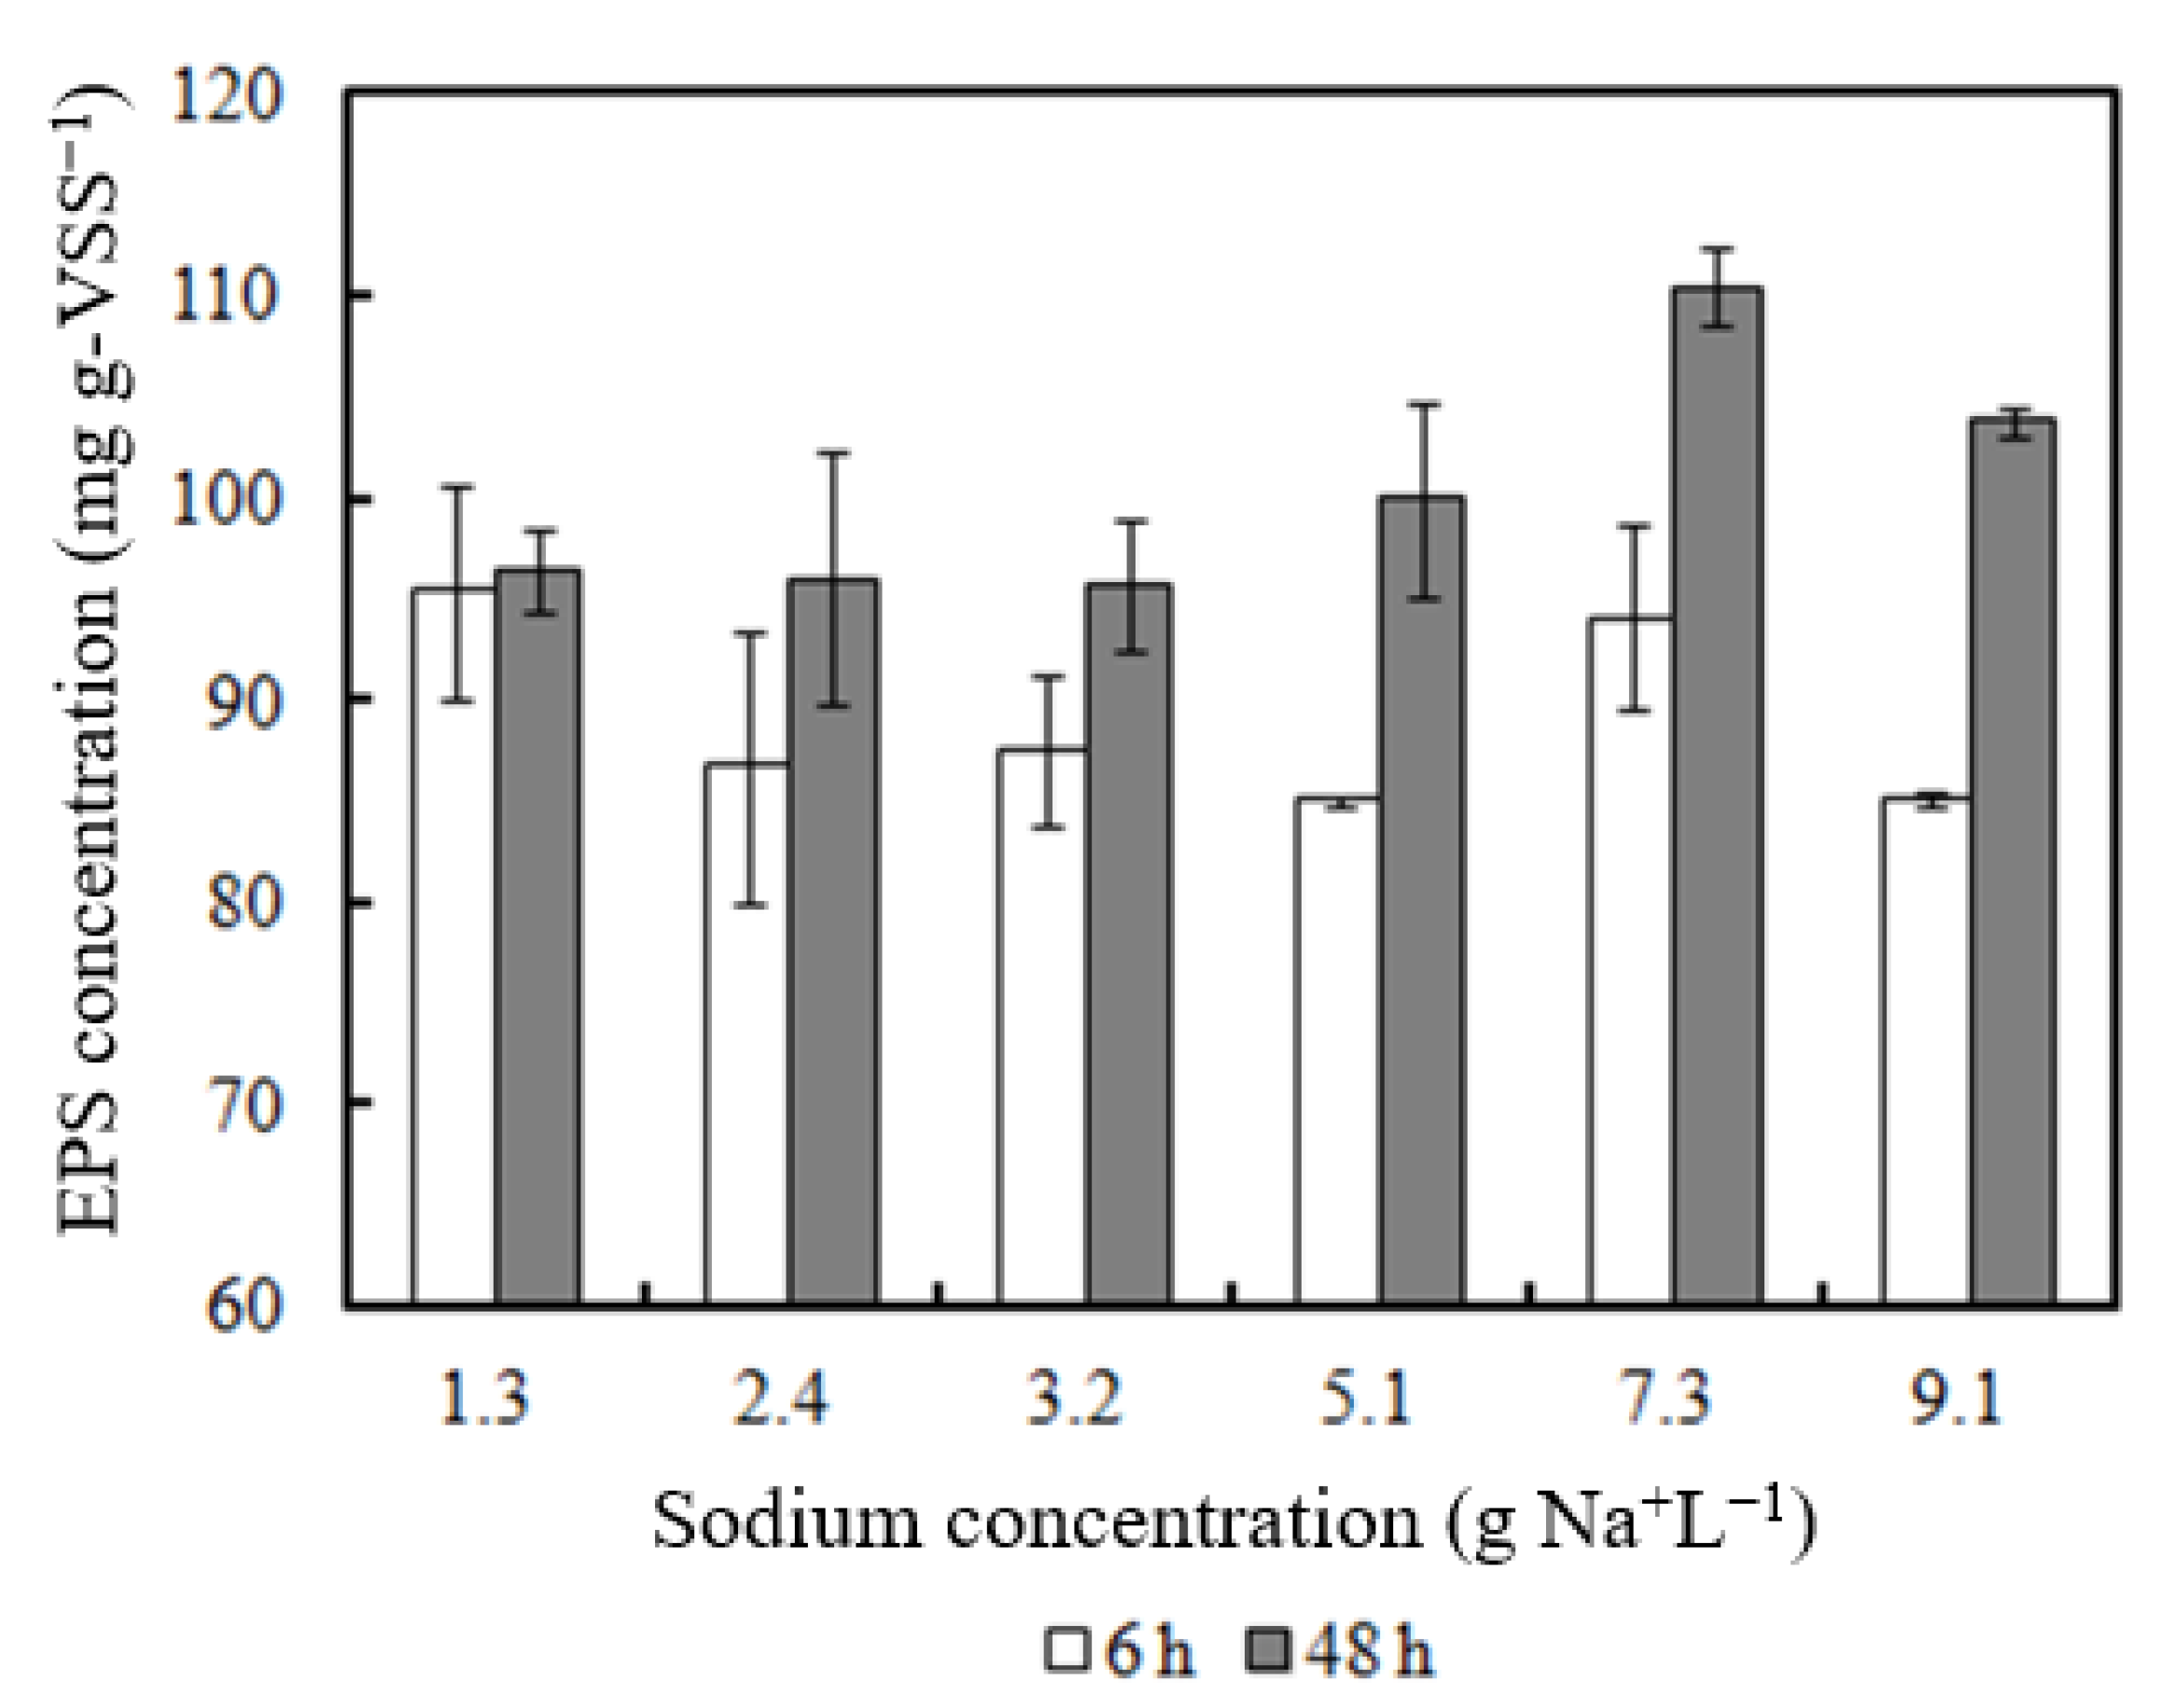
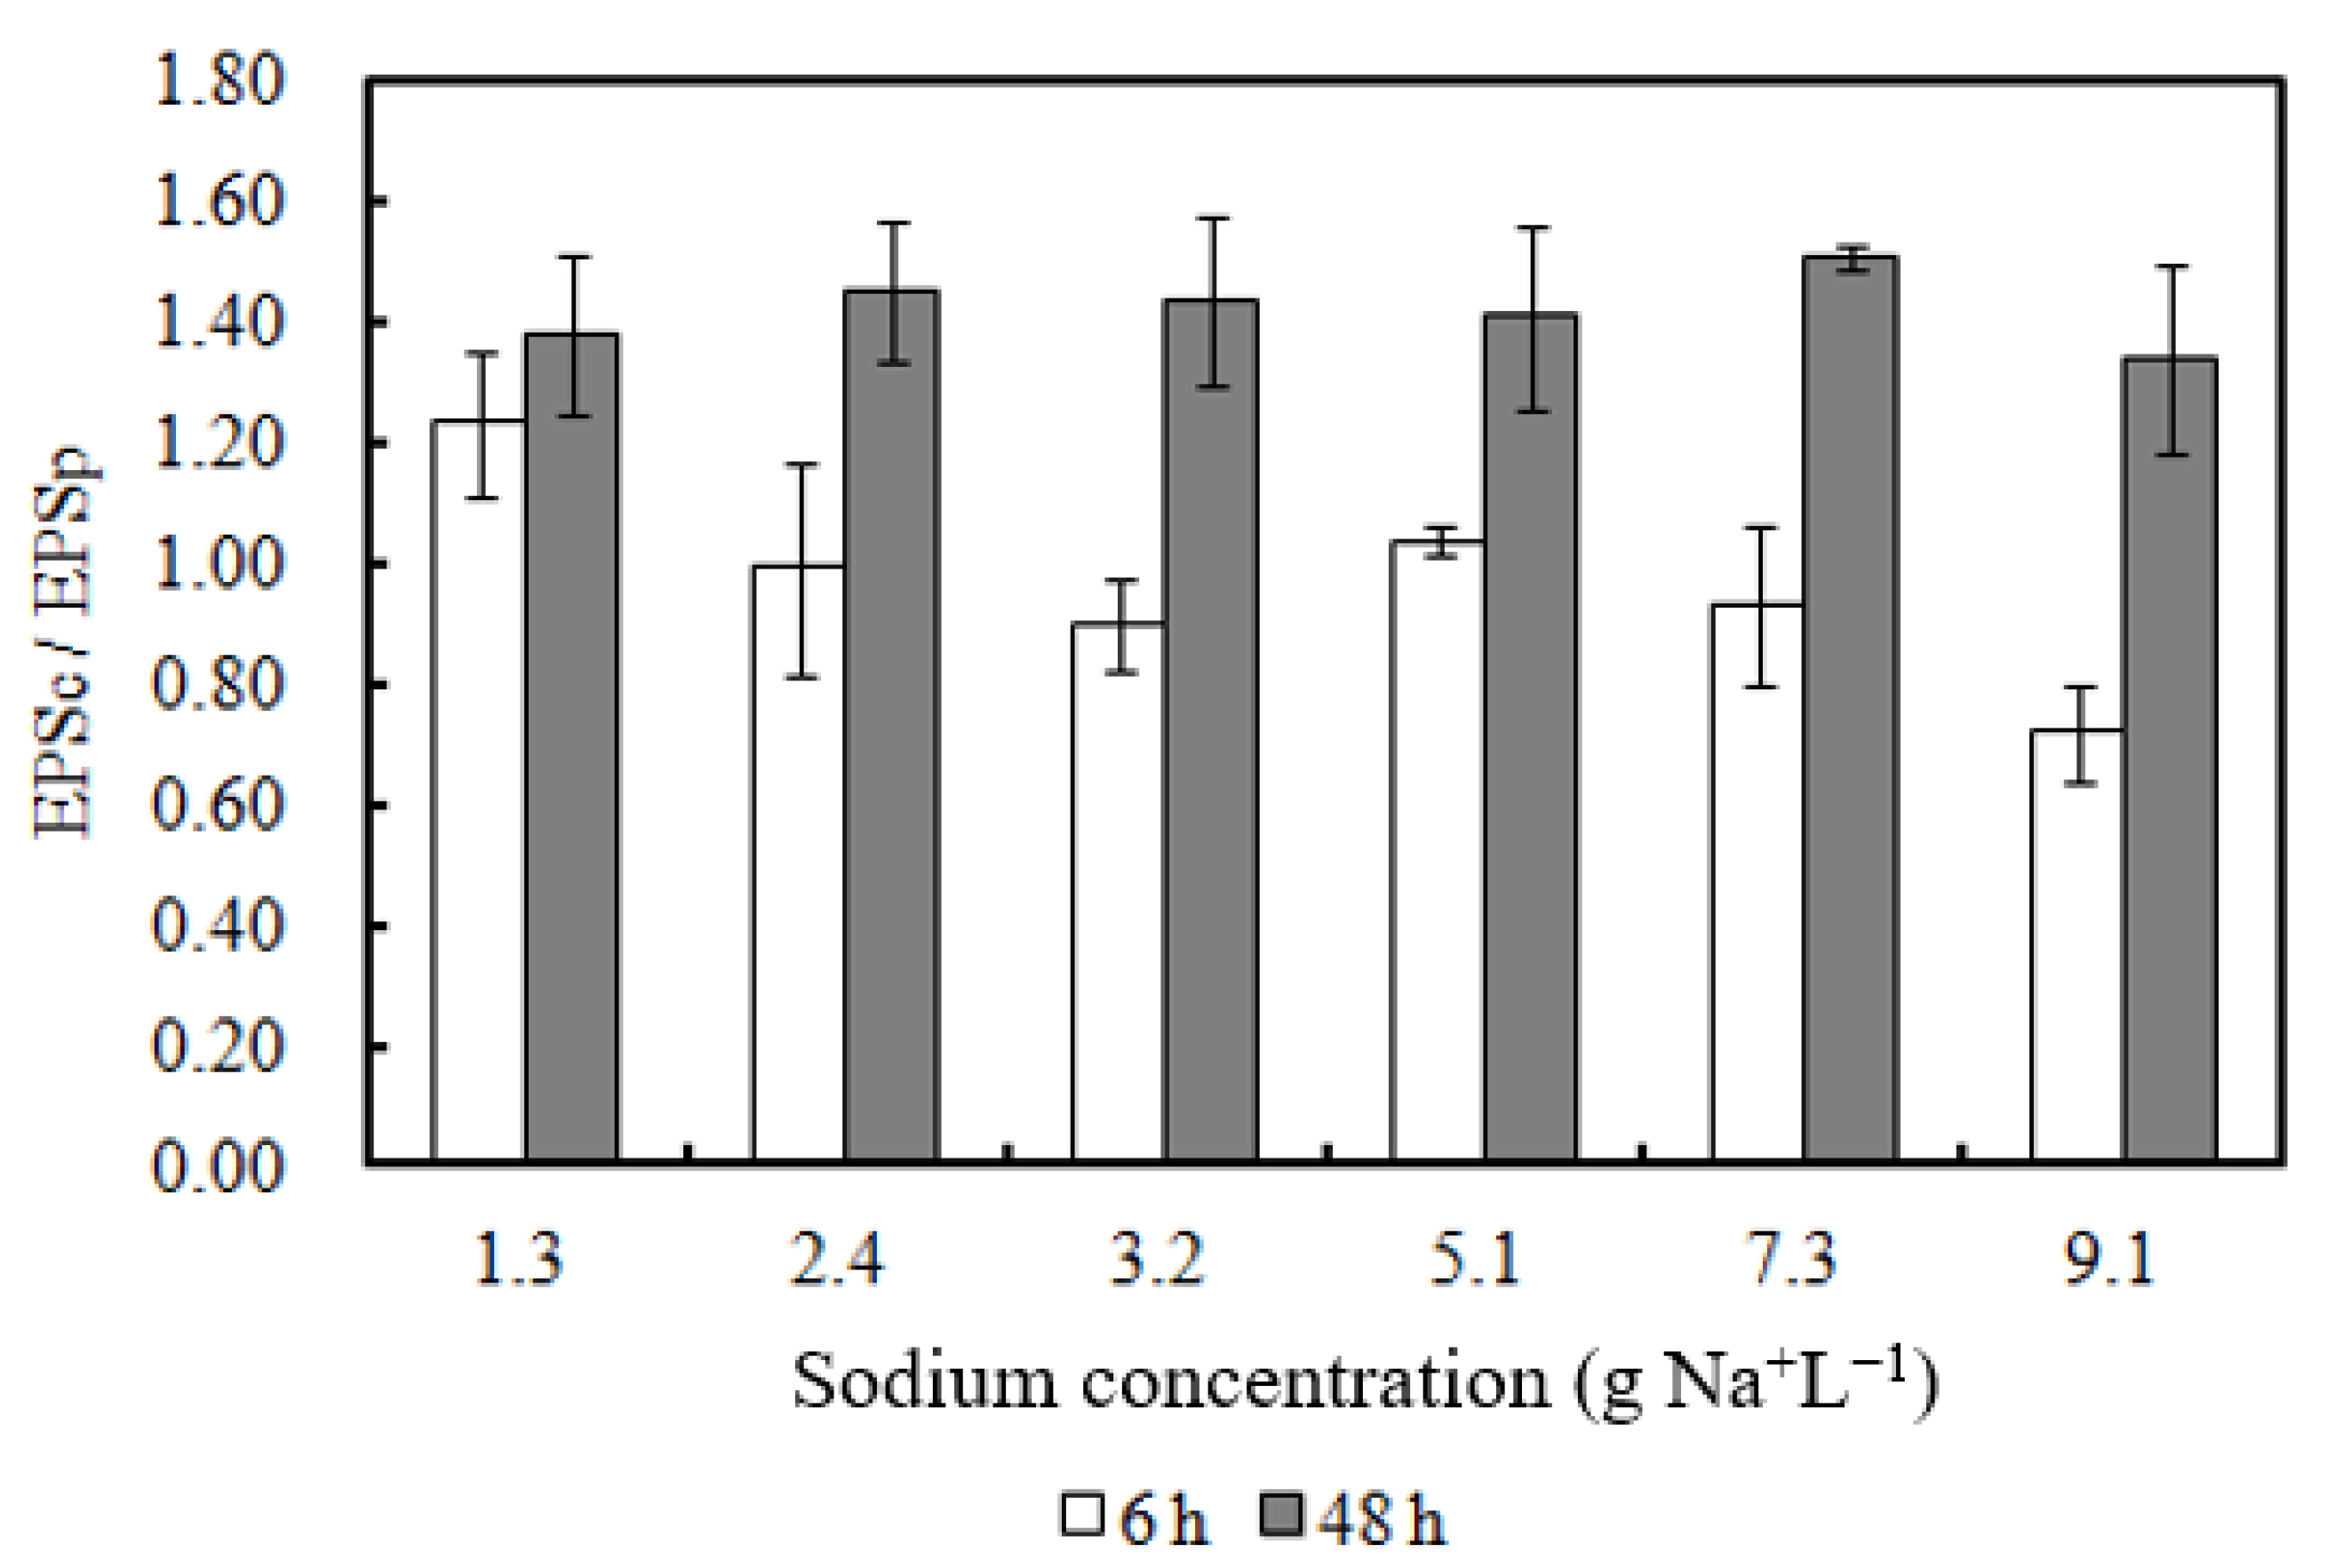
  • EPS concentration increased with higher Na concentrations (7.3–9.1 g Na+ L−1).

1. Introduction

Anaerobic digestion is often a cost-effective technology for sludge treatment to reduce biosolids and recover energy [1]. Since the hydrolysis process is the rate-limiting step in the anaerobic digestion of sludge, various pretreatment methods have been proposed to improve the disintegration efficiency of sludge particulates [2]. Among these, alkaline pretreatment with controlled pH is best known for its high efficiency in solubilizing complex substrates [3,4]. However, the sodium ion would be introduced into the anaerobic system during pH regulation if using sodium hydroxide (NaOH) or sodium carbonate (Na2CO3) [5].
Anaerobic digestion has been reported to be hindered by the presence of high concentrations of sodium ions. The effect of sodium ions on the activities of methanogens in the single-stage system has been previously elucidated [6,7,8]. Although an appropriate amount of sodium has been reported to be essential for methanogen growth [6,7,9], high sodium concentrations (5–10 g Na+ L−1) inhibit methanogenic activities and biogas production [6,9]. The sodium inhibition mechanism on methanogens has been previously explored by researchers.
Liu and Boone [8] reported the effect of sodium on the chemical and physical characteristics of sludge, e.g., soluble microbial products, extracellular polymeric substances (EPS), turbidity, viscosity and capillary suction time. Other researchers also reported that sodium caused the inhibition of biomass activity [10,11], which was typically characterized by a decrease in the degradation rates of volatile fatty acids (VFA) [12]. Furthermore, with the presence of sodium in the growth environment, bacteria cells would produce EPS as a protective response [9,13]. However, these studies focused on the conventional single-stage anaerobic digestion system.
The microbial communities and their activities in the two-stage anaerobic digester would likely be different from those in the single-stage system [14]. The methanogens in the second-stage reactor of a two-stage anaerobic digester were reported to be more stable than those in the single-stage system [14,15]. With stage separation, better control of loading could be achieved on the first-stage reactor, consequently, resulting in a more stable growth environment for methanogens in the second-stage reactor [15].
In the two-stage anaerobic system investigated in this study, the second-stage reactor received effluent from the first-stage reactor wherein thermo-chemical pre-treatment was applied to substantially improve solubilisation of organic particulates. Therefore, the methanogens’ dominance, sensitivities, as well as their stress responses to inhibition, would likely be different from those observed in a single-stage system.
With benefits of improved organic loading rates and process stability [16], the two-stage anaerobic digester has received increased interest for optimizing methane production in recent years [17]. However, the issues caused by sodium loading and toxicity may affect the successful operation of the two-stage anaerobic digester [18]. This study investigates the effect of sodium on the viability and activity of the methanogens from the second-stage reactor of a two-stage anaerobic system, which could help to provide knowledge for the design, operation and optimisation of the two-stage anaerobic digester for applications on the more saline organic wastes.

2. Materials and Methods

2.1. Bioreactor Set-Up

The two-stage continuous stirred tank reactor (CSTR) consisted of the first-stage reactor (operated at 55 °C, pH of 8.5 ± 0.3, hydraulic retention time (HRT) of 3 d) and the second-stage reactor (operated at 35 °C, pH of 7.0 ± 0.2, HRT of 17 d). The first-stage reactor had a working volume of 7.5 L, while the second-stage reactor had a working volume of 42.5 L. The single-stage reactor had a working volume of 50 L. Feed sludge, a mixture of primary and secondary sludge, was collected from a local wastewater treatment plant. The doses of 5 mol L−1 HCl and/or 5 mol L−1 NaOH were applied to control pH in the single-stage, first-stage and second-stage reactors. The detailed system configuration and operation conditions were described previously [19].

2.2. Inocula for Batch Tests

The inocula were drawn from the second-stage reactor of the two-stage anaerobic digester. Sludge transfer and the washing steps were conducted under anaerobic condition by continuous nitrogen sparging. The prior washing step through centrifugation at 12,857× g for 10 min was used to eliminate possible antagonistic and synergistic effects of other cations, such as K+, Mg2+ and Ca2+ [5]. The biomass was resuspended with an equivalent volume of autoclaved 1 × phosphate buffered saline solution (PBS) (pH = 7.4) [20]. The centrifugation and re-suspension step were repeated thrice for each sample.

2.3. Experimental Set-Up

The experiments were conducted in 250 mL serum bottles with 100 mL biomass and 100 mL synthetic wastewater (without VFA). The composition of synthetic wastewater can be found in Xiao et al. (2013). In brief, 0.024 g L−1 of (NH4)2HPO4, 0.34 g L−1 of NH4HCO3, 0.002 g L−1 of KCl, 0.166 g L−1 of MgCl2·6H2O, 0.166 g L−1 of CaCl2·2H2O, 0.006 g L−1 of FeCl2·4H2O and 0.5 g L−1 of NaHCO3 were added, followed by 0.2 mL L−1 trace elements. The composition of trace elements was: 1.25 g L−1 of CoCl2·6H2O, 1.25 g L−1 of H3BO3, 3.06 g L−1 of MnCl2·4H2O, 0.10 g L−1 of Na2MoO4·4H2O, 1.25 g L−1 of NiCl2·6H2O, 1.25 g L−1 of ZnCl2 and 1.95 g L−1 of thiamine. After adding the inocula and medium, the serum bottles were closed with aluminum caps and silicone rubber septa and then sparged with nitrogen gas for 3 min.
Following the first day’s feeding, serum bottles with only synthetic wastewater and 100 mL inocula were incubated overnight on the shaker at 35 °C and 200 rpm (Infors AG CH-4103, Bottmingen, Switzerland) for activity recovery and further removal of residual VFA. The pH was adjusted to 7.00 by 1 mol L−1 NaOH or 1 mol L−1 HCl, which was within the non-interfering pH range for sodium effect on methanogens [7]. In the second day’s feeding, a combined solution of sodium acetate and sodium chloride (NaCl) (pH adjusted to 7) was injected into the serum bottles. The amount of sodium acetate added to each serum bottle was 2318 ± 65 mg L−1 acetic acid (HAc).
The buffer capacity was maintained using 1.5 g sodium bicarbonate (NaHCO3) per gram of chemical oxygen demand (COD) [5]. The final measured total sodium concentrations were 1.3, 2.4, 3.2, 5.1, 7.3 and 9.1 g Na+ L1. The incubation period for all batch tests lasted 48 h at 35 °C and 200 rpm (Infors AG CH-4103, Switzerland). The HAc degradation rates were calculated using data from the 6th to 48th h, during which a linear decrease in HAc concentration was observed. The rates were normalised against volatile suspended solids (VSS) concentrations. At the 6th and 48th h, samples were drawn from the serum bottles for tests of VFA, biogas and EPS. At the end of incubation (48th h), samples were drawn for the ATP test.

2.4. Analytical Methods

Sludge samples were digested with the modified method adapted from Sandroni et al. [21]. Briefly, collected sludge samples were placed in 100 mL crucibles and dried overnight at 105 °C in an oven until constant weight was observed and then ground and homogenised in an agate mortar. A total of 25 mg of the ground sludge sample was digested (4 mL 65% of HNO3, 200 μL 40% of HF and 4 mL of H2O) in a microwave digester (Multiwave 3000, Anton Paar, North Ryde, Australia). The digested solution was diluted with 5% of HNO3 in a volumetric flask. The sodium concentration was measured in a microwave plasma-atomic emission spectrometer (MP-AES 4100, Aglient, Santa Clara, CA, USA).
The total chemical oxygen demand (TCOD) and VSS were measured in accordance with standard methods [22], and the VFA measurement was described previously [23]. For the biogas measurement, a manometer (Dwyer Series 475 Mark III) was utilized [24]. At the 6th h, the pressure inside the serum bottle was zeroed to atmospheric pressure with the manometer and nitrogen gas. At the 48th h, the pressure of the cumulated biogas was measured again with the manometer. The determination of biogas production was based on the ideal gas equation of state.
The composition of the biogas was determined with gas chromatography (GC) and a thermal conductivity detector (TCD) (Agilent Technologies 7890A GC system, US). The temperature for the injector, detector and oven were controlled at 120, 150 and 115 °C, respectively. Five columns were utilized for the analyses of methane (CH4), carbon dioxide (CO2), hydrogen (H2), nitrogen (N2) and oxygen (O2).
Helium (He) was used as a carrier gas for the determination of CH4 and CO2 with the three packed columns (Aglient HayeSep R 0.9 m × 1/8″ × 2.0 mm, Agilent HayeSep C 3.0 m × 1/8″ × 2.0 mm and Agilent MolSieve 5A 3.0 m × 1/8″ × 2.0 mm). Argon (Ar) was used as the carrier gas for the determination of H2 with another two columns (Agilent HayeSep Q 0.9 m × 1/8″ × 2.0 mm and Agilent MolSieve 13 × 3.0 m × 1/8″ × 2.0 mm).
For EPS extraction, the sludge sample was centrifuged (4114× g, 30 min) [9], and the remaining pellet was resuspended with an equivalent volume of 1 × PBS buffer (pH 7.4) [25]. EPS was extracted from this solution with the sodium hydroxide-formaldehyde method [26]. The carbohydrate and protein contents of EPS were measured within 24 h by the colorimetric method [27] and Lowry method [28], respectively.
ATP measurement was used as a rapid and simple method for evaluating methane potential and total biomass activity [29]. Recently, ATP was proposed as a reflection for the loss of cell activity by sodium inhibition [30]. The amount of ATP present in the biomass would be proportional to the luminescence released from the reaction of biomass with the reagent BacTiter-GloTM (Promega, Madison, WI, USA).
Each sludge sample was diluted with 1 × PBS buffer (pH 7.4). The specific commercial reagent (100 μL) and standard or sludge samples (both of 100 μL) were incubated in an opaque-walled 96-well plate and mixed on an orbital shaker at room temperature for 5 min. The luminescence data was recorded by a plate reader (Infinite M200Pro Tecan, SciMed, New York, NY, USA). The specific ATP concentration was normalized against VSS concentration [31]. Triplicates were used for each test in this study.

2.5. Microbial Community Analysis

2.5.1. Viability of Methanogens Incubated with Sodium

The dominance of methanogens in the two-stage anaerobic digester was identified recently by molecular quantification tools, such as quantitative polymerase chain reaction (qPCR) [14]. However, this technique does not necessarily differentiate between viable and dead cells since both viable and dead cells were reported to be amplified, which would lead to an overestimation of actual viable cells [32].
Propidium monoazide (PMA) can, however, be introduced to intercalate extracellular DNA to prevent them from being amplified by polymerase chain reaction (PCR) [33]. Therefore, combining PMA cross-linking with qPCR would allow for the quantification of membrane-intact cells only, excluding extracellular DNA embedded within the sample matrix and membrane-compromised cells [34,35].
In this study, PMA-qPCR was utilized to investigate the viability of methanogens at different sodium concentrations. PMA (Biotin, Boston, MA, USA) was dissolved in 20% dimethyl sulfoxide to make 2 mM stock solution and stored in −20 °C before use. 25 µL of 2 mM PMA was added to 500 µL of sample to prepare 0.1 µM of PMA in 2 mL microfuge tubes [33,35]. Samples were kept in the dark for 5 min at room temperature with shaking. Samples were then placed approximately 30 cm from a 500 W halogen light source (Plusline 240 V, fixed in Halolite QVF 135, Philips N.V., Amsterdam, the Netherlands) and laid horizontally on ice, with shaking for 10 min. The photo-activated samples were washed twice by centrifugation (5000 × g, 10 min) and then resuspended in 500 µL of 1 × PBS buffer (pH = 7.40).
DNA from PMA-intercalated sludge samples was extracted by an automated nucleic acid extractor (MagNA Pure) according to the manufacturer’s protocol (Roche Diagnostics GmbH, Mannheim, Germany). qPCR was performed following Yu et al. [36], with primer/probe sets targeting 16s rRNA genes specific for Archaea, Methanosaetaceae, Methanosarcinaceae, Methanomicrobiales, Methanobacteriales and Methanococcaceae.

2.5.2. Microbial Shift within the Single-Stage and Second-Stage Reactor Populations

Samples for the microbial analysis were obtained at the steady-state phase during operation of the single-stage and second-stage reactors. The total genomic DNA was extracted from samples using a Powersoil DNA isolation kit (Mobio laboratories, Carlsbad, CA, USA) according to the instruction manuals. The bar-coded primers used for the amplification of the bacterial and archaeal 16s rRNA genes were 28F (5′-GAGTTTGATCNTGGCTCAG-3′) and 517F (5′-GCYTAAAGSRNCCGTAGC-3′), respectively. The pyrosequencing analysis of DNA samples was conducted by Research and Testing Laboratory (Pasadena, CA, USA).

3. Results

3.1. Effect of Sodium on Methanogen Activity

The initial sodium concentrations in the feed sludge, first-stage reactor and second-stage reactor were 1.03 ± 0.04 g Na+ L−1, 2.82 ± 0.13 g Na+ L−1 and 2.64 ± 0.08 g Na+ L−1, respectively. The effect of sodium on the activities of methanogens in the second-stage reactor in terms of HAc consumption is shown in Figure 1. The HAc substrate was chosen to focus study on the effect of sodium on acetate-utilizing methanogens, which was reported to be more sensitive to sodium inhibition than the hydrogen-utilizing methanogens [12].
The dose of 2318.43 ± 64.66 mg HAc L−1 was chosen as the baseline HAc concentration, under which concentration the methanogens showed the highest activity compared to the other concentrations (data not shown here). Rinema et al. [7] also emphasized that the diffusion limitation of low HAc concentration (500 mg HAc L−1) and the inhibition from high HAc concentration (4000–6000 mg HAc L1) could mask the inhibitory effect of sodium.
At sodium concentrations that are comparable with the usual sodium concentration (2.4 g Na+L1) applied on the second-stage reactor, the activity of methanogens on HAc consumption was not significantly affected, whereas it was 17%, 67% and 93% inhibited at higher sodium concentrations at 3.2, 5.1 and 7.3 g Na+ L−1, respectively. At a sodium concentration added to 9.1 g Na+ L−1, the methanogenic activity was completely inhibited. As the sodium concentration increased from 1.3 to 9.1 g Na+ L−1, the HAc degradation rates decreased from 7.09 mg to 0.06 mg HAc g−1VSS. Parallel to the HAc degradation, the total methane gas production also declined from 73.27 to 2.16 mL.

3.2. Viability of Methanogens Incubated with Sodium

The membrane-intact methanogens would be considered as viable. Methanosarcinaceae and Methanococcales were not detected in the sludge samples. The predominant viable methanogens were Methanomicrobiales, Methanosaetaceae and Methanobacteriales, with Methanomicrobiales as the most dominant. At the start of incubation (i.e., the 0th h), the archaeal 16s rRNA gene copies varied from 4.8 × 10⁷ to 6.8 × 10⁷ in the various test samples (i.e., 4.9 × 10⁷ DNA copies mL1 at a sodium concentration of 2.4 g Na+ L−1) (Figure 2a).
However, after 48 h incubation, the archaeal 16s rRNA gene copies ranged from 4.2 × 10⁷ DNA copies mL−1 at a sodium concentration of 1.3 g Na+L−1 to 3.2 × 10⁷ DNA copies mL−1 at a sodium concentration of 2.4 g Na+ L−1 and 2.7 × 10⁷ DNA copies mL−1 at a sodium concentration of 5.1 g Na+L−1(Figure 2b). Similarly, after 48 h incubation, there was an obvious downtrend in the quantity of viable Methanomicrobiales at higher added sodium concentrations (Figure 2).

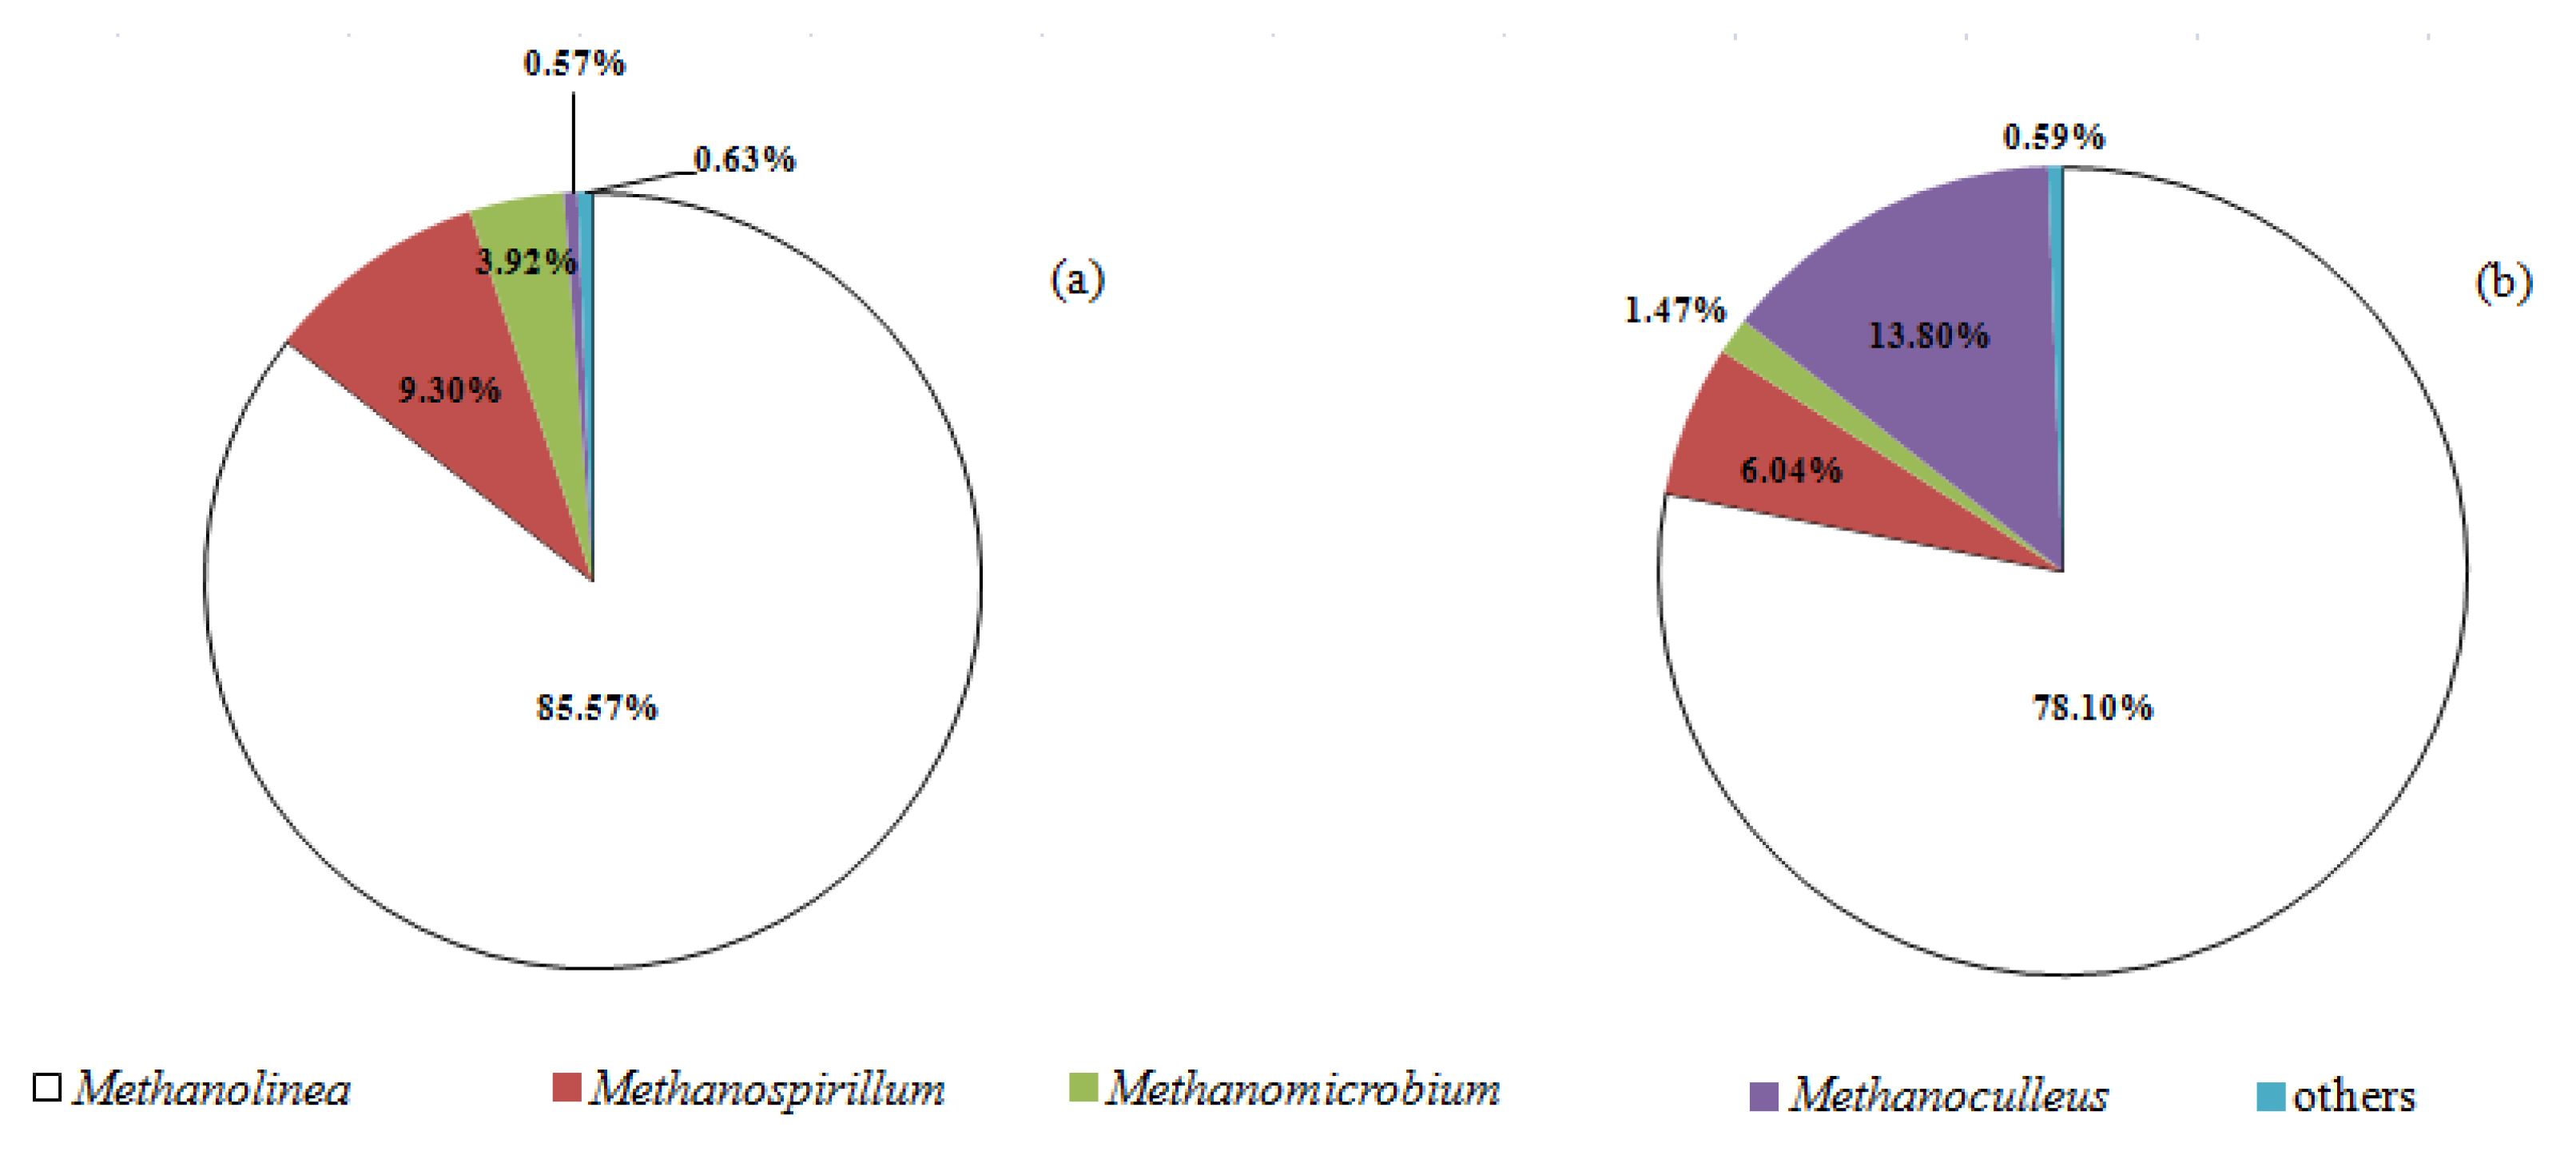
3.3. Microbial Shift of Biomass

The archaeal communities were dominated with more than 99% Methanomicrobiales in the biomass from both single-stage (99.36%) and second-stage (99.41%) reactors. Figure 3 compares the dominance of methanogens in the single-stage and second-stage reactors at genus level. Different abundances of methanogens were observed, i.e., the distribution of the Methanolinea genus was 85.57% in the single-stage reactor and 78.10% in the second-stage reactor. The significant difference was in Methanoculleus, which dominated 0.57% in the single-stage reactor and 13.80% in the second-stage reactor, while there was 3.92% of Methanomicrobium in the single-stage reactor and 1.47% of Methanomicrobium in the second-stage reactor.
Comparing the pyrosequencing analyzed bacterial data with the reported results of syntrophic acetate-oxidizing bacteria (SAOB) at the genus level, the results indicated that Thermacetogenium and Syntrophaceticus were absent in both single-stage and second-stage reactors; Thermotoga was absent in the single-stage reactor; however, it accounted for 0.02% of the whole bacterial community in the second-stage reactor, and Clostridium was 2.50% abundant in the single-stage reactor and 6.41% abundant in the second-stage reactor. The percentages reported herein are the proportion of a certain genus to the respective total archaeal/bacterial community.

3.4. Activity Evaluation of Biomass by ATP Test

After 48 h of incubation, the remaining total biomass activity was investigated with the specific ATP concentration measurement. The results are shown in Figure 4. The specific ATP concentration had a decreasing trend with the increasing sodium concentration. However, biomass incubated at a sodium concentration of 9.1 g Na+ L−1 for 48 h still had total biomass activity, as indicated by an ATP value of 16 µg g−1VSS, while biomass incubated at a sodium concentration of 2.4 g Na+ L−1 for 48 h showed a total biomass activity with an ATP value of 32 µg g−1VSS.

3.5. EPS Content of Biomass Incubated with Sodium

The EPS concentration reported herein would be the bounded EPS with the sum of its protein and carbohydrate concentrations [9]. Figure 5 shows the EPS concentrations at different sodium concentrations at the 6th and 48th h of the experiment. By subtracting the EPS concentration at the 6th from that at the 48th h in Figure 5, the total EPS concentrations were noted to be higher at higher sodium concentrations with increased total EPS concentrations of 1.03 mg g1VSS and 18.71 mg g1VSS at sodium concentrations of 1.3 and 9.1 g Na+ L1, respectively.
After 48 h of incubation, the ratio of EPS carbohydrate concentration to EPS protein concentration also increased compared with those at the 6th h of the experiment as indicated in Figure 6. For example, at a sodium concentration of 2.4 g Na+ L1, the ratio of EPS carbohydrate concentration to EPS protein concentration increased from 1.00 at the 6th h of incubation to 1.42 at the 48th h of incubation.

4. Discussion and Conclusions

4.1. Comparison of Tolerance to Sodium

With increased interest in the two-stage anaerobic digester [17], there is a need to extend the study on methanogen tolerance to sodium beyond the single-stage system. Information in literature indicated that the specific sodium inhibitory concentration on methanogens differed as substrate, reactor configuration, acclimation period, temperature and test method change. Such variation can be seen even in the conventional single-stage system as shown in Table 1 [5,7,9,37,38,39,40]. The sodium tolerance of methanogens could be improved by acclimating the biomass to higher sodium conditions [5,37] or by the presence of other cations through antagonistic/synergistic effects [5]. Step-wise exposure of methanogens to higher sodium concentrations improved their sodium tolerance [38,39].
The two-stage anaerobic digestion system is potentially more advantageous than the single-stage system with its improved organic solubilization rates, enhanced net energy production and greater pathogen kills [16]. The archaeal community in the methanogenic reactor of a two-stage anaerobic digester may be different and show greater stability to changes in feed conditions compared to the single-stage system [14]. In this study, 2.4 g Na+ L−1 sodium did not have an obvious inhibitory effect on the degradation rates of HAc (Figure 1), and this was higher than the 10% sodium inhibitory concentration indicated in Table 1 [7,9,41]. In the work of Ahring et al. [40], a range of 0.7–3 g Na+L−1 leading to 10% inhibition was observed due to the presence of Mg2+, which overcame the effect of Na+ inhibition to an extent.
As indicated in Figure 1, 3.2 g Na+ L−1 showed 17% inhibition on methanogenic activity. This was, not unexpectedly, even lower than the situation at 10% inhibitory sodium concentration with biomass acclimated to higher sodium concentrations [5,41] and with the presence of other cations [38,39]. In our preliminary experiment under similar operation conditions (Supplementary Data: Figure S1) without mitigating the effects of other cations, namely, without centrifugation of biomass in Section 2.2, 5.08 g Na+ L−1 showed unobservable inhibition on the methanogenic activity of biomass from the second-stage reactor. This value was higher than the widely accepted moderate sodium inhibitory concentration of 3.5–5.0 g Na+ L1 in the single-stage system [42].
The microbial shift within the population in the second-stage reactor could be a result and reason for the higher sodium tolerance. There are contradictory results in the literature on the dominant methanogens in the second-stage reactor of the two-stage anaerobic digester. Merlino et al. [14] reported Methanosaetaceae was the dominant methanogens in the second-stage reactor for the treatment of mixed swine slurry and market biowaste.
However, Shimada et al. [43] reported that Methanosarcinales and Methanomicrobiales were mainly affiliated with the methanogenic reactor of a separated system. In this study, results from both PMA-qPCR (Figure 2) and pyrosequencing techniques indicated the most abundant methanogen in the second-stage reactor was Methanomicrobiales (hydrogenotrophic methanogen). Although aceticlastic methanogenesis had been regarded as the main pathway of methane generation for a long time [44], recent observations [45,46,47,48] suggest that Methanomicrobiales is mainly responsible for biogas generation in anaerobic digestion of sludge, especially under harsh conditions.
With the long-term exposure of methanogens to a high sodium concentration derived from the first-stage reactor in this study’s system, the microbial shift of Methanomicrobiales, in the second-stage reactor differentiated from that in the single-stage reactor (Figure 3). The significant difference was the predominance of Methanoculleus, which was characterized with the S-layer cell envelope. The latter functioned as a protective coat against environmental stresses, such as high salinity [49].
HAc degradation can be carried out by either the aceticlastic methanogens or the acetate-oxidizing reaction [50]. Methanomicrobiales can be metabolically connected with SAOB to drive the final methanogenesis of HAc [51]. The strain AOR (nick-named “Reversibacter”) [52], Thermotoga lettingae [53], Clostridium ultunense [54], Thermacetogenium phaeum [55] and Syntrophaceticus schinkii [56] were isolated as the major SAOB in anaerobic digestion of different substrates [50].
The microbial shift towards a higher abundance of SAOB (Thermotoga and Clostridium) at the genus level, in association with the hydrogenotrophic methanogens, might also contribute to the higher degradation rate of HAc and then alleviate the inhibition (indicated as decreased HAc degradation rate) caused by sodium in the second-stage reactor. It was reported that higher abundance of SAOB associated with hydrogenotrophic methanogens were observed under stress conditions (i.e., high salinity) [57].

4.2. Sodium Inhibition Mechanism in the Second-Stage Reactor

A high sodium concentration would induce unbalanced osmotic pressure and cause microbial cells to dehydrate [58], which would then lead to cell death and process failure [59,60]. In this study, the sodium inhibition mechanism on biomass activity was further investigated by ATP measurement and an EPS test. As the currency of energy, ATP can be rapidly destroyed within dead cells [61]. ATP measurements were utilized to indicate the total biomass activity in the anaerobic digestion system [29]. The ATP content of sludge was reported to couple well with other common indicators in the anaerobic system, such as the VFA, biogas and sludge age during different operation stages [62].
In this two-stage anaerobic digester, as indicated in Figure 4, the increase in sodium concentration led to a decrease in the total biomass activity (i.e., the specific ATP concentration). The results from Chung and Neethling [63] support this conclusion with a decrease in ATP concentration that was observed after incubating the biomass with an inhibitory sodium concentration in a single-stage anaerobic system. At a high sodium concentration, the lower ATP value might be caused by the excess consumption of ATP to counteract the unbalanced Na+ concentration gradient across the cell membrane [64].
With the lower biomass activity at a higher sodium concentration, more EPS was produced. As indicated in Figure 5, during the periods of the 6th and 48th h, the increased EPS concentrations at higher sodium concentrations (5.1–9.1 g Na+ L−1) were higher than those at low sodium concentrations (1.3–3.2 g Na+ L−1). The results from Zou et al. [13] support this observation that more EPS was produced by bacteria when the NaCl concentrations increased from 0 to 20 g Na+ L−1. This increased EPS concentration could be utilized to counteract the osmotic disequilibrium conditions caused by sodium inhibition through supplying carbon and energy and absorbing nutrients, organic pollutants and heavy metals [26].
Liu and Buskey [65] also suggested that the increased EPS would be effective in providing a diffusion barrier for the cell walls, alleviating the unbalance of osmotic pressure around the cell membrane and mitigating the cell dehydration under high salinity conditions. The data from Figure 6 indicates that, during the incubation period of the 6th to 48th h, the EPS carbohydrate concentrations had a trend to increase at the 48th h compared with those at the 6th h in terms of the EPSc/EPSp ratio at all added sodium concentrations. The greater EPS carbohydrate fraction than the EPS protein might suggest that EPS carbohydrate would be crucial in resisting salt-shocking conditions. This could be supported by Zou et al. [13] and Zhang and Bishop [66], who also observed that, compared to protein, carbohydrate was the main contributor to the accumulated EPS.
The lower total biomass activity coupled with increased EPS concentration indicated that, although the produced EPS could be utilized to counteract the osmotic disequilibrium conditions, the residual ATP for the growth and maintenance of microorganism would be lower (Figure 4). This observation suggests that, at a higher sodium concentration (i.e., 9.1 g Na+ L1) (Figure 1), the methanogenic activity that was completely inhibited may relate to the low total biomass activity. The higher sodium tolerability of 2.4 g Na+ L1 may also be related to the higher total biomass activity of 33 ug g1 VSS ATP. The present data may suggest that ATP measurements could serve as a useful indicator for sodium inhibition on microorganisms.
This study indicated a higher sodium tolerance in the second-stage of a two-stage anaerobic digester from the aspects of the HAc degradation rate, biomass activity, viable methanogens and microbial shift with a higher abundance of Thermotoga, Clostridium and Methanoculleus. The higher sodium tolerance in the two-stage anaerobic digester raised the possibility for applying the two-stage anaerobic digester for treating wastes containing high sodium ions as in food wastes in the Asian food industry context.

Supplementary Materials

The following supporting information can be downloaded at: https://www.mdpi.com/article/10.3390/app12030956/s1. Figure S1. HAc degradation rate by methanogens from the second-stage reactor at different initial added sodium concentrations without centrifugation of the biomass.

Author Contributions

K.X. Conduct experiments, collect data, and write the paper, and was responsible for the conception, design, analysis and writing of this study; Y.M. Conduct qPCR test. Y.Z. Give good comments on the manuscript; C.G. Give good comments on the manuscript; W.J.N. Give good comments on the manuscript, and provide funding. All authors have read and agreed to the published version of the manuscript.

Funding

The authors would like to thank the National Natural Science Foundation of China (No. 52170133). The authors would also like to thank the Singapore National Research Foundation for providing funding for the project “Wastewater Treatment Plants as Urban Eco Power Stations”.

Conflicts of Interest

The authors declare no conflict of interest.

Abbreviations

Ar Argon
CH4 Methane
CO2Carbon Dioxide
CODChemical Oxygen Demand
CSTR Continuous Stirred Tank Reactor
EPSExtracellular Polymeric Substances
EPScThe Carbohydrate Composition of Extracellular Polymeric Substances
EPSp The Protein Composition of Extracellular Polymeric Substances
GCGas Chromatography
H2Hydrogen
HAc Acetic Acid
HeHelium
HRT Hydraulic Retention Time
N2Nitrogen
Na2CO3Sodium Carbonate
NaHCO3 Sodium Bicarbonate
NaOH Sodium Hydroxide
O2 Oxygen
PCRPolymerase Chain Reaction
PMA Propidium Monoazide
qPCRQuantitative Polymerase Chain Reaction
SAOB Syntrophic Acetate Oxidizing Bacteria
TCODTotal Chemical Oxygen Demand
TCD Thermal Conductivity Detector
VFA Volatile Fatty Acids
VSS Volatile Suspended Solids

References

  1. Li, H.; Li, C.; Liu, W.; Zou, S. Optimized alkaline pretreatment of sludge before anaerobic digestion. Bioresour. Technol. 2012, 123, 189–194. [Google Scholar] [CrossRef]
  2. Lin, Y.; Wang, D.; Wu, S.; Wang, C. Alkali pretreatment enhances biogas production in the anaerobic digestion of pulp and paper sludge. J. Hazard. Mater. 2009, 170, 366–373. [Google Scholar] [CrossRef]
  3. Heo, N.H.; Park, S.C.; Lee, J.S.; Kang, H. Solubilization of waste activated sludge by alkaline pretreatment and biochemical methane potential (BMP) tests for anaerobic co-digestion of municipal organic waste. Water Sci. Technol. J. Int. Assoc. Water Pollut. Res. 2003, 48, 211–219. [Google Scholar] [CrossRef]
  4. Saiki, Y.; Imabayashi, S.; Iwabuchi, C.; Kitagawa, Y.; Okumura, Y.; Kawamura, H. Solubilization of excess activated sludge by self-digestion. Water Res. 1999, 33, 1864–1870. [Google Scholar] [CrossRef]
  5. Feijoo, G.; Soto, M.; Méndez, R.; Lema, J.M. Sodium inhibition in the anaerobic digestion process: Antagonism and adaptation phenomena. Enzym. Microb. Technol. 1995, 17, 180–188. [Google Scholar] [CrossRef]
  6. Hao, X.; Zhou, M.; Yu, H.; Shen, Q.; Lei, L. Effect of Sodium Ion Concentration on Hydrogen Production from Sucrose by Anaerobic Hydrogen-producing Granular Sludge. Chin. J. Chem. Eng. 2006, 14, 511–517. [Google Scholar] [CrossRef]
  7. Rinzema, A.; van Lier, J.; Lettinga, G. Sodium inhibition of acetoclastic methanogens in granular sludge from a UASB reactor. Enzym. Microb. Technol. 1988, 10, 24–32. [Google Scholar] [CrossRef]
  8. Liu, Y.; Boone, D.R. Effects of salinity on methanogenic decomposition. Bioresour. Technol. 1991, 35, 271–273. [Google Scholar] [CrossRef]
  9. Chen, W.H.; Han, S.K.; Sung, S. Sodium inhibition of thermophilic methanogens. J. Environ. Eng. 2003, 129, 506–512. [Google Scholar] [CrossRef]
  10. Bahareh, K.; Babak, B.; Shahrzad, F. The effect of salt on the performance and characteristics of a combined anaerobic–aerobic biological process for the treatment of synthetic wastewaters containing Reactive Black 5. Chem. Eng. J. 2013, 221, 363–372. [Google Scholar]
  11. Kargi, F.; Dincer, A.R. Effect of salt concentration on biological treatment of saline wastewater by fed-batch operation. Enzym. Microb. Technol. 1996, 19, 529–537. [Google Scholar] [CrossRef]
  12. Dinçer, A.R.; Kargi, F. Performance of rotating biological disc system treating saline wastewater. Process Biochem. 2001, 36, 901–906. [Google Scholar] [CrossRef]
  13. Onodera, T.; Sase, S.; Choeisai, P.; Yoochatchaval, W.; Sumino, H.; Yamaguchi, T.; Ebie, Y.; Xu, K.; Tomioka, N.; Mizuochi, M.; et al. Development of a treatment system for molasses wastewater: The effects of cation inhibition on the anaerobic degradation process. Bioresour. Technol. 2013, 131, 295–302. [Google Scholar] [CrossRef] [PubMed]
  14. Zou, X.; Xu, K.; Ding, L.; Ren, H. Effect of salinity on extracellular polymeric substances (EPS) and soluble microbial products (SMP) in anaerobic sludge systems. Fresenius Environ. Bull. 2009, 18, 1456–1461. [Google Scholar]
  15. Merlino, G.; Rizzi, A.; Schievano, A.; Tenca, A.; Scaglia, B.; Oberti, R.; Adani, F.; Daffonchio, D. Microbial community structure and dynamics in two-stage vs single-stage thermophilic anaerobic digestion of mixed swine slurry and market bio-waste. Water Res. 2013, 47, 1983–1995. [Google Scholar] [CrossRef] [PubMed]
  16. Zuo, Z.; Wu, S.; Zhang, W.; Dong, R. Effects of organic loading rate and effluent recirculation on the performance of two-stage anaerobic digestion of vegetable waste. Bioresour. Technol. 2013, 146, 556–561. [Google Scholar] [CrossRef]
  17. Nasr, N.; Elbeshbishy, E.; Hafez, H.; Nakhla, G.; Hesham El Naggar, M. Comparative assessment of single-stage and two-stage anaerobic digestion for the treatment of thin stillage. Bioresour. Technol. 2012, 111, 122–126. [Google Scholar] [CrossRef] [Green Version]
  18. Orozco, A.M.; Nizami, A.S.; Murphy, J.D.; Groom, E. Optimizing the thermophilic hydrolysis of grass silage in a two-phase anaerobic digestion system. Bioresour. Technol. 2013, 143, 117–125. [Google Scholar] [CrossRef] [PubMed]
  19. Kyazze, G.; Dinsdale, R.; Guwy, A.J.; Hawkes, F.R.; Premier, G.C.; Hawkes, D.L. Performance characteristics of a two-stage dark fermentative system producing hydrogen and methane continuously. Biotechnol. Bioeng. 2007, 97, 759–770. [Google Scholar] [CrossRef] [PubMed]
  20. Xiao, K.K.; Guo, C.H.; Zhou, Y.; Maspolim, Y.; Wang, J.Y.; Ng, W.J. Acetic acid inhibition on methanogens in a two-phase anaerobic process. Biochem. Eng. J. 2013, 75, 1–7. [Google Scholar] [CrossRef]
  21. Dulbecco, R.; Vogt, M. Plaque formation and isolation of pure lines with poliomyelitis viruses. J. Exp. Med. 1954, 99, 167–182. [Google Scholar] [CrossRef] [PubMed] [Green Version]
  22. Sandroni, V.; Smith, C.; Donovan, A. Microwave digestion of sediment, soils and urban particulate matter for trace metal analysis. Talanta 2003, 60, 715–723. [Google Scholar] [CrossRef]
  23. APHA. Standard Methods for the Examination of Water and Wastewater, 21st ed.; American Water Work Association: Washington, DC, USA, 2005. [Google Scholar]
  24. Zhou, Y.; Ganda, L.; Lim, M.; Yuan, Z.; Kjelleberg, S.; Ng, W.J. Free nitrous acid (FNA) inhibition on denitrifying poly-phosphate accumulating organisms (DPAOs). Appl. Microbiol. Biotechnol. 2010, 88, 359–369. [Google Scholar] [CrossRef] [PubMed]
  25. Harish, V.; Youming, T.; Maszenan bin Abdul, M.; Santosh, P.; Antonius Yudi, S.; Dongzhe, L.; Jerry Jian Lin, L.; Yan, Z.; Wun Jern, N. Effect of a high strength chemical industry wastewater on microbial community dynamics and mesophilic methane generation. J. Environ. Sci. 2014, 26, 875–884. [Google Scholar]
  26. Chang, I.-S.; Lee, C.-H. Membrane filtration characteristics in membrane-coupled activated sludge system—The effect of physiological states of activated sludge on membrane fouling. Desalination 1998, 120, 221–233. [Google Scholar] [CrossRef]
  27. Sheng, G.P.; Yu, H.Q.; Yue, Z.B. Factors influencing the production of extracellular polymeric substances by Rhodopseudomonas acidophila. Int. Biodeterior. Biodegrad. 2006, 58, 89–93. [Google Scholar] [CrossRef]
  28. DuBois, M.; Gilles, K.A.; Hamilton, J.K.; Rebers, P.A.; Smith, F. Colorimetric Method for Determination of Sugars and Related Substances. Anal. Chem. 1956, 28, 350–356. [Google Scholar] [CrossRef]
  29. Lowry, O.H.; Rosebrough, N.J.; Farr, A.L.; Randall, R.J. Protein measurement with the Folin phenol reagent. J. Biol. Chem. 1951, 193, 265–275. [Google Scholar] [CrossRef]
  30. Shanmugam, P.; Horan, N.J. Simple and rapid methods to evaluate methane potential and biomass yield for a range of mixed solid wastes. Bioresour. Technol. 2009, 100, 471–474. [Google Scholar] [CrossRef]
  31. Chen, H. ATP as an indicator of biomass activity in thermophilic upflow anaerobic sludge blanket reactor. J. Environ. Sci. 2000, 12, 380–384. [Google Scholar]
  32. Hwang, S.; Hansen, C.L. Evaluating a correlation between volatile suspended solid and adenosine 5′-triphosphate levels in anaerobic treatment of high organic suspended solids wastewater. Bioresour. Technol. 1998, 63, 243–250. [Google Scholar] [CrossRef]
  33. Nocker, A.; Camper, A.K. Selective removal of DNA from dead cells of mixed bacterial communities by use of ethidium monoazide. Appl.Environ. Microbiol. 2006, 72, 1997–2004. [Google Scholar] [CrossRef] [Green Version]
  34. Nocker, A.; Sossa-Fernandez, P.; Burr, M.D.; Camper, A.K. Use of propidium monoazide for live/dead distinction in microbial ecology. Appl. Environ. Microbiol. 2007, 73, 5111–5117. [Google Scholar] [CrossRef] [Green Version]
  35. Nocker, A.; Cheung, C.Y.; Camper, A.K. Comparison of propidium monoazide with ethidium monoazide for differentiation of live vs. dead bacteria by selective removal of DNA from dead cells. J. Microbiol. Methods 2006, 67, 310–320. [Google Scholar] [CrossRef] [PubMed]
  36. Bae, S.; Wuertz, S. Discrimination of viable and dead fecal Bacteroidales bacteria by quantitative PCR with propidium monoazide. Appl. Environ. Microbiol. 2009, 75, 2940–2944. [Google Scholar] [CrossRef] [Green Version]
  37. Yu, Y.; Lee, C.; Kim, J.; Hwang, S. Group-specific primer and probe sets to detect methanogenic communities using quantitative real-time polymerase chain reaction. Biotechnol. Bioeng. 2005, 89, 670–679. [Google Scholar] [CrossRef]
  38. Kugelman, I.J.; Chin, K.K. Toxicity, synergism, and antagonism in anaerobic waste treatment processes. Adv. Chem. Ser. 1971, 105, 55–90. [Google Scholar]
  39. Kugelman, I.J.; McCarty, P.L. Cation Toxicity and Stimulation in Anaerobic Waste Treatment; Water Pollution Control Federation, Department of Civil Engineering, New York University: New York, NY, USA, 1965. [Google Scholar]
  40. Ahring, B.; Alatriste-Mondragon, F.; Westermann, P.; Mah, R. Effects of cations on Methanosarcina thermophila TM-1 growing on moderate concentrations of acetate: Production of single cells. Appl. Microbiol. Biotechnol. 1991, 35, 686–689. [Google Scholar] [CrossRef]
  41. Soto, M.; Méndez, R.; Lema, J.M. Sodium inhibition and sulphate reduction in the anaerobic treatment of mussel processing wastewaters. J. Chem. Technol. Biotechnol. 1993, 58, 1–7. [Google Scholar] [CrossRef]
  42. Chen, Y.; Cheng, J.J.; Creamer, K.S. Inhibition of anaerobic digestion process: A review. Bioresour. Technol. 2008, 99, 4044–4064. [Google Scholar] [CrossRef]
  43. Shimada, T.; Morgenroth, E.; Tandukar, M.; Pavlostathis, S.G.; Smith, A.; Raskin, L.; Kilian, R.E. Syntrophic acetate oxidation in two-phase (acid-methane) anaerobic digesters. Water Sci. Technol. J. Int. Assoc. Water Pollut. Res. 2011, 64, 1812–1820. [Google Scholar] [CrossRef] [PubMed]
  44. Walter, A.; Knapp, B.A.; Farbmacher, T.; Ebner, C.; Insam, H.; Franke-Whittle, I.H. Searching for links in the biotic characteristics and abiotic parameters of nine different biogas plants. Microb. Biotechnol. 2012, 5, 717–730. [Google Scholar] [CrossRef] [PubMed]
  45. Bialek, K.; Kim, J.; Lee, C.; Collins, G.; Mahony, T.; O’Flaherty, V. Quantitative and qualitative analyses of methanogenic community development in high-rate anaerobic bioreactors. Water Res. 2011, 45, 1298–1308. [Google Scholar] [CrossRef]
  46. O’Reilly, J.; Lee, C.; Collins, G.; Chinalia, F.; Mahony, T.; O’Flaherty, V. Quantitative and qualitative analysis of methanogenic communities in mesophilically and psychrophilically cultivated anaerobic granular biofilims. Water Res. 2009, 43, 3365–3374. [Google Scholar] [CrossRef]
  47. Jaenicke, S.; Ander, C.; Bekel, T.; Bisdorf, R.; Droge, M.; Gartemann, K.H.; Junemann, S.; Kaiser, O.; Krause, L.; Tille, F.; et al. Comparative and joint analysis of two metagenomic datasets from a biogas fermenter obtained by 454-pyrosequencing. PLoS ONE 2011, 6, e14519. [Google Scholar] [CrossRef] [PubMed] [Green Version]
  48. Kim, J.; Kim, W.; Lee, C. Absolute dominance of hydrogenotrophic methanogens in full-scale anaerobic sewage sludge digesters. J. Environ. Sci. 2013, 25, 2272–2280. [Google Scholar] [CrossRef]
  49. Claus, H.; Akca, E.; Debaerdemaeker, T.; Evrard, C.; Declercq, J.P.; Konig, H. Primary structure of selected archaeal mesophilic and extremely thermophilic outer surface layer proteins. Syst. Appl. Microbiol. 2002, 25, 3–12. [Google Scholar] [CrossRef] [PubMed] [Green Version]
  50. Hattori, S. Syntrophic acetate-oxidizing microbes in methanogenic environments. Microbes Environ. JSME 2008, 23, 118–127. [Google Scholar] [CrossRef] [PubMed] [Green Version]
  51. Guo, X.; Wang, C.; Sun, F.; Zhu, W.; Wu, W. A comparison of microbial characteristics between the thermophilic and mesophilic anaerobic digesters exposed to elevated food waste loadings. Bioresour. Technol. 2014, 152, 420–428. [Google Scholar] [CrossRef]
  52. Lee, M.J.; Zinder, S.H. Isolation and Characterization of a Thermophilic Bacterium Which Oxidizes Acetate in Syntrophic Association with a Methanogen and Which Grows Acetogenically on H(2)-CO(2). Appl. Environ. Microbiol. 1988, 54, 124–129. [Google Scholar] [CrossRef] [Green Version]
  53. Balk, M.; Weijma, J.; Stams, A.J. Thermotoga lettingae sp. nov., a novel thermophilic, methanol-degrading bacterium isolated from a thermophilic anaerobic reactor. Int. J. Syst. Evol. Microbiol. 2002, 52, 1361–1368. [Google Scholar]
  54. Schnurer, A.; Schink, B.; Svensson, B.H. Clostridium ultunense sp. nov., a mesophilic bacterium oxidizing acetate in syntrophic association with a hydrogenotrophic methanogenic bacterium. Int. J. Syst. Bacteriol. 1996, 46, 1145–1152. [Google Scholar] [CrossRef] [PubMed]
  55. Hattori, S.; Kamagata, Y.; Hanada, S.; Shoun, H. Thermacetogenium phaeum gen. nov., sp. nov., a strictly anaerobic, thermophilic, syntrophic acetate-oxidizing bacterium. Int. J. Syst. Evol. Microbiol. 2000, 50 Pt 4, 1601–1609. [Google Scholar] [CrossRef]
  56. Westerholm, M.; Roos, S.; Schnurer, A. Syntrophaceticus schinkii gen. nov., sp. nov., an anaerobic, syntrophic acetate-oxidizing bacterium isolated from a mesophilic anaerobic filter. FEMS Microbiol. Lett. 2010, 309, 100–104. [Google Scholar] [CrossRef] [Green Version]
  57. Wu, J.; Zhang, H.; He, P.-J.; Shao, L.-M. Insight into the heavy metal binding potential of dissolved organic matter in MSW leachate using EEM quenching combined with PARAFAC analysis. Water Res. 2011, 45, 1711–1719. [Google Scholar] [CrossRef]
  58. de Baere, L.A.; Devocht, M.; Van Assche, P.; Verstraete, W. Influence of high NaCl and NH4Cl salt levels on methanogenic associations. Water Res. 1984, 18, 543–548. [Google Scholar] [CrossRef]
  59. Kargi, F.; Dinçer, A.R. Saline Wastewater Treatment By Halophile-Supplemented Activated Sludge Culture in an Aerated Rotating Biodisc Contactor. Enzym. Microb. Technol. 1998, 22, 427–433. [Google Scholar] [CrossRef]
  60. Kempf, B.; Bremer, E. Uptake and synthesis of compatible solutes as microbial stress responses to high-osmolality environments. Arch. Microbiol. 1998, 170, 319–330. [Google Scholar] [CrossRef] [PubMed]
  61. Mitchell, P. Chemiosmotic coupling in oxidative and photosynthetic phosphorylation. Biochim. Biophys. Acta (BBA)-Bioenerg. 2011, 1807, 1507–1538. [Google Scholar] [CrossRef] [PubMed] [Green Version]
  62. Chung, Y.-C.; Neethling, J.B. Microbial activity measurement for anaerobic sludge digestion. Water Pollut. Control Fed. 1989, 61, 343–349. [Google Scholar]
  63. Chung, Y.C.; Neethling, J.B. ATP as a measure of anaerobic sludge digester activity. Water Environ. Fed. 1988, 60, 107–112. [Google Scholar]
  64. Myoung-Joo, L.; Tae-Hyeong, K.; Booki, M.; Sun-Jin, H. Sodium(Na+) concentration effects on metabolic pathway and estimation of ATP use in dark fermentation hydrogen production through stoichiometric analysis. J. Environ. Manag. 2012, 108, 22–26. [Google Scholar]
  65. Liu, H.; Buskey, E.J. Hypersalinity enhances the production of extracellular polymeric substance (eps) in the texas brown tide alga, aureoumbra lagunensis (PELAGOPHYCEAE). J. Phycol. 2000, 36, 71–77. [Google Scholar] [CrossRef]
  66. Zhang, X.; Bishop, P.L. Spatial distribution of extracellular polymeric substances in biofilms. J. Environ. Eng. 2001, 127, 850–856. [Google Scholar] [CrossRef]
Figure 1. The HAc degradation rate and the corresponding methane production at different sodium concentrations for biomass in the second-stage reactor.
Applsci 12 00956 g001
Figure 2. 16s rRNA gene copy quantification by PMA-qPCR, targeting archaea, bacteria, Methanobacteriales, Methanomicrobiales and Methanosaetaceae at the (a) 0th h and (b) 48th h of experiment.
Applsci 12 00956 g002
Figure 3. Comparison of the relative methanogen abundance (at the genus level) in the single-stage (a) and second-stage (b) reactors; phylogenetic groups at the genus level with percentage less than 0.5% are classified as the artificial “others”.
Applsci 12 00956 g003
Figure 4. Specific ATP concentration of the biomass from the second-stage reactor after 48 h of incubation.
Applsci 12 00956 g004
Figure 5. The increased EPS concentrations as a function of different sodium concentrations at the 6th and 48th h of the experiment.
Applsci 12 00956 g005
Figure 6. The ratio of EPS carbohydrate to EPS protein (EPSc/EPSp) as a function of different sodium concentrations at the 6th and 48th h of the experiment.
Applsci 12 00956 g006
Table 1. Summary of sodium inhibitory concentration on methanogens in single-stage systems.
Test
Substrate
MicroorganismsTest SystemSodium Concentration (g Na+L−1)Sodium Concentration (g Na+L1) Leading to 10% InhibitionReferences
HAcMixed culture,
presumably
Methanosarcinaceae
CSTR, shock exposure1.154.8[39]
HAcMixed culture,
presumably Methanosarcinaceae
CSTR, continuous exposure0.466.1[38]
HAcMixed cultureAnaerobic sequencing
batch reactors, 55 °C
01.3[37]
HAcMixed cultureAnaerobic sequencing batch reactors, 55 °C4.11.6[7]
HAcMixed cultureAnaerobic sequencing batch reactors, 55 °C7.11[7]
HAcMixed cultureAnaerobic sequencing batch reactors, 55 °C121.2[7]
HAcMixed cultureUp-flow anaerobic sludge blanket, 30 °C104.8[7]
HAcMixed cultureAnaerobic filter, 37 °C5–108.5[5]
HPrMixed cultureAnaerobic filter, 37 °C5–105.0[5]
HBuMixed cultureAnaerobic filter, 37 °C5–1012.5[5]
HAcMethanosarcina thermophilaBatch study, 52 °C1.150.7–3[40]
VFAMixed cultureAnaerobic filter, 37 °C109.0[41]
Publisher’s Note: MDPI stays neutral with regard to jurisdictional claims in published maps and institutional affiliations.

