1. Introduction
The unprecedented development in information and communication technology (ICT) has caused the production of massive volumes of digital data. This phenomenon encouraged academics and practitioners to search for unconventional means to benefit from analyzing this data in several domains. This reliance on ICT and leveraging digital data analysis is referred to as “digital transformation.” The smart city (SC) is one of the recently adopted concepts that rely mainly on digital transformation to realize city smartness. ICT is essential for realizing city smartness. The infusion of ICT in a smart city is analogous to the human body’s nervous system. In the nervous system, data are timely collected (sensed) from different body systems, transmitted to the brain for storage, analysis, concluding the feasible reactions, and then taking the appropriate decision. Through this analogy between the human body and the smart city concept, the smart city is viewed as a holistic system of systems. The diffusion of ICT artifacts produces vast volumes of digital data. These data are a mixture of structured, semi-structured, and unstructured data referred to as “big data” (BD). In addition to its voluminousness, BD is also characterized by its velocity, variety, and veracity. A common trend supported by successful practices is that if these big data are appropriately captured, cleaned, and analyzed, we can extract valuable unknown information and potential insight.
The process of extracting fact-based information and insights from BD is known as big data analytics (BDA). This is the intersection between the two themes of SC and BDA [
1,
2,
3]. The raw data collected from different SC domains is transformed into actionable information for the benefit of SC stakeholders. In this context, it is important to draw attention to the fact that harnessing BDA to extract insights and latent information is a general concept and applicable to many fields, of which smart cities are one. However, BDA contributes to several domains such as energy [
4], environment [
5], transportation [
6], law enforcement [
7], healthcare [
8], and decision-making [
9,
10]. In this context, BDA serves a diversity of stakeholders and decision-makers, such as strategic planners, governors, mayors, and inhabitants [
11,
12,
13,
14].
Although the relation between SCs, BDA, and decision-making has been studied thoroughly in the literature [
7,
8,
9,
10], research articles that address the tangible experiences from actual case studies are still required. Tackling this scarcity of case study research is the motive of the present research, which entails addressing the interrelationship between the three principal pillars: SCs, BDA, and decision-making. Filling this gap will shed light on the challenges and design principles that should be considered when designing a BDA artifact in the domain of smart cities. In addition, it helps to reveal how BDA can contribute to the decision-making process.
Although the human brain is a powerful organ capable of processing reasonable amounts of information, it suffers from a tendency to rely on previous experience and intuition (cognitive bias) [
15,
16]. This is one of the traditional problems that influence the efficiency of the decisions taken by decision-makers. A modern trend to overcome this problem is the use of BDA to support decision-makers. BDA contributes to providing decision-makers with latent relationships and facts that cannot be deduced easily by the human mind. This helps the decision-makers make effective decisions based on realistic analytical foundations. In this article, we investigate how the exploitation of BDA, as a data-driven decision-making enabler, influences the efficiency of decisions. Research beneficiaries include strategic decision-makers such as mayors, municipal councils, planners, and citizens.
The research question that drives this article is how BDA, as a data-driven decision-making enabler, influences decision-making in smart cities. To answer the research question, we opt to develop ensemble software artifacts in the form of flexible monitoring dashboards. In this context, we follow the design science research approach proposed in [
17]. Ensemble artifacts are defined as “
the material and organizational features that are socially recognized as bundles of hardware and software” [
17,
18]. The authors in [
19] presented a good example of developing ensemble artifacts in the field of unit load device (ULD) management and planning. In light of the outcome results of the design step, we investigate the impact of utilizing BDA on the efficiency of decision-making by developing and implementing a decision-support tool for an actual national digital transportation project in Egypt.
The rest of this paper is structured as follows: the related work follows this Introduction.
Section 3 is a comprehensive section presenting the methodology, material, and methods. Analysis of results is presented in
Section 4.
Section 5 is the conclusion, followed by a discussion of limitations and future research directions in
Section 6.
2. Related Work
The utilization of BDA as a decision-making enabler in smart cities has been addressed in the literature from two perspectives [
20,
21]. The first perspective deals with BDA implementation in a specific domain, while the second perspective deals with technological aspects. From an application perspective, BDA utilization has been addressed in various smart city domains, such as planning [
3,
10,
22,
23], traffic control and transportation [
24,
25], crime analysis [
7], energy [
26], environment [
27], healthcare [
8,
14,
28], and logistics [
19]. A direct and intuitive way to evaluate the impact of incorporating BDA in decision-making on the efficiency of the decision taken is to track a quantified performance measure indicator (e.g., processing time, service cost) before and after applying the decisions.
From the technological perspective, the authors of [
29] presented ideas for processing large amounts of historical data in parallel with real-time data analysis, emphasizing data quality control. From a technical point of view, BDAFSC can be implemented using horizontally scalable platforms such as the Hadoop ecosystem.
Finally, the authors in [
30] introduced a domain-independent BDA framework called SCDAP. SCDAP is a three-tier, domain-independent, end-to-end BDA framework for SC. SCDAP’s logical design is based on six principles: a layered design approach, standardized data acquisition, access, real-time and historical data analysis, iterative and sequential data processing, and extracted model management and aggregation.
3. Methodology, Material, and Methods
In this study, we apply a case study analysis methodology to assess the impact of incorporating BDA as a data-driven decision-support (DDDS) tool in one of the nationwide digital transformation projects in Egypt called Nafeza (
https://www.nafeza.gov.eg/en (accessed on 19 November 2021)) [
30]. Although Nafeza is not marked explicitly as a smart city project, it shares many characteristics with smart city projects. Nafeza is considered a significant pillar in Egypt’s digital transformation program towards a smart economy from a business perspective. Additionally, it services a wide range of decision makers and thousands of national and international users. On the other hand, from a technical standpoint, the Nafeza platform is designed as a horizontally scalable platform that accommodates structured, semi-structured, and unstructured data [
31]. The Nafeza platform leverages cutting-edge technologies such as blockchain, digital signature, and robotic process automation (RPA). In the following subsection, we shed light on the business detail of the selected case study, approach, method, data sources, and software tools. In this regard, it is worth noting that this article belongs to the research of the first perspective mentioned in the previous section, that is, BDA implementation in a specific domain.
3.1. Business Background
Nafeza is the Egyptian national platform for foreign trade facilitation. The principal objective of Nafeza design is twofold. From one side, it enables foreign trade stakeholders (shipping lines, importers, exporters, and brokers) to submit the necessary documents (either hard or soft copies) to release imports and exports through a single entry point (a single window). On the other side, it streamlines and governs foreign trade procedures (importation and exportation). Then, the clearance procedures continue with controlled human intervention to maintain transparency. The time elapsed between the official registration of the clearance documents until the final approval to release goods is referred to as clearance time. Clearance time is a commonly recognized performance index [
32]. Maintaining the balance between preserving the governance of procedures and reducing the clearance time is a foremost challenge for the Nafeza. In this context, it is worth mentioning that the clearance procedures are compound and overlapping. These procedures include document review, compliance inspection for incoming and outgoing goods, and laboratory analyses in some cases. It is also worth noting that many official bodies are involved in the release process. Customs comes at the forefront of these authorities and many other regulatory authorities (other governmental agencies—OGAs).
Figure 1 shows a simplified process diagram of the clearance process.
To achieve its objectives, Nafeza provides a full suite of integrated software components that automate the processes of the governmental parties involved in the clearance procedures for Customs and OGAs. Nafeza’s software components include (and are not limited to) processing of the single administrative document (SAD), inspection, valuation, approvals from OGAs, risk management, business intelligence, and data analytics components. For simplicity, we will refer to the business intelligence and data analytics components of Nafeza as data analytics for the remainder of this article.
Nafeza services are provided to the foreign trade community and all bodies involved in the exportation and importation clearance procedures, including Customs and OGAs, through an extensive network of logistics centers.
Recalling that maintaining the balance between preserving the governance of procedures and reducing the clearance time is a foremost challenge for Nafeza, the following question intuitively imposes itself: How can data analytics help decision-makers take decisions that effectively contribute to achieving this balance? Generically, this question is rephrased in the research question: How does BDA influence decision-making in smart cities as a data-driven decision-making enabler? Unquestionably, relying on business intelligence and data analytics is the rational approach to deal with this question.
The case study of this research represents an actual contribution of the author with the BI team in the firm responsible for the development, deployment, and implementation of Nafeza. Within the scope of this contribution, we developed a data analytics system for monitoring daily business operations to identify any stumbling block that negatively affects the clearance time in the logistic centers. The essence of this task is providing decision-makers with fact-based information to help make the necessary decisions to improve (i.e., reduce) the clearance time. In other words, it allows this firm to transform into a data-driven organization. Providing helpful, fact-based information seamlessly in a way that is understandable to decision-makers is a considerable challenge faced during this mission. In this context, it is worth noting that we deal with three levels of decision-makers, namely, strategic, operational, and public. The strategic level includes the top-level management of the ministries concerned with foreign trade and the firm’s board of directors responsible for Nafeza. The operational level includes the operations managers in the logistics centers. Finally, the public level includes the foreign trade community (shipping lines, foreign traders, brokers, etc.).
3.2. Data Sources
The primary data source for the targeted data analytics system is the raw foreign trade operational data collected through Nafeza. These data are used to populate an enterprise data warehouse (i.e., Nafeza data warehouse) composed of several data marts designed to answer business inquiries from different aspects (e.g., performance, trade volumes, and financials).
3.3. Materials and Methods
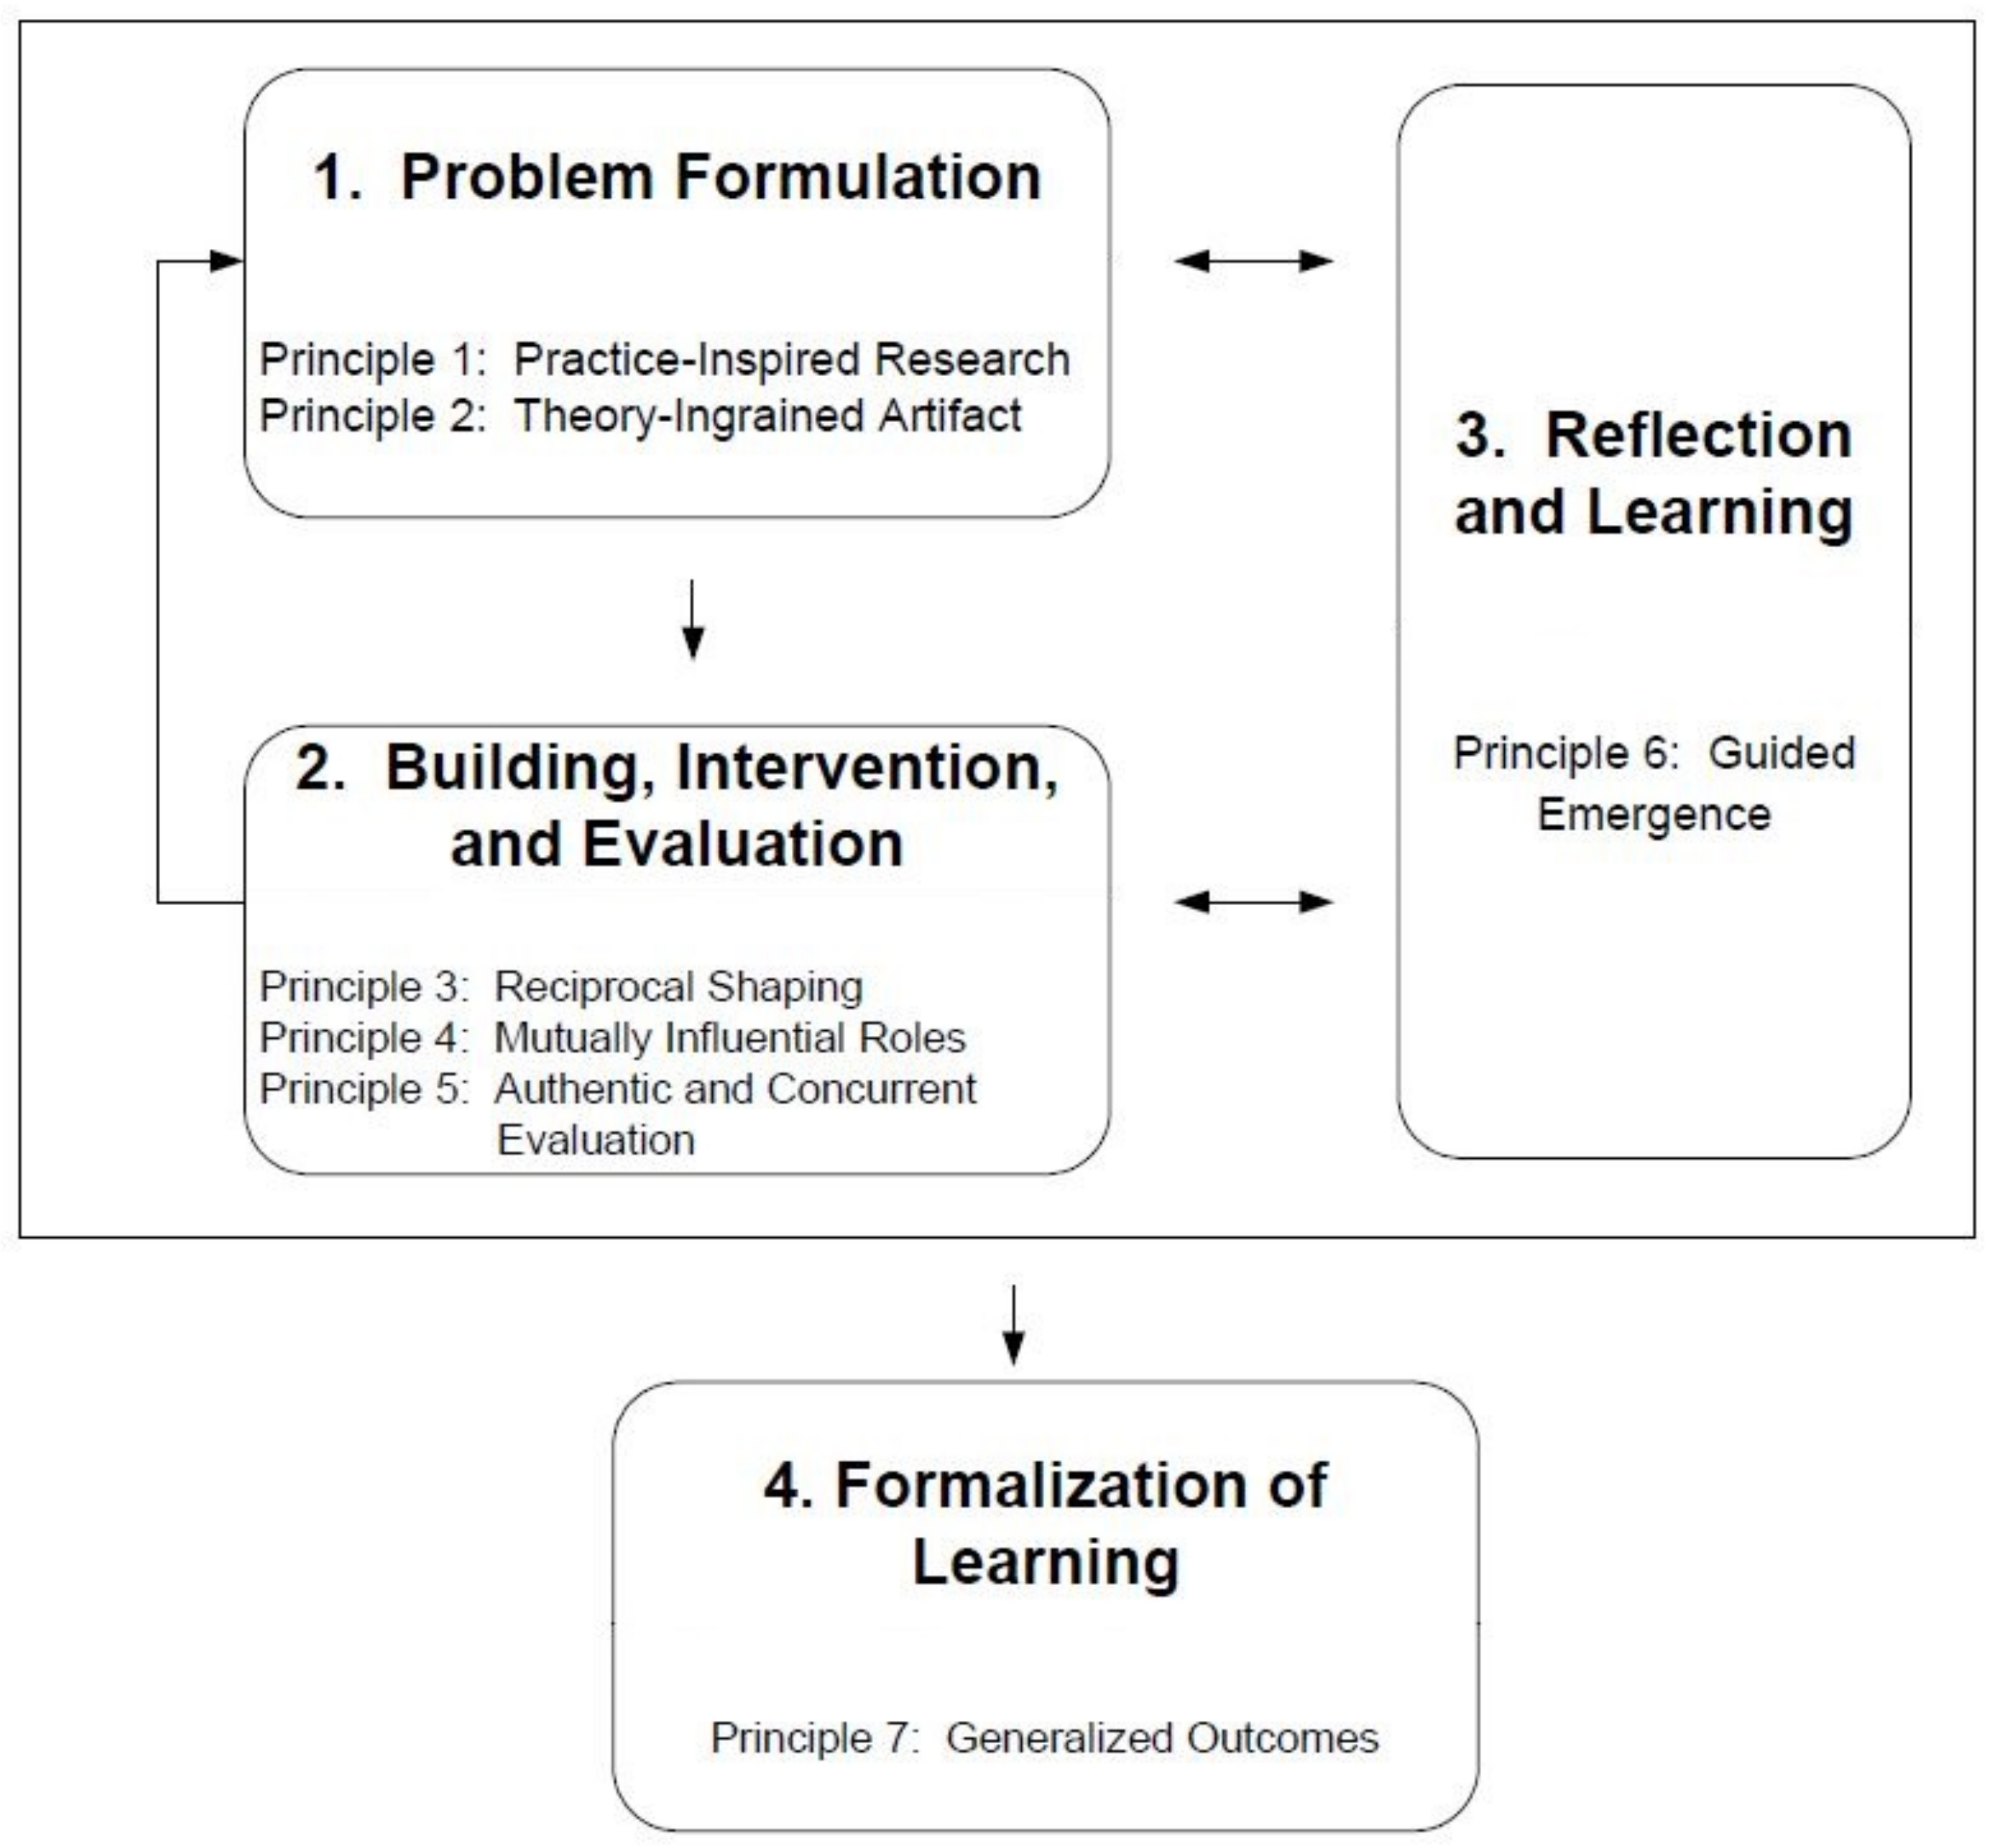
Due to the engineering nature of this research, we followed a design science approach to help achieve practical organizational objectives by creating and evaluating a purposeful IT artifact [
33]. ADR consisted of four stages, each anchored with a set of seven principles, as shown in
Figure 2.
The first stage of a researcher’s problem is perceived or predicted based on business needs. Research opportunities are designed based on existing theories and techniques, and this phase is based on two different principles:
(1) Practice-inspired research and (2) theory-ingrained artifact.
In this stage, the relevance of the research question, “How does BDA, as a data-driven decision-making enabler, influence decision-making in smart cities?” was set from practical and theoretical perspectives. From a practical standpoint, one of the critical objectives of Nafeza, as an enterprise system, is to optimize the overall clearance time to the minimum possible level. Decisions and actions to reduce the clearance time must be based on factual information derived from system-generated data. Looking at Nafeza as an optimization enterprise system makes it share the objectives of a broader class of similar cases (e.g., typical supply chain systems). On the other hand, the theoretical foundations of data analysis (descriptive, diagnostic, predictive, and prescriptive) generally aim to elicit information that serves decision-making purposes.
To quantify the influence of relying on Nafeza data analytics on the efficiency of decisions, we relied on measuring three statistical measures: the clearance time, the number of smuggling cases, and the number of legal violations. These three measures were calculated before and after using Nafeza analytics. These three measures were chosen within the scope of this article because they reflect two important factors in evaluating the efficiency and transparency of trade across border procedures between countries.
The second phase of ADR used stage 1 framing problems and theoretical assumptions to generate the initial design of IT artifacts. IT artifacts were further shaped by the use of the organization and the subsequent design cycles as iterative interweaves building, intervention, and evaluation (BIE). A vital feature of this phase was the identification of novelty resulting from the artifact design of the organization’s intervention. This difference highlights two key decisions affecting the ADR research and design team, either an IT-dominated BIE or an organization-dominated BIE. This phase was based on three different principles:
(1) Reciprocal shaping, (2) mutually influential roles, and (3) authentic and concurrent evaluation.
ADR stages features various stakeholders’ high degree of participation (including the three levels of strategic, operational, and public decision-makers). The Nafeza BI analysis team and end-users participated in the ADR process. Nafeza’s data analytics component aims to support the three levels of decision-makers with fact-based information to improve the overall performance of the clearance process. Since clearance time is the common criterion between the three levels of decision-makers, it was considered the primary criterion for measuring the impact of this information on decision-making. This stage involved three different cycles, as shown in
Figure 3.
- -
BIE Cycle 1 (IT-dominated)
This stage involved all the necessary preparatory work for data analytics, such as the general design of system structure, defining the primary data source (mainly Nafeza operational database and historical data), the initial design of the data marts and cubes, and the ETL tools.
- -
BIE Cycle 2 (Organization-dominated)
In addition, the development of the needed dashboards was included in this cycle. This stage involved the business analysis sessions for identifying the necessary indicators required by the strategic and operational-level consumers. This stage was executed through several iterative analytical and design sessions between the BI analysis team, developers, and ADR researchers. This cycle ended with the development of three categories of dashboards:
Category 1—Performance monitoring to monitor the performance of the workflow, including the performance of the involved OGAs to identify bottlenecks and unnecessary workflows (an example is provided in
Figure 4).
Category 2—Employee performance to monitor the daily employee operations and workload distributions (an example is given in
Figure 5).
Category 3—Foreign trade performance to follow the revenues and overall international trade balance from different perspectives (an example is given in
Figure 6).
- -
BIE Cycle 3 (Organization-dominated)
This stage was devoted to serving the third level of decision makers: the public-level BDA consumers. This level of consumers includes exporters, importers, and shipping agents. This cycle’s required analytics and dashboards were developed based on consumer feedback. This stage was executed through several iterative analytical sessions between ADR researchers, developers, and business experts.
4. Analysis of Results
The total number of dashboards presented to BDA consumers reached more than 100. The information offered through these dashboards to the consumers was extracted using various algorithms including simple descriptive statistics, association rules, and process mining.
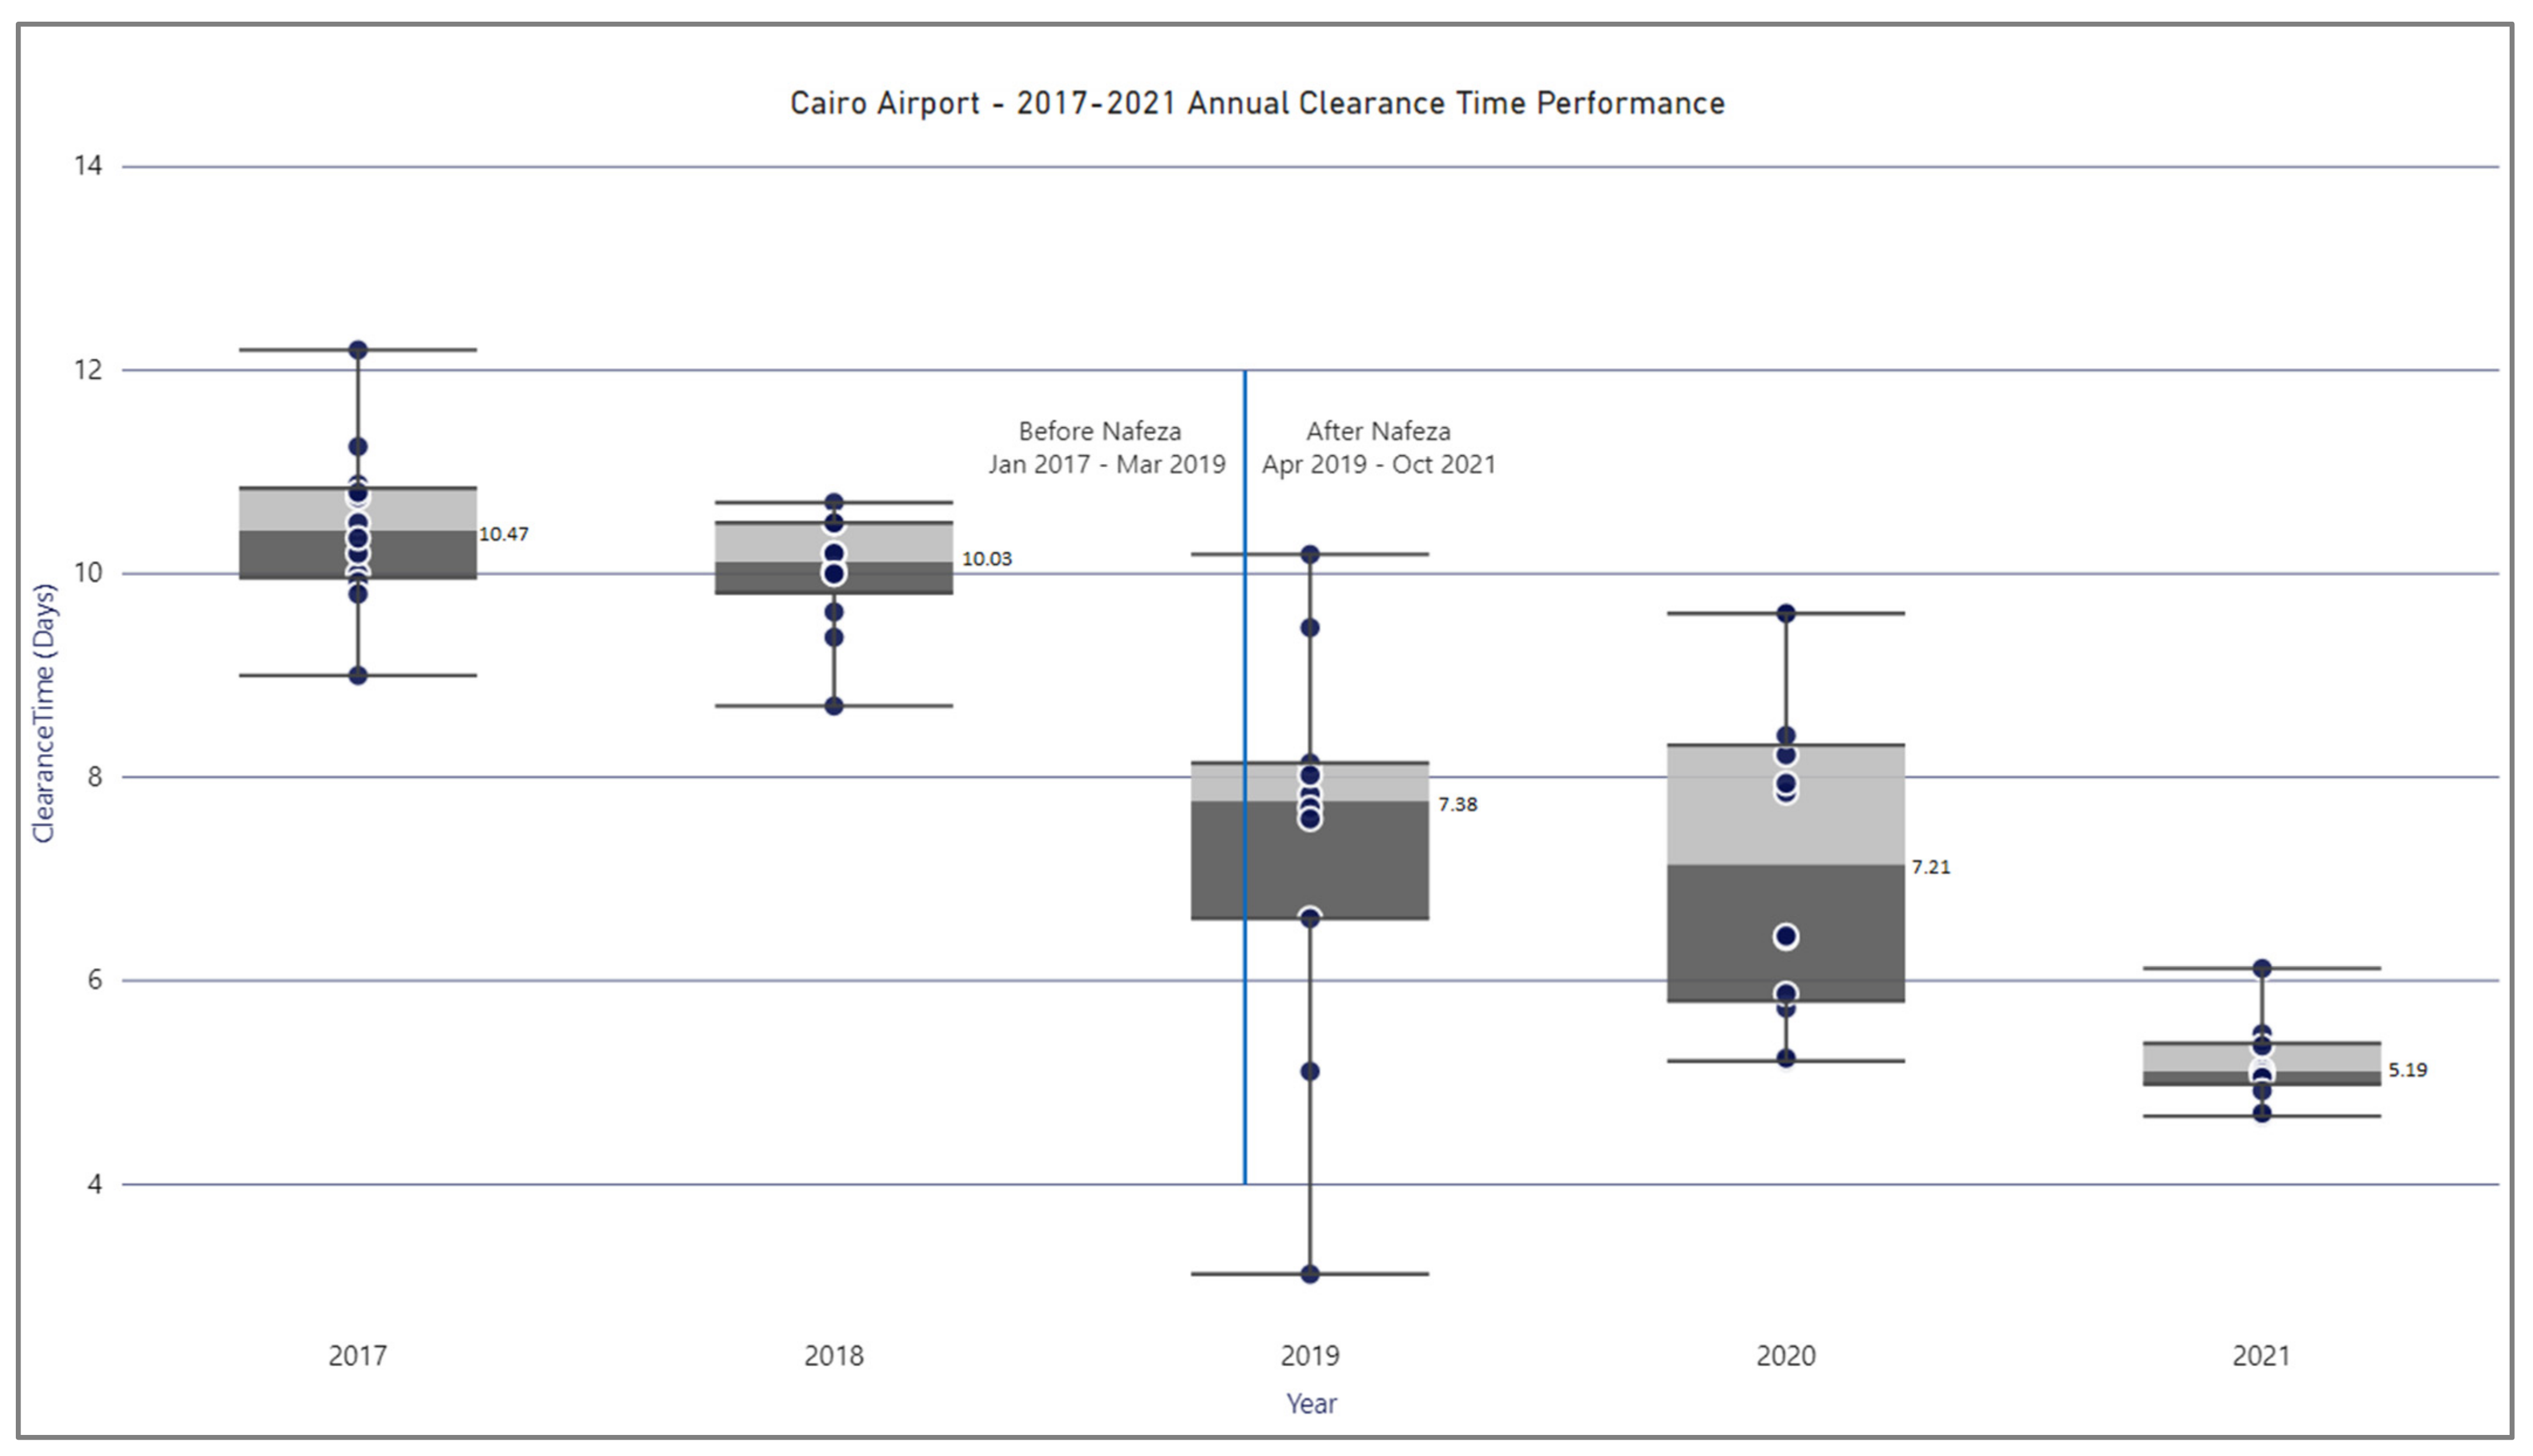
To assess the impact of decisions on the clearance time, we compared the clearance time before and after implementing Nafeza in both Cairo Airport and Port Said Seaport. These two international ports implemented Nafeza at almost the same time (Q1 and Q2 2019) and represent a benchmark of Egypt’s primary air and seaports.
Figure 7 and
Figure 8 show boxplot representations of the annual clearance times for Cairo Airport and Port Said seaport during the last five years (2017–Q3 2021), respectively (permission to publish these data was obtained from relevant authorities.) For each year, the monthly average clearance time is represented by a dark dot. This information helped the strategic and operational management issue many effective decisions and regulations for re-engineering procedures and workflows implemented through Nafeza to reduce the overall clearance time and increase transparency.
These figures show a drop of approximately 30–50% in the average clearance time at Cairo Airport and Port Said Seaport. For further evaluation of the impact of implementing Nafeza with the re-engineered workflows on the undesirable behaviors of importers and exporters, we recognized a noticeable decrease in the number of rule violations (approx. 16%) and smuggling cases (approx. 30%) from 2019 to 2021, as shown in
Figure 9.
Although we do not have any evidence of causality between the decrease in the number of violations and smuggling cases and the implementation of Nafeza, it might be that the increasing community awareness about the efficiency of Nafeza’s governance of procedures contributed to this phenomenon.
Reflection and learning are related to experience and insights gained from the BIE cycle related to the problems formulated in the first stage. This stage was continuous and parallel to the last two cycles. At this stage, it was emphasized that the ensemble artifact reflected the preliminary design in the organization’s context form. The guiding principle at this stage was the guided appearance of artifacts (i.e., designing the resulting artifacts with the BIE cycles). This stage was drawn on only one principle: (1) guided emergence.
During the evaluation, software developers suggested implanting some analytics as embedded functionality within the operational software components—for example, they could distribute valuation workloads to valuators based on their previous experiences inferred from their work analytics. In such a case, the workload distribution would be machine-decided without human intervention, contributing to the transparency of the clearance procedure. In addition, researchers and data analytics developers faced another challenge regarding the presentation of unfamiliar analytics techniques to the end consumer in a simplified, understandable, and applicable form [
34]. To overcome this challenge, expressive data visualization diagrams presenting information such as Sankey and heat map diagrams were provided. Accordingly, the user interfaces became more complicated at first glance, entailing more end-user orientation and training. The third observation is that as the development team provided richer information to the consumer, the consumer inquiries became more complex (and sometimes contradictory), requiring the addition of more selection criteria, filtering options, and advanced levels of visualization in multiple forms.
The fourth stage of ADR aimed to formalize the lessons learned through the BIE cycles. Remodeling the problem instance into a class of problems enables the conceptual migration of this problem case study into a generalized category. Researchers outlined the outcomes from the IT and organization perspectives to formalize learning. These summarized results were formulated as design principles (DPs), and further considered as improvements to the theory that contributed to the original design. This stage drew on one principle: (1) generalized outcomes.
Although ADR generally assumes that reflection and learning occur continuously during BIE cycles, the conceptual formalization of learning is an activity of its own. Design research relies on the importance of design principles for the design of artifacts. According to Sein et al. [
17], the design principles of the artifact should be practice-inspired and theory-ingrained. In their paper, they also explained that design principles contribute to the literature in a specific domain; we, accordingly, posit that the design principles of BDA in SC will contribute to the literature of data-driven decisions, and to the literature on smart cities. In design research, the design principles could be thought of as the input to the artifact design, or could also be thought of as the output of the artifact in terms of design-generated knowledge. That has been reflected in a number of articles theorizing about design research. For example, [
35] described the various types of IT artifacts at varying abstraction levels of knowledge contribution based upon the maturities of the problem area and the solution domain. Accordingly, a specific design research project could generate novel artifacts on one or more of three levels, as follows:
- -
Level one: specific instantiations in the form of products and processes;
- -
Level two: general contributions in the form of nascent design theory (e.g., constructs, design principles, models, and technological rules;
- -
Level three: well-developed mid-range design theories about the phenomena under study.
Lastly, design principles also contribute to the evaluation of the IT artifact as a possible output of design research [
36]. In this subsection, we present the concluded design principles collectively as follows:
This principle is twofold. The first part is concerned with the resilience of the analytics module to digest additional data sources (e.g., historical data and data from OGAs). On the other side, it is concerned with the design of the dashboards with the highest level of abstraction and flexibility to integrate with a diversity of OGAs. The value of this principle emerged during the design of the data cubes and dashboards (BIE Cycle 1) to accommodate the diversity of OGAs and additional data sources that might be required.
- -
DP2 Flexible Dashboards
This principle is concerned with the flexible design of the dashboards with the highest level of integrated information content satisfying the diversity of consumers’ requirements. The value of this principle emerged during the development of dashboards and interaction with the users; the more information the system provided to users, the more the complexity of their requests increased (BIE Cycle 2). Therefore, it was necessary to consider the development of dashboards and databases in a flexible manner that allows these requirements to be met in an acceptable time.
- -
DP3 Direct Consumption without Intermediaries
This principle pertains to the data analytics module’s ability to present complex analytical outcomes to non-specialist consumers in meaningful business terms (BIE Cycle 2, 3).
- -
DP4 Analytics to Insights
This principle is concerned with turning the outcomes of data analytics into actionable business insights that influence data-driven decisions. In this context, actions might be either traditional human actions or machine actions in the form of embedded analytics (stage 3 of the ADR process—reflection and learning).
- -
DP5 User-Engagement Necessity
This principle refers to the ability of the designed dashboard to change the visualized information according to the user choices to present the required information at the highest informative level in the simplest way possible (stage 3 of the ADR process—reflection and learning).
5. Conclusions
This article addressed the scarcity of case study research articles addressing BDA as a data-driven decision-making enabler in smart cities. In this research, we investigated how the utilization of BDA influenced the effectiveness of decisions. This research answered the research question: How does BDA, as a data-driven decision-making enabler, influence decision-making in smart cities? We embraced case study analysis methodology to assess the impact of incorporating BDA as a data-driven decision-support (DDDS) tool in one of the nationwide digital transformation projects in Egypt called Nafeza. Nafeza is an Egyptian national platform for foreign trade facilitation. The results and design principles were obtained by designing and implementing an ensemble artifact in the form of performance monitoring dashboards to support decision-making in the said project. In doing so, we applied the action design research (ADR) approach.
We specified three statistical measures: the clearance time, the number of smuggling cases, and the number of legal violations for a better understanding of the influence of exploiting BDA on the efficiency of decisions. These three measures were calculated before and after using Nafeza BDA analytics in decision-making. Results indicate a positive impact of using BDA in decision-making processes. In the present case study, a significant improvement was observed in the performance indicators (30–50%) in foreign trade clearance time, and an evident decrease was observed in smuggling and legal violation cases (16–30%). The design principles were implemented through the design and development of the dashboards, and included the principle of data-agnosticism, the principle of flexible dashboards, the principle of direct consumption without intermediaries, the principle of analytics to insights, and the principle of user-engagement necessity. Because of the generic nature of the challenges faced in the present case study, the deduced design principles could be applicable to other classes of problems such as BDA in data-driven decision-making at government agencies. However, this needs to be investigated further in applied longitudinal research.


