Abstract
We introduce a novel n-stage vaccination model and corresponding system of differential equations that stratify a population according to their vaccination status. The model is an extension of the classical SIR-type models commonly used for time-course simulations of infectious disease spread and allows for the mitigation effects of vaccination to be uncoupled from other factors, such as changes in social behavior and the prevalence of virus variants. We fit the model to the Virginia Department of Health data on new COVID-19 cases, hospitalizations, and deaths broken down by vaccination status. The model suggests that, from 23 January through 11 September, fully vaccinated individuals were 89.8% less likely to become infected with COVID-19 and that the B.1.617.2 (Delta) variant is 2.08 times more transmissible than previously circulating strains of COVID-19. We project the model trajectories into the future to predict the impact of booster shots.
1. Introduction
In December 2019, a novel and highly-contagious coronavirus SARS-CoV-2 was identified in Wuhan, China. The associated disease, COVID-19, causes fever, muscles aches, fatigue, and shortness of breath and has been associated with a significant mortality rate, especially among older and immunocompromised individuals [1]. In the early stages of the pandemic, mitigation measures focused on non-pharmaceutical interventions including travel/border restrictions, social distancing/masking campaigns, work-from-home orders, school closures, and lockdowns. After the Emergency Use Authorization of effective vaccines in the United States at the end of 2020 (Pfizer-BioNTech 11 December 2020; Moderna, 18 December 2020; Johnson & Johnson, 27 February 2021), the response focused on vaccination drives and awareness campaigns. While these efforts have averted the worst-case forecast scenarios, COVID-19 continues to spread widely due in part to the more transmissible B.1.617.2 (Delta) variant, which became the dominant COVID-19 strain in the United States in July 2021 [2].
Mathematical modeling has played a vital role in public policy decision-making since the beginning of the pandemic. SIR-type compartmental models [3] have been used to estimate key epidemiological parameters of infectious disease spread, such as the transmission rate and basic reproduction number [4,5,6]; to evaluate the pathways of spread, such as spread through asymptomatic carriers [7,8]; and to forecast disease dynamics under a variety of non-pharmaceutical intervention strategies, such as lockdowns, contact tracing, and face masking campaigns [9,10,11,12,13,14]. More recent research has focused on aspects of pharmaceutical interventions, such as comparing COVID-19 vaccination strategies (e.g., which segment of society to vaccinate first) and post-vaccination re-opening scenarios [15,16,17,18]. While these and other studies incorporate vaccination into their modeling frameworks, time-course differential equation models have not been widely used to assess the real-world efficacy of vaccination itself. Rather, studies on vaccine efficacy have been limited to controlled clinical trials [19,20,21] and analysis of data aggregates [22,23,24].
In this paper, we introduce a novel n-stage vaccination model that partitions a population according to their vaccination status. This model allows us to concisely assess and forecast the spread of an infectious disease as the vaccination level of a population changes. We fit the model to COVID-19 incidence data from the Virginia Department of Health (VDH) [25] and vaccination uptake data from Our World in Data [26] to estimate (a) the real-world efficacy of vaccination in preventing COVID-19 infections, hospitalizations, and deaths, and (b) the transmissibility of the B.1.617.2 (Delta) variant relative to previously dominant strains. We also conduct a parameter sensitivity analysis and present forecasts of what the spread of COVID-19 could look like through 31 December 2021 given different vaccination coverage levels and with the incorporation of a booster shot.
2. Materials and Methods
2.1. n-Stage Vaccination Model
We introduce the following n-stage vaccination model, where within each vaccination class , there are susceptible individuals (), infectious individuals (), hospitalized individuals (), removed individuals (), and deceased individuals ():
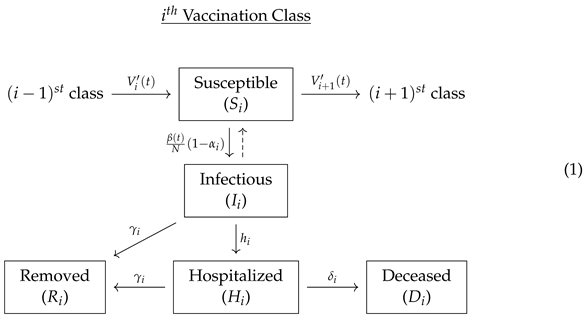
Note that corresponds to unvaccinated individuals and that the removed classes may include those who have recovered from illness but also those who have been removed by other means, such as self-isolation or quarantine. Individuals are transferred from the vaccination class to the ith vaccination class through the ith dose vaccination uptake rate curve , which is the derivative of the cumulative ith dose uptake curve . To account for there only being a finite number of vaccination classes, we set , and . That is, we do not include an incoming edge to the 0th vaccination class or an outgoing edge from the vaccination class. We allow for a time-dependent baseline transmission rate for unvaccinated individuals, , so that the transmission rate may vary, for instance, by changes in public health policies or changes in prevalence of COVID-19 variants.
To model COVID-19 spread in the United States, we use the two-stage and three-stage vaccination models: (i) for individuals who have not received any vaccine shots (unvaccinated); (ii) for individuals who have received one shot of either the Pfizer or Moderna vaccine (partially vaccinated); (iii) for individuals who have received two shots of either the Pfizer or Moderna vaccine, or one shot of the Johnson & Johnson vaccine (fully vaccinated); and (iv) for individuals who are fully vaccinated and received a booster shot.
The model (1) makes several assumptions: (a) there is no latency period (i.e., susceptible individuals become infectious immediately upon becoming infected); (b) both the vaccine and infection provide long-lasting immunity (i.e., there is no waning immunity or reinfection); (c) only hospitalized individuals may die; and (d) previously infected individuals will not vaccinate. We note that COVID-19 has a mean latency period of 3–7 days [27,28], that studies suggest there is decreased immunity 6 months after becoming fully vaccinated [29,30,31], that an estimated 10–15% of COVID-19 deaths in the United States occur outside of the hospital [32], and that the CDC recommends vaccination for individuals who have previously been infected with COVID-19. We chose not to incorporate these effects for model simplicity; however, an extension of the n-stage vaccination model (1) which incorporates waning immunity and reinfection will be the focus of future work.
2.2. Governing System of Differential Equations
Corresponding to (1), we introduce the following governing system of ordinary differential equations for :
To accommodate time-dependent changes in social behavior, public health policies, and the prevelance of SARS-CoV-2 variants, we allow the unvaccinated transmission rate function to take the following piecewise-constant form:
where L is the number of days in the simulation period and m is the number of intervals. That is, we divide the interval of consideration into m parts of equal length and allow each interval to have its own baseline transmission rate for unvaccinated individuals, .
To model the vaccination uptake curve and corresponding uptake rate curve , we use the four-parameter Richards’ curve [33]:
2.3. Basic and Effective Reproduction Number
The basic reproduction number () of an infectious disease is the expected number of secondary infections produced by a single infectious person entering a fully susceptible population, assuming minimal public health interventions [34]. The effective reproduction number () additionally takes into account mitigating factors such as public health interventions, natural immunity through infection, and vaccination. These values are considered key epidemiological parameters since () suggests that a disease has the capacity to spread in the population while () suggests that it will die out. We compute the basic and effective reproduction number of the n-stage vaccination model (2) using the next generation method [35,36].
To compute the basic reproduction number, we use the disease free equilibrium , , , for , and for , where is the number of people who have received the ith shot by the initial time. This gives the following:
Note that this number assumes no vaccination beyond the initial time and does not account for natural immunity obtained by previous COVID-19 infections. To account for these mitigating effects, we also compute the effective reproduction number:
In general, (6) is more challenging to compute since it requires time-course simulations of , , whereas (5) only requires the initial conditions. Note that the outbreak containment condition is explicitly dependent on the effectiveness of the vaccine shots (i.e., ), the recovery rates (i.e., ), and the hospitalization rates (i.e., ). The condition is also implicitly dependent on the number of individuals who have received each dose of the vaccine (i.e., ) as these functions affect through (2).
2.4. Data Fitting Techniques
We fit the n-stage vaccination model (2) with the vaccination uptake curve (4) to data in two steps. We first fit the vaccination uptake curve (4) to daily vaccination uptake data by minimizing the sum of squared error. We then incorporate these parameters into the vaccination uptake curve in the system of differential Equation (2) and minimize a customized error function. For both steps, we utilize a nonlinear least squares fitter written in Python. We now describe the customized error function for fitting to (2).
We let indicate the number of vaccine shots ( unvaccinated, partially vaccinated, and fully vaccinated), indicate the type of individual (infected, hospitalized, or deceased), and denote the time point (in weeks). We let denote the cumulative number of COVID-19 cases in vaccination class i of type j and in week k, and denote the weekly increase in that class from the previous week (i.e., ). We define to be the set of all parameters to be fit and to denote the model simulation of (2) for the cumulative cases in vaccination class i of type j and for parameter set . We utilize the following normalized error function, which incorporates both the weekly cumulative and rate numbers:
where and , , are the normalization factors
Note that the normalizations (8) in the error function (7) equalize the weight of the cumulative and weekly rate of increase in infections, hospitalizations, and deaths. For initial conditions, we take
We set our initial susceptible classes according to the following:
We assume that there are no initial recoveries or deaths of partially or fully vaccinated individuals, so that . We allow to be fit into the data to account for the possibility that the best fitting model is one in which there is a different number of overall COVID cases than has been officially reported.
2.5. Parameter Sensitivity Analysis
A local sensitivity analysis is a derivative-based approach that is a key tool in exploring parameter identifiability, i.e., whether it is possible to infer a set of parameters from a given data set [37]. Let be the output variable at time t with vector of parameters from a model with k parameters; then, the normalized sensitivity function of y with respect to parameter is
That is, the normalized sensitivity function is the derivative of the output with respect to a specific parameter that has been normalized based on the parameter. The normalized sensitivity functions allow us to determine which parameters when changed by the same percentage result in similar changes in the output variable. Parameters that yield similar changes in the output variable show that those parameters are correlated and will be hard to identify from the data. For the two-stage vaccination model (1), we expect many parameters to be correlated. A sensitivity analysis, however, helps us understand which parameters have the greatest and least influence on an output variable.
3. Results
3.1. Fitting Two-Stage Vaccination Model to Virginia Data
We fit the vaccination uptake curve (4) to the cumulative vaccination data from the Commonwealth of Virginia [26] using the methods described in Section 2.4. We used data points starting on 23 January and ending on 2 October and used linear interpolation to fill in missing data. The best fitting parameters and curves and are shown in Figure 1.
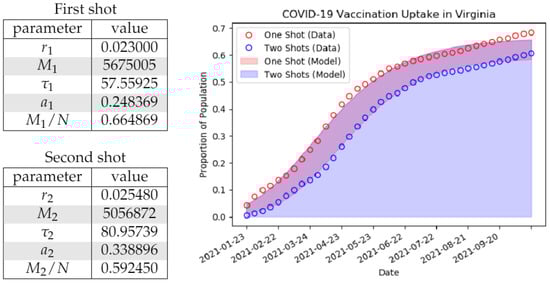
Figure 1.
On the left, we indicate the best fit parameters for the generalized logistic curve or Richards’ curve (4) to Virginia Department of Health data [25] on vaccination uptake starting with corresponding to 23 January 2021. The values and correspond to the saturation proportions for the first and second doses, respectively (i.e., the number of willing/able vaccine recipients). We use the population denominator N = 8,535,519 corresponding to the population of Virginia. On the right, we display the model fit (solid) to the observed data (circles).
We then incorporated these parameters into the vaccination uptake curve (4) and used the methods outlined in Section 2.4 to fit the two-stage vaccination model (2) to the time-course data set VDH-COVID-19-PublicUseDataset-Cases-by-Vaccination-Status (report date 8 October 2021 [25]). This data set is publicly available through the VDH Data Portal and breaks down new weekly COVID-19 infections, hospitalizations, and deaths by vaccination status (unvaccinated, partially vaccinated, and fully vaccinated). We used data from 23 January through 11 September 2021. We used the piecewise-constant transmission rate function (3) with and so that . This allows the transmission rate to change on a roughly monthly basis. The fit initial conditions and parameters can be found in Table 2. Plots are displayed in Figure 2.


Figure 2.
Plots of VDH data and the parameter-fit two-stage vaccination model (2) with piecewise-constant transmission rate (3) and vaccination curves (4) with the parameters from Figure 1 and Table 2. On the left, we track the time-course breakdown of the new cases, hospitalizations, and deaths by vaccination status. Individual statuses are represented as bands (vertical distance between open circles for data and solid regions for model). On the right, we track the cumulative observed and model-predicted cases, hospitalizations, and deaths over time.
3.2. Efficacy of Vaccination
The fit parameter values and in Table 2 suggest that, over the period of study, partially vaccinated individuals are % less likely to catch COVID-19 while fully vaccinated individuals are % less likely to catch COVID-19. We can furthermore estimate that, relative to unvaccinated individuals, partially vaccinated individuals are % less likely to be hospitalized with COVID-19 and % less like to die from COVID-19, and fully vaccinated people are % less like to be hospitalized with COVID-19 and % less likely to die from COVID-19. The reduction in the proportion of people who become hospitalized or deceased relative to the unvaccinated population can be calculated by the following formulas:
We note that the proportion of breakthrough cases is expected to rise with a rise in the proportion of the population that is vaccinated; however, the model still supports the notion that, over the period of study, the pandemic was largely a pandemic of the unvaccinated. During the final week of our study from 5 to 11 September, for example, the model predicts that % of new cases were unvaccinated individuals despite only % of the population of Virginia (around 2,800,000 people) being unvaccinated.
While this analysis strongly supports the efficacy of vaccination at preventing COVID-19 infections, it does not support the hypothesis that vaccinated individuals benefit from additional protections against severe illness. Rather, the data suggest that the likelihood of an individual who has contracted COVID-19 becoming hospitalized or deceased does not depend significantly on vaccination status. This is contrary to several recent studies [23,24]. We caution that it would be premature to draw conclusions since the two-stage vaccination model and vaccination uptake curves do not account for the heterogeneous impacts of COVID-19. We note in particular that a higher proportion of older individuals are vaccinated than younger individuals and that age is correlated with more breakthrough cases and more severe COVID-19 outcomes [1,22].
3.3. Transmissibility of Delta Variant
The two-stage vaccination model (1) predicts that the baseline transmission rate of COVID-19 for unvaccinated individuals, , rose significantly from June to August 2021 (see Table 3). This coincides with the emergence in the United States of the Delta variant, which became the dominant strain on the week ending July 3 and made up 98.9% of cases by the week ending 11 September [2]. Although we cannot tell how much of this increase is due solely to the Delta variant, we can compute that the average transmission rate from 23 January through 20 June 2021 was while the average transmission rate from 21 June through 18 September 2021 was . The time frame in which Delta became the dominant strain of COVID-19 therefore corresponds to a times real-world increase in the baseline transmissibility of COVID-19 in Virginia.
Table 3.
Vaccination level, effective transmission rate, and the effective reproduction number for the spread of COVID-19 in Virginia over the period 23 January through 18 September 2021.
3.4. Effect of Waning Immunity and Delta Variant on Vaccine Efficacy
Recent studies have suggested that the COVID-19 immunity conferred by vaccination wanes over time [29,30,31] and that the Delta variant may be more likely to produce breakthrough cases [38]. To test for these effects in the VDH data, we introduce the following piecewise-constant vaccination efficacy rates and to the two-stage vaccination model (2) with piecewise-constant transmission rate (3) and vaccination uptake curves (4):
where L is the number of days the simulation period. That is, we divide the interval of consideration into four parts of equal length, each with a constant rate reduction of partial or fully vaccinated individuals becoming infected with COVID-19. For the simulation period of January 23 through September 18, 2021, this corresponds to and so that the transmission reduction rates is allowed to change roughly every second month.
In order to establish population-level waning immunity in the model (2) with time-dependent and (12), we expect to see . We also expect that the fit would be significantly better than the one obtained with the model (2) and the parameter values in Table 2. In fact, we do not observe any significant trend in the best-fitting values (, , , , , , ). We also do not observe a significant reduction in the error function (7). Our analysis consequently does not support including waning immunity or changes in the efficacy of the vaccines against the Delta variant at the population level. We caution, however, against drawing the conclusion that waning immunity is not occurring since the model (2) is only able to estimate vaccine efficacy values at the population rather than individual level.
3.5. Parameter Sensitivity Analysis
Figure 3 shows the sensitivity results for the cumulative number of cases of COVID-19 in Virginia and the effective reproduction number (6) with respect to the vaccine parameters (, , , and ) and recovery parameters (, , and ). We interpret the graph for in Figure 3 to mean that the perturbation of exhibits its greatest influence over early in the simulation, with an initial expected decrease of 0.9% if is increased by 1%. We find that cumulative cases and the effective reproduction number are highly sensitive to the efficacy of the second vaccination shot . Specifically, the model suggests that a 1% increase in results in a 1% decrease in the cumulative cases (roughly 6500 cases) around the beginning of August. Similarly, we see that a 1% increase in decreases by 1.7% around the beginning of August. The results also suggest that the recovery rate of the unvaccinated individuals, , is highly influential. In particular, around the beginning of August, a increase in would result in a 2.3% decrease in cumulative cases. The nontrivial impact of vaccination parameters and recovery parameters on strongly suggests the impact of changing susceptible populations as vaccination programs are rolled out in the simulation.
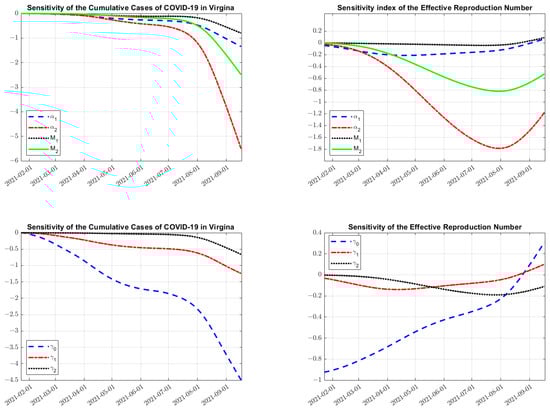
Figure 3.
Sensitivity analysis using Equation (11) on the cumulative cases of COVID-19 in Virginia (left column) and (the effective reproduction number, right column) with respect to vaccination parameters (, , , and ) and recovery rates (, , and ). Note the negative impact of the parameters on the cumulative cases, but a non-trivial impact on the effective reproduction number as population sizes change in each vaccination stage through time. Further notice the small influence that has on both outputs, until later in the simulation.
3.6. Modeling with Different Vaccine Coverage Levels
The sensitivity analysis depicted in Figure 3 suggests that the cumulative cases and effective reproduction number () are highly dependent on the number of individuals who become vaccinated ( and ). To further explore this, we increase/decrease the vaccination levels in the model (2) with parameters given in Table 2 in order to (a) predict what the spread of COVID-19 would have been during period 23 January through 18 September 2021 and (b) forecast the spread of COVID-19 through 31 December 2021. For the purpose of forecasting COVID-19 spread after 18 September, we use the transmission value of the final interval ().
The results of simulations with values of and chosen between 10% more and 10% less of the overall Virginia population are contained in Figure 4. The model predicts a 5 times increase in new cases from 18 September through 31 December if 10% less of the population had been vaccinated. The model also predicts that the Delta surge experienced in August and September 2021 could have been largely avoided if an additional 10% of the population had been vaccinated.

Figure 4.
Simulations of the two-stage vaccination model (1) with parameters from Table 2 and differing values of overall vaccine uptake ( and ). The transmission rate during the period September 18 through 31 December 2021 is assumed to be that of the final fit period (i.e., ). On the left, forecast values through 31 December 2021 are shown for cumulative cases, hospitalizations, and deaths given current vaccination uptake, 10% more vaccination, and 10% less vaccination.
3.7. Modeling with Booster Shots
The sensitivity analysis depicted in Figure 3 also suggests that the cumulative cases and effective reproduction number () are highly dependent on the reduction from baseline transmission rate parameters for the two vaccination classes ( and ). To further investigate the effect that a reduction in transmission due to vaccination may have on the spread of COVID-19, we extend from the two-stage to the three-stage vaccination model (2) where corresponds to fully vaccinated individuals who have received the booster shot. We use the parameters from Table 2 for and set , , and . That is, we assume the effects of contracting COVID-19 are similar for somebody with the booster shot as somebody who is fully vaccinated. We estimate a reduction in baseline transmission rate resulting from a booster shot of [39,40]. We assume that the booster shot uptake curve is similar to the second vaccine dose, delayed 210 days, and that the proportional decrease in people obtaining the booster is similar to that of the first to second shot (i.e., , , , ). For the purpose of forecasting COVID-19 spread past September 18, we use the transmission value of the final interval ().
In Figure 5, we show forecast simulations for the period 23 January through 31 December 2021 incorporating booster shots, a hypothetical booster uptake schedule, and the utilized parameter values. The booster shot uptake curve predicts that % of the population will receive booster shots by 31 December 2021. The model predicts a 19.7–34.3% reduction in new COVID-19 cases from 18 September to 31 December 2021 depending on the efficacy of the booster shot in reducing transmission from baseline (). It is notable that, over the same period, there is a 17.6–31.0% reduction in new cases in unvaccinated individuals and a 14.4–25.2% reduction in new cases for partially vaccinated individuals. This strongly supports the notion that the protection offered by the booster shot, or vaccination in general, is not restricted to the individual receiving the shot; rather, it is distributed across the population and even across individuals of different vaccination statuses.
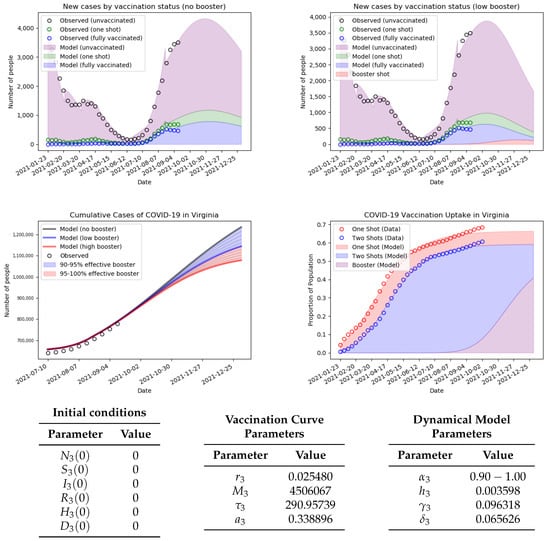
Figure 5.
Simulations of the three-stage vaccination model (2) with corresponding to individuals who have received a booster shot. The parameters for the booster shot uptake curve are shown, and the parameters for the vaccination uptake curves , , are from Table 2. The reductions in the baseline transmission parameter for the booster shot are (low booster) and (high booster) [39,40], and the model runs from 23 January through 31 December 2021.
4. Discussion
Our analysis suggests that, from 23 January through 11 September 2021, in Virginia, partially vaccinated individuals were %/%/% less likely to become infected/hospitalized/deceased due to COVID-19 than unvaccinated individuals, while fully vaccinated individuals were %/%/% less likely to become infected/ hospitalized/deceased due to COVID-19 than unvaccinated individuals (see Table 2 and Figure 2). This strongly supports the efficacy of vaccination in combating the spread and severe outcomes of COVID-19. The model furthermore suggests COVID-19 was times more transmissible during the time frame during which the B.1.617.2 (Delta) variant became the dominant strain in Virginia (see Table 3). We did not detect any changes in the vaccine efficacy levels during the time frame during which Delta became dominant in Virginia. This suggests that it is the raw increase in transmissibility of the Delta variant that was the primary driver behind the increase in COVID-19 cases from June to August 2021, rather than a decrease in vaccine efficacy.
We forecast the spread under a variety of different vaccination uptakes levels (see Figure 4) and potential booster shot schedules (see Figure 5). This analysis suggests a five times increase in new cases from 18 September through 31 December 2021, if 10% less of the population had opted to become vaccinated. Our analysis furthermore suggests that a booster shot in the 95–100% efficacy range could reduce the number of new cases between 18 September and 31 December 2021 by 19.7–34.3%, and that this reduction is distributed across vaccination statuses (see Figure 5). These results reinforce the continued push for vaccination as an essential and effective means of containing the spread of COVID-19. It also emphasizes that the benefits of vaccination are distributed across the entire population and not merely restricted to those who are vaccinated.
We note that there are several limitations of our study. Although we did not find evidence that vaccination provides additional protection against severe COVID-19 outcomes such as hospitalization and death, we caution that we did not consider age-stratified differences in vaccination coverage levels, vaccine efficacy, and severe COVID-19 outcomes. In particular, we note that older populations are at higher risk for severe COVID-19 outcomes but also have higher vaccination uptake levels. We also did not incorporate waning vaccine immunity. Although we did not find evidence for decreased vaccine effectiveness over time in our study, we note that our model only considers population-level average immunity and cannot control for when an individual received their first or second vaccination. We also note that, while the vaccination uptake curves (4) fit the data well on the chosen time intervals, they do not account for the age-dependent differences in availability of vaccines. The predicted total number of people who will become vaccinated are consequently likely to be below the true value.
5. Conclusions
We introduced a novel n-stage vaccination model (1) that stratifies a population according to their vaccination status. By controlling for a population’s vaccination uptake level, the model is able to effectively estimate the real-world efficacy of vaccination against infections, hospitalizations, and deaths and is able to generate detailed dynamical predictions of infectious disease spread under a variety of public health and vaccination uptake scenarios. These features will inform epidemiological research and policy in the years to come as new SARS-CoV-2 variants, such as B.1.617.2 (Delta) and B.1.1.529 (Omicron), emerge and as COVID-19 becomes endemic in the global population. Future work will focus on adapting the n-stage vaccination model into a delay-differential equation model that will incorporate waning vaccine immunity, fitting the n-stage vaccination model to data from a wider variety of jurisdictions and assessing the real-world efficacy of the booster shot as more data become available.
Author Contributions
Conceptualization, M.D.J., B.P. and P.N.; methodology, M.D.J., B.P. and P.N.; software, M.D.J. and B.P.; validation, M.D.J. and B.P.; formal analysis, M.D.J. and B.P.; investigation, M.D.J. and B.P.; resources, M.D.J., B.P. and P.N.; data curation, M.D.J.; writing—original draft preparation, M.D.J. and B.P.; writing—review and editing, M.D.J., B.P. and P.N.; visualization, M.D.J. and B.P.; supervision, P.N.; project administration, M.D.J., B.P. and P.N.; funding acquisition, M.D.J., B.P. and P.N. All authors have read and agreed to the published version of the manuscript.
Funding
This research received no external funding.
Institutional Review Board Statement
Not applicable.
Informed Consent Statement
Not applicable.
Data Availability Statement
Python code files Vaccination_Fit.py and Model_Fit.py are available in the “Downloads” section of johnstonmd.wordpress.com (accessed on 31 January 2022). Vaccination_Fit.py fits daily vaccination uptake data to a Richard’s curve (4) and Model_Fit.py fits the two-stage vaccination model (2) to weekly data on COVID-19 incidence, hospitalizations, and deaths.
Acknowledgments
The authors thank the Virginia Department of Health for their assistance in matters related to the dataset VDH-COVID-19-PublicUseDataset-Cases-by-Vaccination-Status.
Conflicts of Interest
The authors declare no conflict of interest.
References
- Fung, M.; Babik, J.M. COVID-19 in Immunocompromised Hosts: What We Know So Far. Clin. Infect. Dis. 2020, 72, 340–350. [Google Scholar] [CrossRef] [PubMed]
- Centers for Disease Control and Prevention. COVID Data Tracker—Variant Proportions. 2021. Available online: https://covid.cdc.gov/covid-data-tracker/#variant-proportions (accessed on 31 January 2022).
- Kermack, W.O.; McKendrick, A.G. A Contribution to the Mathematical Theory of Epidemics. Proc. Roy. Soc. Lond. A 1927, 115, 700–721. [Google Scholar]
- Kucharski, A.J.; Russell, T.W.; Diamond, C.; Liu, Y.; Edmunds, J.; Funk, S.; Eggo, R.M. Early dynamics of transmission and control of COVID-19: A mathematical modelling study. Lancet Infect. Dis. 2020, 20, P553–P558. [Google Scholar] [CrossRef] [Green Version]
- Zhang, S.; Diao, M.Y.; Yu, W.; Pei, L.; Lin, Z.; Chen, D. Estimation of the reproductive number of novel coronavirus (COVID-19) and the probable outbreak size on the Diamond Princess cruise ship: A data-driven analysis. Int. J. Infect. Dis. 2020, 93, 201–204. [Google Scholar] [CrossRef] [PubMed]
- Zhuang, Z.; Zhao, S.; Lin, Q.; Cao, P.; Lou, Y.; Yang, L.; Yang, S.; He, D.; Xiao, L. Preliminary estimates of the reproduction number of the coronavirus disease (COVID-19) outbreak in Republic of Korea and Italy by 5 March 2020. Int. J. Infect. Dis. 2020, 95, 308–310. [Google Scholar] [CrossRef] [PubMed]
- Arcede, J.P.; Caga-anan, R.L.; Mentuda, C.Q.; Mammeri, Y. Accounting for Symptomatic and Asymptomatic in a SEIR-type model of COVID-19. Math. Model. Nat. Phenom. 2020, 15, 34. [Google Scholar] [CrossRef]
- Radulescu, A.; Williams, C.; Cavanagh, K. Management strategies in a SEIR-type model of COVID 19 community spread. Sci. Rep. 2020, 10, 21256. [Google Scholar] [CrossRef]
- Das, K.D.; Khatua, A.; Kar, T.K.; Jana, S. The effectiveness of contact tracing in mitigating COVID-19 outbreak: A model-based analysis in the context of India. Appl. Math. Comput. 2021, 404, 126207. [Google Scholar]
- Grimm, V.; Mengel, F.; Schmidt, M. Extensions of the SEIR model for the analysis of tailored social distancing and tracing approaches to cope with COVID-19. Sci. Rep. 2021, 11, 4214. [Google Scholar] [CrossRef]
- Barbarossa, M.; Fuhrmann, J.; Meinke, J.H.; Krieg, S.; Vinod Varma, H.; Castelletti, N.; Lippert, T. Modeling the spread of COVID-19 in Germany: Early assessment and possible scenarios. PLoS ONE 2020, 15, e0238559. [Google Scholar] [CrossRef]
- Bouchnita, A.; Jebrane, A. A hybrid multi-scale model of COVID-19 transmission dynamics to assess the potential of non-pharmaceutical interventions. Chaos Solitons Fractals 2020, 138, 109941. [Google Scholar] [CrossRef] [PubMed]
- Chang, S.L.; Harding, N.; Zachreson, C.; Cliff, O.M.; Prokopenko, M. Modelling transmission and control of the COVID-19 pandemic in Australia. Nat. Commun. 2020, 11, 5710. [Google Scholar] [CrossRef] [PubMed]
- Eikenberry, S.E.; Mancuso, M.; Iboi, E.; Phan, T.; Eikenberry, K.; Kuang, Y.; Kostelich, E.; Gumel, A.B. To mask or not to mask: Modeling the potential for face mask use by the general public to curtail the COVID-19 pandemic. Infect. Dis. Model 2020, 5, 293–308. [Google Scholar] [CrossRef] [PubMed]
- Yavuz, M.; Ozlem Cosar, F.; Gunay, F.; Ozdemir, F. A New Mathematical Modeling of the COVID-19 Pandemic Including the Vaccination Campaign. Open J. Model. Simul. 2021, 9, 299–321. [Google Scholar] [CrossRef]
- Ghostine, R.; Gharamti, M.; Hassrouny, S.; Hoteit, I. An Extended SEIR Model with Vaccination for Forecasting the COVID-19 Pandemic in Saudi Arabia Using an Ensemble Kalman Filter. Mathematics 2021, 9, 636. [Google Scholar] [CrossRef]
- Choi, Y.; Kim, J.S.; Kim, J.E.; Choi, H.; Lee, C.H. Vaccination Prioritization Strategies for COVID-19 in Korea: A Mathematical Modeling Approach. Int. J. Environ. Res. Public Health 2021, 18, 4240. [Google Scholar] [CrossRef]
- Bubar, K.M.; Reinholt, K.; Kissler, S.M.; Lipsitch, M.; Cobey, S.; Grad, Y.H.; Larremore, D.B. Model-informed COVID-19 vaccine prioritization strategies by age and serostatus. Science 2021, 371, 916–921. [Google Scholar] [CrossRef]
- Mahase, E. COVID-19: Pfizer vaccine efficacy was 52% after first dose and 95% after second dose, paper shows. BMJ 2020, 371, m4826. [Google Scholar] [CrossRef]
- Bergwerk, M.; Gonen, T.; Lustig, Y.; Amit, S.; Lipsitch, M.; Cohen, C.; Mandelboim, M.; Levin, E.; Rubin, C.; Indenbaum, V.; et al. COVID-19 Breakthrough Infections in Vaccinated Health Care Workers. N. Engl. J. Med. 2021, 385, 1474–1484. [Google Scholar] [CrossRef]
- Chagla, Z. The BNT162b2 (BioNTech/Pfizer) vaccine had 95% efficacy against COVID-19 ≥7 days after the 2nd dose. Ann. Intern. Med. 2021, 174, JC15. [Google Scholar] [CrossRef]
- Centers for Disease Control and Prevention. CDC Covid Data Tracker—Rates of COVID-19 Cases and Deaths by Vaccination Status. 2021. Available online: https://covid.cdc.gov/covid-data-tracker/#rates-by-vaccine-status (accessed on 31 January 2022).
- Scobie, H.M.; Johnson, A.G.; Suthar, A.B.; Severson, R.; Alden, N.B.; Balter, S.; Bertolino, D.; Blythe, D.; Brady, S.; Cadwell, B.; et al. Monitoring Incidence of COVID-19 Cases, Hospitalizations, and Deaths, by Vaccination Status—13 U.S. Jurisdictions, April 4–July 17, 2021. Morb. Mortal. Wkly. Rep. 2021, 70, 1284–1290. [Google Scholar] [CrossRef] [PubMed]
- Roghani, A. The Influence of Covid-19 Vaccine on Daily Cases, Hospitalization, and Death Rate in Tennessee: A Case Study in the United States. JMIRx Med. 2021, 2, e29324. [Google Scholar] [CrossRef] [PubMed]
- Virginia Department of Health. VDH-COVID-19-PublicUseDataset-Cases-by-Vaccination-Status. 2021. Available online: https://data.virginia.gov/dataset/VDH-COVID-19-PublicUseDataset-Cases-by-Vaccination/vsrk-d6hx (accessed on 12 October 2021).
- Ritchie, H.; Mathieu, E.; Rodés-Guirao, L.; Appel, C.; Giattino, C.; Ortiz-Ospina, E.; Hasell, J.; Macdonald, B.; Beltekian, D.; Roser, M. oronavirus Pandemic (COVID-19). Our World in Data. 2020. Available online: https://ourworldindata.org/coronavirus (accessed on 31 January 2022).
- Liu, Z.; Magal, P.; Seydi, O.; Webb, G. A COVID-19 epidemic model with latency period. Infect. Dis. Model. 2020, 5, 323–337. [Google Scholar] [CrossRef]
- Jin, Y.H.; Cai, L.; Cheng, Z.S.; Cheng, H.; Deng, T.; Fan, Y.P.; Fang, C.; Huang, D.; Huang, L.Q.; Huang, Q.; et al. A rapid advice guideline for the diagnosis and treatment of 2019 novel coronavirus (2019-nCoV) infected pneumonia. Mil. Med. Res. 2020, 7, 4. [Google Scholar] [CrossRef] [PubMed] [Green Version]
- Goldberg, Y.; Mandel, M.; Bar-On, Y.M.; Bodenheimer, O.; Freedman, L.; Haas, E.J.; Milo, R.; Alroy-Preis, S.; Ash, N.; Huppert, A. Waning immunity of the BNT162b2 vaccine: A nationwide study from Israel. medRxiv 2021. [Google Scholar] [CrossRef]
- Ward, H.; Cooke, G.; Atchison, C.; Whitaker, M.; Elliott, J.; Moshe, M.; Brown, J.C.; Flower, B.; Daunt, A.; Ainslie, K.; et al. Declining prevalence of antibody positivity to SARS-CoV-2: A community study of 365,000 adults. medRxiv 2020. [Google Scholar] [CrossRef]
- Tartof, S.Y.; Slezak, J.M.; Fischer, H.; Hong, V.; Ackerson, B.K.; Ranasinghe, O.N.; Frankland, T.B.; Ogun, O.A.; Zamparo, J.M.; Gray, S.; et al. Six-Month Effectiveness of BNT162B2 mRNA COVID-19 Vaccine in a Large US Integrated Health System: A Retrospective Cohort Study. Available online: http://xxx.lanl.gov/abs/https://ssrn.com/abstract=3909743 (accessed on 31 January 2022).
- Pathak, E.B.; Garcia, R.B.; Menard, J.M.; Salemi, J.L. Out-of-Hospital COVID-19 Deaths: Consequences for Quality of Medical Care and Accuracy of Cause of Death Coding. Am. J. Public Health 2021, 111, S101–S106. [Google Scholar] [CrossRef]
- Richards, F.J. A Flexible Growth Function for Empirical Use. J. Exp. Bot. 1959, 10, 290–301. [Google Scholar] [CrossRef]
- MacDonald, G. The analysis of equilibrium in malaria. Trop. Dis. Bull. 1952, 49, 871–889. [Google Scholar]
- Van den Driessche, P.; Watmough, J. Reproduction numbers and sub-threshold endemic equilibria for compartmental models of disease transmission. Math. Biosci. 2002, 180, 29–48. [Google Scholar] [CrossRef]
- Heffernan, J.M.; Smith, R.J.; Wahl, L.M. Perspectives on the basic reproduction ratio. J. R. Soc. Interface 2005, 2, 281–293. [Google Scholar] [CrossRef] [PubMed]
- Zi, Z. Sensitivity analysis approaches applied to systems biology models. IET Syst. Biol. 2011, 5, 336–346. [Google Scholar] [CrossRef] [PubMed]
- Farinholt, T.; Doddapaneni, H.; Qin, X.; Menon, V.; Meng, Q.; Metcalf, G.; Chao, H.; Gingras, M.C.; Avadhanula, V.; Farinholt, P.; et al. Transmission event of SARS-CoV-2 delta variant reveals multiple vaccine breakthrough infections. BMC Med. 2021, 19, 255. [Google Scholar] [CrossRef]
- Bar-On, Y.M.; Goldberg, Y.; Mandel, M.; Bodenheimer, O.; Freedman, L.; Kalkstein, N.; Mizrahi, B.; Alroy-Preis, S.; Ash, N.; Milo, R.; et al. Protection of BNT162b2 Vaccine Booster against Covid-19 in Israel. N. Engl. J. Med. 2021, 385, 1393–1400. [Google Scholar] [CrossRef] [PubMed]
- Pfizer and BioNTech Announce Phase 3 Trial Data Showing High Efficacy of a Booster Dose of Their COVID-19 Vaccine. Pfizer News. 2021. Available online: http://xxx.lanl.gov/abs/https://www.pfizer.com/news/press-release/press-release-detail/pfizer-and-biontech-announce-phase-3-trial-data-showing (accessed on 31 January 2022).
Publisher’s Note: MDPI stays neutral with regard to jurisdictional claims in published maps and institutional affiliations. |
© 2022 by the authors. Licensee MDPI, Basel, Switzerland. This article is an open access article distributed under the terms and conditions of the Creative Commons Attribution (CC BY) license (https://creativecommons.org/licenses/by/4.0/).