1. Introduction
Despite ubiquity in daily life and high production volume (
with 1.6% annual growth in Europe as of 2019 [
1]), corrugated cardboard and especially its production receive only a little attention in scientific research. The existing research is mainly focused on mechanical properties such as buckling under load [
2], bending, and torsional and transverse shear stiffness [
3]. In [
4,
5], the effect of partially crushing the corrugated structure—a problem that routinely occurs while printing or otherwise processing corrugated board—on mechanical properties is studied numerically, analytically and with lab tests, while differentiating the structure of the corrugation.
This focus on mainly mechanical properties of corrugated board is also present in the standardized testing procedures applied in corrugated board industry. Ref. [
6] gives an overview over usual testing procedures, including flat crush test, edge crush test, and tests for puncture and bursting resistance. It should be noted that those tests are designed to destroy the analyzed samples. In [
7], the authors provide both a numerical and an analytical model to predict compressive strength, edge crush test, and overall stiffness of corrugated board, and could prove that the much more easily evaluated analytical model reaches the same accuracy as the numerical approach.
The most typical product made of corrugated board are boxes for storage and transportation. Therefore, the load-bearing capability of those boxes is also of interest. Ref. [
8] provides a review of the research on the load-bearing capability of corrugated board boxes depending of various influence factors (e.g., moisture, holes, or inserts). Recently, a series of articles [
9,
10,
11] systematically analyzed the influence of various modifications in the basic structure of a standard flap box, namely, the influence of holes, perforations, and offset in the height of the flaps, respectively. Combining numerical finite-element calculations with lab tests, those articles derived improved analytical formulas for estimating the compressive strength of such modified boxes compared to classical and widely used formulas. Production defects such as warping of the board see less research activity. As in the examples above, often the properties of error-free manufactured corrugated board are investigated. Production defects are nonetheless a practical problem: corrugated board that exceeds a certain limit of warp can no longer be reliably processed and must therefore be considered as waste. Ref. [
12] describes practical optimizations to reduce warp in production, but does not address the formation of warp within the corrugated board. This article acts as a first step of a more theory-based approach to process control by providing a mathematical model for the description of warp.
In order to reduce waste resulting from the production of warped corrugated board, better process control is necessary. This, in turn, requires the possibility of measuring warp in an automated and cost-efficient way; otherwise, accepting a certain amount of warp (and, consequently, waste) can simply be the more economic decision for running a production plant. A possible solution for this problem is to use a low number of cheaply available spot displacement sensors (usually based on laser triangulation) to measure the height at discrete points distributed sparsely over the surface of the corrugated board, and interpolate between those points. This interpolation should represent the form of (warped) corrugated board as closely as possible with a minimum of measured points. Therefore, this article develops a model describing the surface form of warped corrugated board. The knowledge about the physical properties of corrugated board embedded in this model reduces the degrees of freedom which need to be determined from measured data, and, as a consequence, the number of sensors required. This allows automated, cost-efficient, and robust (ignoring small-scale surface defects) measurement of warp in corrugated board manufacturing, providing a previously unattained level of information about the warping of the produced board. In a future step, this information could be used for real-time process monitoring and control.
The model proposed in this article expresses warp as a result of internal stress using classical Kirchhoff plate theory. Thereby, the model incorporates knowledge of the physical causes of warp which helps to reduce the number of measure points required for interpolation. In order to maximize the practical utility of the model for analyzing warp in the production process and ultimately provide the necessary measurement tools to dynamically adjust production parameters to reduce warp, no knowledge of the mechanical parameters of the corrugated board is assumed, since those parameters can usually only be obtained by destructive testing. Instead, the number of parameters is reduced as much as possible, allowing reconstruction of the necessary information from the measured data.
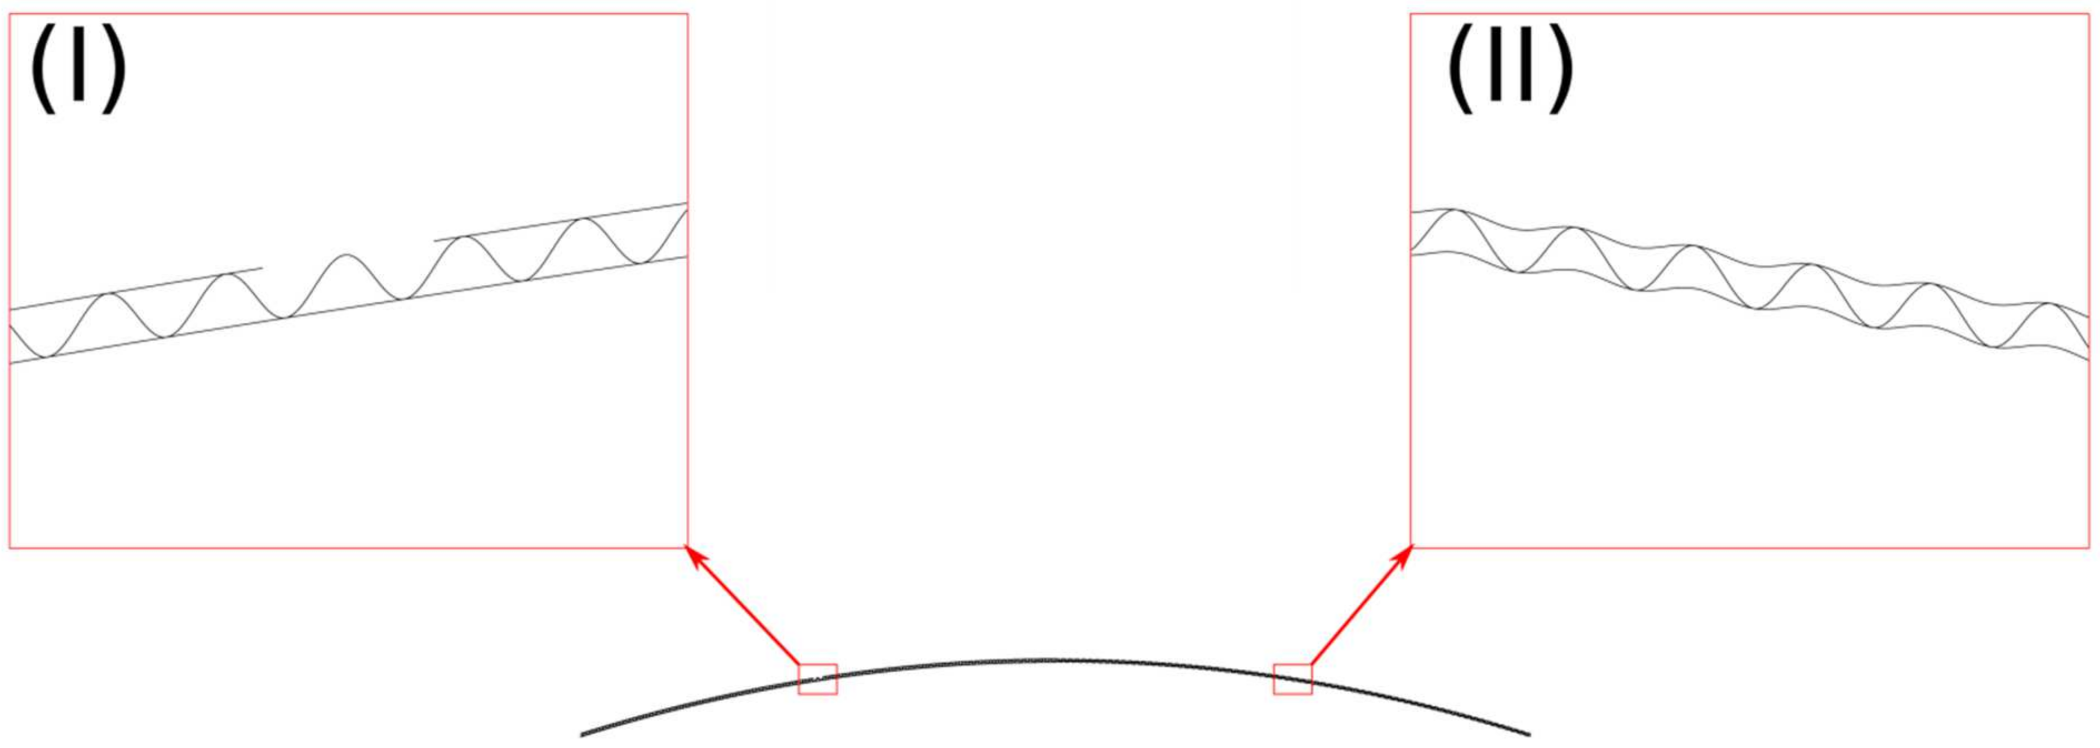
This model also helps to formalize the concept of warp. Warp is intuitively described as the general trend of the surface over a larger area (as opposed to local fluctuations such as dents or the washboarding effect, which, while also important quality metrics, need to be treated differently in production), a definition which is too vague to actually work with.
Figure 1 illustrates the difference between large-scale warp and small-scale surface defects. This means that, even if the exact surface of a corrugated board would be known, the warp would still not be easily quantified. In the corrugated board industry, cumulative values derived from the maximal deviation from an ideal plane are currently routinely used to quantify warp. Ref. [
13] calculates the direct quotient between the maximal deflection and the width of the board, whereas [
14] uses the quadratic width of the board along with a normalization factor to ensure a dimension-free result. While those metrics can serve as a quality feature to distinguish between acceptable and non-acceptable amounts of warp, reducing a surface to a single number neglects a lot of information. This information could otherwise be used to improve the control of the manufacturing process.
In order to simplify the rather complex structure of corrugated board, homogenization is often applied, among others in [
4,
5,
9,
10,
11]. This technique has already been extensively studied and been proven to represent the behavior of various corrugated structures with high accuracy. Literature therefore offers a range of different approximations to calculate the stiffness parameters of an equivalent orthotropic plate from the properties of the base material of corrugated plates. In [
15], different homogenization models are compared using finite-element methods. The method proposed in [
16] is not only verified with regard to the displacement under load, but also with regard to the internal forces and moments of the board. The approach outlined in [
17] is checked for validity in borderline cases, such as a corrugation height of zero, against the respective analytic solutions. In [
18], a combination of classical lamination theory and an equivalent energy method is used with a special focus on corrugated laminates. Recently, [
19] included the effects of creasing and perforation on stability in homogenization approaches, and [
20] derives effective torsional and transversal stiffness parameters for homogenization of corrugated cardboard.
The mentioned applications of the homogenization technique are intended to analyze the reaction of corrugated board to external loads. This article, in contrast, focuses on internal stress in order to model warp, which is not covered by the models in the existing literature. In [
21], warp in fused deposition modeling (FDM) rapid prototyping is modeled. The basic situation is somewhat similar to corrugated board, as rapid prototyping also works with clearly defined layers. Since workpieces manufactured this way can have arbitrary shape, they cannot be modeled as plates, contrary to corrugated board. This prevents an easy inclusion of forces—namely, their own weight—in the model. Moreover, the model in [
21] utilizes the fact that the primary cause of warp in FDM processes, thermal contraction during the cooling phase, can directly be expressed by simple physical relations. The situation in corrugated board is more complex, which forces this article to take a more general approach.
2. Modeling
2.1. General Model Assumptions
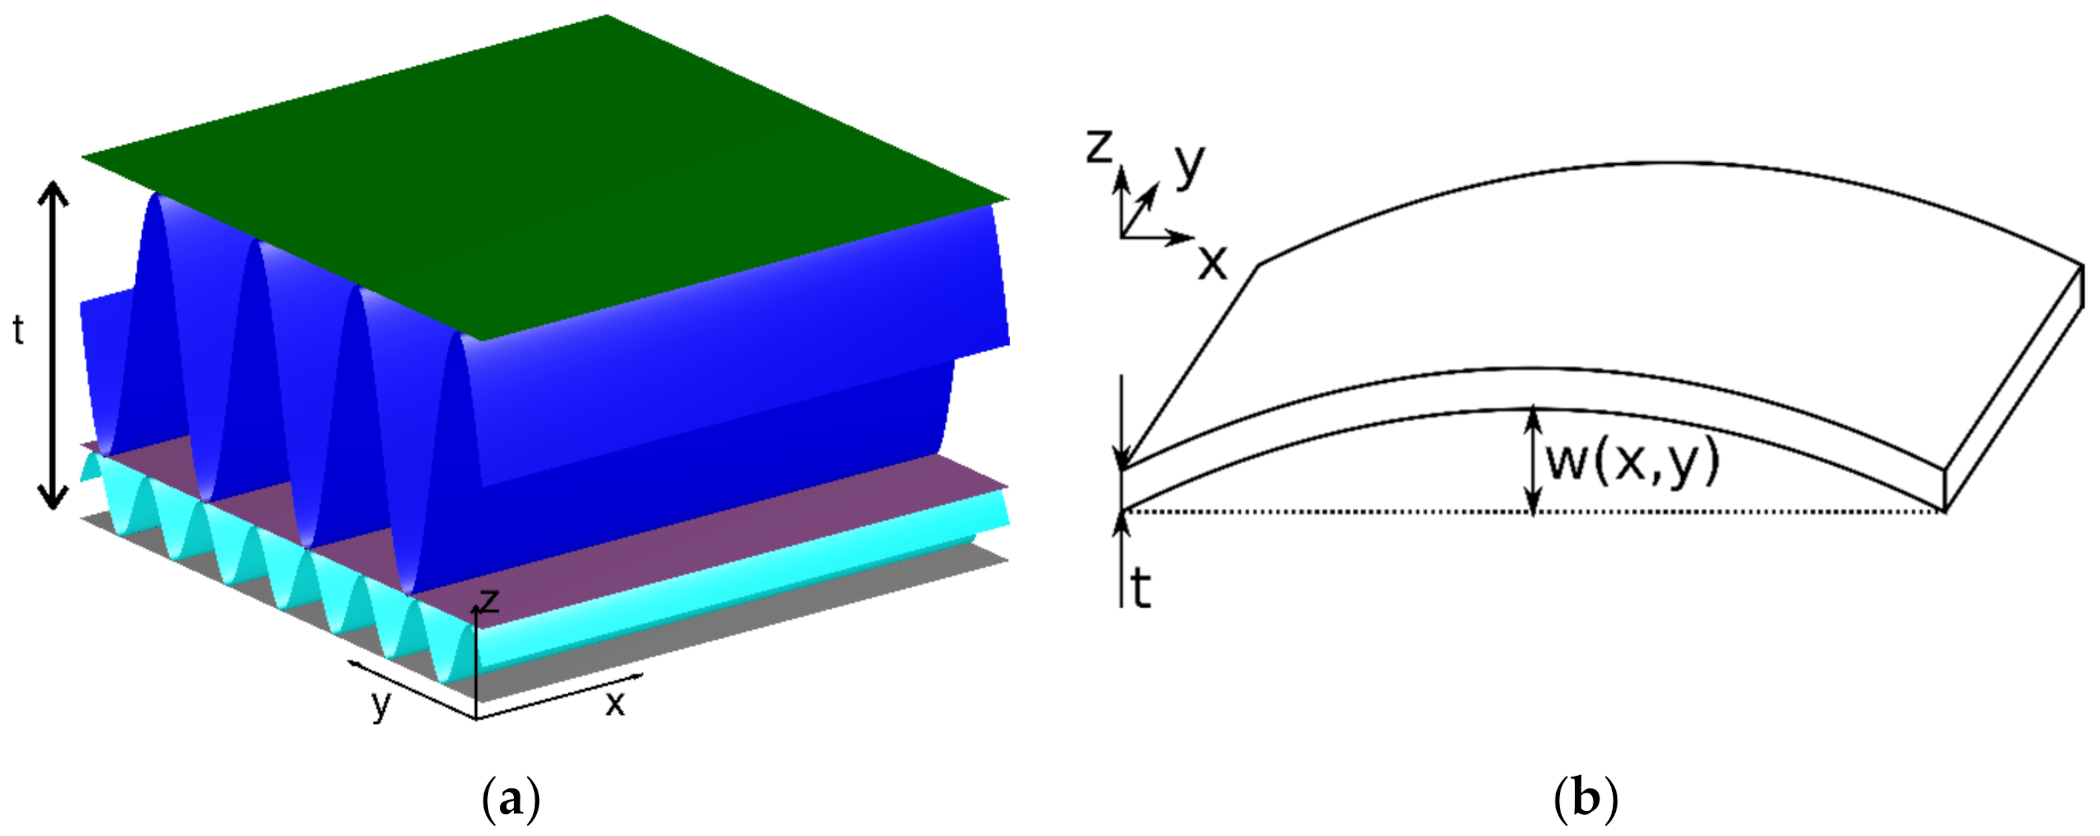
Corrugated board is produced by gluing together several—usually at least 3—paper sheets (see
Figure 2a for an example). Every second sheet is pressed into a corrugated form before gluing it to the flat sheets to form a fluting. Warpage is caused by internal stresses in this composite. Alternatively, these stresses can also be regarded as the result of deformation of individual sheets at the time of gluing in relation to the later state of equilibrium (
Figure 3). The reason for this distortion—temperature, humidity, and mechanical prestressing of the sheets would be obvious parameters in the actual production process—is irrelevant for modeling; it is sufficient to note that such a distortion state exists.
The corrugated board is modeled as an orthotropic plate residing in the
xy-plane with the corrugation direction aligned to one of the coordinate axes (
Figure 2b). The warp is, as mentioned above, the systematic large-scale deviation from the ideal planar form, not including any local defects. It is seen as the result of the internal strain based on linear Kirchhoff theory. This means that the displacement
w(x,y) is considered to be small enough to be neglected and all calculations can be performed as if the plate was flat.
It should be noted that the approach of this model is to take the well-established homogenization approach for corrugated structures and apply it backwards in a certain sense: as shown in the literature [
16,
17,
18], it is possible to approximate the overall behavior of a corrugated board by a homogenous, orthotropic plate. Therefore, the proposed model assumes that internal forces, strains, and moments can be approximated as in a homogenous plate as well.
Besides the internal stress, the only forces considered are the weight of the board and the reaction forces of the underground. Since the model is intended to be used to characterize warp, it seems reasonable to assume the board to be under measurement conditions with no external loads. The self-weight, however, needs to be included in calculations: while corrugated structures are generally known for providing high stiffness at low specific weight, the size of corrugated boards creates lever arms that can cause visible deformation under the weight of the board.
By only considering situations without external loads, the model can be simplified: the board is only under bending load (compression in z-direction can be neglected compared to the warping), while in-plane deformation is not considered. Therefore, extension-bending coupling—which would otherwise be relevant if the board is not symmetric—does not have any effect relevant to the considerations of the article and can thus be neglected.
Since there are no external in-plane forces, classical buckling is not included in the model. The compressive forces for buckling must stay in plane while the plate is deformed so that a lever arm exists within the deformed plate. The internal forces discussed here, however, will always be aligned with the plate. The in-plane deformation of the board is neglected since it is, contrary to warpage, not relevant in industrial practice.
For the rest of this section, the relevant equations for modeling orthotropic Kirchhoff plates under orthogonal surface load are summarized based on standard textbook knowledge (e.g., [
22] (pp. 193–208)). It is important to note here that the subsequent equations refer to an orthotropic plate, which would show the same reaction as the corrugated board to a pure bending load; the equivalent material parameters used here cannot be used to describe in-plane deformation. The stress–strain relation of an orthotropic material within a plane is:
As usual,
, and
denote the normal and shear stress, respectively (with the orientation given in the index),
and
normal and shear strain, and the matrix includes the elastic parameters of the material. Under the assumptions of Kirchhoff theory, the strain is approximated from the deflection
w by:
The moments in a plate of thickness
t (aligned with the
z-coordinate as shown in
Figure 2b) are given by integrals over the stresses:
Note that Equation (3) is derived by analyzing an infinitesimal section of the plate. The moments are therefore given per length of the section plane and appear to have the unit of forces. One would obtain the actual moments by integrating the terms above over the length of the respective edge
Inserting the relations (2) yields:
From the equilibrium of forces over an infinitesimal element, one obtains:
Here, p denotes the surface load of the plate, which consists of the weight of the board and the reaction forces of the underground, as stated above. Combining these equations leads to the behavior of plates under external forces without any internal stress and therefore without warp.
2.2. Effects of Internal Stress
Equation (4) is usually used to describe the moments and, in combination with (3), the stresses in a plate deformed by external forces. The linearity of Kirchhoff theory allows use of the (negative) internal stresses of the flat plate instead: the deformation by external forces that would cause exactly the negative stress values in a plate without internal stress leads to a compensation and therefore a relaxed state in a plate with internal stresses. The proposed model approximates the corrugated board as a homogenous orthotropic plate; however, internal stress must ultimately be introduced by the paper sheets, which are of negligible thickness compared to the board. Therefore, the relationship between the corrugated board and the idealized plate model needs to be analyzed.
For the non-corrugated layers of paper (liners), the stress value at their respective z-positions in the plate is simply the stress introduced in the paper during production. In the case of fluting, the situation seems to be more complex, as their z-position is a function of the location in the xy-plane. However, the warp which is to be modeled here is by its definition the average effect on larger scales. It is therefore reasonable to assume that there is an average z-position for each corrugated layer which sees the stress of this layer. This average position does not need to be the arithmetic mean; the important point is that, for all layers of paper, there exists a z-position within the equivalent orthotropic plate at which the internal stress of the paper is equal to the stress in the orthotropic plate.
At this point, the internal stress
at
n different
z-positions
is known, where
n denotes the number of paper layers in the corrugated board. Since the equations for the three components are identical in principle,
is used to represent
,
, or
. The additional index I denotes quantities resulting from internal stress. Between the positions
, some kind of interpolation must exist. For this model, we will assume that the interpolation can be written as:
where
can be chosen from all functions which satisfy the condition
with the Kronecker symbol
. While this condition may seem to be trivially satisfied, it is important to note that
is required to be independent of the coordinate in the
xy-plane. This would be natural to assume for an infinite uniform plane, where there is no physical difference between two different points. Therefore, it can be seen as a way of neglecting boundary effects.
In other words, this means that the stress in any height can be expressed as a (height-dependent) linear combination of the stress values in the paper planes. This assumption is reasonable, as the entire theory is based on linear material properties.
Inserting this interpolation approach into the (internal) moment equations yields:
As seen here, the expression for the moment can be separated into a position-dependent and a position-independent part. By substituting:
one can rewrite the equation as:
This means the moments in the equivalent orthotropic plate can be modeled as a linear combination of the stresses in the individual paper sheets. The same moments and therefore the same bending could also be realized with a linear stress gradient along the z-axis:
Note that
, as defined here, is given in a unit of stress per height. The respective moment would be:
Hence, the total difference in the stress per height
between the top and the bottom side of the corrugated board (with an assumed linear stress gradient) can be expressed as:
Combining this result with the moments caused by bending under external forces (4) yields:
Note that, while the quantities do not necessarily appear in real corrugated board, they can still be used as a measure of the effective stress as defined by (12).
2.3. Eliminating Excess Degrees of Freedom
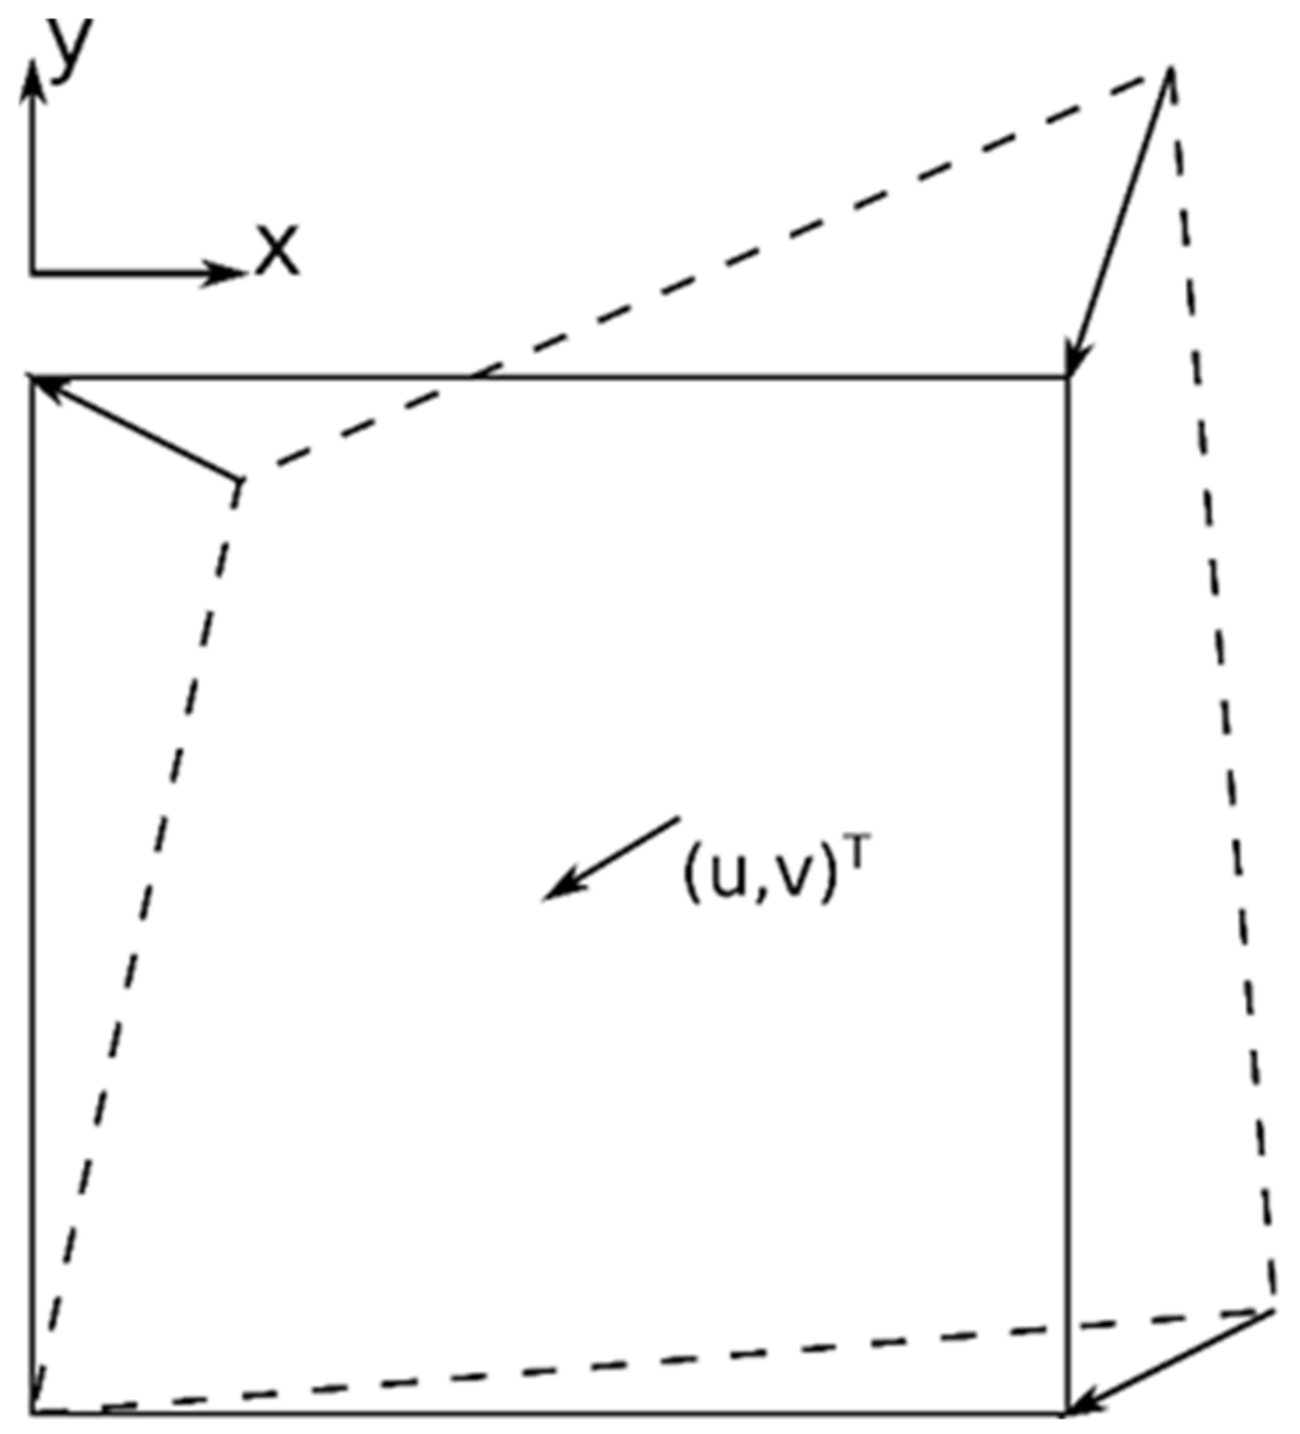
Thus far, the modeling was focused on the stresses within the paper sheets. However, those stresses were initially assumed to be introduced by a deformation of the respective sheets at the time of production. This means the three-dimensional stress field
is caused and therefore completely described by the two-dimensional displacement field (
u,v)
T (see
Figure 3). Thus, it is important to note that the strain components (and therefore also the stress components) are not independent from each other, but can be derived by:
The displacement fields are again properties of the individual paper sheets. The linearity of the approach allows use of Equation (1) and to easily insert the different displacements
or alternatively the displacement differences per height
, of an equivalent linear gradient, defined analogously to Equation (10):
Since the effective material parameters for the homogenized orthotropic plate already depend on the geometric details of the corrugation, the leading factors are combined with those parameters by substituting and .
Inserting this into the equilibrium of forces (5) results in:
with:
This means the corrugated board behaves identically to a board with a different shear modulus but without the influence of transverse contraction.
In this alternative material, the moments would be:
The Equations (16) and (18) can be used to analyze warp from measured data. In order to do this, only three effective material parameters and the effects of production parameters on three effective displacement variables need to be fitted.
2.4. A Condition for Warp-Free Corrugated Board
Since the aim of corrugated board production is to eliminate warp, the case
is analyzed in more detail. If this board is supported by an equally flat surface, the area weight and the reaction forces of the underground compensate each other, so (16) is simplified to:
Obviously,
only occurs as a derivative of
x and
only as a derivative of
y: any constant part of the displacement function is merely a coordinate transformation, which does not cause any physical effects. Therefore, substituting
and
in accordance with (14) yields:
or
Using the principal-axis transformation (the parameter
simply denotes the ratio between the principal values, allowing a further simplification of the equations later):
with:
the equation is further simplified:
It should be noted that this transformation is only applied for mathematical reasons: due to the structure of the matrix in Equation (21), there must be a rotation matrix (23) which satisfies Equation (22). That means that, in a rotated coordinate system:
the condition for warp-free corrugated board can be written as:
This equation only defines the higher-order terms of the strain functions. The linear and constant terms are defined by boundary conditions. The strain components orthogonal to the edge must disappear at the boundaries. Otherwise, there would be forces orthogonal to the edges and the equilibrium of forces would be violated, as the model assumes no external forces.
The condition (26) for warp-free corrugated board seems surprisingly simple. The material is effectively reduced to only two parameters α and φ. However, the equation must be fulfilled for all points of the surface. This means that the strain along the
- and
-axes must be proportional by a fixed factor α to each other. The only exceptions are linear and constant terms, which are, however, completely defined by the boundary conditions. Since corrugated board is produced in a continuous process, it has two clearly distinct directions. In machine direction (aligned with the fluting, coordinate axis
y in
Figure 2), the individual sheet is cut from a quasi-infinite band, while the width in cross direction (orthogonal to machine direction, coordinate axis
x in
Figure 2) is limited by the width of the machines. Therefore, it is difficult to imagine a way of matching the strains in two orthogonal axes in practice by influencing production parameters. The only practical way to satisfy (26) seems to be a completely strain-free board, i.e.,
and
.
3. Applying the Model on Measured Surface Data
The primary intended use for the proposed model is the post-processing of measured surface data. This allows both the interpolation of the surface and the separation of warp and other surface defects which are not caused by warp. The basic idea, as shown in
Figure 4, is to fit the parameters
, the surface load
, and the effective displacement field
—together called “displacement and stiffness parameters” in
Figure 4—so that the surface geometry predicted by the model matches the surface height, measured at defined sample points and stored in order in a measurement vector
(“Measured data at sample points”). While the location of those sample points in the
xy-plane must be known, the method proposed here does not depend on a specific sample pattern (e.g., rectangular grid), although the location will influence the numerical precision. The outer loop (consisting of everything in
Figure 4 outside of the grey area) follows the general principle of regression by quadratic error minimization, where an optimizer tries to find an input to an abstract function block (the grey area in
Figure 4) in order to minimize the quadratic difference between the output of this function block and some external value (in this case, the measured data).
To achieve this, the model (16), denoted as “Bending model” in
Figure 4, is used to predict the deformed surface using a mesh-free Ritz–Galerkin approach (the implementation used here follows largely the simple textbook approach as explained, for example, in [
23] and would most likely provide room for improvements). It should be noted that, although this step is only shown as an arrow in
Figure 4, it requires an iterative algorithm to calculate the parameters defining the surface (“Functional surface description” in
Figure 4). This prediction step is seen as a function
mapping the parameters mentioned previously to a vector of the expected surface heights at given sampling points. The final step of this mapping (“Virtual sampling” to generate “Predicted heights at sample points” in
Figure 4) is a simple evaluation of the functional surface representation defined by the parameters at the known sampling points.
The displacement field is numerically represented by the vector of coefficients of a polynomial approximation. The surface load consists of the weight of the board and the reaction forces at the points where the corrugated board is in contact with the underground. The board weight is assumed to be equally distributed in the xy-plane, neglecting the fact that sloped areas contain more board per projected area. This approximation greatly simplifies the problem and is consistent with the small deformation assumption needed for the linearity of Kirchhoff theory.
The contact forces are determined at discrete points distributed in a regular grid across the board. An elastic contact model is used, i.e., the contact forces compress the board by a small amount, following Hooke’s Law. However, the contact forces result in nonlinear behavior, since they cannot become negative but stay equal to zero once the board lifts of the ground at a specific point (the contact force is proportional to where denotes the nonlinear Heaviside step function and the displacement). This means that the model must be solved as a non-linear system.
In practice, this function
(which, as defined above, maps the effective properties of the board to the surface form) has no analytic representation, and evaluating it represents a numerical workload noticeable on a typical desktop computer. However, defining this function allows calculation of the initially unknown parameter as solution to a minimization problem:
This problem can be solved using a gradient descent algorithm, where the gradient can, if necessary, be approximated numerically using a simple difference quotient. This approach allows use of (16) directly, where parameters describing both the base materials and the detailed structure of the corrugation have been aggressively summarized to a few effective constants, without any need to further analyze the detailed structure of the board. This also includes the interpolation functions as introduced in (6) and their integrals as defined in (9): only the weighted sums of the displacements in the individual sheets are used; therefore, the mere existence of the interpolation functions or the coefficients is sufficient for the numerical application.
A detailed analysis of a specific corrugation structure could of course be used to reconstruct the interpolation functions in order to gain additional insight into inner effects within the corrugated board; this is, however, not the aim of this work. In fact, due to the normalizations and substitutions applied, the displacement fields calculated internally by the numerical implementation are represented in units of measurement which are implicitly defined by the properties of the analyzed corrugated board and would therefore be hard to analyze.
4. Comparison with Measured Surfaces
Samples taken from the production process of a commercial corrugated board plant were measured with optical triangulation sensors. The shape of the surface was then approximated based on the proposed model, where the displacement functions were limited to quadratic polynomials in machine direction and cubic polynomials in cross-direction. Since the polynomial parameters describing the displacement functions need to be determined from the measurement data, the aim is to choose the lowest possible order without seriously reducing the quality of the fit. Needlessly increasing the number of degrees of freedom could lead to overfitting and increase the impact of measurement noise on the result; moreover, the number of measurement points required would be increased. Therefore, the entire model presented in this article is focused on reducing the number of parameters.
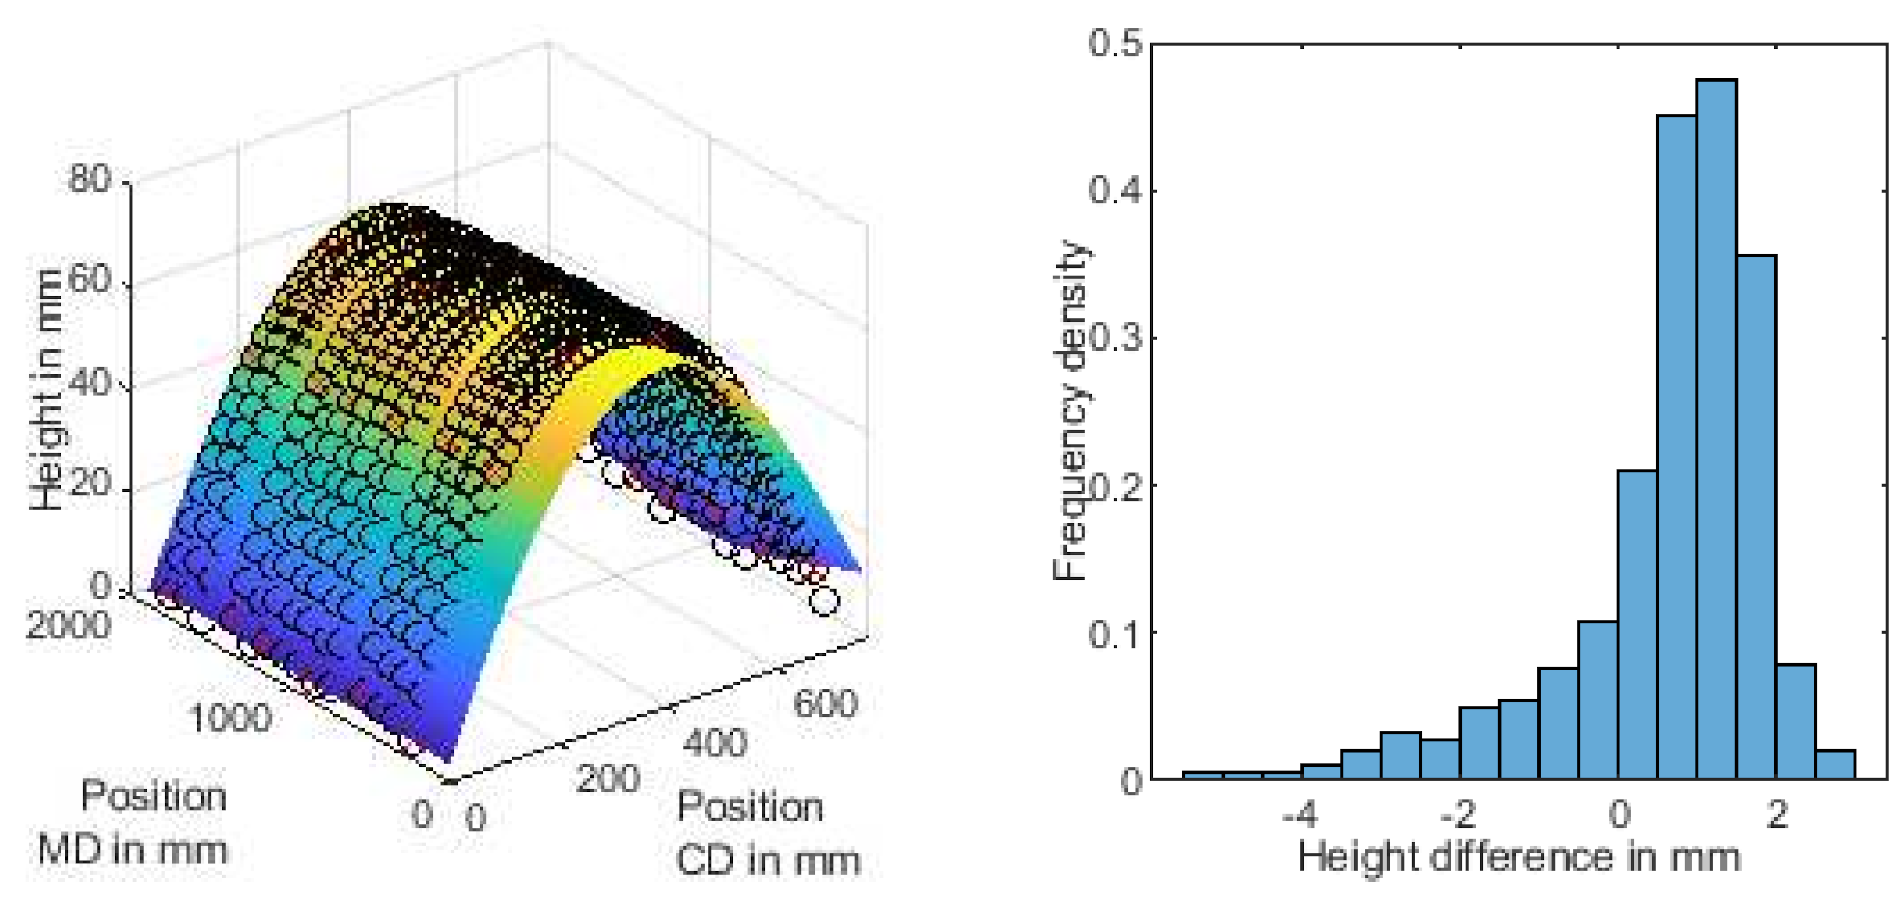
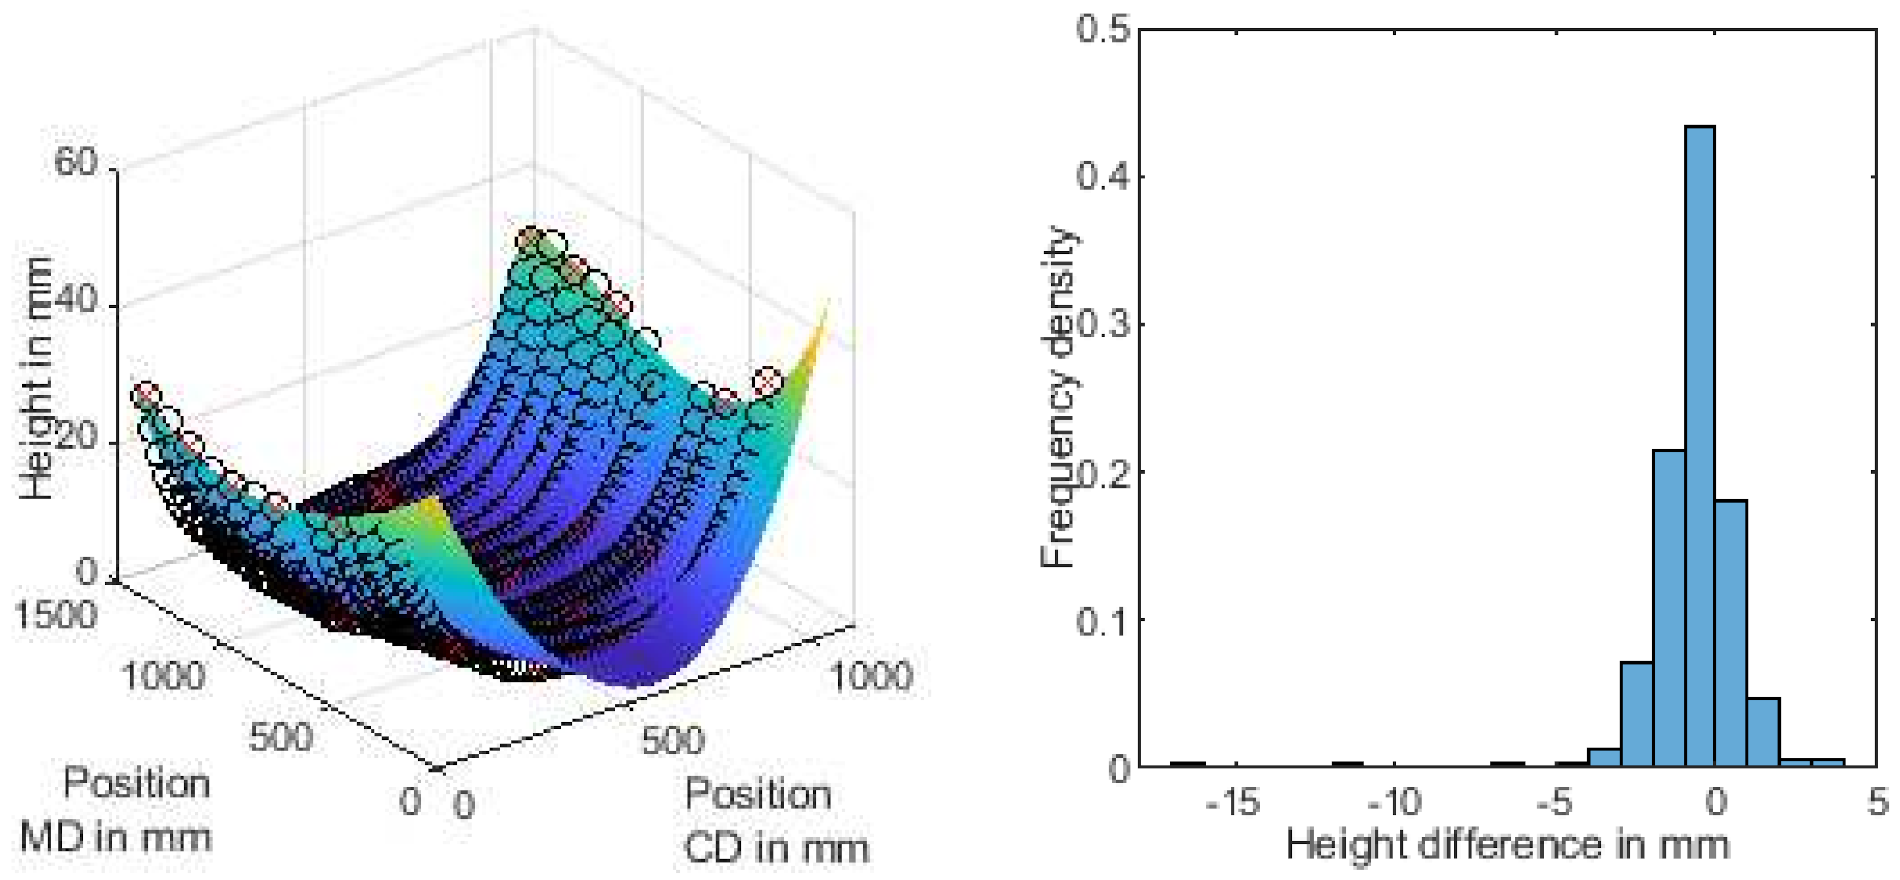
Two examples (size of the boards 1884 × 770 mm and 1430 × 1040 mm, respectively) from ongoing research are presented in
Figure 5. While boards were obtained from a commercial production plant, they would have been considered waste due to the amount of warp present. The surface defined by the model (displayed as continuous, colored surface in the plots) shows the same shape as the measured data points (black circles in the plots) on a larger scale, while smoothing local variations. The interpolation capability of the model is shown by the fact that only a 6 × 6 grid of measured data points (highlighted as red crosses in
Figure 5) was used as input to the fitting algorithm, while the other data points were reserved to verify the results. Some slight systematic deviation from the data can be seen near the edges of the board, which are most likely caused by the numerical solver for the differential Equation (16). The histograms in
Figure 5 show the deviation between the measured points and the surface defined by the proposed model, with most of the data points only deviating by a few millimeters (95% of the measured data points are within 2.6 mm and 2.9 mm, respectively, of the reconstructed surfaces in the examples) from the model surface. Since, as seen in the 3D plots, the model surface reproduces the large-scale deformation of the corrugated board—in other words, the warp—the remaining deviations can be seen as being part of the noise when analyzing or controlling warp.
5. Discussion
The model proposed in this article does not contain any assumptions about the inner structure of the board. Therefore, it is applicable to any corrugated board regardless of the number of layers or the form of the corrugation. The only relevant model assumptions are the validity of the homogenization approach and the assumption of a position-independent interpolation function. The homogenization has already been proven as a good approximation in numerous previous publications. For the second assumption, the position-independent interpolation, arguments were provided in this work.
This generality comes at the cost that no calculation method for the linear factors can be given at this level of abstraction. The main result is the existence of a linear relationship between the displacement fields in the paper sheets and the curvature caused by the internal stress.
While this result may seem weak, a complete functional relationship would probably offer only little additional benefit for the actual industrial practice. The necessary material data are not routinely measured in corrugated board production. Therefore, it appears to be a better approach to fit the linear factors directly to the measured curvatures as outlined in
Section 3, especially since there are only three effective parameters in (16).
The fact that the curvature depends on a linear combination of the displacements in the individual paper sheets implies that there must be more than one solution for eliminating warp in corrugated board. Only a weighted sum of all paper sheets occurs in the final equations, which means that in theory any effect can be accomplished by influencing only one layer. This seems plausible, as it would otherwise be hard to imagine how warp could be controlled in practice. Many plants rely completely on heuristics and experience of their employees to correctly balance the production parameters (various temperatures, moisture, prestressing, etc.). This would hardly be possible if there were only one solution which results in good (i.e., warp-free) corrugated board within the space of possible production parameters.
Note that this does not contradict the conclusion drawn from Equation (26), which was that the equivalent strains must completely disappear for the board to be warp-free. The equivalent strains in (26) that must disappear are still linear combinations of the strains in the individual paper sheets, and the latter are directly and individually influenced by production parameters.
Establishing an analytic relationship between the displacement in the paper sheets and the curvature also allows inclusion of knowledge about the production process. Assume, for example, that there are a certain number of nozzles installed in the machine to moisturize the paper for processing. Then, moisture in the paper and therefore the displacement caused during subsequent drying, can only have a certain number of degrees of freedom.
A simple but general approach is to model the displacement functions as polynomials of a low degree, which was successfully done in the examples in
Section 4. As mentioned above, the board is produced in a continuous process. In machine direction, the individual sheet can therefore be seen as a local approximation similar to a Taylor series approximation, since control of production parameters varies only slowly compared to the production speed. In cross-direction, there are a limited number of devices interacting with the paper sheets. As long as this number is sufficiently low to prevent numerical instabilities, a simple polynomial interpolation in-between will probably yield acceptable results. Therefore, a practical approach can model the displacement with a quadratic or cubic polynomial in machine direction and a polynomial of degree three-to-five in cross-direction.
This reduction to a limited number of degrees of freedom can also serve an important role for measuring warp. Not every deviation of the real surface of corrugated board is caused by warp. As mentioned above, warp is large-scale, systematic curvature. In reality, however, warp cannot be measured directly. The only quantity which can be measured directly is the shape of the surface. Here, other effects, such as washboarding (where the surface partially follows the form of the fluting), or simple surface defects such as dents, superimpose the warp. Therefore, when combined with a suitable approximation for the technically plausible displacements in the paper sheets, this model can serve as a definition to separate the warp from other effects. Everything that can be explained by the model with displacement functions taken from a sensible function space is considered to be warp and effects of the self-weight (which can be separated by the model, if required). Therefore, to analyze warp, the measured surface data would be fitted to the model, yielding a smooth idealized surface, which in turn can be used to improve process control.
6. Conclusions
In this article, a novel method for modeling warp in corrugated cardboard has been developed. This allows more insight into both measurement and control of warp during the production of corrugated board. It gives a more detailed mathematical description of warp than the metrics currently used in the industry. The latter generally reduce the entire effect of warp to a single number, whereas the proposed model allows reconstruction of a 2D surface even from a limited number of sample points. At the same time, the results of applying the model are different from a simple surface scan of the corrugated board (using, e.g., a coordinate-measuring machine), since the latter would also include other surface defects (such as washboarding) which have different reasons and therefore need to be treated differently. The model, on the other hand, can act as a filter extracting the warp selectively, by implicitly defining a set of physically plausible surface forms for warped corrugated board.
The model does not require knowledge of the material parameters or the details of the corrugated structure, which makes it easily applicable in industrial production and processing of cardboard, as the mechanical properties are usually measured using destructive tests and, due to the nature of the raw materials, subject to variations even between seemingly similar batches. Instead, the model is reduced to a minimal set of parameters, which can be recovered from measurement data via least-square fits as outlined in
Section 3. The examples presented in
Section 4, taken from ongoing research, illustrate the possibility in principle of applying the model to real-world data. Detailed analysis of the optimal application of the model, including optimal selection of sample points and the achievable measurement uncertainty, remain open for future research.
While the model-based approach is applicable with only a minimal set of sensors, it trades those savings in hardware cost for an increased computational load. An efficient implementation of the necessary algorithms is crucial for any practical application, and even then, a real-time evaluation of every single corrugated board produced may not be feasible. Moreover, any model-based approach requires that the model assumptions are satisfied. Sharp bends in the board, for example, would most likely yield unpredictable results, as this is not included in the model. Furthermore, the board should not be too small, since the model neglects border effects.
In regard to controlling warp in production,
Section 2.4 derives the necessary condition for warp-free board. It is shown that, in theory, an infinite number of possible solutions to correct any given form of warp exists. This opens up the possibility of considering other criteria relevant in industrial corrugated board production, such as energy consumption and production speed.


