
Evaluation of the Factors Impacting the Water Pipe Leak Detection Ability of GPR, Infrared Cameras, and Spectrometers under Controlled Conditions


Abstract
:1. Introduction
1.1. Leak Detection Methods
1.2. Ground Penetrating Radar (GPR)
1.3. Spectrometer
1.4. Infrared (IR) Camera
1.5. Objectives
- Investigate the effectiveness of three NDTs (GPR, hand-held spectrometer, and an IR camera) in detecting leaks in WDI; and
- Assess the factors that may affect the NDTs’ response in detecting the water leaks.
2. Research Methodology
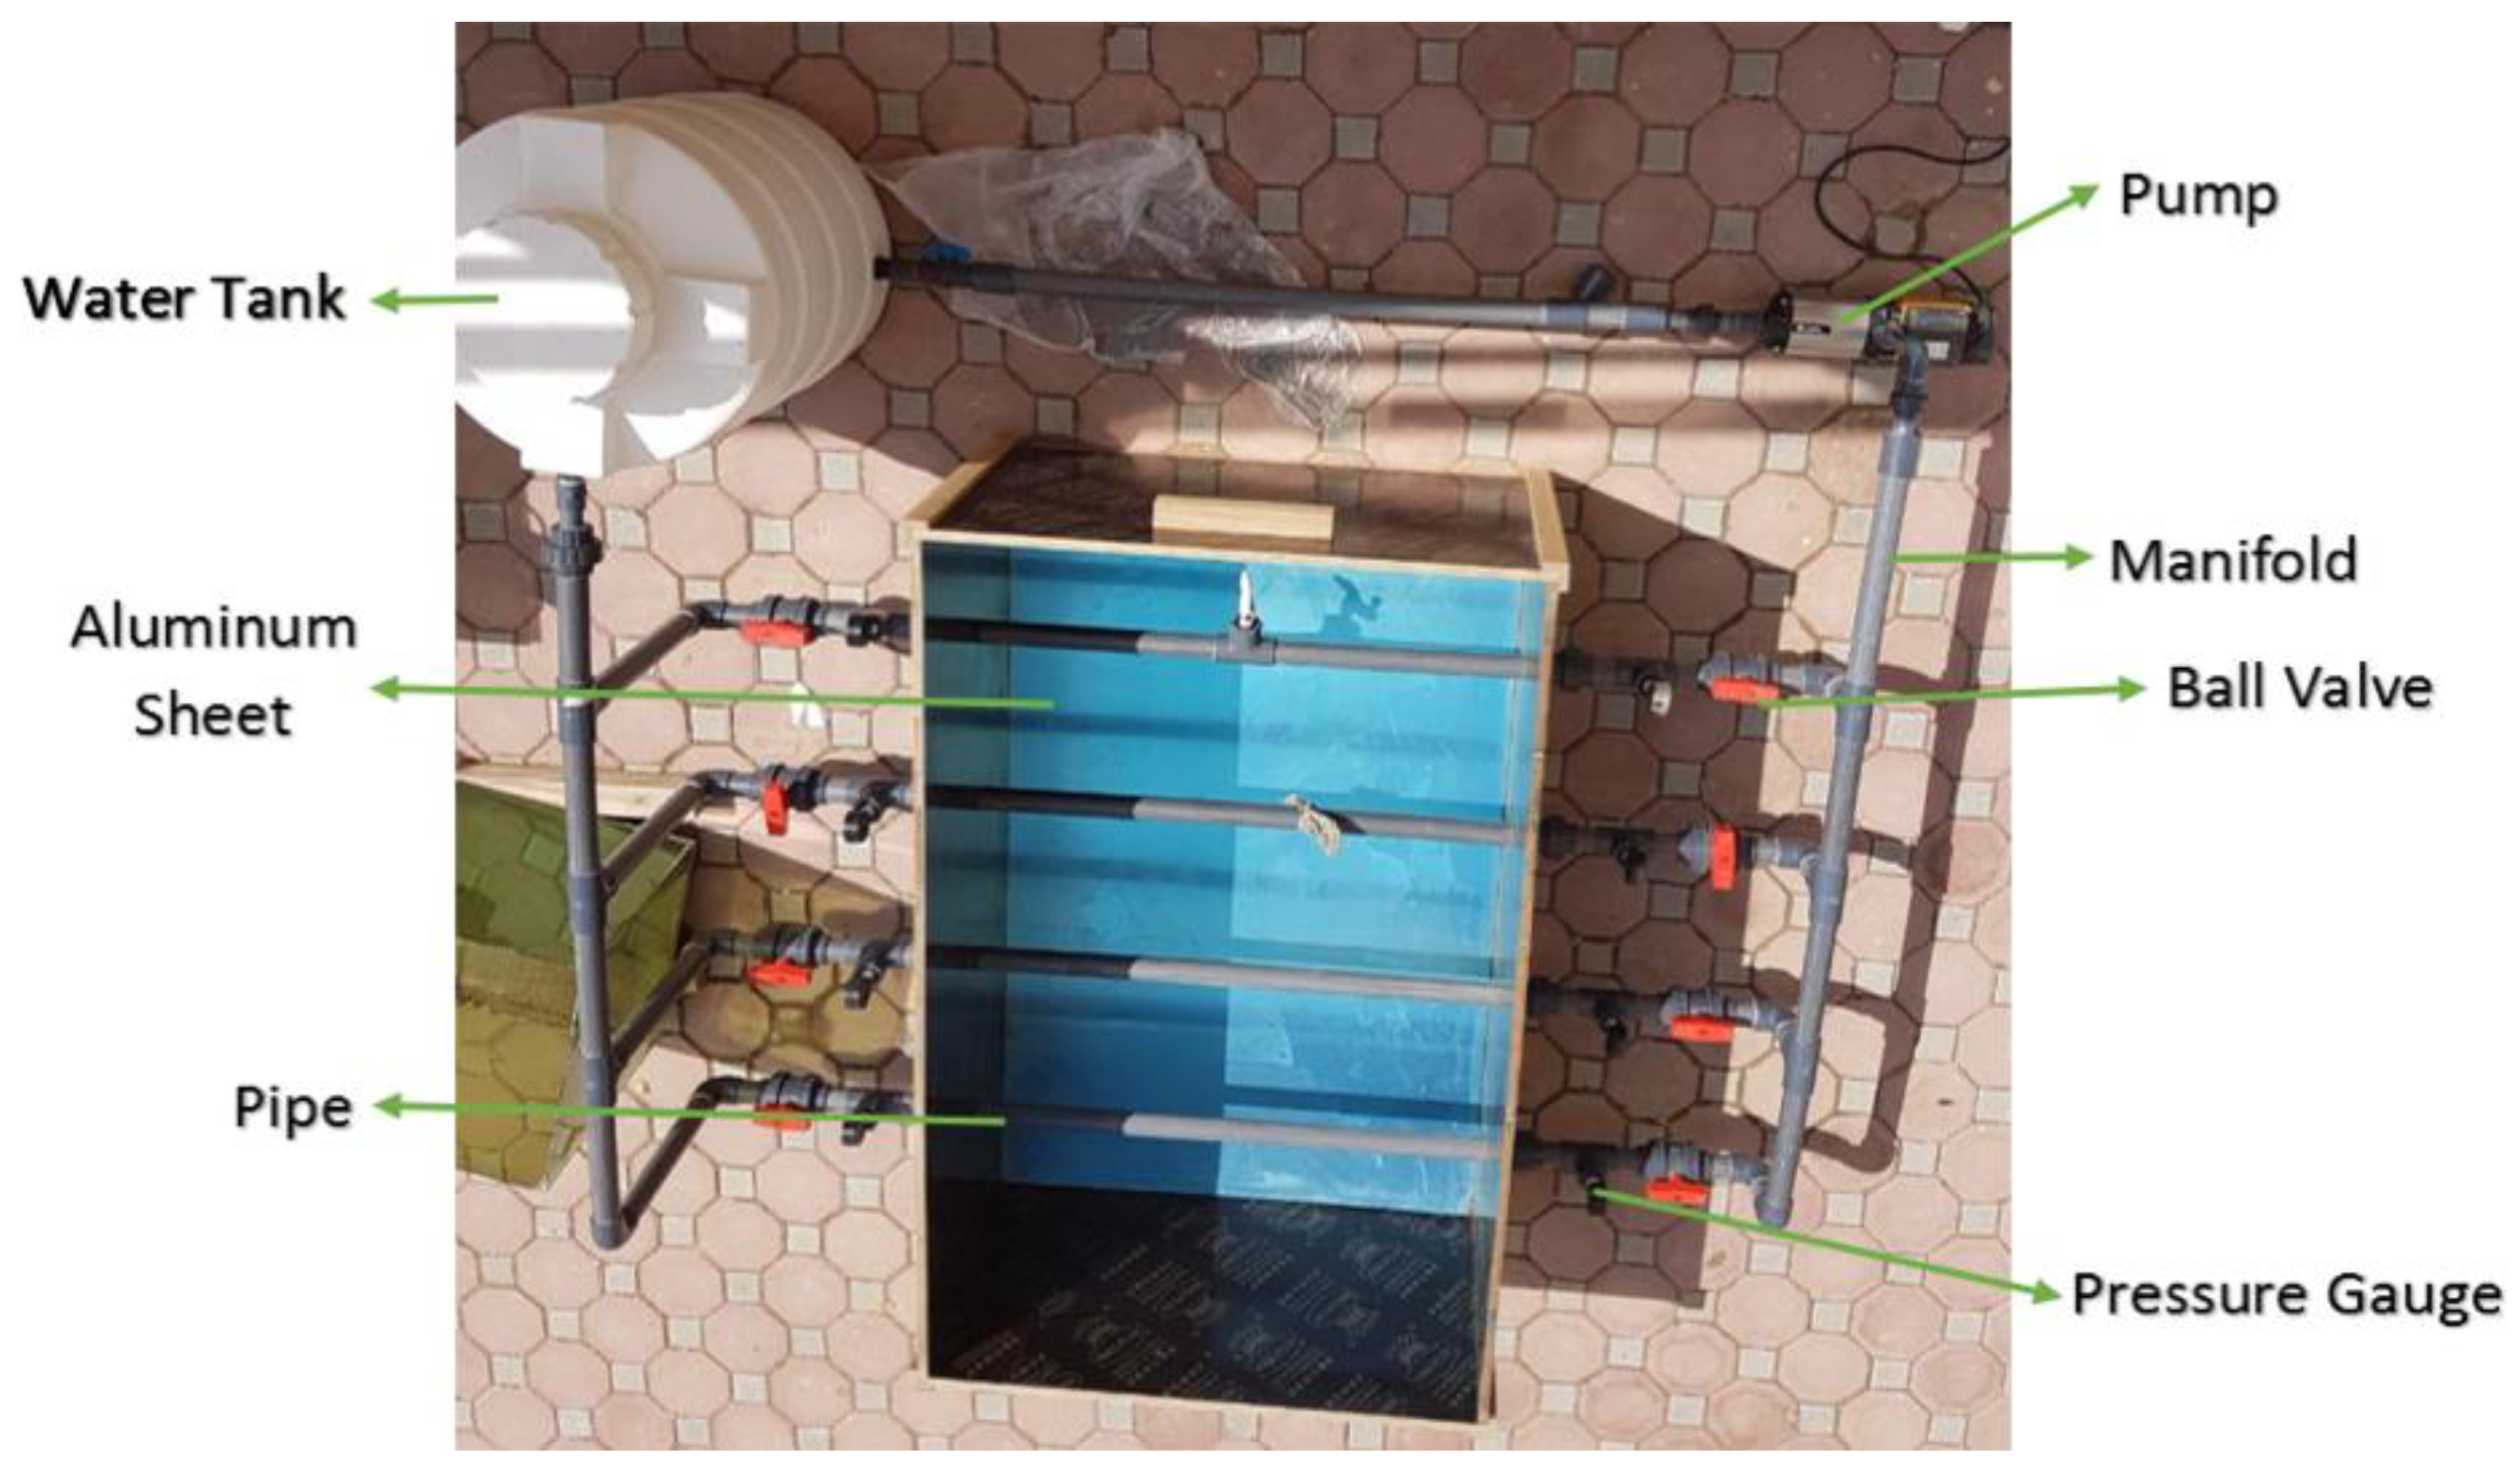
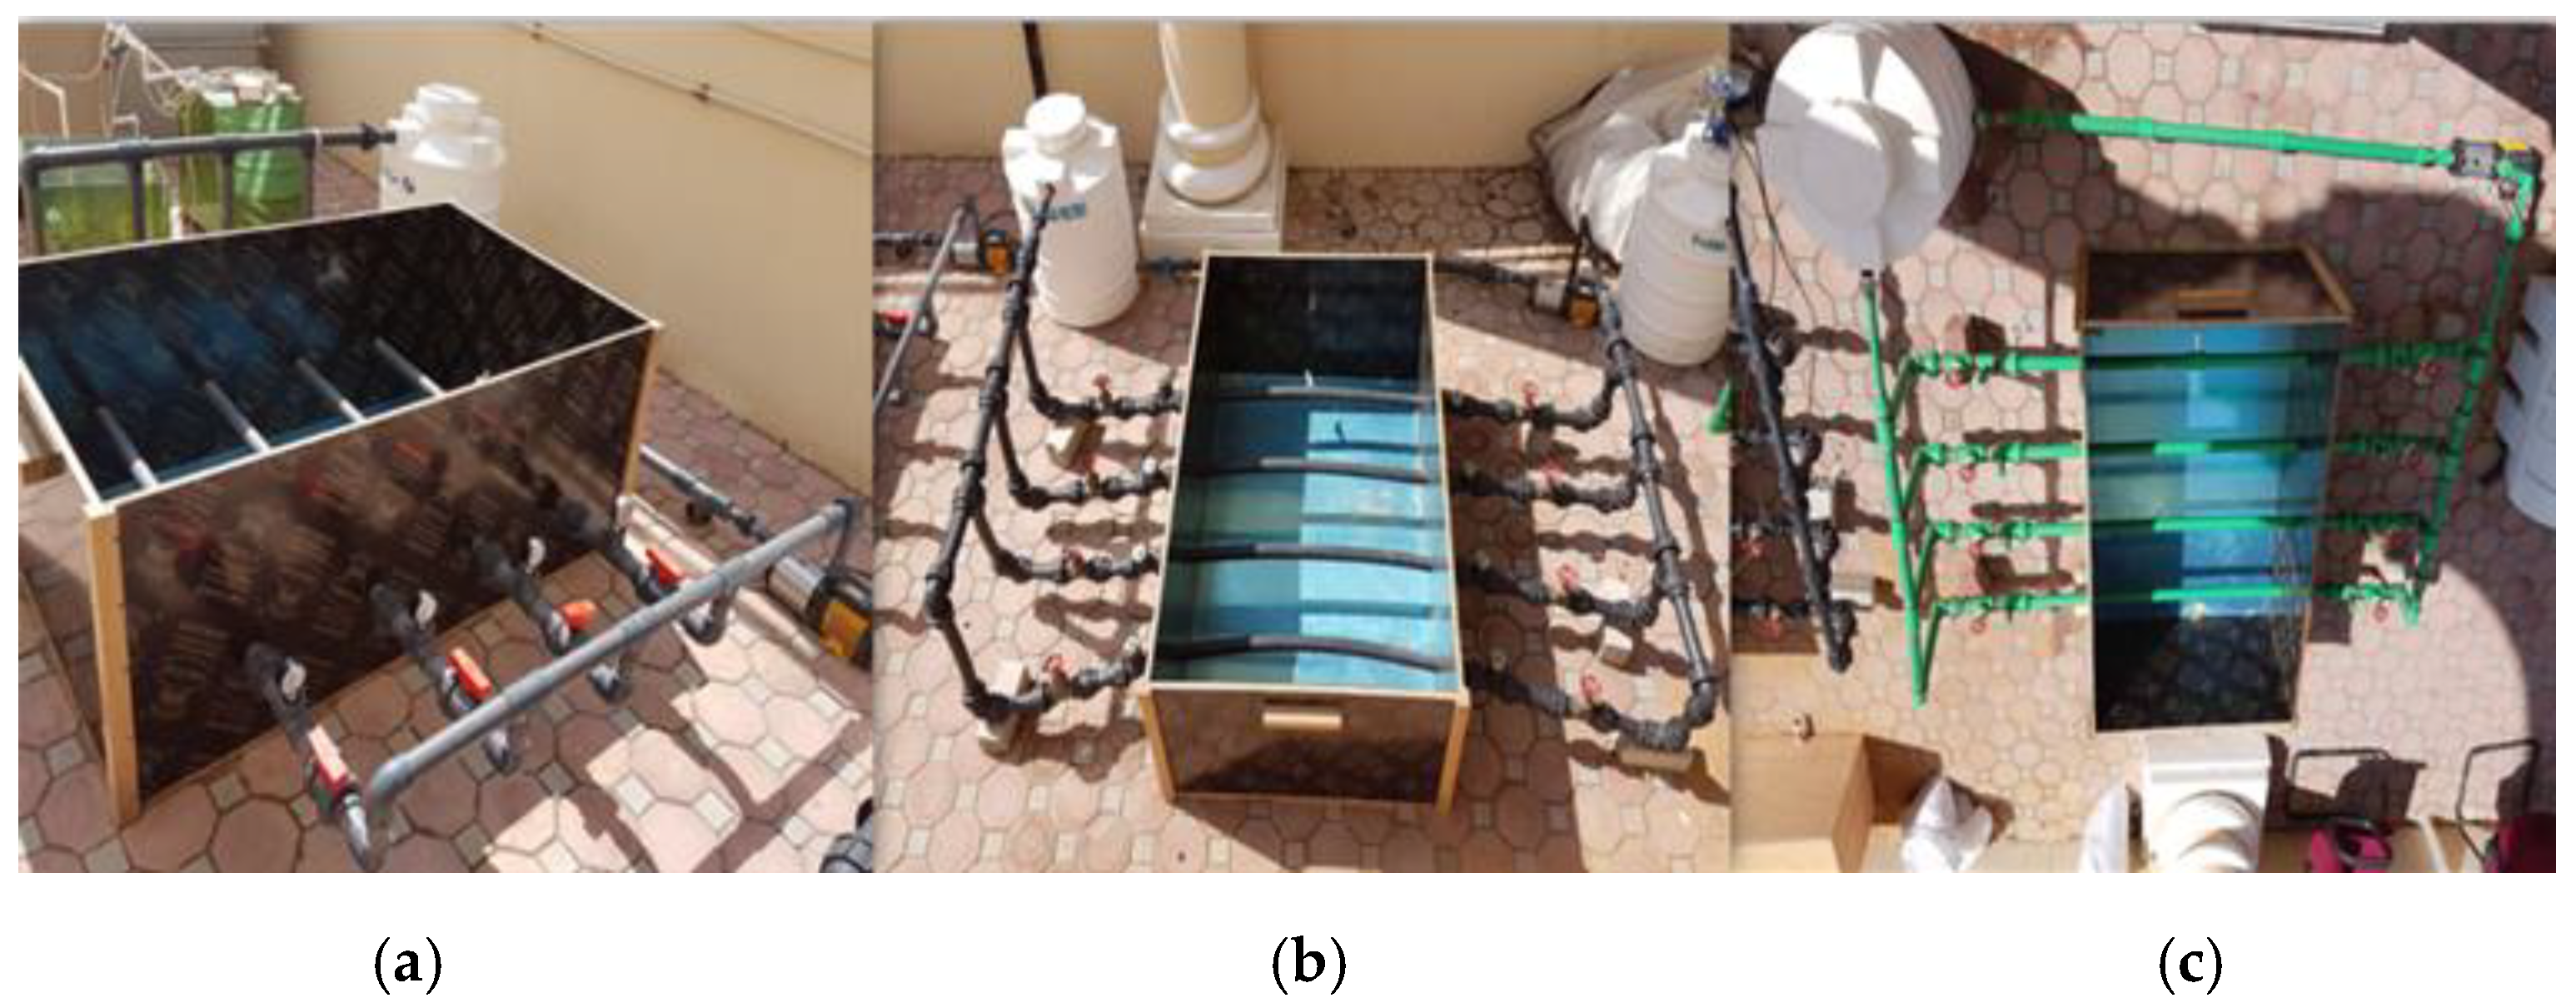
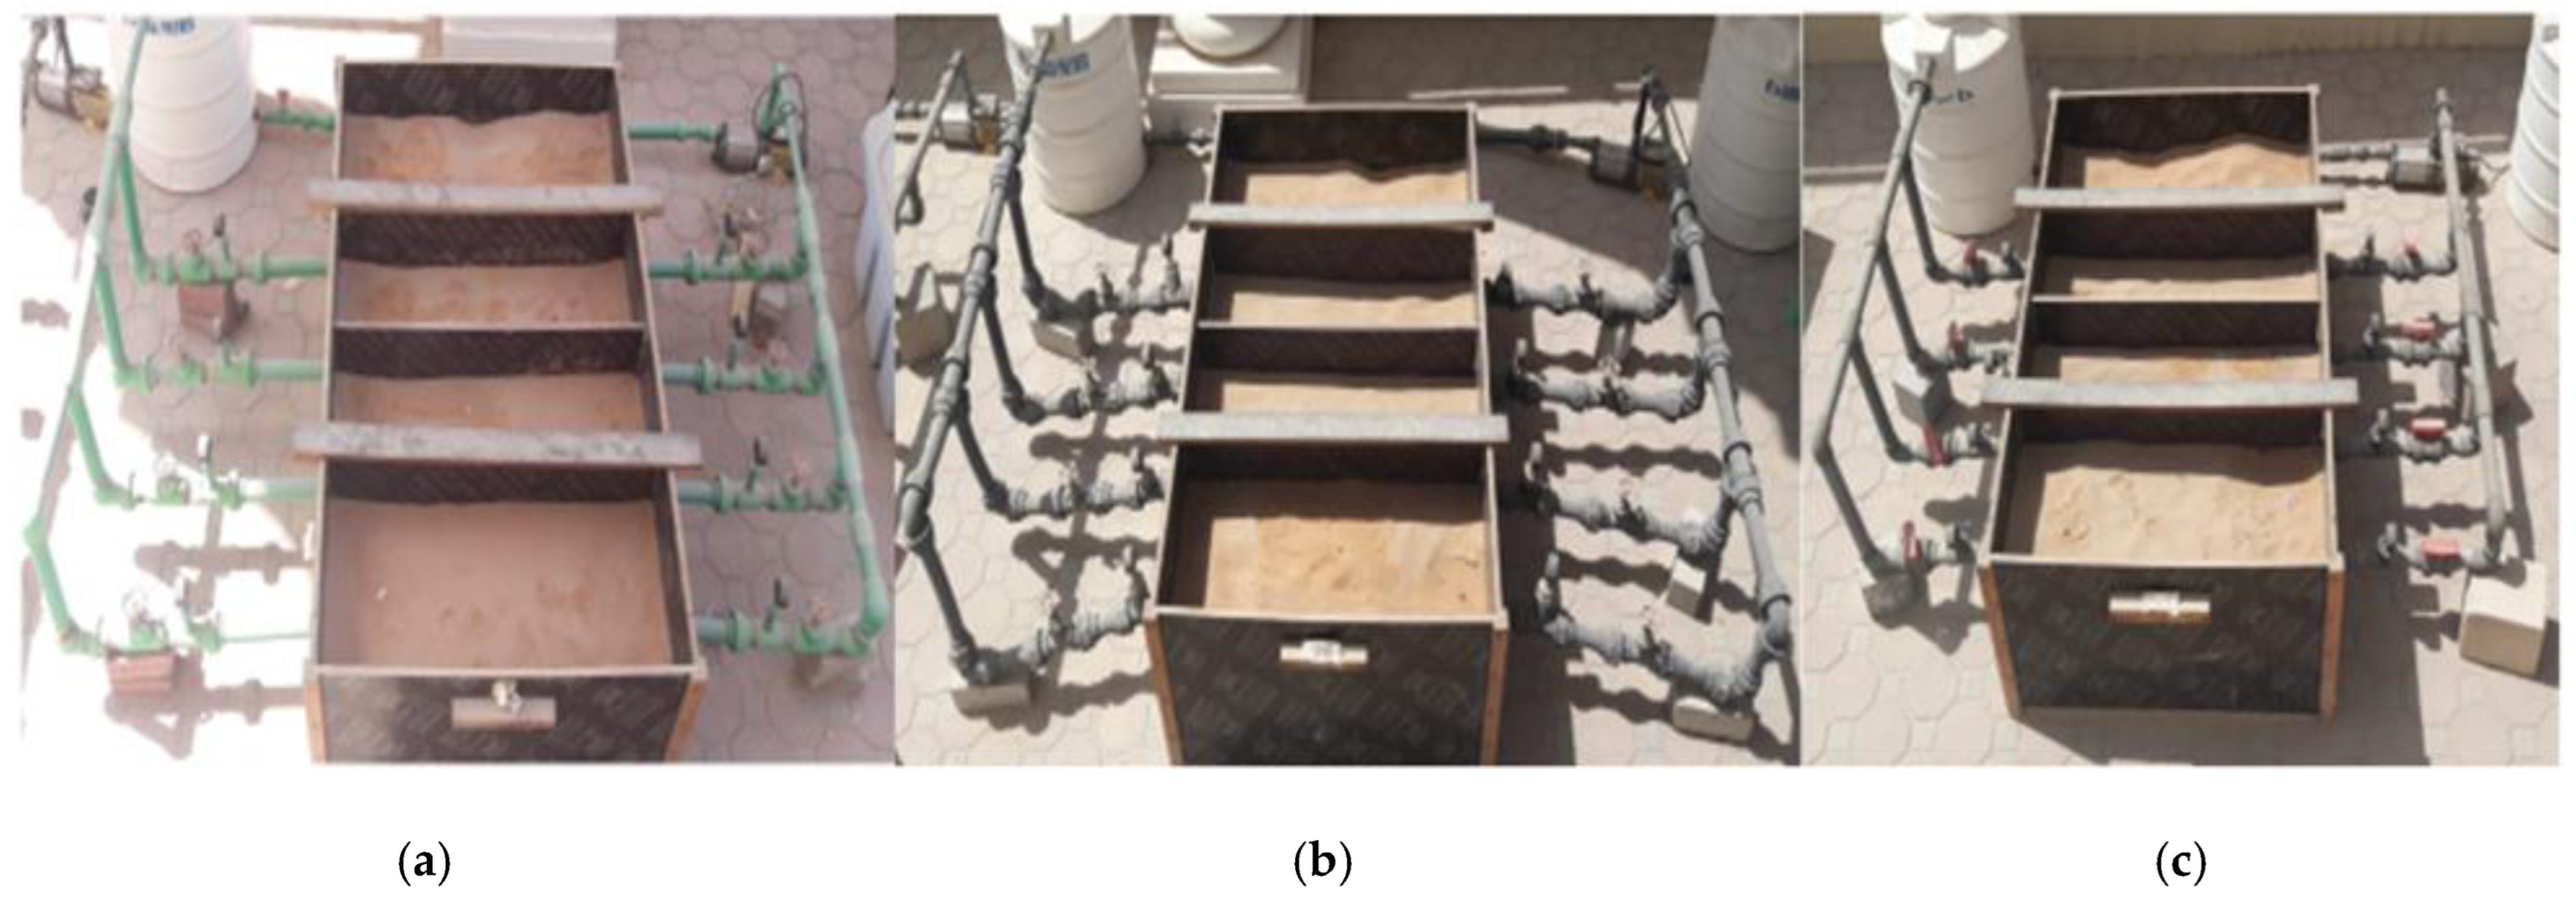
2.1. Experimental Setup
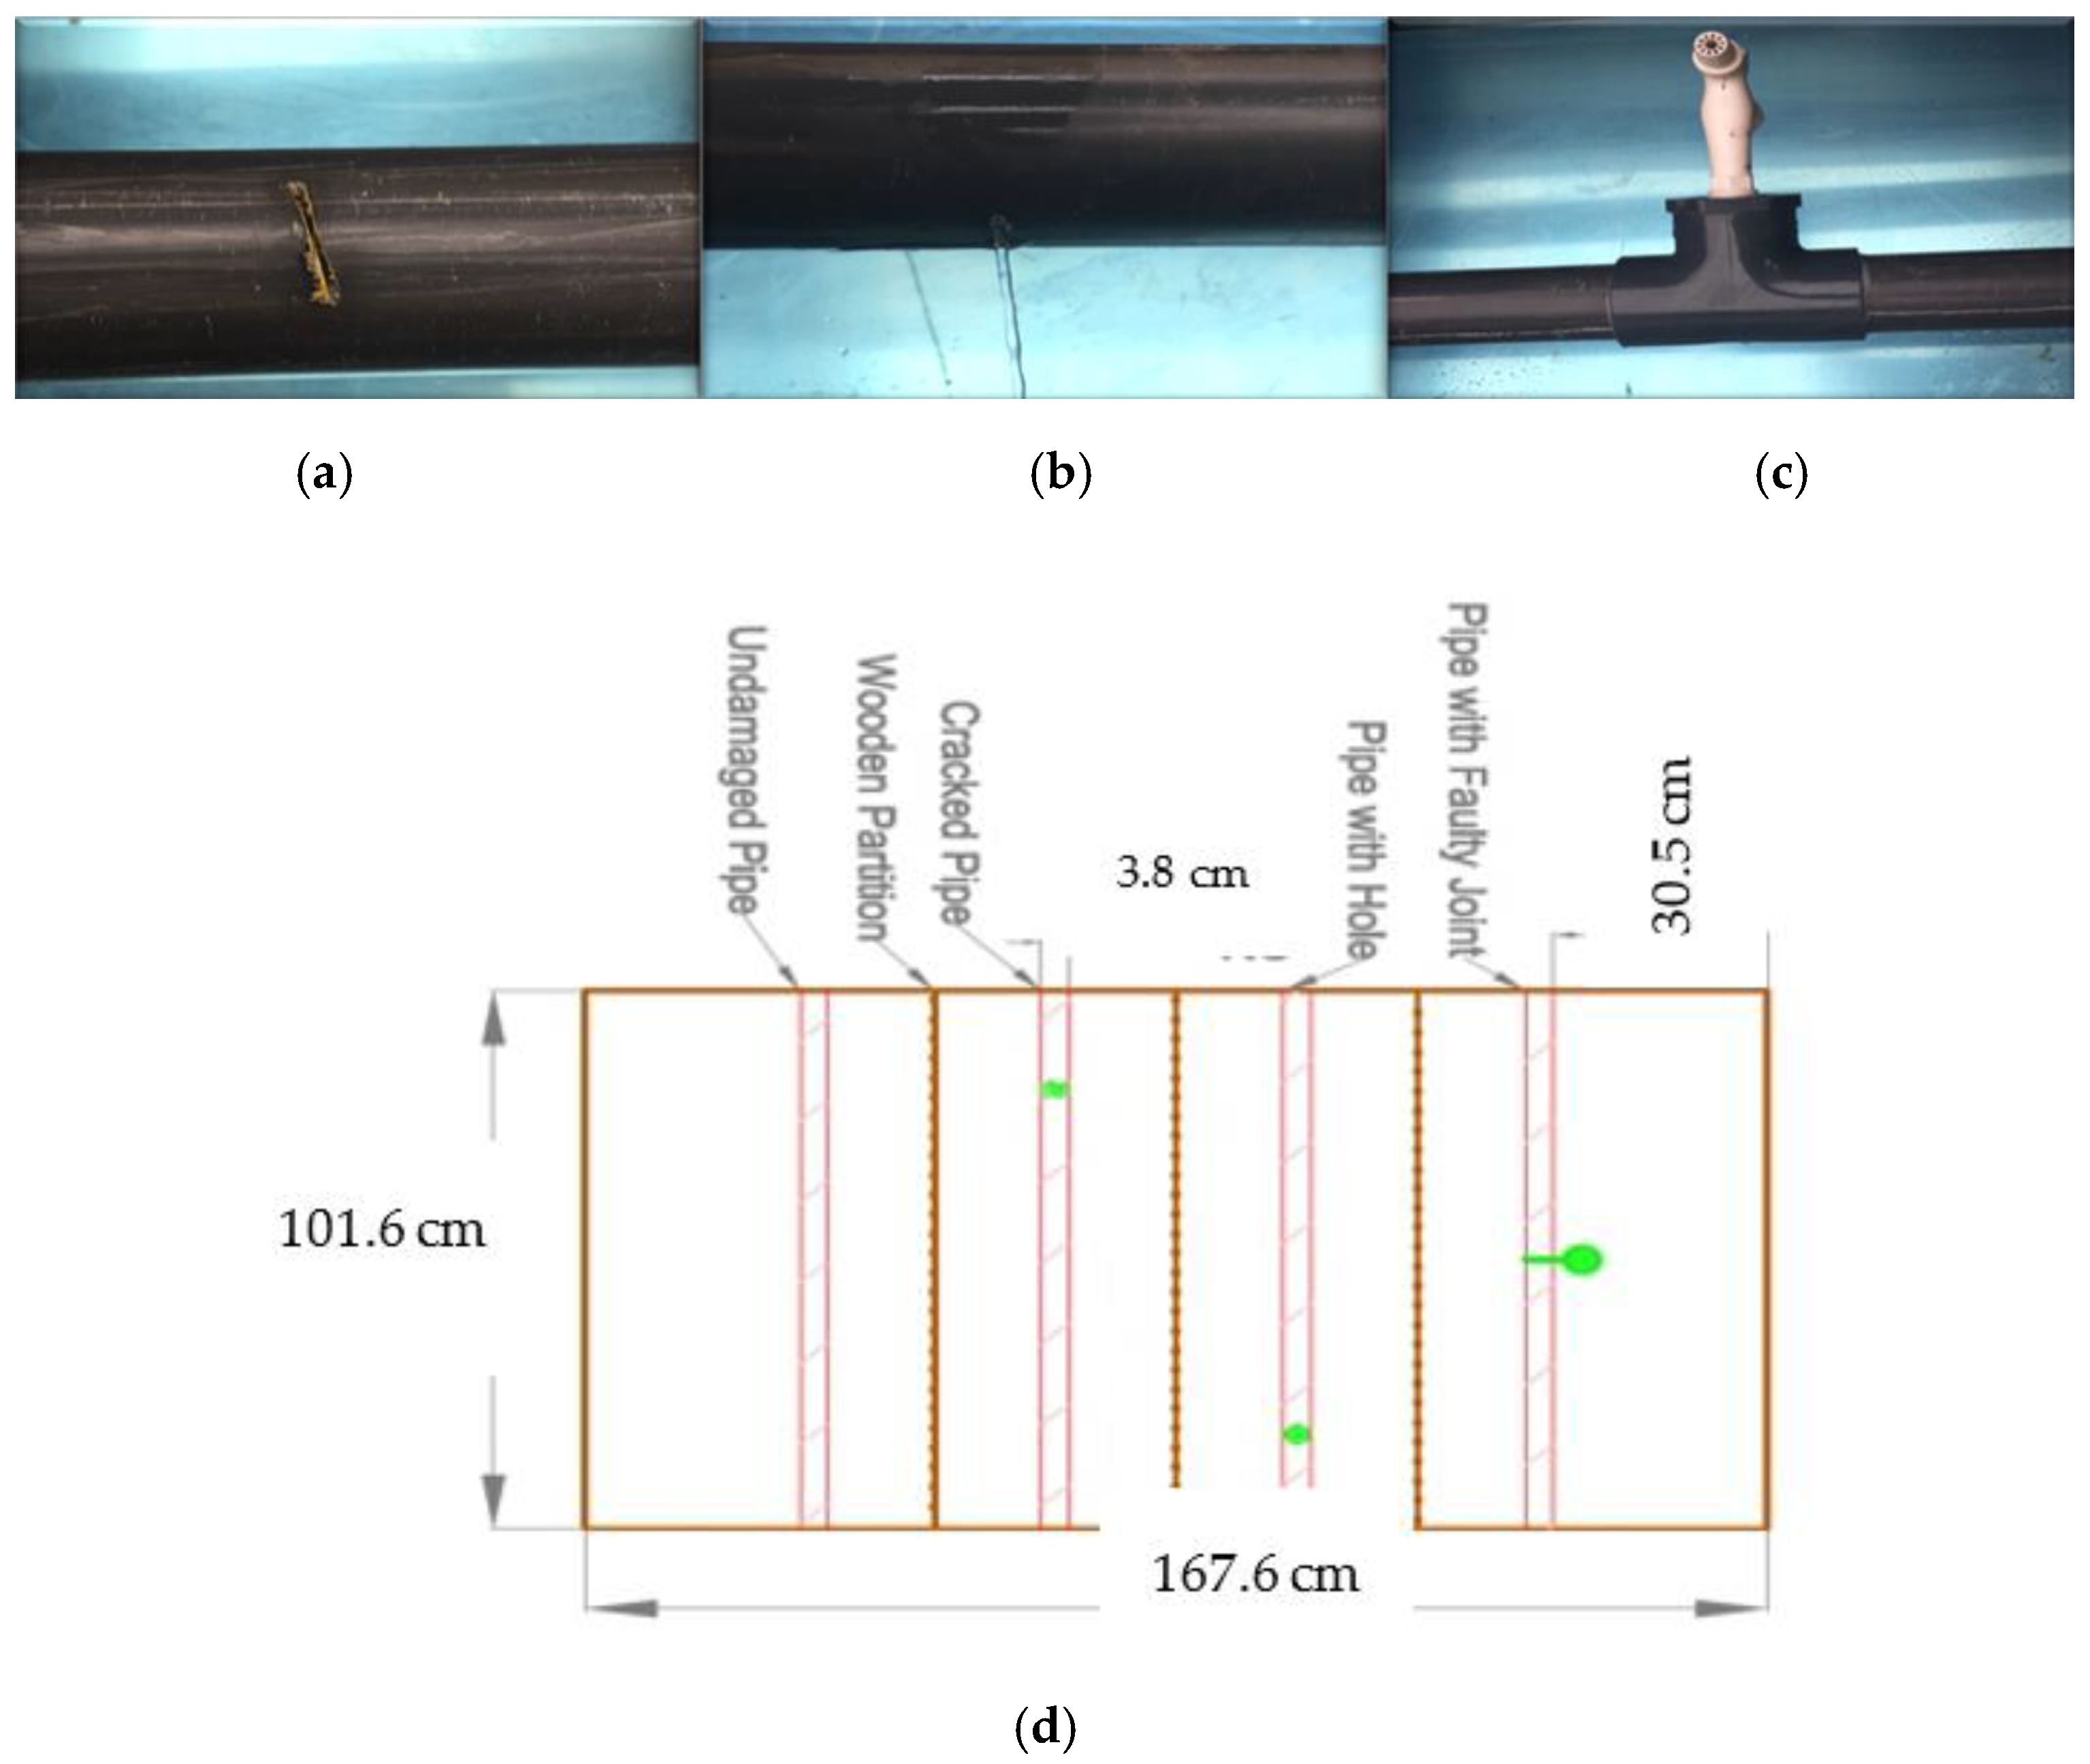
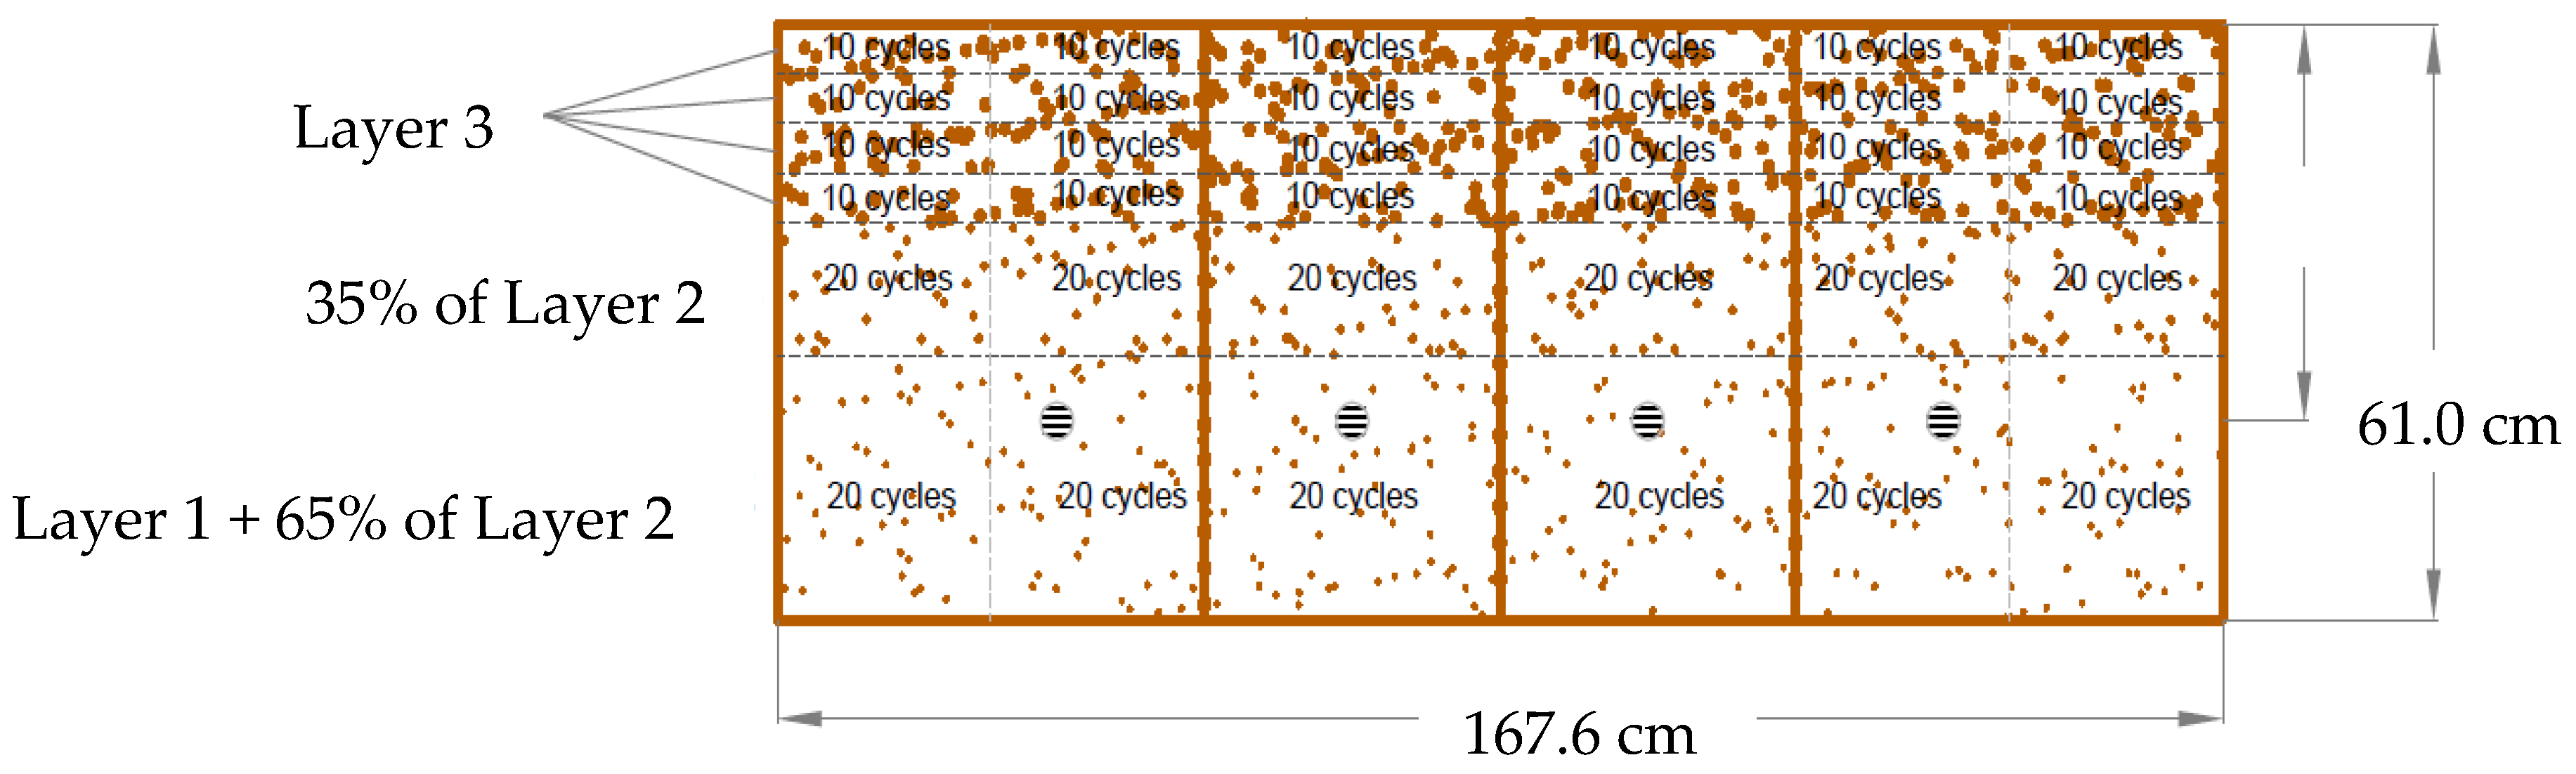
2.2. Dimensions of the Wooden Box
2.3. Pipes Used
2.4. Description of Equipment
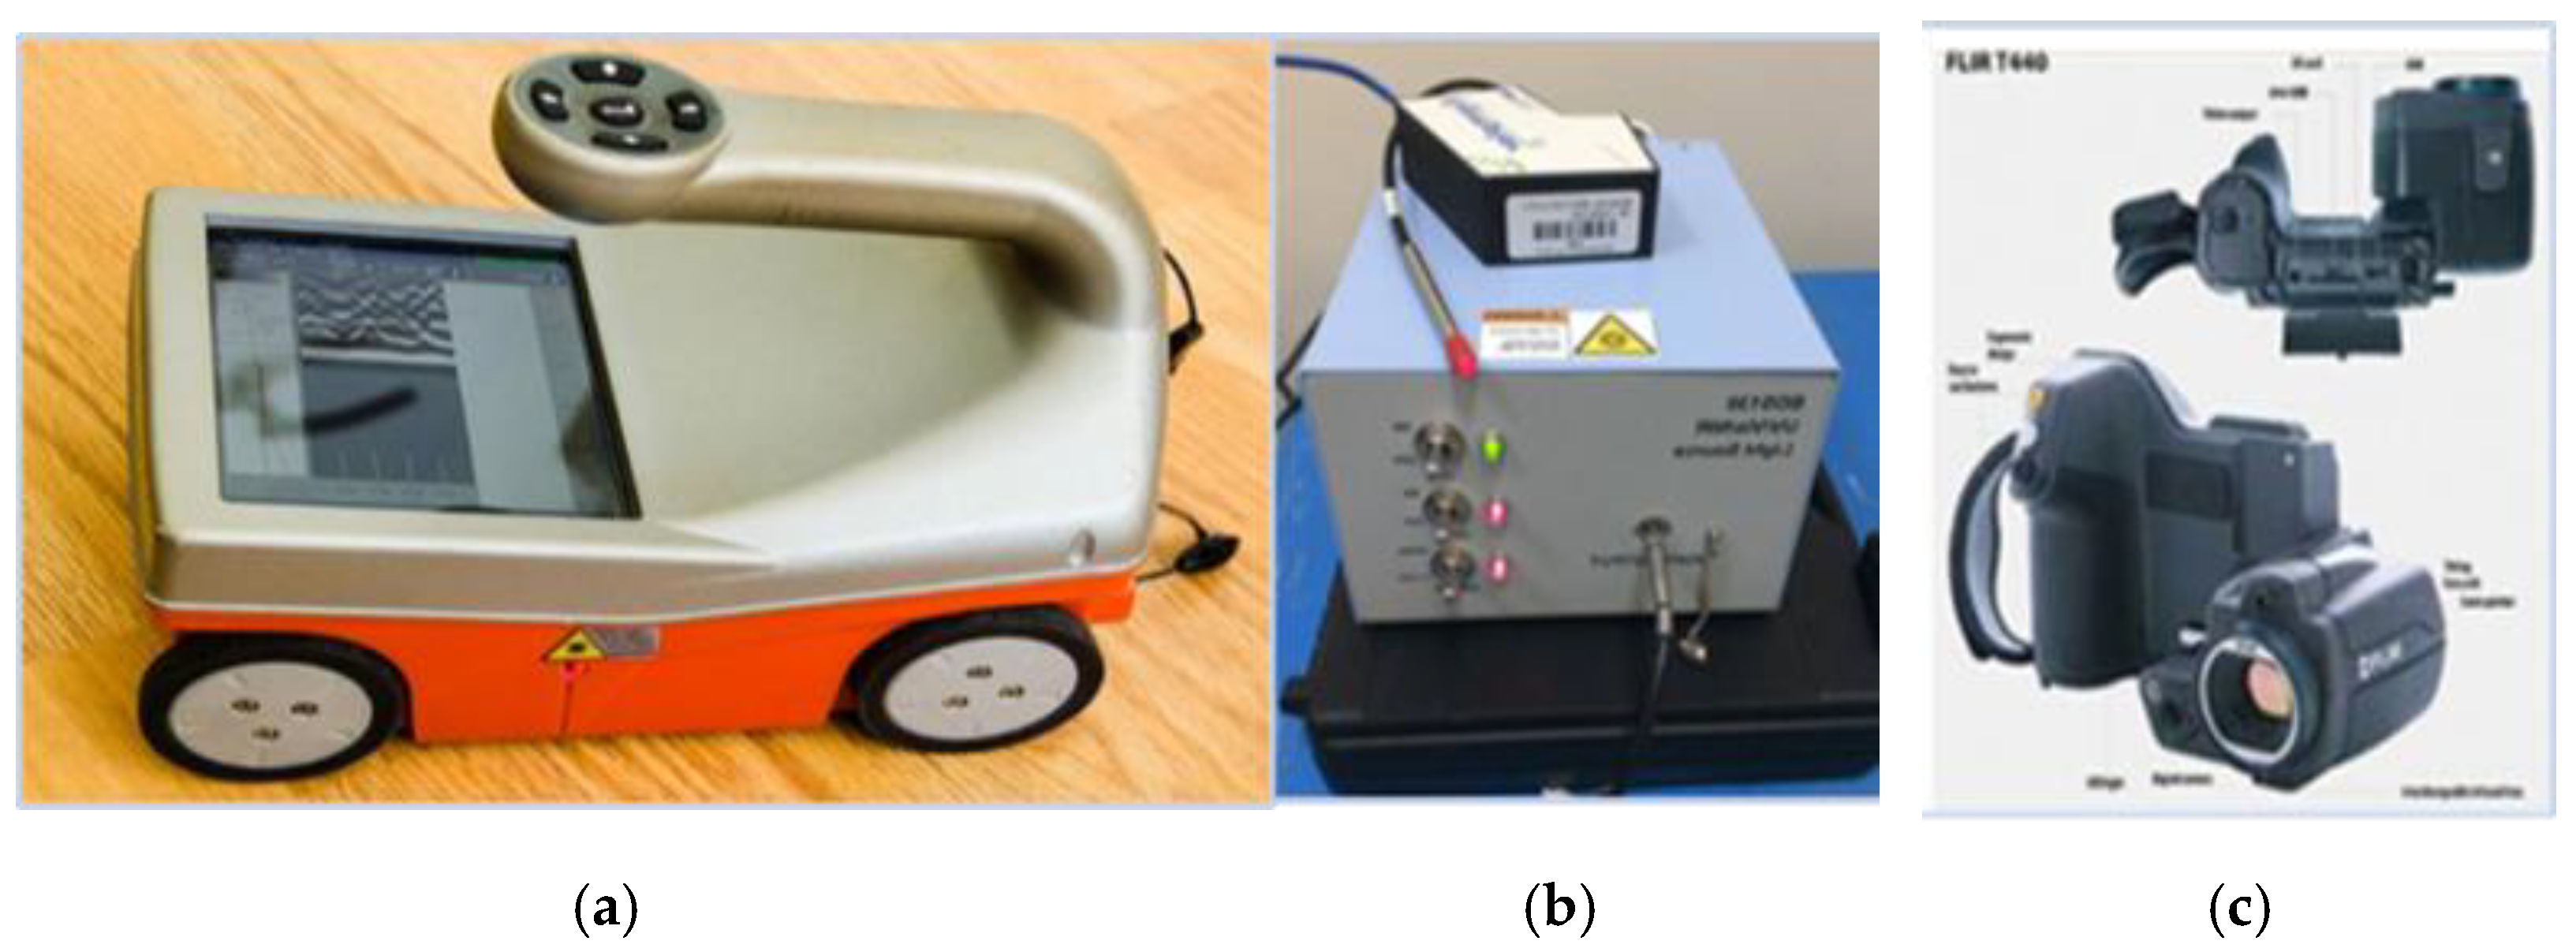
- GPR: Geophysical Survey Systems, Inc. (GSSI), Nashua, NH, USA, Structure Scan Mini GPR, as shown in Figure 7a, with an antenna frequency of 1.6 GHz and penetration depth of about 50 cm. RADAN software was used to process and analyze the scans obtained from the GPR;
- Spectrometer: in this study, the Exemplar LS Spectrometer, as illustrated in Figure 7b, which has a wavelength range of 0.2–0.85 µm, was used. The Exemplar LS Spectrometer displays real-time data and requires the use of specific software for data analysis (BWSpec software); and
- IR Camera: the camera used in this study was the FLIR T420 depicted in Figure 7c, which has a wavelength range of 7.5–14.0 µm. The device has a native resolution of 464 × 348. The minimum focus distance is 24° lens: 0.5 m. IFOV in the manufacturing facility is 42° lens. However, the focal length is not provided in these cameras because of the relationship between the horizontal FOV and focal length.
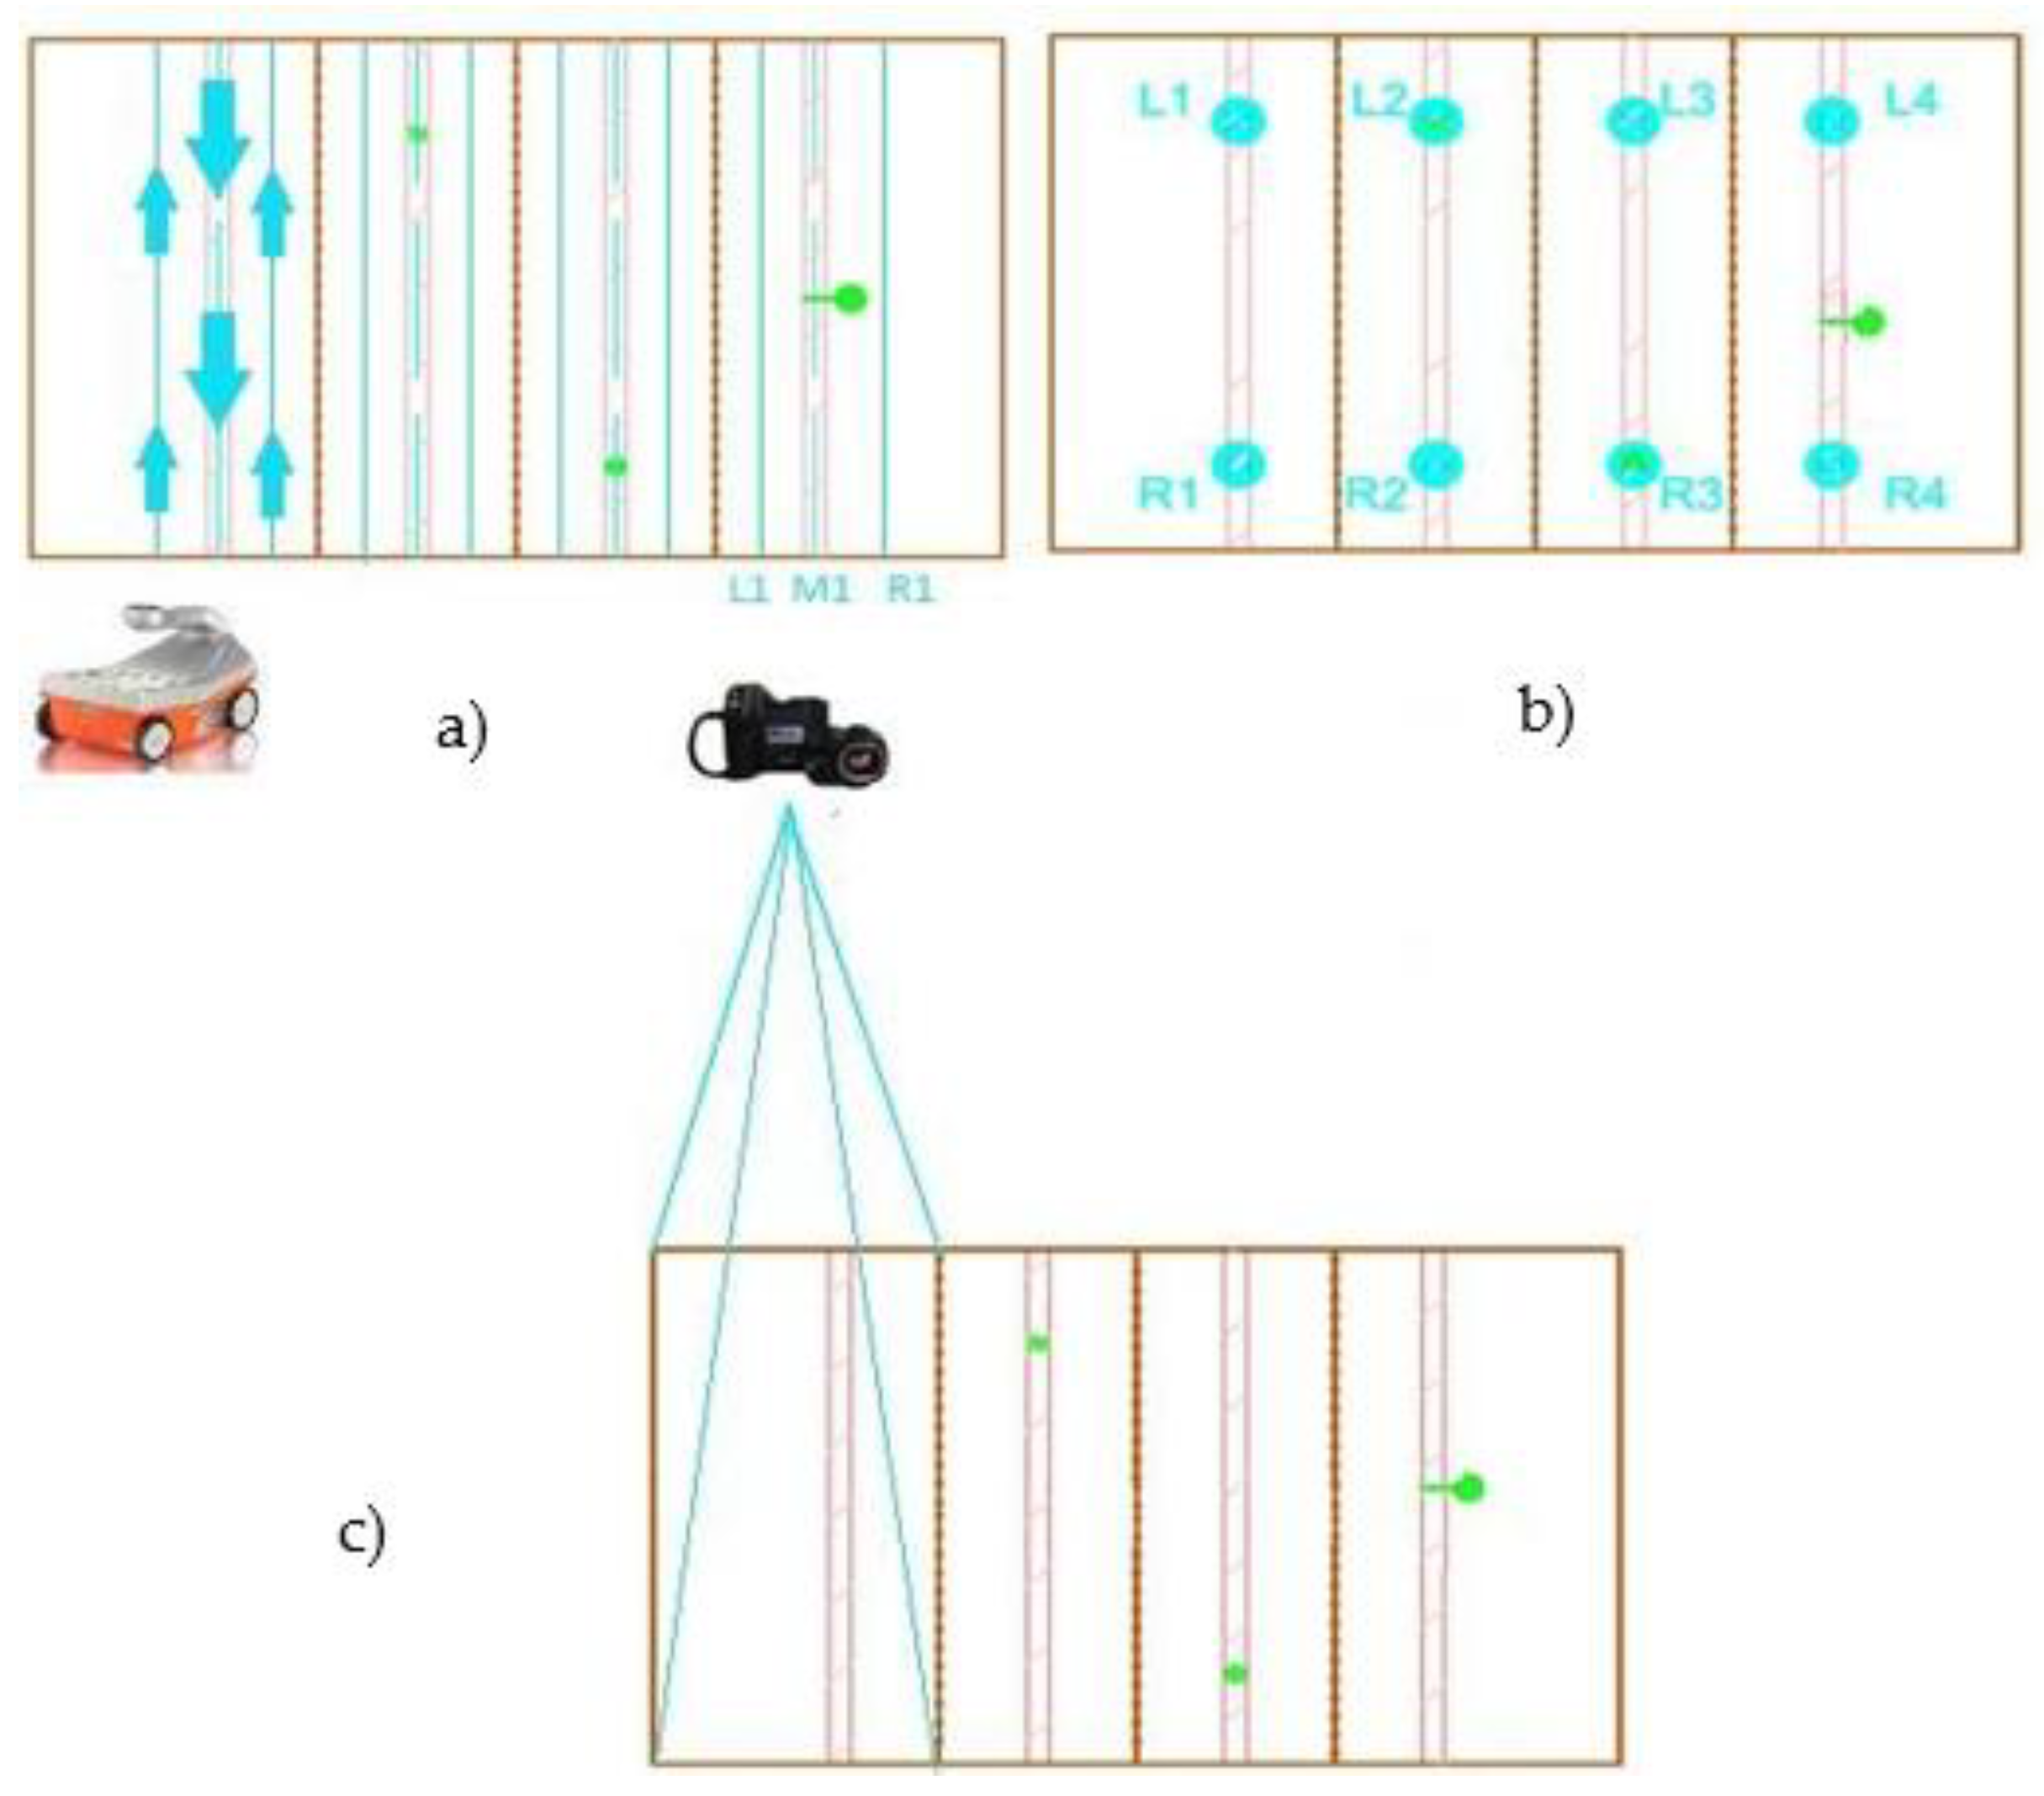
2.5. Procedure
3. Results and Discussion
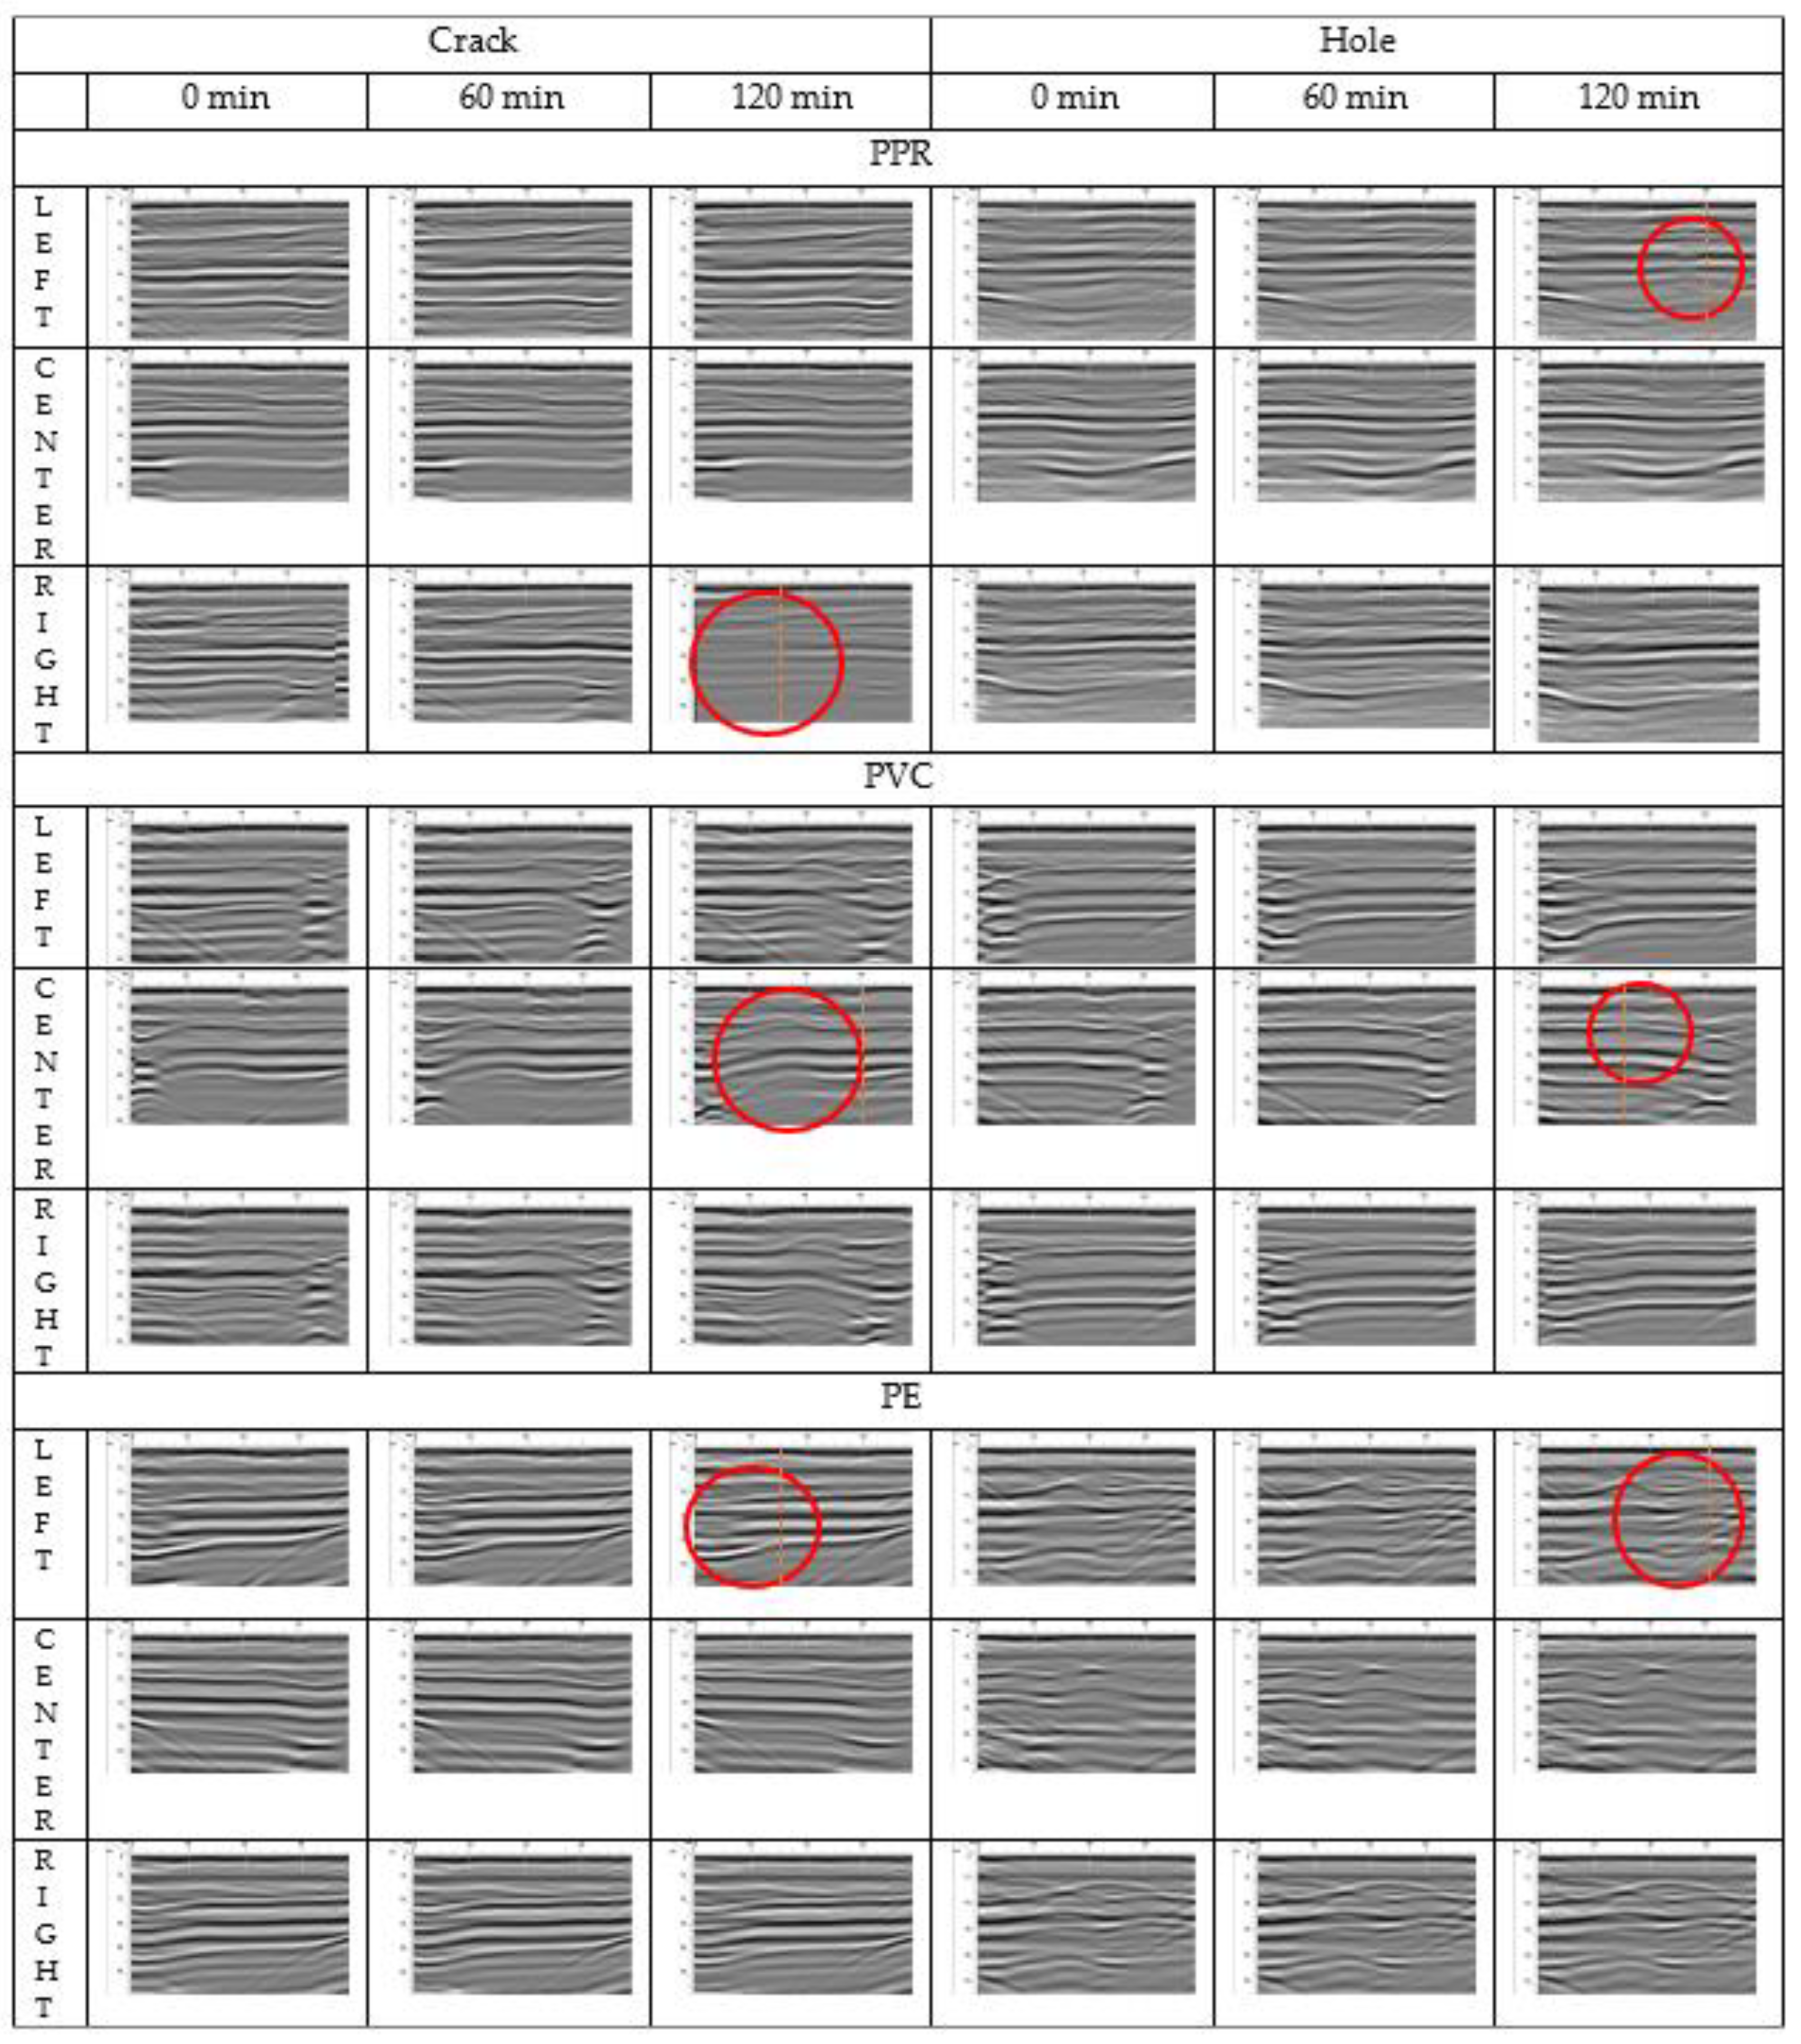
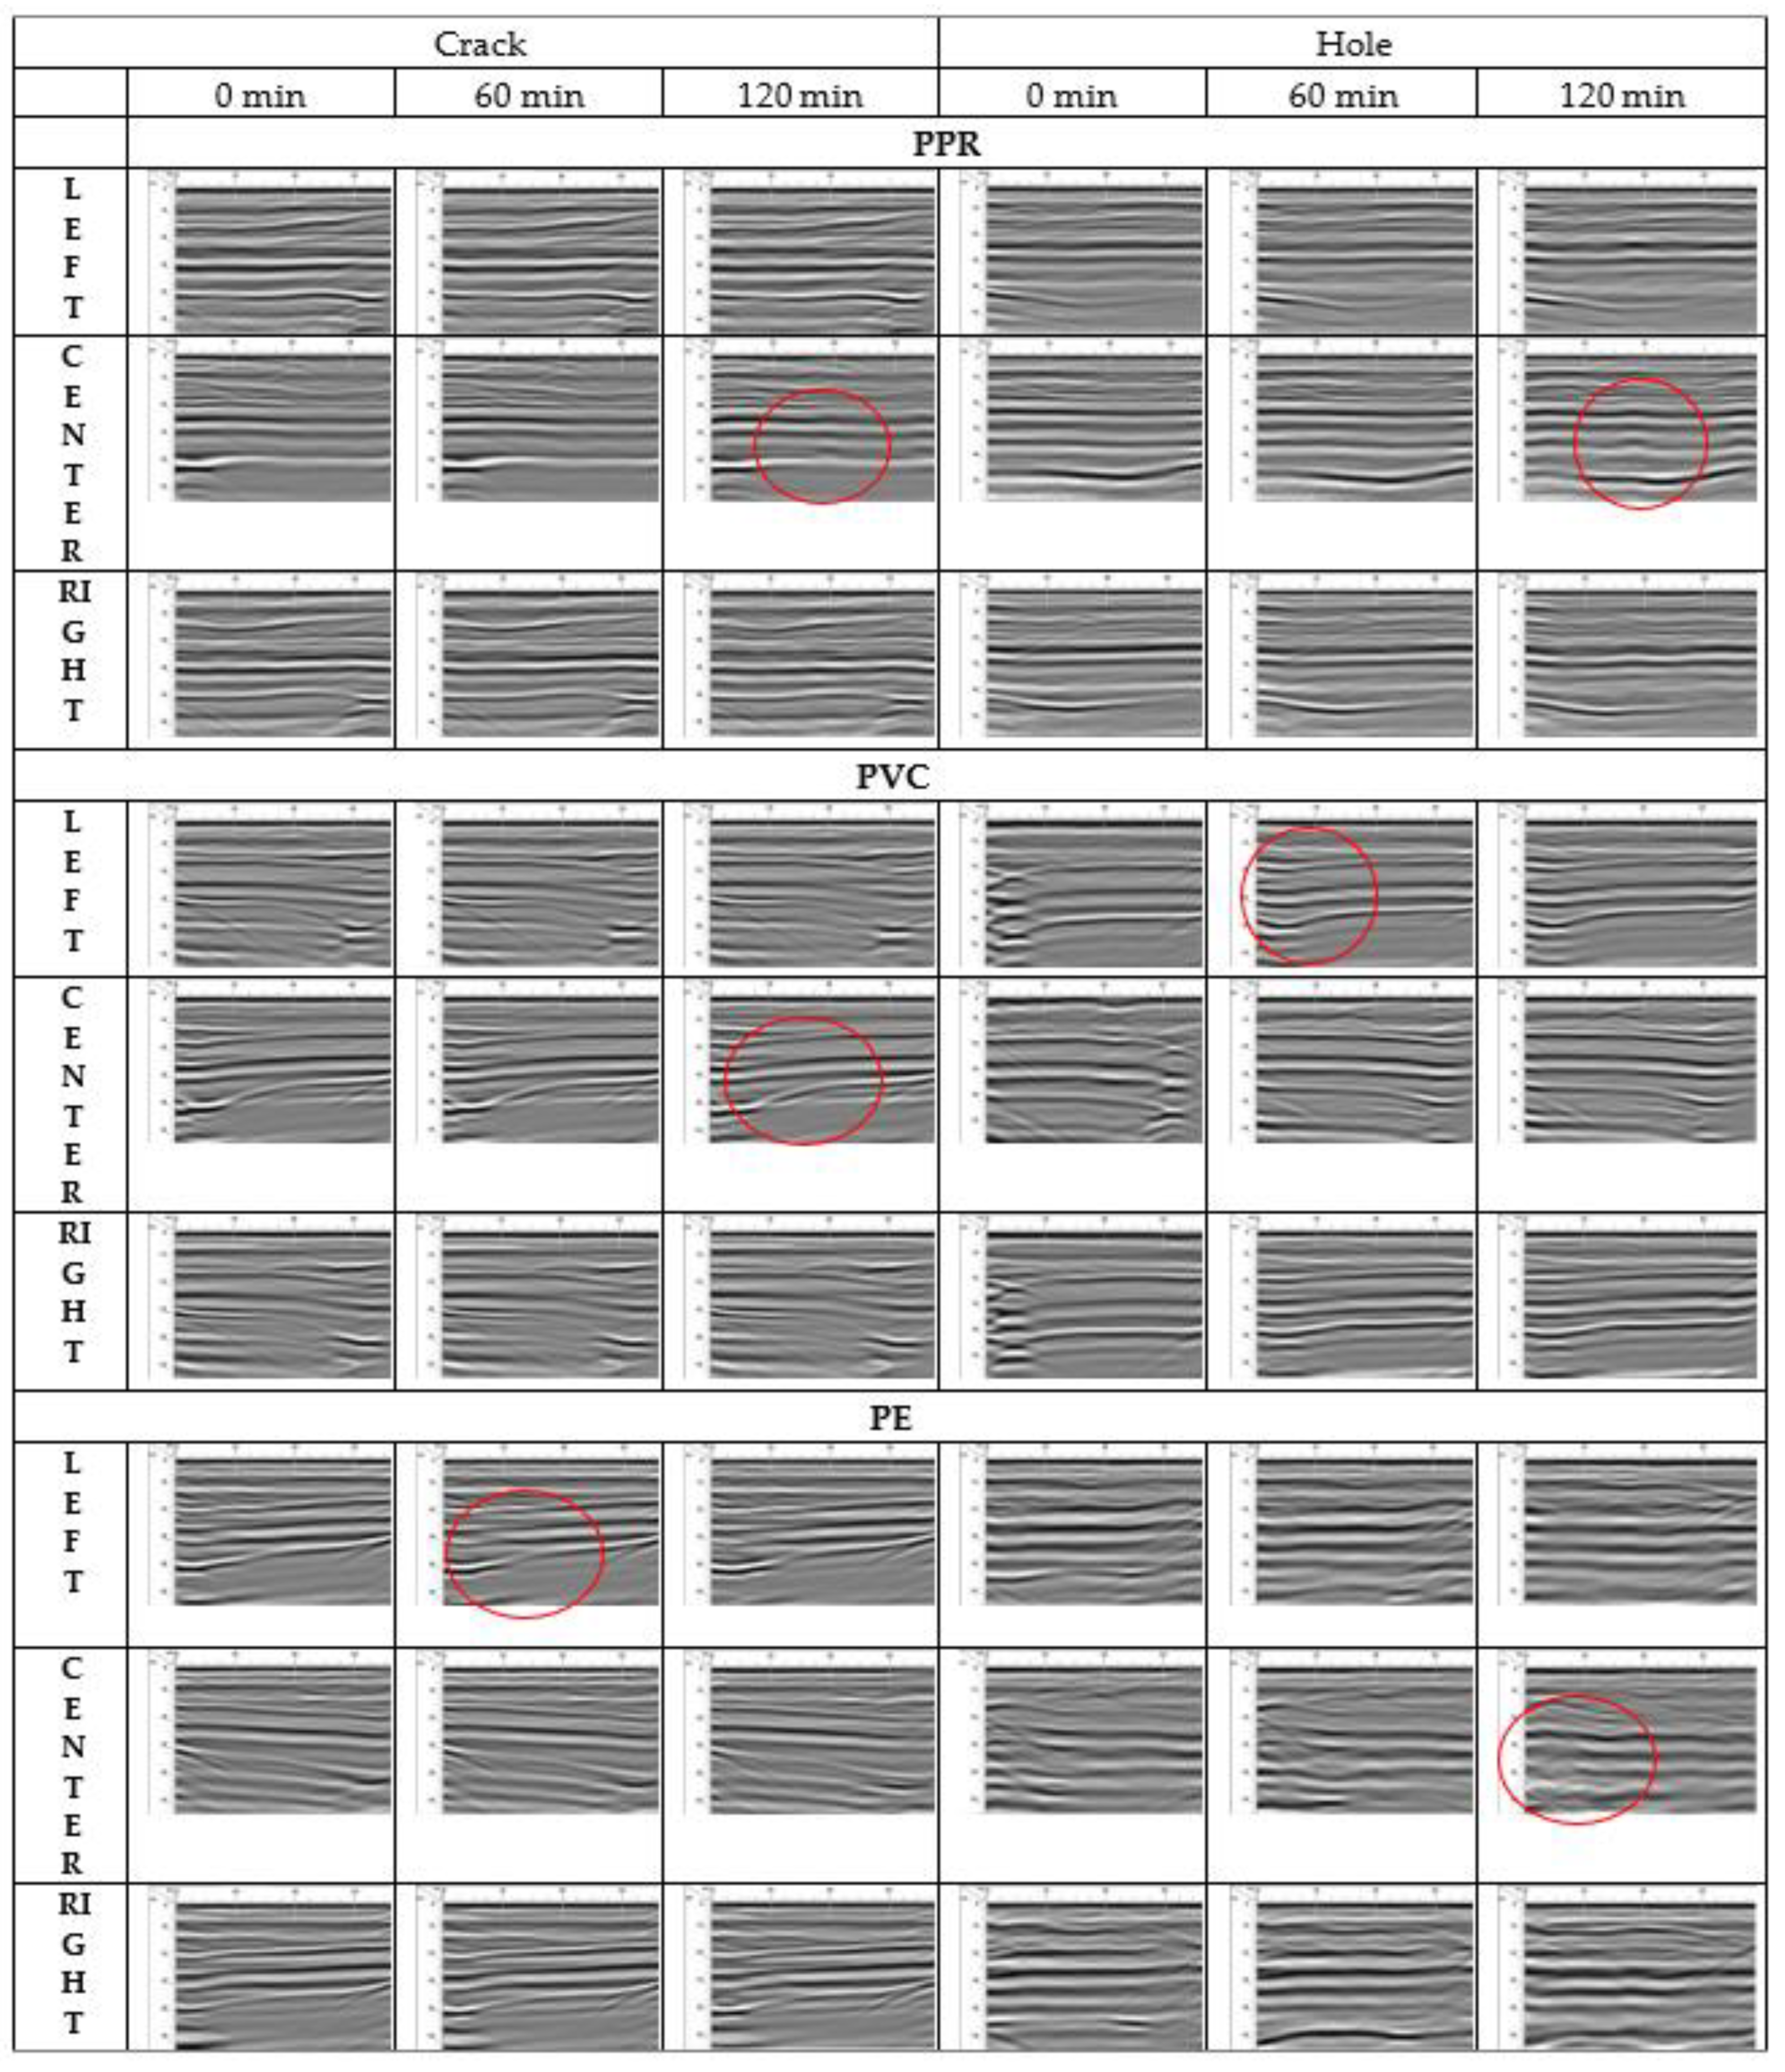
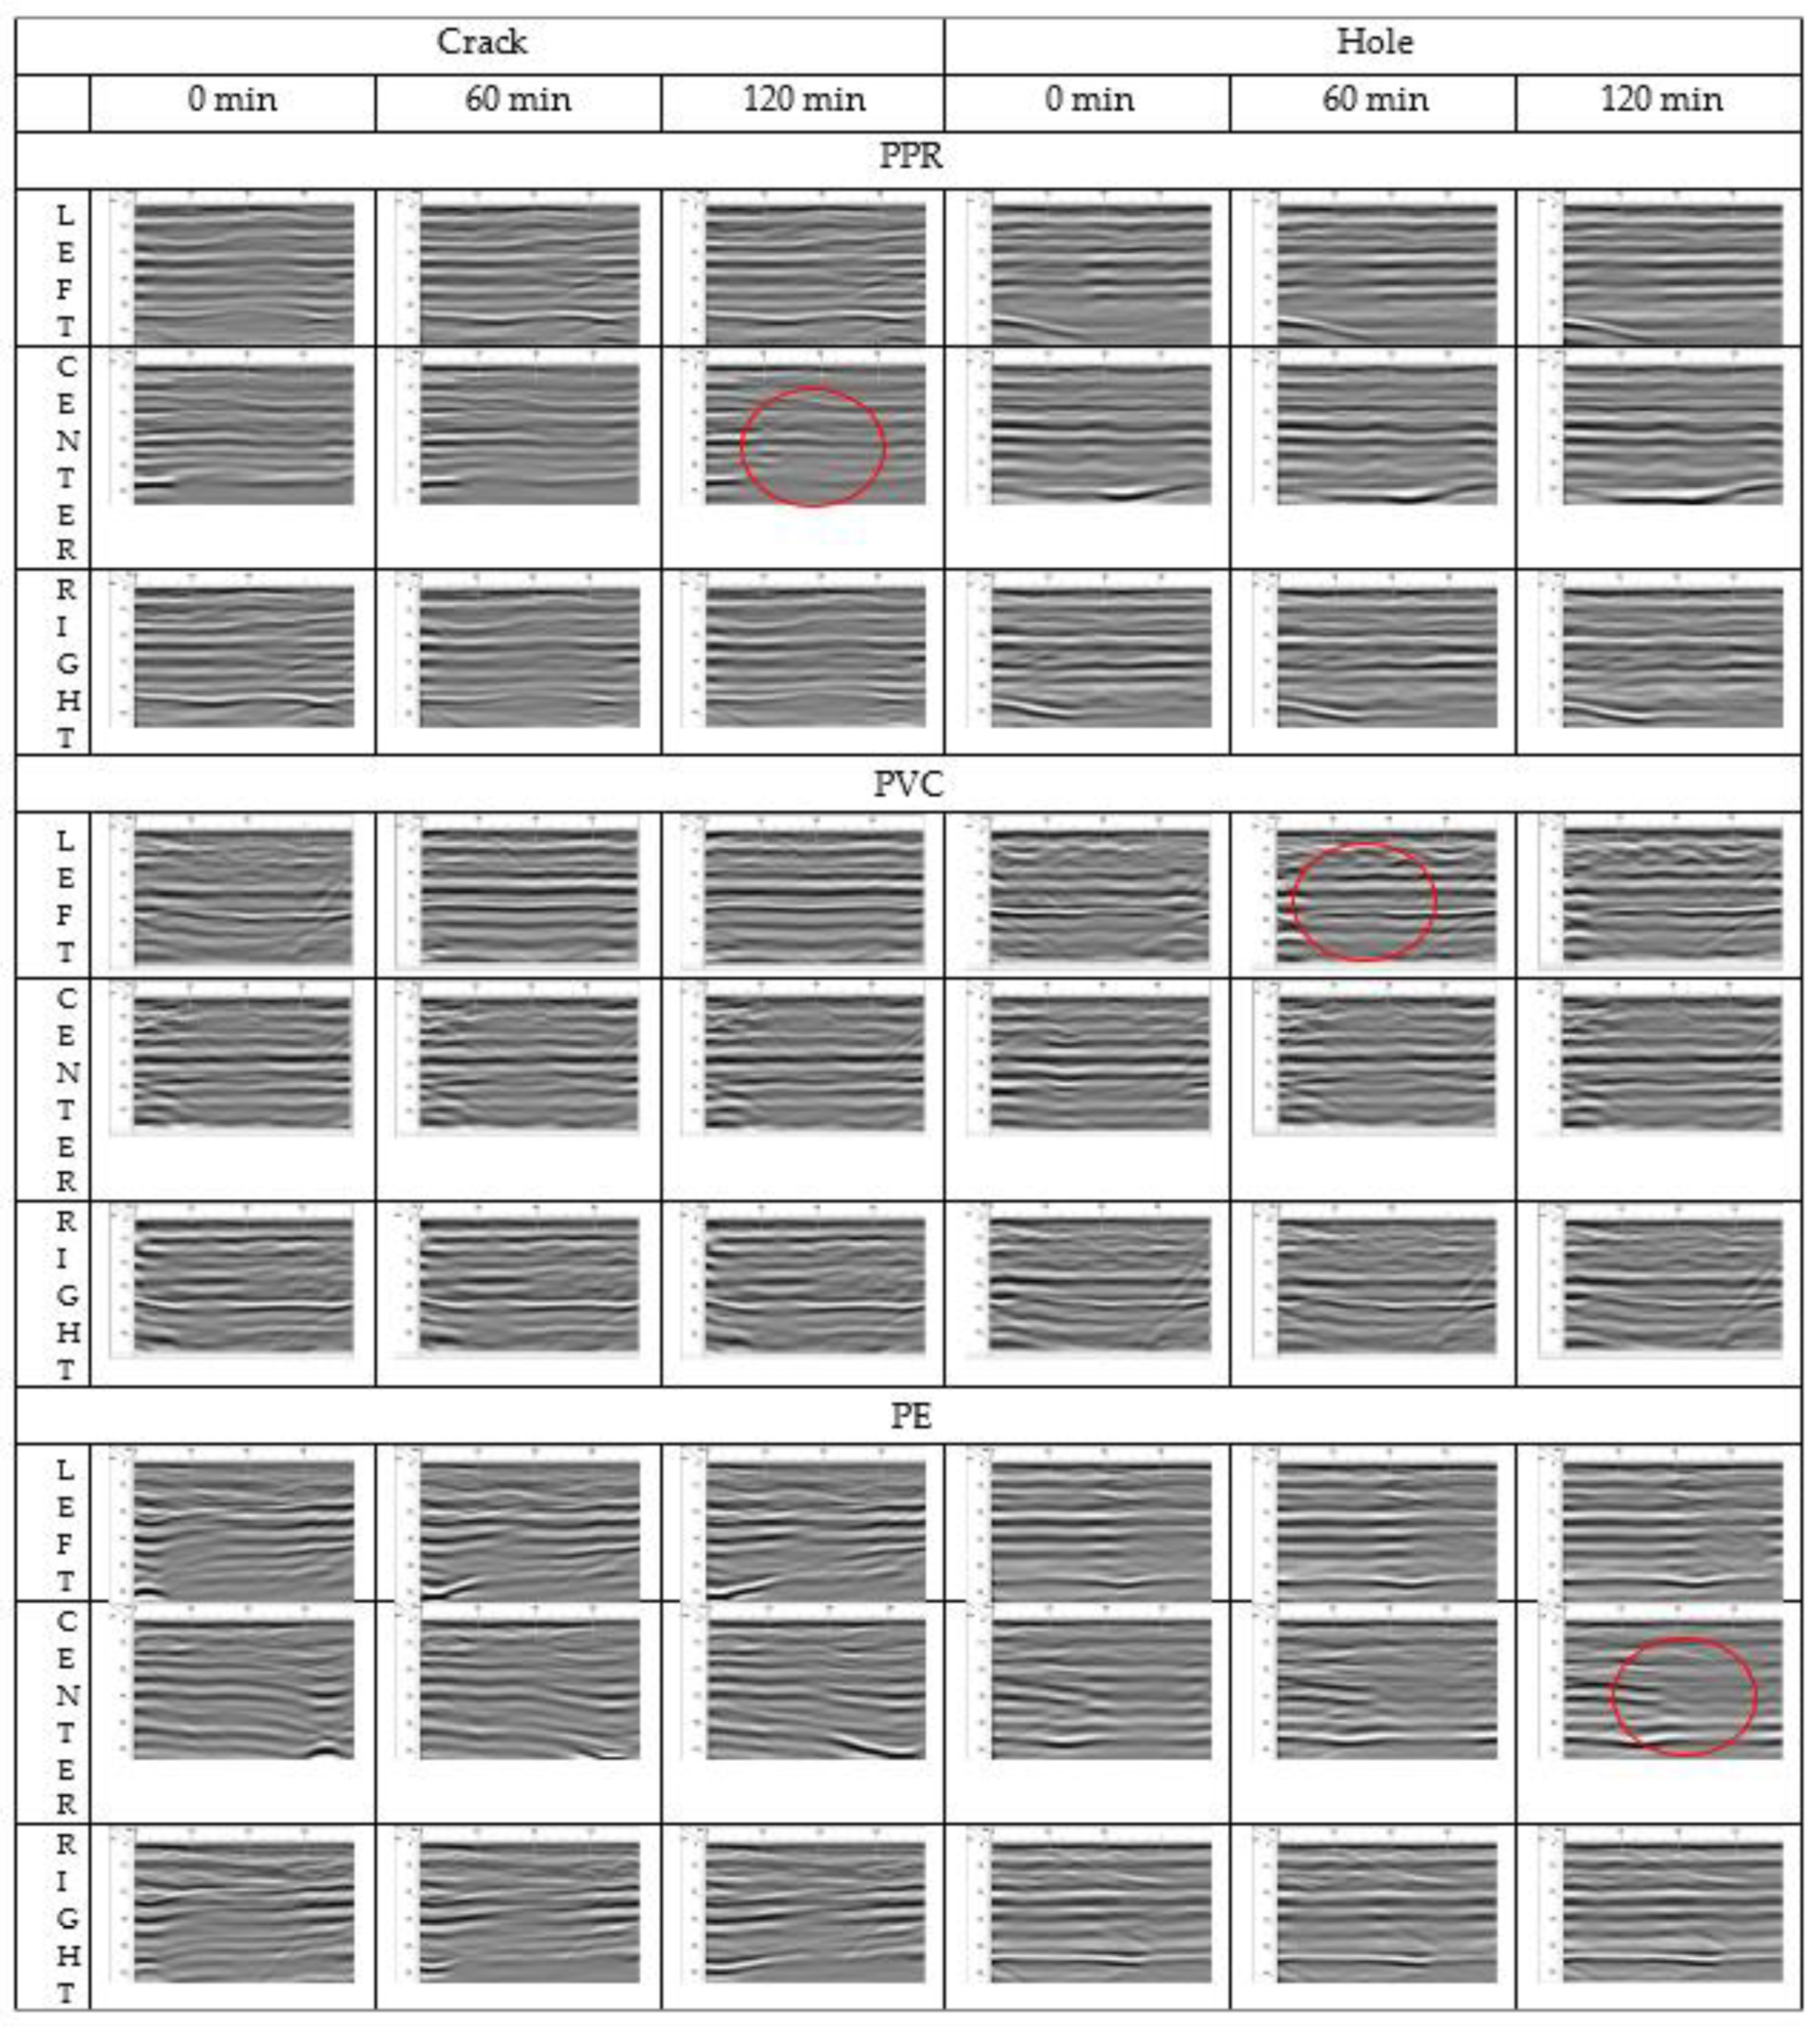
3.1. GPR
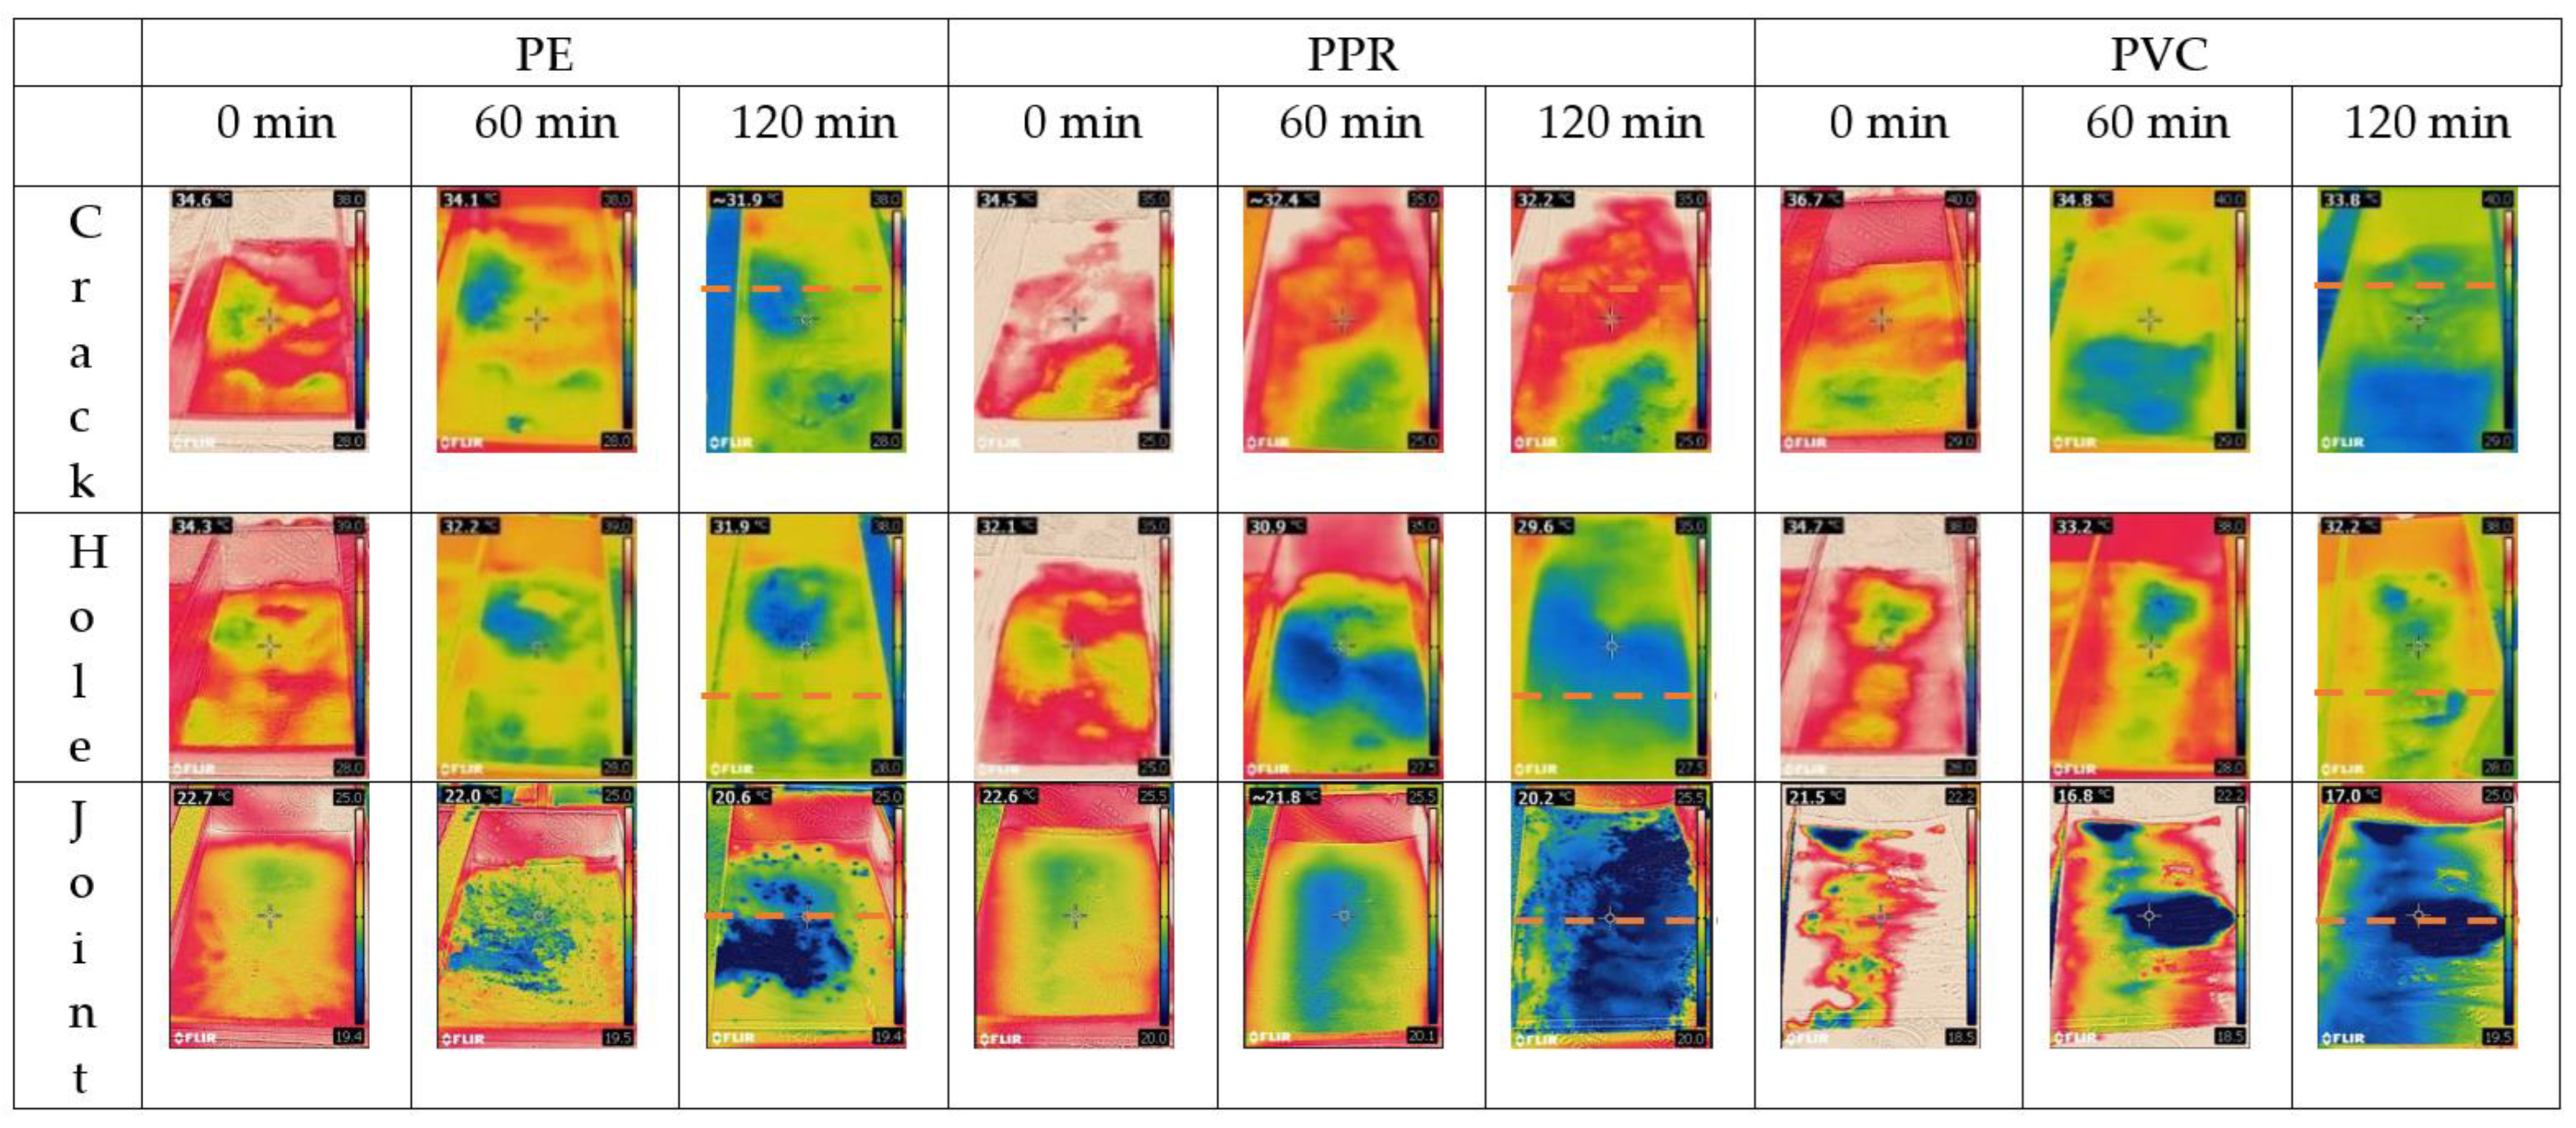
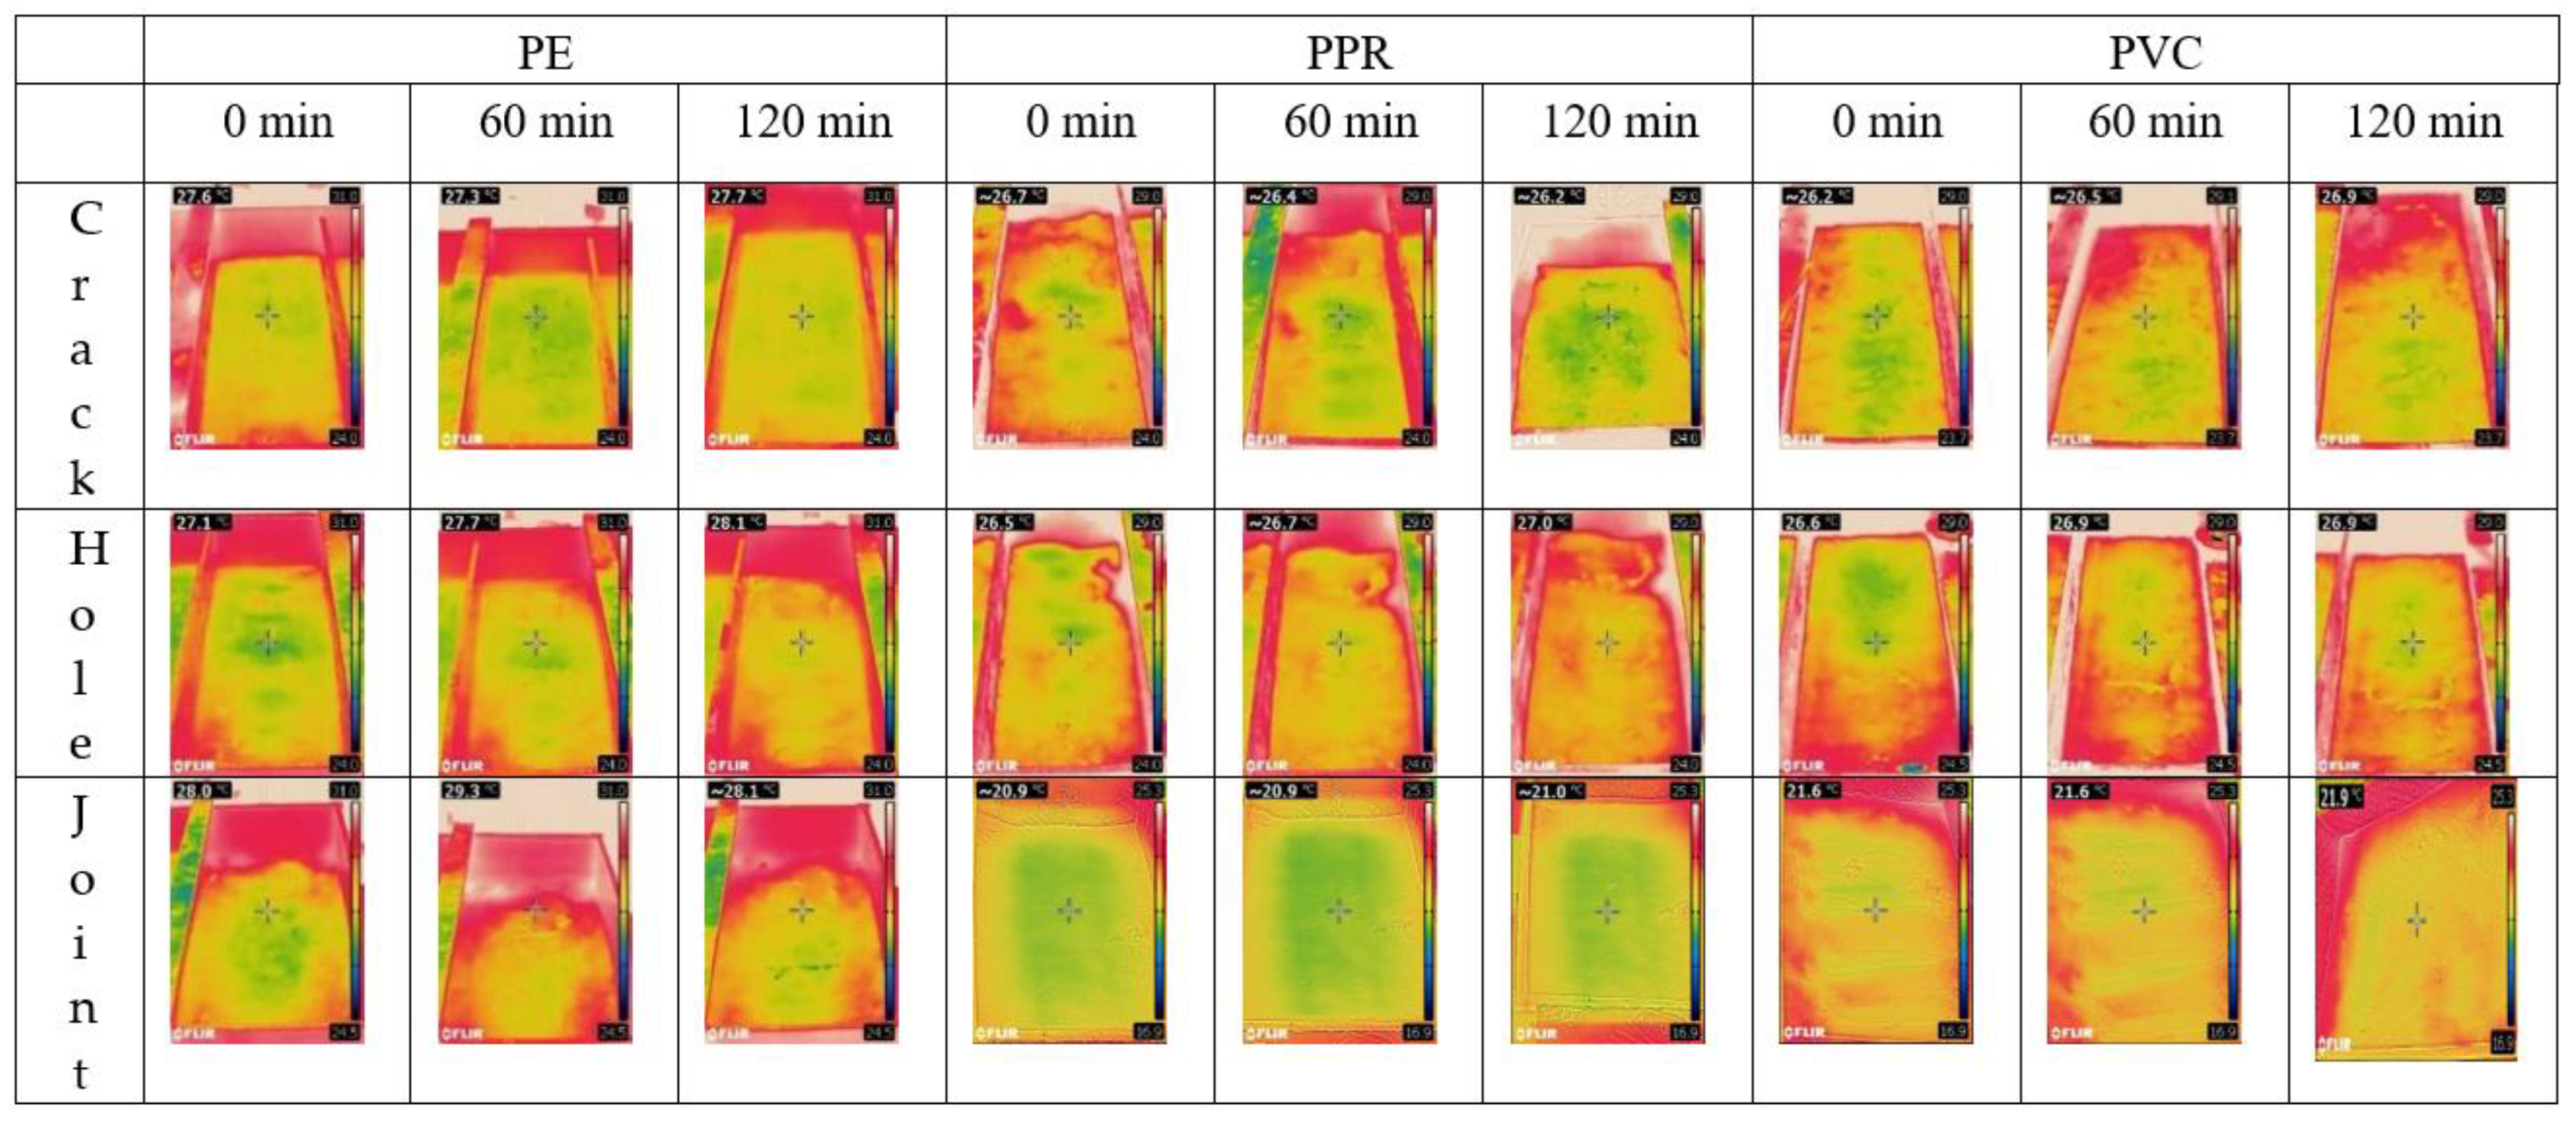
3.2. IR Camera
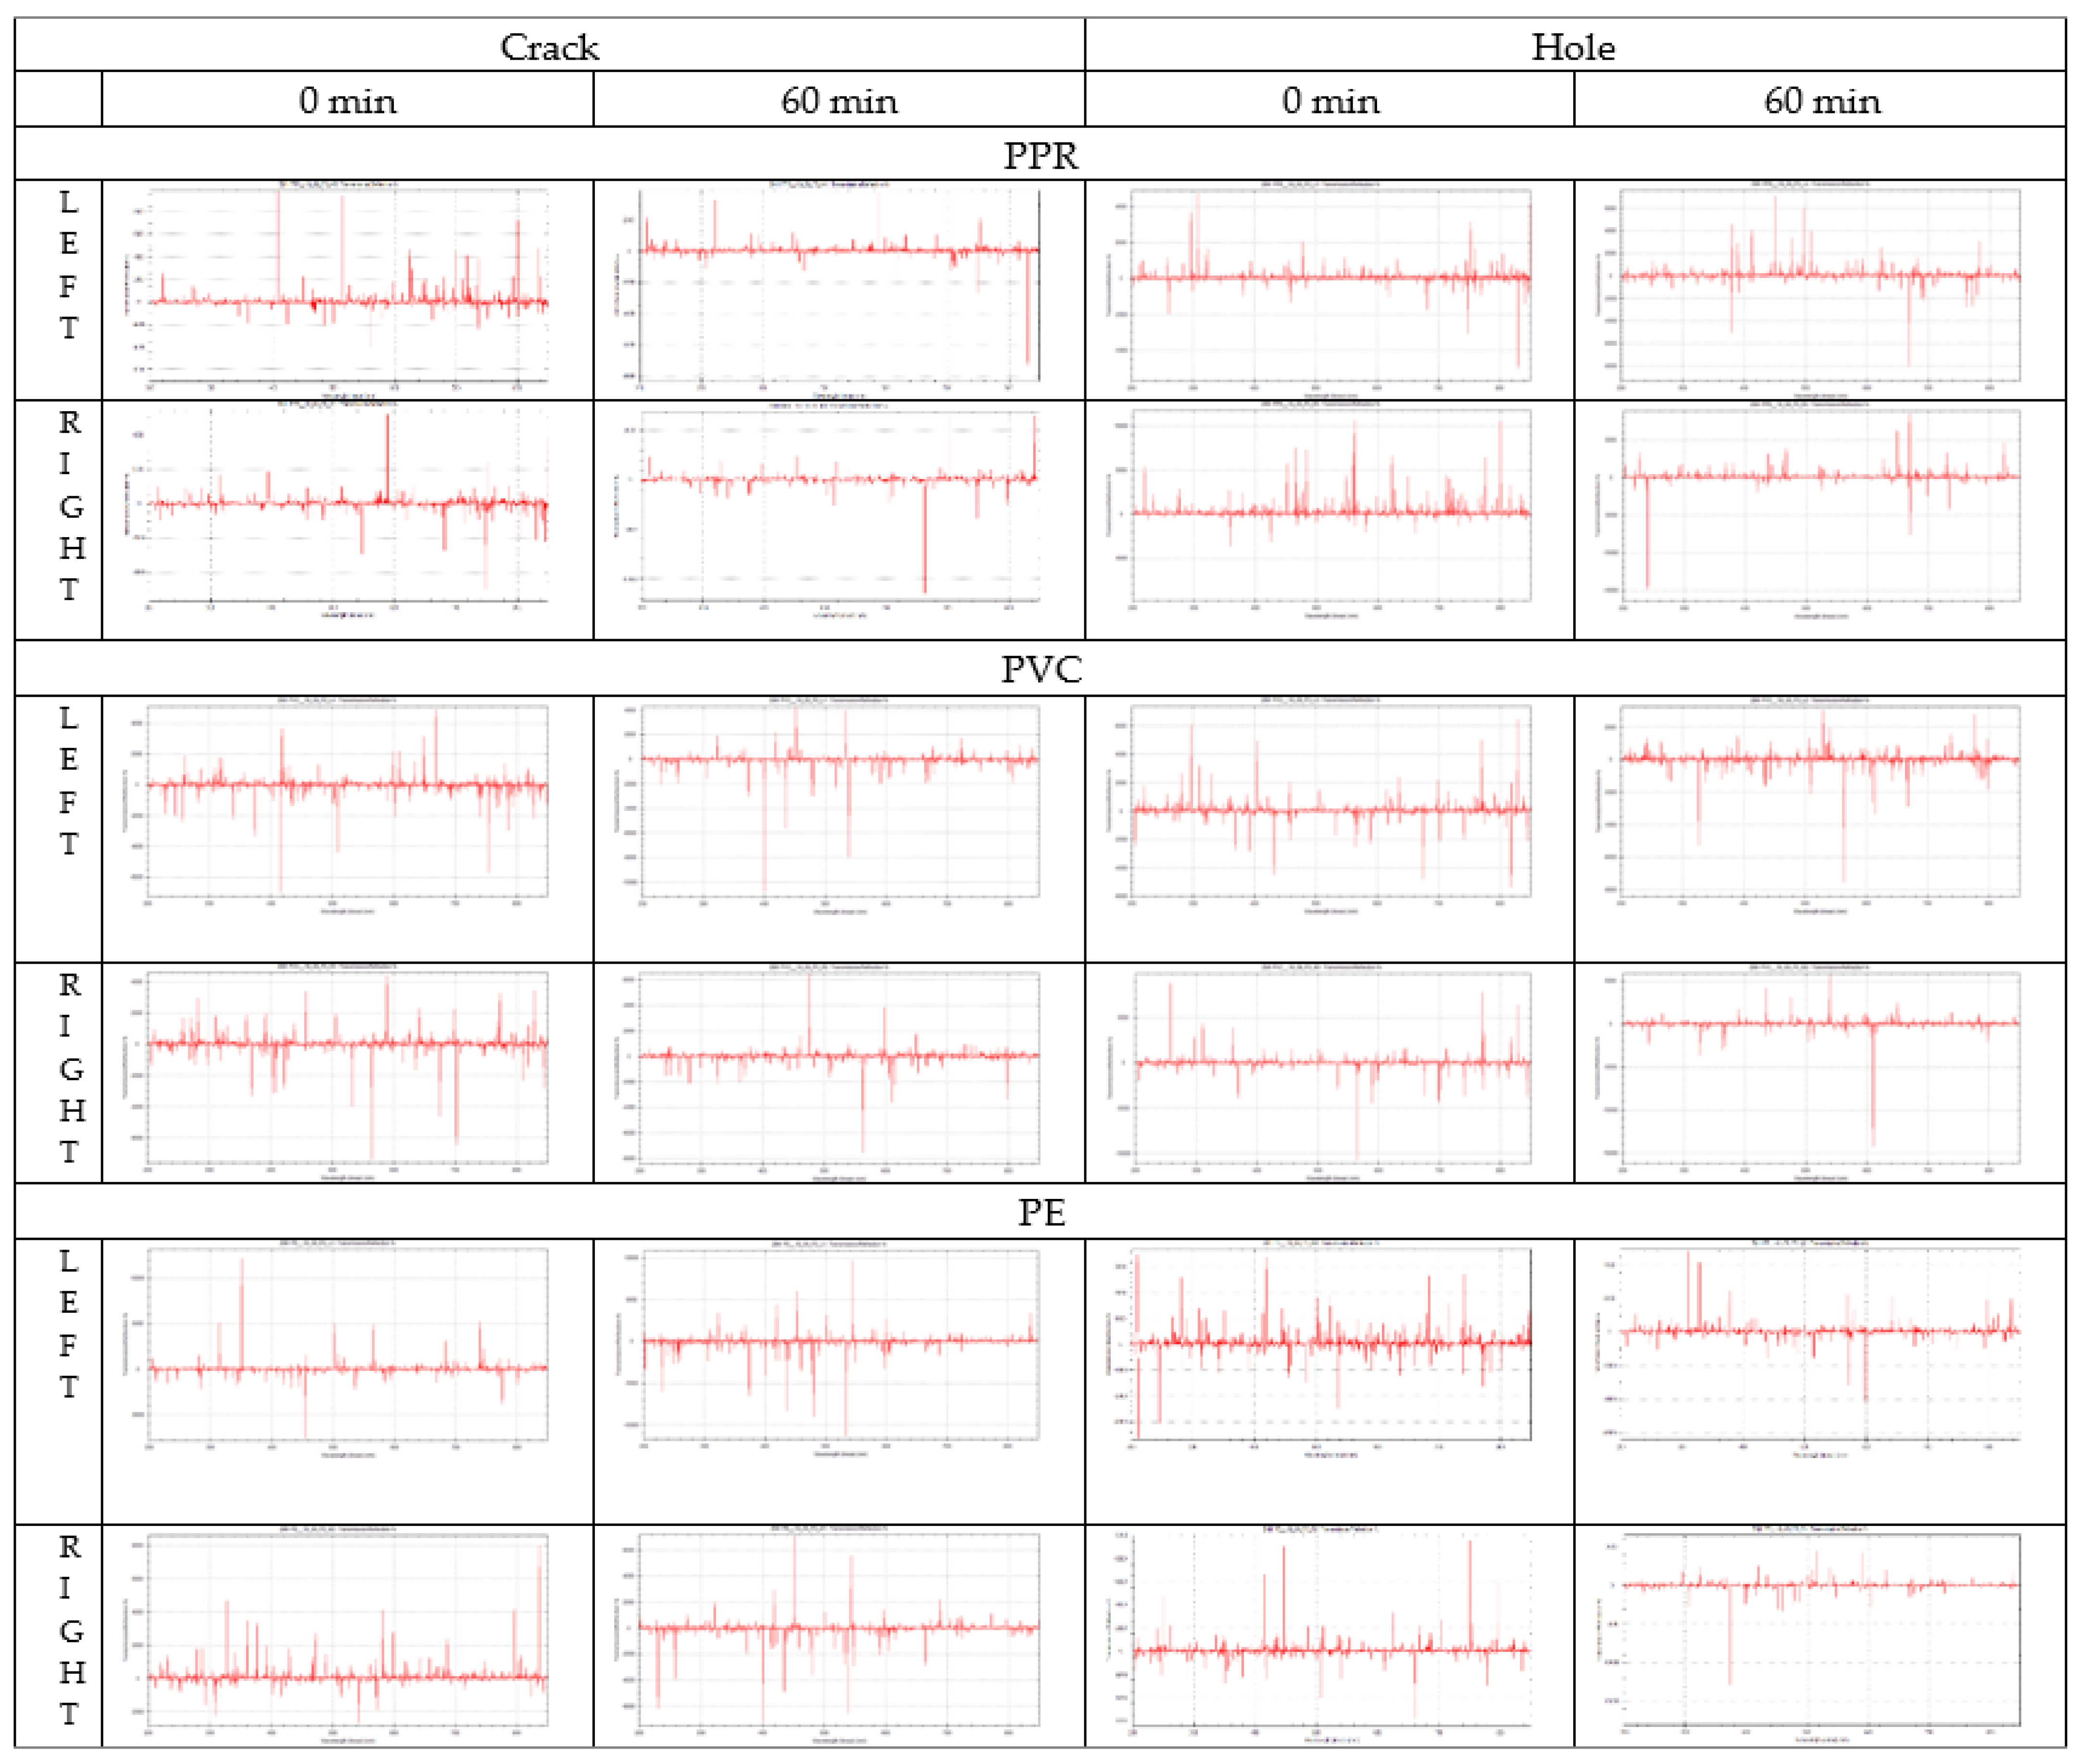
3.3. Spectrometer
3.4. Summary
4. Conclusions
- GPR: The GPR is effective in detecting leaks in sand/soil with a moisture content of 2–5%. The detection of leaks using the GPR was effective when the moisture content of the sand surrounding the pipes was 2%. Furthermore, although the GPR was able to detect leaks when the moisture content of the sand was 5%, the visual inspection of the GPR scans required special attention to details as the sand was already moisty. Contrary to this, the GPR was not able to effectively detect leaks when the moisture content was approximately 10%. In addition, the GPR was able to detect leaks in all pipe materials.
- Spectrometer: The spectrometer used in this study was able to detect leaks in all three types of pipes (PE, PPR and PVC) at 2% moisture content. However, the results did not follow a constant trend and identifying the leak was tricky. As the moisture content approached 5%, the spectrometer was only able to identify the leak in two cases, which were the PVC pipe with a crack and PPR pipe with a hole. Hence, it can be concluded that this spectrometer (spectral range of 0.20–0.85 µm) with its limited infrared spectral range cannot be deemed as an effective NDT to detect leaks in pipes when the moisture content is 5% or higher. Based on the results obtained from the IR camera, it is suggested that spectrometers with wider infrared ranges would be successful in detecting such leaks.
- IR camera: The IR camera (spectral range: 7.5–13.0 µm) used in this study was effective in detecting leaks when the moisture content of the soil surrounding the pipes was approximately 2–5%. Moreover, the IR camera can detect leaks in all three pipe materials (PE, PPR and PVC).
- Effect of soil moisture content: The ability of the three chosen NDTs to detect water leaks decreases with the increase in the moisture content of the soil. Therefore, the NDTs are only successful in capturing the significant increase in the soil moisture content due to the leaks.
- Pipe material: There was no significant effect on the ability of the NDTs to detect water leaks when the material of the pipe was PE, PPR, or PVC. Hence, if there is leak in any of the three types of pipes used in this study, it can be detected by means of the tested NDTs.
- Types of leaks: The tested NDTs were able to successfully detect the leaks due to a crack or hole in a pipe. However, the GPR was inefficient in detecting leaks from the faulty joint due to the surface ponding.
Author Contributions
Funding
Institutional Review Board Statement
Informed Consent Statement
Data Availability Statement
Acknowledgments
Conflicts of Interest
References
- Lambert, A. Assessing non-revenue water and its components: A practical approach. Water 2003, 21, 50–51. [Google Scholar]
- Puust, R.; Kapelan, Z.; Savic, D.A.; Koppel, T. A review of methods for leakage management in pipe networks. Urban Water J. 2010, 7, 25–45. [Google Scholar] [CrossRef]
- Dubai Electricity and Water Authority. DEWA Sustainability Report 2015; DEWA: Dubai, United Arab Emirates, 2016. [Google Scholar]
- Cabrera, E. Pumps, Electromechanical Devices and Systems Applied to Urban Water Management; Taylor & Francis: Abingdon, UK, 2003. [Google Scholar]
- Mortula, M.M.; Fattah, K.P.; Ali, T.A.; Idris, A.; Bardan, M. Spatiotemporal assessment of water quality in the distribution network of City of Sharjah, UAE. Int. J. Inf. Decis. Sci. 2019, 11, 116–128. [Google Scholar] [CrossRef]
- United Nations. Goal 6: Ensure Availability and Sustainable Management of Water and Sanitation for All. Available online: https://sdgs.un.org/goals/goal6 (accessed on 23 December 2021).
- Liu, Z.; Kleiner, Y. State of the art review of inspection technologies for condition assessment of water pipes. Measurement 2013, 46, 1–15. [Google Scholar] [CrossRef] [Green Version]
- Xu, X.; Karney, B. An overview of transient fault detection techniques. In Modeling and Monitoring of Pipelines and Networks; Verde, C., Torres, L., Eds.; Springer: Berlin/Heidelberg, Germany, 2017; pp. 13–37. [Google Scholar]
- Meniconi, S.; Capponi, C.; Frisinghelli, M.; Brunone, B. Leak detection in a real transmission main through transient tests: Deeds and misdeeds. Water Resour. Res. 2021, 57, e2020WR027838. [Google Scholar] [CrossRef]
- Brunone, B.; Capponi, C.; Meniconi, S. Design criteria and performance analysis of a smart portable device for leak detection in water transmission mains. Measurement 2021, 183, 109844. [Google Scholar] [CrossRef]
- Gizzi, F.T.; Leucci, G. Global Research Patterns on Ground Penetrating Radar (GPR). Surv. Geophys. 2018, 39, 1039–1068. [Google Scholar] [CrossRef]
- Ayala-Cabrera, D.; Campbell, E.; Carreño-Alvarado, E.P.; Izquierdo, J.; Pérez-García, R. Water Leakage Evolution Based on GPR Interpretations. Procedia Eng. 2014, 89, 304–310. [Google Scholar] [CrossRef] [Green Version]
- Lai, W.W.L.; Chang, R.K.W.; Sham, J.F.C.; Pang, K. Perturbation mapping of water leak in buried water pipes via laboratory validation experiments with high-frequency ground penetrating radar (GPR). Tunn. Undergr. Space Technol. 2016, 52, 157–167. [Google Scholar] [CrossRef]
- De Coster, A.; Medina, J.L.P.; Nottebaere, M.; Alkhalifeh, K.; Neyt, X.; Vanderdonckt, J.; Lambot, S. Towards an improvement of GPR-based detection of pipes and leaks in water distribution networks. J. Appl. Geophy. 2019, 162, 138–151. [Google Scholar] [CrossRef]
- Zajícová, K.; Chuman, T. Application of ground penetrating radar methods in soil studies: A review. Geoderma 2019, 343, 116–129. [Google Scholar] [CrossRef]
- Hadjimitsis, D.G.; Agapiou, A.; Themistocleous, K. Integrated Use of Space, Geophysical and Hyperspectral Technologies Intended for Monitoring Water Leakages in Water Supply Networks; IntechOpen: London, UK, 2014. [Google Scholar]
- Stampolidis, A.; Soupios, P.; Vallianatos, F.; Tsokas, G.N. Detection of leaks in buried plastic water distribution pipes in urban places—A case study. In Proceedings of the 2nd International Workshop on Advanced Ground Penetrating Radar, Delft, Netherlands, 14–16 May 2003; pp. 120–124. [Google Scholar] [CrossRef]
- Eyuboglu, S.; Mahdi, H.; Al-Shukri, H. Detection of water leaks using ground penetrating radar. In Proceedings of the 3rd International Conference on Applied Geophysics, Orlando, FL, USA, 8–12 December 2003. [Google Scholar]
- Ayala–Cabrera, D.; Herrera, M.; Izquierdo, J.; Ocaña–Levario, S.J.; Pérez–García, R. GPR-Based Water Leak Models in Water Distribution Systems. Sensors 2013, 13, 15912–15936. [Google Scholar] [CrossRef]
- Cataldo, A.; Persico, R.; Leucci, G.; De Benedetto, E.; Cannazza, G.; Matera, L.; De Giorgi, L. Time domain reflectometry, ground penetrating radar and electrical resistivity tomography: A comparative analysis of alternative approaches for leak detection in underground pipes. NDT E Int. 2014, 62, 14–28. [Google Scholar] [CrossRef]
- Demirci, S.; Yigit, E.; Eskidemir, I.H.; Ozdemir, C. Ground penetrating radar imaging of water leaks from buried pipes based on back-projection method. NDT E Int. 2012, 47, 35–42. [Google Scholar] [CrossRef]
- Nakhkash, M.; Mahmood-Zadeh, M.R. Water leak detection using ground penetrating radar. In Proceedings of the Tenth International Conference on Grounds Penetrating Radar, Delft, Netherlands, 21–24 June 2004; pp. 525–528. [Google Scholar]
- Hunaidi, O.; Chu, W.; Wang, A.; Guan, W. Detecting leaks in plastic pipes. J. Am. Water Work. Assoc. 2000, 92, 82–94. [Google Scholar] [CrossRef] [Green Version]
- Kuo, S.S.; Zhao, L.; Mahgoub, H.S.; Suarez, P.F. Investigation of Ground Penetrating Radar for Detection of Leaking Pipelines under Roadway Pavements and Development of Fiber-Wrapping Repair Technique; University of Central Florida: Orlando, FL, USA, 2005; Available online: https://trid.trb.org/view.aspx?id=758052 (accessed on 29 June 2018).
- Topp, G.C.; Davis, J.L.; Annan, A.P. Electromagnetic determination of soil water content: Measurements in coaxial transmission lines. Water Resour. Res. 1980, 16, 574–582. [Google Scholar] [CrossRef] [Green Version]
- Mortula, M.; Aslam, H.; Karunagoda, P.; Quadri, S.; Slim, M.; Hammodat, A.; Al Nabulsi, M.; Ali, T. Use of Spectrometer for Detection of Leaks in Water Distribution System. In Proceedings of the 1st International WDSA/CCWI Joint Conference, Kingston, ON, Canada, 23–25 July 2018. [Google Scholar]
- Aslam, H.; Kaur, M.; Sasi, S.; Mortula, M.; Yehia, S.; Ali, T. A Conceptual Approach to Detection of Water Pipe Leakage using Non-Destructive Techniques. In Proceedings of the International Conference on Water, Energy and Environment, Sharjah, United Arab Emirates, 28 February–2 March 2017. [Google Scholar]
- Aslam, H.; Kaur, M.; Sasi, S.; Mortula, M.M.; Yehia, S.; Ali, T. Detection of Leaks in Water Distribution System using Non-Destructive Techniques. IOP Conf. Ser. Earth Environ. Sci. 2018, 150, 012004. [Google Scholar] [CrossRef]
- Younis, S.M.Z.; Iqbal, J. Estimation of soil moisture using multispectral and FTIR techniques. Egypt. J. Remote Sens. Space Sci. 2015, 18, 151–161. [Google Scholar] [CrossRef] [Green Version]
- Demattê, J.A.M.; Sousa, A.A.; Alves, M.C.; Nanni, M.R.; Fiorio, P.R.; Campos, R.C. Determining soil water status and other soil characteristics by spectral proximal sensing. Geoderma 2006, 135, 179–195. [Google Scholar] [CrossRef]
- Tian, J.; Philpot, W.D. Relationship between surface soil water content, evaporation rate, and water absorption band depths in SWIR reflectance spectra. Remote Sens. Environ. 2015, 169, 280–289. [Google Scholar] [CrossRef]
- Roosjen, P.P.J.; Bartholomeus, H.M.; Clevers, J.G.P.W. Effects of soil moisture content on reflectance anisotropy—Laboratory goniometer measurements and RPV model inversions. Remote Sens. Environ. 2015, 170, 229–238. [Google Scholar] [CrossRef]
- Weidong, L.; Baret, F.; Xingfa, G.; Qingxi, T.; Lanfen, Z.; Bing, Z. Relating soil surface moisture to reflectance. Remote Sens. Environ. 2002, 81, 238–246. [Google Scholar] [CrossRef]
- Nocita, M.; Stevens, A.; Noon, C.; van Wesemael, B. Prediction of soil organic carbon for different levels of soil moisture using Vis-NIR spectroscopy. Geoderma 2013, 199, 37–42. [Google Scholar] [CrossRef]
- Fabre, S.; Briottet, X.; Lesaignoux, A. Estimation of Soil Moisture Content from the Spectral Reflectance of Bare Soils in the 0.4–2.5 µm Domain. Sensors 2015, 15, 3262–3281. [Google Scholar] [CrossRef] [PubMed]
- Lobell, D.B.; Asner, G.P. Moisture Effects on Soil Reflectance. Soil Sci. Soc. Am. J. 2002, 66, 722–727. [Google Scholar] [CrossRef]
- Fahmy, M.; Moselhi, O. Automated Detection and Location of Leaks in Water Mains Using Infrared Photography. J. Perform. Constr. Facil. 2010, 24, 242–248. [Google Scholar] [CrossRef]
- Atef, A.; Zayed, T.; Hawari, A.; Khader, M.; Moselhi, O. Multi-tier method using infrared photography and GPR to detect and locate water leaks. Autom. Constr. 2016, 61, 162–170. [Google Scholar] [CrossRef]
- Awwad, A.; Yahya, M.; Albasha, L.; Mortula, M.M.; Ali, T. Remote Thermal Water Leakage Sensor with a Laser Communication System. IEEE Access 2020, 8, 163784–163796. [Google Scholar] [CrossRef]
- Shakmak, B.; Al-Habaibeh, A. Detection of water leakage in buried pipes using infrared technology; A comparative study of using high and low resolution infrared cameras for evaluating distant remote detection. In Proceedings of the 2015 IEEE Jordan Conference on Applied Electrical Engineering and Computing Technologies (AEECT), Amman, Jordan, 3–5 November 2015; pp. 1–7. [Google Scholar] [CrossRef] [Green Version]
- Eidenshink, J.C. Detection of leaks in buried rural water pipelines using thermal infrared images. Photogramm. Eng. Remote Sens. 1985, 51, 561–564. [Google Scholar]
- El-Zahab, S.; Zayed, T. Leak detection in water distribution networks: An introductory overview. Smart Water 2019, 4, 5. [Google Scholar] [CrossRef] [Green Version]
- Wazlan, W.S. Assessing the Condition of Buried Pipe Using Ground Penetrating Radar. Ph.D. Thesis, The University of Birmingham, Birmingham, UK, 2014. Available online: https://etheses.bham.ac.uk/id/eprint/4772/ (accessed on 29 June 2019).
- GSSI. Concrete Handbook; Geophysical Survey Systems, Inc.: Nashua, NH, USA, 2017. [Google Scholar]
- Fattah, K.P.; Mortula, M. Leaching of organic material in polymeric pipes distributing desalinated water. Int. J. Hydrol. Sci. Technol. 2020, 10, 210–219. [Google Scholar] [CrossRef]
- Ercoli, M.; Di Matteo, L.; Pauselli, C.; Mancinelli, P.; Frapiccini, S.; Talegalli, L.; Cannata, A. Integrated GPR and laboratory water content measures of sandy soils: From laboratory to field scale. Constr. Build. Mater. 2018, 159, 734–744. [Google Scholar] [CrossRef]
- Yehia, S.; Abudayyeh, O.; Nabulsi, S.; Abdelqader, I.; Siddagangappa, J. GPR Imaging Evaluation of the Napier Avenue Interchange on I-94 Culvert. In Proceedings of the ASCE International Conference on Computing in Civil Engineering, Cancun, Mexico, 12–15 July 2005; pp. 1–7. [Google Scholar] [CrossRef]
- Yehia, S.; Abudayyeh, O.; Nabulsi, S.; Abdelqader, I. Detection of Common Defects in Concrete Bridge Decks Using Nondestructive Evaluation Techniques. J. Bridge Eng. 2007, 12, 215–225. [Google Scholar] [CrossRef]
- Yehia, S. GPR an Effective Tool inside the Inspector’s Toolbox. In Proceedings of the 2nd Conference on Service Life Design for Infrastructure, Delft, The Netherlands, 4–6 October 2010. [Google Scholar]
- Yehia, S.; Qaddoumi, N.; Farrag, S.; Hamzeh, L. Investigation of concrete mix variations and environmental conditions on defect detection ability using GPR. NDT E Int. 2014, 65, 35–46. [Google Scholar] [CrossRef]


| Method | Objective | Advantage | Disadvantage |
|---|---|---|---|
| Visual Inspection | |||
| Closed-circuit television (CCTV) | Inspects the inner surface of the pipe. |
|
|
| Laser scan | Measures the inner pipe distance by laser. |
|
|
| Electromagnetic Methods | |||
| Ultra-wideband (UWB) pulsed radar system: P-scan | Inspects the condition of the pipe by transmitting and receiving electromagnetic pulses in the nano and pico-second ranges. |
| Pre-commercial prototype of this system is still under development. |
| Acoustic Methods | |||
| Sonar profiling system | Inspects precise pipe cross-sections and potential leakages. |
|
|
| Impact echo | Inspects pipe thickness based on the use of impact-generated stress waves. |
|
|
| Ultrasound Methods | |||
| Guided wave ultrasound | Inspects pipe cross-sections based on propagating a wave for a long distance. | Used to characterize metal loss due to the corrosion |
|
| Study Type | Soil | Pipe Material | Pipe Diameter (mm) | Results | Reference |
|---|---|---|---|---|---|
| Lab | Dry soil | PVC | 100 | GPR was successful in not only detecting the leak but also reconstructing the various stages of the leak and how water dissipated through the soil | [12] |
| Field | Gravel, sand, silt, and clay | Unknown | - | GPR produced inferior results as the presence of clay resulted in absorption of the GPR signals | [16] |
| Field | Unknown | Unknown | - | GPR can be applicable for leak detection of several types of pipes | [17] |
| Lab | Sand | Metal and PVC | 19 | Raw data collected in the field by GPR is sufficient to detect water leaks | [18] |
| Lab and field | Dry soil | Lab: PVC, Field: cast iron | Lab: 100 Field: 400 | Difficult to interpret raw images, more complex models are needed | [19] |
| Lab and field | Silt and clay | Plastic and metallic | - | GPR technique provided a good estimation of the position of the leak; however, its response is influenced by the presence of other buried objects/anomalies underground | [20] |
| Lab and field | Dry sand | Plastic | 50 | Successful but detection through voids highly depends on the investigated medium and the radar system parameters | [21] |
| Lab | Soil | Cement | 200 | GPR was successful in water leak detection | [22] |
| Field | Silty clay | PVC | 152.4 | The pipe appears slightly deeper in the image above the leak, which could indicate radar waves slowed by saturated soil near the leak | [23] |
| Spectrometer | Soil Type | Moisture Content | Results | Reference |
|---|---|---|---|---|
| Fourier Transform Infrared Spectrometer | Silt clay loam, loam, clay loam, and silt clay | 4.6–48.5% | As the moisture increases, reflectance from soil decreases and vice versa | [29] |
| Infra-Red Intelligent Spectroradiometer | Soils from sandstone, basic rocks, basalt, and shale | 420.71%, oven dried | The increase of moisture contents promoted a reduction in the magnitude of spectral reflectance | [30] |
| ASD FieldSpec Pro | Quartz sand, masonry sand, and Ithaca sand | 55.7%, oven dried | As water content increases, reflectance decreases at all wavelengths but the decrease is much more pronounced in the infrared | [31] |
| ASD FieldSpec 3 spectrometer | Loam, sand, and sandy Loam, sand, and loam | - | Reflectance decreased with increasing soil moisture, except for oversaturated soil moisture content levels (N64%) in the VNIR region of the spectrum | [32] |
| ASD Pro FR Portable Spectroradiometer | 10 samples from all over France | - | For low soil moisture, reflectance decreases when soil moisture increases. Conversely, for the higher soil moisture, reflectance increases when soil moisture increases | [33] |
| ASD Fieldspec-Pro spectroradiometer | Sandstone, sandy soil, and loamy/clay soils | 0.05–0.25 g water/g soil | Spectral reflectance decreased non-linearly with increasing moisture content | [34] |
| ASD FieldSpec Pro FRspectroradiometer and FTIR Bruker Equinox 55 spectrometer | Natural soil samples from France | 44–0% | An increasing value of SMC leads to a decrease in the reflectance level in the entire optical domain | [35] |
| ASD spectrometer | Argicridisol, xeric andisol, ustic mollisol, and aridic entisol | 70–0% | Reflectance decreased with increasing moisture for all soils | [36] |
| Exemplar LS Spectrometer | Dune sand | 5% | Reflectance obtained as in the infrared range and decreases with increases in moisture | [26,28] |
| Study Type | IR Camera | Soil Type | Pipe | Results | Reference |
|---|---|---|---|---|---|
| Field | ThermaCAM S 60 IR system (7.5–13 µm) | - | Cast iron | The IR camera successfully detected the leaks as a thermal contrast at the pavement surface that occurred in fall and spring seasons, while it failed in detecting leaks occurring in the summer and winter due to high pavement temperature and the snow coverage, respectively. | [37] |
| Lab and field | VarioCAM 400 IR camera (7.5–14 mm) | Lab: clayey soil, Field: crushed sand stone | PVC | Multi-tier detection technology (GPR and IR camera) was successful in detecting the leaks in summer and winter seasons with a small margin of error (2.9–5.6%) in estimating leakage areas. | [38] |
| Lab | IRISYS Camera and Flir A310f IR Camera (7.5–13 µm) | - | Plastic | The cameras are able to visualize the leak despite the leak itself being not being evident on the surface by visual inspection. | [40] |
| Field | Thermal Infrared Scanner | South Dakota area | - | Leaks in buried rural water pipelines can be detected using thermal infrared images collected under proper conditions. | [41] |
| Field | Hydrogen leak detector, Sensistor AB model 8012 | Silty clay | PVC | Thermography showed promise as a tool for initial leak surveys. | [23] |
| Sequence of Tests | Moisture Content | Pipe Material | ||
|---|---|---|---|---|
| PVC | PE | PPR | ||
| Round 1 | 2% | √ | √ | √ |
| Round 2 | 5% | √ | √ | √ |
| Round 3 | 10% | √ | √ | √ |
| Water Content (%) | Dielectric Constant |
|---|---|
| 0.00 | 4.0 |
| 2 | 4.8 |
| 5.00 | 8.5 |
| Type of Leak | 2% Moisture Content | 5% Moisture Content | 10% Moisture Content | ||||||
|---|---|---|---|---|---|---|---|---|---|
| GPR | Spectrometer | IR Camera | GPR | Spectrometer | IR Camera | GPR | Spectrometer | IR Camera | |
| PVC | |||||||||
| Crack | ✓ | ✓ | ✓ | ✓ | ✓ | ✓ | ✗ * | ✗ * | ✗ |
| Hole | ✓ | ✓ | ✓ | ✓ | ✗ * | ✓ | ✓ | ✗ * | ✗ |
| Faulty joint | ✗ * | ✗ * | ✓ | ✗ * | ✗ * | ✓ | ✗ * | ✗ * | ✗ * |
| PE | |||||||||
| Crack | ✓ | ✓ | ✓ | ✓ | ✗ * | ✓ | ✗ | ✗ * | ✗ |
| Hole | ✓ | ✓ | ✓ | ✓ | ✗ * | ✓ | ✓ | ✗ * | ✗ |
| Faulty joint | ✗ * | ✗ * | ✓ | ✗ * | ✗ * | ✓ | ✗ * | ✗ * | ✗ * |
| PPR | |||||||||
| Crack | ✓ | ✓ | ✓ | ✓ | ✗ * | ✓ | ✓ | ✗ * | ✗ |
| Hole | ✓ | ✓ | ✓ | ✓ | ✓ | ✓ | ✗ | ✗ * | ✗ |
| Faulty joint | ✗ * | ✗ * | ✓ | ✗ * | ✗ * | ✓ | ✗ * | ✗ * | ✗ * |
| Soil Moisture Content | 2% | 5% | 10% |
|---|---|---|---|
| GPR | 66.67% | 66.67% | 33.33% |
| Spectrometer | 66.67% | 22.23% | 0.00% |
| IR camera | 100% | 100% | 0.00% |
| Pipe Material | PVC | PE | PPR |
|---|---|---|---|
| GPR | 55.56% | 55.56% | 55.56% |
| Spectrometer | 33.33% | 22.22% | 33.33% |
| IR camera | 66.67% | 66.67% | 66.67% |
| Types of Leaks | Crack | Hole | Faulty Joint |
|---|---|---|---|
| GPR | 77.78% | 88.89% | 0% |
| Spectrometer | 44.44% | 44.44% | 0% |
| IR camera | 66.67% | 66.67% | 66.67% |
Publisher’s Note: MDPI stays neutral with regard to jurisdictional claims in published maps and institutional affiliations. |
© 2022 by the authors. Licensee MDPI, Basel, Switzerland. This article is an open access article distributed under the terms and conditions of the Creative Commons Attribution (CC BY) license (https://creativecommons.org/licenses/by/4.0/).
Share and Cite
Aslam, H.; Mortula, M.M.; Yehia, S.; Ali, T.; Kaur, M. Evaluation of the Factors Impacting the Water Pipe Leak Detection Ability of GPR, Infrared Cameras, and Spectrometers under Controlled Conditions. Appl. Sci. 2022, 12, 1683. https://doi.org/10.3390/app12031683
Aslam H, Mortula MM, Yehia S, Ali T, Kaur M. Evaluation of the Factors Impacting the Water Pipe Leak Detection Ability of GPR, Infrared Cameras, and Spectrometers under Controlled Conditions. Applied Sciences. 2022; 12(3):1683. https://doi.org/10.3390/app12031683
Chicago/Turabian StyleAslam, Huda, Md Maruf Mortula, Sherif Yehia, Tarig Ali, and Manreet Kaur. 2022. "Evaluation of the Factors Impacting the Water Pipe Leak Detection Ability of GPR, Infrared Cameras, and Spectrometers under Controlled Conditions" Applied Sciences 12, no. 3: 1683. https://doi.org/10.3390/app12031683
APA StyleAslam, H., Mortula, M. M., Yehia, S., Ali, T., & Kaur, M. (2022). Evaluation of the Factors Impacting the Water Pipe Leak Detection Ability of GPR, Infrared Cameras, and Spectrometers under Controlled Conditions. Applied Sciences, 12(3), 1683. https://doi.org/10.3390/app12031683