Abstract
Changes in clouds can affect the outpower of photovoltaics (PVs). Ground-based cloud images classification is an important prerequisite for PV power prediction. Due to the intra-class difference and inter-class similarity of cloud images, the classical convolutional network is obviously insufficient in distinguishing ability. In this paper, a classification method of ground-based cloud images by improved combined convolutional network is proposed. To solve the problem of sub-network overfitting caused by redundancy of pixel information, overlap pooling kernel is used to enhance the elimination effect of information redundancy in the pooling layer. A new channel attention module, ECA-WS (Efficient Channel Attention–Weight Sharing), is introduced to improve the network’s ability to express channel information. The decision fusion algorithm is employed to fuse the outputs of sub-networks with multi-scales. According to the number of cloud images in each category, different weights are applied to the fusion results, which solves the problem of network scale limitation and dataset imbalance. Experiments are carried out on the open MGCD dataset and the self-built NRELCD dataset. The results show that the proposed model has significantly improved the classification accuracy compared with the classical network and the latest algorithms.
1. Introduction
Affected by short-term weather changes, the output power of PV power generation is easily fluctuated [1,2]. At present, the forecasting of PV power becomes an important method to reduce the impact of power fluctuations. Through power forecasting, the power sector can reasonably dispatch PV resources and reduce the impact of power fluctuations on grid-connected PVs. Dissipation and aggregation of cloud clusters in a short period of time are important factors that cause fluctuations in output power. Besides, solar irradiance is affected directly by the different types of clouds [3]. Different types of clouds have different characteristics, such as thickness, height, and sky coverage, which affect the magnitude of solar radiation received by the ground. Therefore, classification of clouds is crucial for PV power prediction.
There are various forms of clouds belonging to the same category, and different categories of clouds are also a transitional relationship, so they have greater similarity, which brings great challenges to the classification of clouds. In the early days, machine learning based classifiers were often used to classify cloud images. For example, Heinle et al. [4] used the K-nearest neighbors to classify the cloud by extracting the spectral and texture features of the cloud image. Kazantzidis et al. [5] introduced cloud classification by counting the color and texture features of cloud images, and at the same time considered multi-modal information as the input of the improved K-nearest neighbors classifier. Zhao et al. [6] proposed that the texture, local structure, and statistical feature were used as the input of SVM and achieved an accuracy of 64.1% on the dataset of nine cloud categories.
With the continuous development of deep learning in recent years, the performance of convolutional neural network (CNN) in the field of image classification has been greatly improved. Because of better feature representation capabilities, CNN can mine more deep semantic features from the image. Liu et al. [7] produced a MGCD dataset with 8000 ground-based cloud images and corresponding meteorological data, yielding an accuracy as high as 87.9% with multi-modal fusion algorithm. Ye et al. [8] introduced a CNN to extract the features of cloud images; fisher vector coding and SVM classifier are utilized for cloud images classification. Zhang et al. [9] proposed a CloudNet model and obtained a high accuracy on a self-built CCSN dataset containing 2543 cloud images. Huertas-Tato et al. [10] proposed an ensemble learning algorithm to fuse the output probability vector of CNN and random forest classifier to improve the classification accuracy. In [11], the network named MMFN was proposed, which could learn extended cloud information by fusing heterogeneous features in a unified framework. In [12], the task-based graph convolutional network was introduced to obtain the correlation between cloud images, yielding an accuracy as high as 89.48%.
There are many cloud image datasets available for reference in existing research. It can be divided into satellite cloud images, part-sky ground-based cloud images, and all-sky ground-based cloud images. There are many research methods for the classification of satellite cloud images [13,14,15,16], and this classification is extremely effective for macro-level meteorological analysis. However, satellite cloud images cover a large area and have few local details. It is extremely difficult to analyze cloud clusters in a small patch of sky, which makes it not widely used in the field of PV power generation. For the classification of part-sky ground-based cloud images, there have also been many research methods [17,18,19]. However, part-sky ground-based cloud images have a small field of view and cannot meet the large-scale PV power station requirements. The field of view of the all-sky ground-based cloud images is generally 180°, which can capture most of the sky, as shown in Figure 1. The collected cloud images have clear textures and rich structural features, which are suitable for PV power stations of almost all sizes. However, there are still few studies on this type of cloud images, and the amount of data in public datasets is also small. In some existing studies, the accuracy of classification is low, which cannot well meet the application in PV power generation. In response to the above problems, we made a ground-based cloud images dataset with a larger amount of data and proposed a deep learning-based ground-based cloud image classification method. The main contributions are shown as follows:
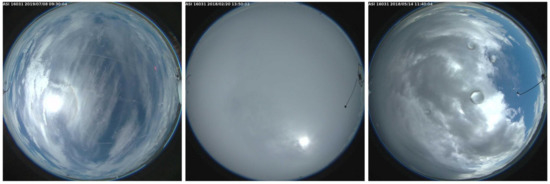
Figure 1.
Ground-based cloud images.
(1) By collecting historical cloud images data published by the National Renewable Energy Laboratory (NREL) on the US Measurement and Instrument Data Center (MIDC) website, a ground-based cloud images dataset NRELCD (NREL Cloud Dataset) is constructed. The dataset contains 15,450 cloud images and is divided into 7 categories.
(2) A novel ground-based cloud images classification method by improved combined neural network is proposed; overlap pooling kernels are used in the sub-network to improve the effect of eliminating information redundancy and reduce the risk of overfitting. The improved channel attention module ECA-WS is introduced after the pooling layer, which further enhances the sub-network’s ability to express channel characteristics. The synchronization of parameter optimization among sub-networks is realized by improving the sub-networks. The decision fusion algorithm is used to weight the output of the two sub-networks in the combined network to improve the classification accuracy significantly.
The rest of this paper is organized as follows: Section 2 briefly introduces some related work; Section 3 describes a novel ground-based cloud images classification method based on improved combined neural network; and Section 4 presents experimental results and some discussion. At the end of this paper, some remarking points are given in Section 5.
2. Related Work
2.1. Deep Feature Extraction Network
ResNet50 [20] and VGG16 [21] deep convolutional neural networks are introduced to obtain more deep features. ResNet50 is composed of multiple residual blocks, and each residual block added a direct connection channel. The residual learning algorithm can reduce the loss of information when the feature is propagated to the deeper network. VGG16 replaces a larger size convolution kernel by stacking multiple 3 × 3 size convolution kernels, which ensures that the network can learn more complex nonlinear mapping modes while obtaining the same receptive field.
2.2. ECA Attention Mechanism
The attention mechanism can redistribute the originally evenly allocated resources according to the importance of the objects. The contrast between different features is enhanced and useful features are more prominent. Many attention mechanisms such as MAT [22], IHSM&EFRM [23], CBAM [24], SE [25], and ECA [26] have been applied in various visual tasks. MAT module consists of a soft attention unit and an attention transition unit, which allows the transition of attentive motion features to enhance appearance learning at each convolution stage and enrich spatio-temporal object features. This module is of great value in video analysis tasks. IHSM&EFRM are used in the human–object interaction detection task, and they enhance the expression of human and object features, respectively. CBAM module includes channel and space dual attention, which improves the feature extraction ability of the network in multi-dimensions. SE module uses squeeze-and-excitation to learn the relationship among each channel and assign different weights to different channels. Though dimensionality reduction can reduce model complexity, it destroys the direct correspondence between channel and its weight. ECA module proposes a local cross-channel interaction strategy without dimensionality reduction based on the SE. This method can adaptively select the size of the 1D convolution kernel.
The ECA module is shown in Figure 2, where and represent input and output feature maps, and w, h, c represent their width, height, and channel dimensions, respectively. As shown in Equation (1), after using global average pooling (GAP) on the input feature map , a channel coding vector with a size of is obtained.
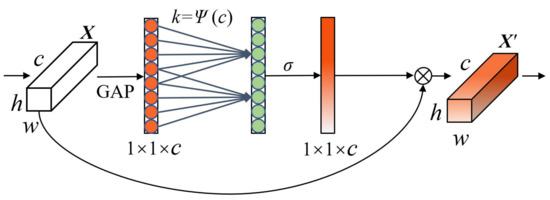
Figure 2.
ECA attention module.
As shown in Equation (3), where is a band weight matrix. The channel weight vector can be obtained after normalization by the (sigmoid) function. The k can be adaptively calculated according to
indicates the mapping relationship between c and k. indicates the nearest odd number. y and b are custom mapping parameters, here 2 and 1. The feature vector obtained after 1D convolution still maintains its original dimension.
2.3. Decision Fusion
Different networks have different classification probability for the same sample, which is embodied in the output vector of the network. When the output probabilities of each category are close to equal, it can be considered that the corresponding network hardly makes a positive judgment on the sample [27]. If multiple networks are used to make joint decisions, the probability of the sample being correctly classified will greatly increase, as shown in Figure 3.
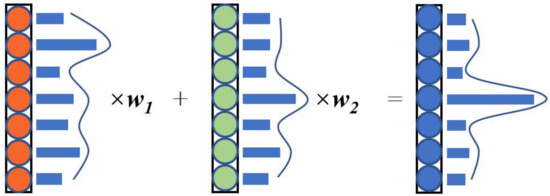
Figure 3.
Multiple network fusion decision. When the probabilities of different categories are nearly equal, use a smaller value to multiply the vector. Otherwise, use a larger value to multiply the vector.
3. Our Proposed Methods
The model consists of four parts, which are deep feature combined network, overlap pooling, improved ECA module, and decision fusion. The specific structure of the model is shown in Figure 4.
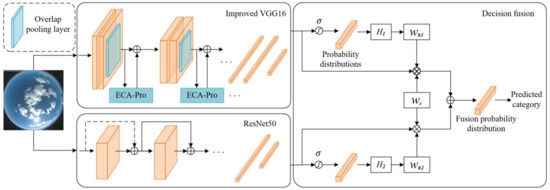
Figure 4.
Classification network model of ground-based cloud images.
3.1. Combined Network
The existing ground-based cloud images classification is usually based on a single channel network. However, there are limitations on performance of feature extract. At the same time, there is no such requirement as real-time for the classification of ground-based cloud images in PV power prediction. Therefore, in order to improve the classification accuracy, a combined network is used to improve the ability of the model for feature extraction. Here, ResNet50 and VGG16 networks are used to extract the depth and width feature of images. ResNet50 can extract more deep semantic features in ground-based cloud images because of its depth advantages. However, the network scales four times the width and height dimension of the first convolutional layer, resulting in the loss of some image features during subsequent convolutions. The first-stage convolutional layer of VGG16 can perform feature extraction at the input dimension, so the feature extraction advantage on the width and height dimension is more obvious.
In our experiments, we found that the results of ResNet50 tend to be stable when training on a dataset with less data, while VGG16 undergoes overfitting, which degrades the accuracy. Such results are unfavorable for decision fusion, and the decision fusion algorithm can only perform its best when the performance between sub-networks is close to the same. In this regard, we improve the pooling layer structure and the ECA-Pro module to ensure that the accuracy of VGG16 will not be degraded.
3.2. Overlap Pooling
Most of the clouds in the ground-based cloud images are grayish-white, and the background sky shows a uniform blue color. This results in a high degree of similarity between adjacent pixels of the image. This similarity leads to a higher information redundancy in ground-based cloud images compared to other images and also makes the VGG16 network more prone to overfitting. The network parameter quantity and overfitting caused by the image information redundancy can be reduced through the feature map pooling. However, the 2 × 2 pooling kernels cannot significantly improve the down-sampling quality of high-redundancy images.
As shown in Figure 5, a pooling kernel of size 3 × 3 is used instead of the original pooling kernel. The redundancy of features can be eliminated while the common features of adjacent receptive fields will be extracted. The pooling step is set to 2, which makes the pooling kernels overlap each other and adjacent receptive fields overlap each other as well. At the same time, the feature correlation and the overfitting suppression ability of the network are promoted.
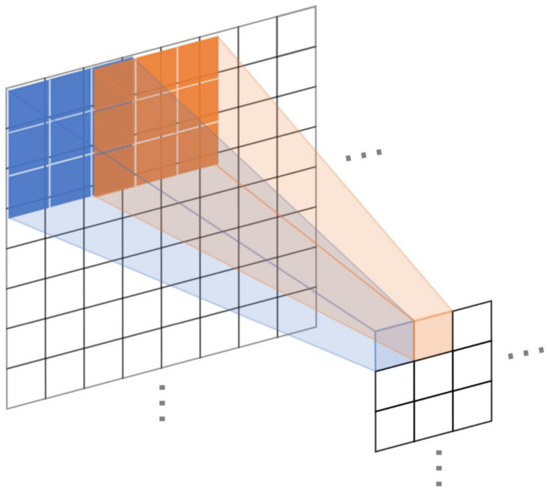
Figure 5.
3 × 3 overlap pooling kernel.
3.3. Improved ECA
Referring to the ground-based cloud image sample in Figure 1, due to the all-sky imager being utilized to acquire the image, only the inscribed circular part of the image is the effective area, and the surrounding four corners are invalid black pixels. Therefore, although GAP has strong noise suppression capabilities, it still does not work well for the special images. To avoid the above-mentioned problems, global max pooling (GMP) is used to prevent the introduction of invalid parts in the feature calculation, which improves the ability of channel feature extraction to a certain extent. The GMP is shown in Equation (5)
Like global average pooling, the vector is multiplied by the band weight matrix . The output obtained is the channel weight vector
Then, the ECA attention module is spliced with the pooling layer, GAP and GMP are employed to jointly extract the global features of . It should be noted that GAP and GMP are used here in parallel to aggregate the spatial information of the two feature maps. If GAP is executed before GMP, then after the GMP operation, all the values less than the maximum value in the feature map will be discarded, and this is the useful information processed by GAP.
where represents the output of the entire attention module.
In the ECA module, there are two combinations of GAP and GMP. As illustrated in Figure 6a,b, we named them the weight sharing method (ECA-WS) and the weight independent method (ECA-WI), respectively.
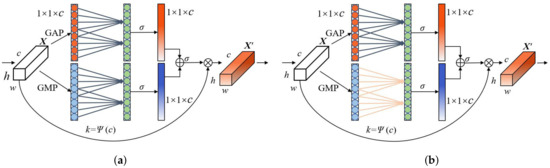
Figure 6.
Improved ECA. (a) GAP share weights with GMP (ECA-WS); (b) GAP and GMP weight independent (ECA-WI).
In ECA-WS, GMP uses the same band weight matrix with GAP, that is, . It hardly increases the parameters of the ECA module but improves the feature extraction capability of the module. In ECA-WI, GMP uses the different band weight matrix with GAP, that is, . However, this method not only increases the network parameters but also reduces the correlation between the two global pooling. This may lead to the instability of the combined network performance, which is also proved by comparative experiments. Therefore, ECA-WS attention mechanism is used to improve the characterization ability of the channel characteristics of the VGG16 sub-network after each stage of pooling.
3.4. Decision Fusion
Considering the significant effects of fusion of multiple networks on the improvement of classification performance, a weighted algorithm is introduced to fuse the output results of the two sub-networks.
Details of the algorithm are shown as follows,
first, the function is used to normalize each network output values. Where indicates the output vector of the i-th sub-network.
The normalized probability distribution is expressed as
where is the probability vector output by the network, is the value of the m-th category, and n indicates the number of cloud image categories.
The output probability matrix of the transformed combined network is expressed as
Subsequently, the information entropy of the probability distribution of each network output is
The greater information entropy, the greater uncertainty of the network prediction results and the higher probability of being misdiagnosed. Therefore, a lower weight should be assigned. The weight of sub-network is given as follows
The weight of each category according to the number of samples of different categories is defined as follows
where represents the number of samples in the m-th category and represents the total number of samples.
Multiply the sub-network weight and category weight with the original output vector . The weighted matrix of the combined network is written as
Add in rows,
Take the maximum index of the column to be the final classification decision result,
4. Result and Discussion
4.1. Dataset for Classification
The NRELCD and the MGCD dataset are used to prove the effectiveness of the method in this paper. The NRELCD dataset comes from the historical ground-based cloud images published by the National Renewable Energy Laboratory (NREL) in the United States. The image size is 1024 × 1024 pixels and the collection period is from 2018 to 2020. We screened 15,450 images with distinct category characteristics and analyzed the effect of each category on solar radiation attenuation to produce a dataset specific to the PV power sector.
The amount of solar radiation received by the PV panels is a direct factor affecting the power generated by PV. According to the method described in the literature [28], we collected the all-day radiation for days when there was only one cloud genus in the sky and also for the nearest cloudless day to that day. As shown in Figure 7, the two data are compared to see the effect of each cloud category on the solar radiation attenuation. Nearly similar cloud types are combined according to the degree of attenuation of solar radiation by each type of clouds. Cloud categorization is not as clear as other categorization tasks. Clouds are sometimes in a transitional state and their classification is highly controversial. We did not use those transition state cloud images as part of the dataset but instead forced them to be classified in a practical application using a trained classifier. Since the cloud images in the NRELCD have continuity in time, the adjacent images are relatively similar. Random distribution of the dataset to the training set and the test set will cause the accuracy to be high, which is not in line with the actual situation. Therefore, the first 70% of the dataset is used as the training set and the rest as the test set according to the acquisition time.
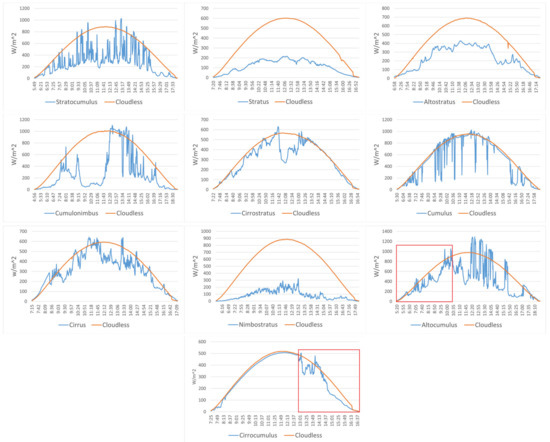
Figure 7.
Effect of different cloud genera on solar radiation attenuation. Altocumulus and Cirrocumulus are infrequent, we have boxed the time of occurrence in red.
Different categories of clouds have different probabilities of occurring in different regions. In order to adapt the power prediction to the real environment, there are different cloud classification criteria. We try to test the classification ability of the model under different cloud classification criterias with two datasets with different categories. The MGCD dataset [7] also includes 7 categories, with a total of 8000 ground-based cloud images, each of which corresponds to 4 modals of weather data. The data format of cloud images is JPEG, and the size is 1024 × 1024 pixels. The training set and the test set contain 4000 cloud image samples, respectively. We only use cloud image samples in the dataset for experiments. Mixed clouds in the MGCD dataset are composed of multiple categories of clouds. Objectively speaking, these combinations have different effects on solar radiation, so putting mixed clouds into one category is not reasonable in practice, but this classification criterion is informative for testing model performance. Table 1 shows the number of samples in each dataset, while Figure 8 and Figure 9, respectively, listed the cloud samples of the two datasets.

Table 1.
Ground-based cloud images dataset.
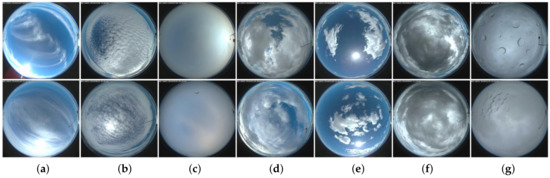
Figure 8.
NRELCD dataset. (a) Ci and Cs; (b) Ac and Cc; (c) As and St; (d) Sc; (e) Cu; (f) Cb; (g) Ns. Considering that there are extremely high structural similarities between certain types of clouds, this will make their impact on PV power generation very similar or almost the same. Some changes are made to the International Meteorological Organization’s cloud classification standards. The main work is to combine the original cirrus and cirrostratus, altocumulus and cirrocumulus, and altostratus and stratus.
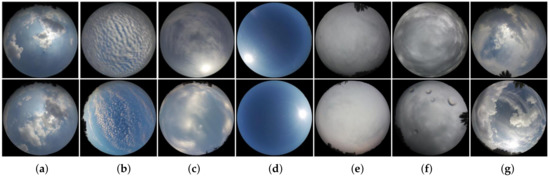
Figure 9.
MGCD dataset. (a) Cu; (b) Ac and Cc; (c) Ci and Cs; (d) clear sky; (e) Sc, St and As; (f) Cb and Ns; (g) mixed. This dataset combines altocumulus and cirrocumulus, cirrocumulus and cirrostratus, stratocumulus and stratus and altostratus, and cumulonimbus and nimbostratus, respectively.
4.2. Experimental Setup
In the experiment, the Ubuntu 18.04 operating system with 128 G of running memory and an RTX3090 graphics card with 24 G of video memory are implemented. The deep learning framework is Pytorch1.7.1, and the CUDA version is 11.1.
Data augmentation on the cloud images were performed to increase the noise of the dataset and the robustness of the model. The operations included (1) random horizontal flip, (2) vertical flip, (3) grayscale with a probability of 50%, (4) random rotation of 45°, and (5) random change of brightness, contrast, saturation, and hue. The input cloud images’ size was adjusted to 224 × 224 pixels, and transfer learning was used to train these cloud images. The learning rate of two sub-networks is fixed to 0.000001, and the Adam optimizer is used to optimize the gradient operation. The batch size of training and testing are both set to 50. The epoch of the NRELCD dataset was set to 200, and the epoch of the MGCD dataset was set to 100.
4.3. Ablation Experiment
Ablation experiments are used to compare several improved methods proposed in this paper. The results are listed in Table 2. Where CN is combined network, OP is overlap pooling, ICN is improved combined network we proposed, CC is the number of correct classifications, P is average accuracy, R is average recall, F1 is average F1-score, Acc is overall classification accuracy, and K (Kappa) is consistency index.
Table 2.
Ablation experiment.
Table 2 illustrates the performance of the model at various stages from the basic structure to the final structure. In the ICN model, accuracy of the MGCD dataset is increased by 2.03% and 2.88%, respectively, compared with the sub-networks ResNet50 and VGG16, while the accuracy of the NRELCD dataset is increased by 1.56% and 1.45%, respectively. Figure 10 is the accuracy curve of the model on different datasets as the epoch increases. As shown in Figure 9a, VGG16 produces overfitting in training on MGCD dataset. At this time, the parameters of the ResNet50 are still being further optimized. The overfitting phenomenon is suppressed effectively on improved VGG16(VGG16 + OP + ECA-WS), and the parameter optimization of the two sub-networks is close to synchronization, which provides a good prerequisite for decision fusion. As illustrated in Figure 10b, improved VGG16 is better than VGG16 in performance on the NRELCD dataset with a larger scale. The optimization process of the two sub-networks is also almost synchronized in time.
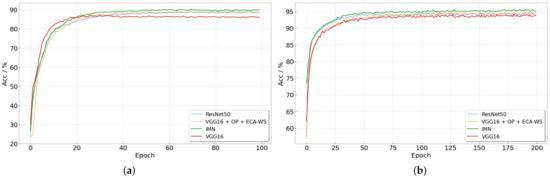
Figure 10.
Experimental results of different datasets. (a) Accuracy of MGCD, (b) accuracy of NRELCD.
4.4. Overlap Pooling Experiment
To verify the effect of overlap pooling, the pooling kernels in the VGG16 were changed to , , , and .
In Figure 11, it can be seen that the overlap pooling kernel has the highest accuracy on the two datasets. The main reason is that the overlap pooling kernel has a greater ability to eliminate the redundancy of image feature information than the pooling kernel while retaining useful information. At the same time, a larger kernel may reduce information redundancy while causing more useful information to be lost in the pooling process, thereby affecting the overall performance of the network.
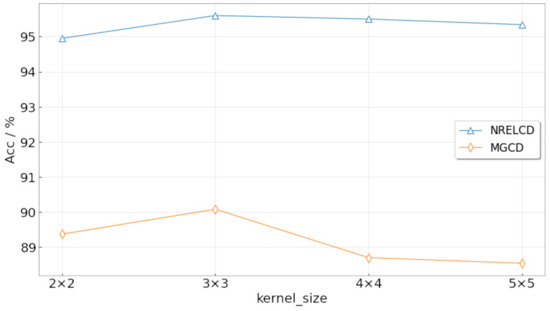
Figure 11.
Variation of classification accuracy with respect to the kernel size.
4.5. Attention Mechanism Experiment
To verify the role of the attention mechanism, GRAD-CAM [29] is used to visualize the VGG16, VGG16 and ECA, and VGG16 and ECA-WS. A piece of ground-based cloud image is randomly selected from different categories. The results are shown in Figure 12 and Figure 13. Network’s attention to the cloud area can be increased significantly by embedding the ECA attention mechanism into the VGG16 network. However, sometimes it can only focus on part of the cloud or focus part of the attention on the sky background. The ECA-WS attention mechanism we proposed can focus attention on image areas with more inter-class differences, which improves the classification ability of the network.
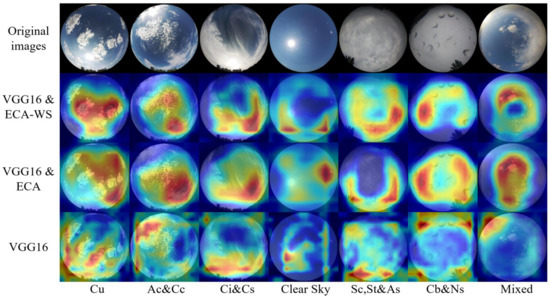
Figure 12.
MGCD category heat maps.
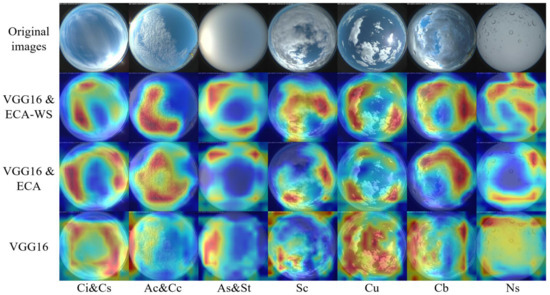
Figure 13.
NRELCD category heat maps.
Different attention mechanisms are used for comparative experiments, and the results are listed in Table 3, where backbone is combined network with improved pooling layer. CBAM module, SE module, ECA module, ECA-WI module, and ECA-WS module are introduced, respectively, based on backbone.
Table 3.
Comparative result of attention mechanisms.
In Table 3, the ECA-WS module has the best performance on improving the accuracy of network classification than other attention modules. However, the ECA-WI cannot improve the performance of the module and may even lead to a decrease.
4.6. Classification Method Experiment
From Table 4, the performance of method [4] based on texture or spectral feature on the two datasets is worse deep learning. Cloud images have more texture features and deep semantic features than other images, and only by acquiring more image features can we satisfy the classification needs of such images. In recent years, CNN has been widely used in ground-based cloud images classification tasks, thanks to its powerful feature extraction capabilities. Method [9] has shown good results on both datasets. Methods [7,11] fuse multimodal meteorological data and CNN, and achieved accuracy rates of 87.90% and 88.63%, respectively.
Table 4.
Comparative experiment of classification methods.
While good classification accuracy is achieved on other classic CNN models, the one that achieved the highest on our model had accuracy of the MGCD dataset that reached 90.08% and of the NREL dataset, it reached 95.60%. The combined network greatly optimizes the probability distribution of the classification output vector. By comparing with the latest algorithms and single network, the results show that the method in this paper has a greater improvement in classification accuracy, and it also proves the generalization ability of the method. For ground-based cloud images collected in different regions, the model has strong robustness, which will play a positive role in the field of PV power generation forecasting.
5. Conclusions
In this paper, a combined network-based ground-based cloud images classification method is proposed. Specifically, the ResNet50 and VGG16 networks are combined using decision fusion algorithm, which uses dual weights to weight the output of the sub-network. In addition, to optimize the parameters of the two sub-networks to approach synchronization, overlap pooling is used to replace the original VGG16 pooling layer. At the same time, the ECA-WS module is embedded after the pooling layer to improve the cross-channel interaction capability of the network. We constructed the NRELCD dataset that meets the actual application scenarios and used the MGCD dataset to verify the advanced nature of the network model.
At present, our classification of clouds is only based on image features. In reality, there are many physical characteristics that can provide a basis for cloud classification, such as height, thickness, and speed. In the future, we will consider using these parameters in classification research to improve the performance of the model.
Author Contributions
All authors made significant contributions to the manuscript. W.Z. and T.C. conceived, designed, and performed the experiments, and wrote the paper; B.H. and C.B. collected data and performed the experiments; A.Y. analyzed the data and performed the experiments; L.C., M.T. and Y.Z. revised the paper and provided the background knowledge of cloud classification. All authors have read and agreed to the published version of the manuscript.
Funding
This research was funded by the Key Research and Development Project of Zhejiang Province, Grant Number 2021C04030, and the Public Project of Zhejiang Province, Grant Number LGG21F030004.
Institutional Review Board Statement
Not applicable.
Informed Consent Statement
Not applicable.
Data Availability Statement
The data collected in this study came from the National Renewable Energy Laboratory, available at https://midcdmz.nrel.gov/apps/sitehome.pl?site=BMS (accessed on 1 May 2021). The MGCD dataset can be obtained from (shuangliu.tjnu@gmail.com).
Acknowledgments
The all-sky cloud images in the NRELCD dataset were obtained by the National Renewable Energy Laboratory in the United States. The MGCD dataset used in the experiment was also allowed by Liu Shuang’s team. We would like to express our sincere thanks.
Conflicts of Interest
The authors declare no conflict of interest. The founding sponsors had no role in the design of the study; in the collection, analyses, or interpretation of data; in the writing of the manuscript, and in the decision to publish the results.
References
- Raza, M.Q.; Nadarajah, M.; Ekanayake, C. On recent advances in PV output power forecast. Sol. Energy 2016, 136, 125–144. [Google Scholar] [CrossRef]
- Akhter, M.N.; Mekhilef, S.; Mokhlis, H.; Shah, N.M. Review on forecasting of photovoltaic power generation based on machine learning and metaheuristic techniques. IET Renew. Power Gener. 2019, 13, 1009–1023. [Google Scholar] [CrossRef] [Green Version]
- Govender, P.; Sivakumar, V. Investigating diffuse irradiance variation under different cloud conditions in Durban, using k-means clustering. J. Energy South. Afr. 2019, 30, 22–32. [Google Scholar] [CrossRef]
- Heinle, A.; Macke, A.; Srivastav, A. Automatic cloud classification of whole sky images. Atmos. Meas. Tech. 2010, 3, 557–567. [Google Scholar] [CrossRef] [Green Version]
- Kazantzidis, A.; Tzoumanikas, P.; Bais, A.F.; Fotopoulos, S.; Economou, G. Cloud detection and classification with the use of whole-sky ground-based images. Atmos. Res. 2012, 113, 80–88. [Google Scholar] [CrossRef]
- Zhuo, W.; Cao, Z.; Xiao, Y. Cloud classification of ground-based images using texture–structure features. J. Atmos. Ocean. Technol. 2014, 31, 79–92. [Google Scholar] [CrossRef]
- Liu, S.; Duan, L.; Zhang, Z.; Cao, X. Hierarchical multimodal fusion for ground-based cloud classification in weather station networks. IEEE Access 2019, 7, 85688–85695. [Google Scholar] [CrossRef]
- Ye, L.; Cao, Z.; Xiao, Y.; Li, W. Ground-based cloud image categorization using deep convolutional visual features. In Proceedings of the 2015 IEEE International Conference on Image Processing (ICIP), Quebec City, QC, Canada, 27–30 September 2015; pp. 4808–4812. [Google Scholar]
- Zhang, J.; Liu, P.; Zhang, F.; Song, Q. CloudNet: Ground-based cloud classification with deep convolutional neural network. Geophys. Res. Lett. 2018, 45, 8665–8672. [Google Scholar] [CrossRef]
- Huertas-Tato, J.; Martín, A.; Camacho, D. Cloud type identification using data fusion and ensemble learning. In Proceedings of the Intelligent Data Engineering and Automated Learning (IDEAL), Guimaraes, Portugal, 4–6 November 2020; pp. 137–147. [Google Scholar]
- Liu, S.; Li, M.; Zhang, Z.; Xiao, B.; Durrani, T.S. Multi-evidence and multi-modal fusion network for ground-based cloud recognition. Remote Sens. 2020, 12, 464. [Google Scholar] [CrossRef] [Green Version]
- Liu, S.; Li, M.; Zhang, Z.; Xiao, C.; Durrani, T.S. Ground-Based Cloud Classification Using Task-Based Graph Convolutional Network. Geophys. Res. Lett. 2020, 47, e2020GL087338. [Google Scholar] [CrossRef]
- Jin, W.; Gong, F.; Zeng, X.; Fu, R. Classification of clouds in satellite imagery using adaptive fuzzy sparse representation. Sensors 2016, 16, 2153. [Google Scholar] [CrossRef] [PubMed] [Green Version]
- Kostornaya, A.A.; Saprykin, E.I.; Zakhvatov, M.G.; Tokareva, Y.V. A method of cloud detection from satellite data. Russ. Meteorol. Hydrol. 2017, 42, 753–758. [Google Scholar] [CrossRef]
- Christodoulou, C.I.; Michaelides, S.C.; Pattichis, C.S.; Kyriakou, K. Classification of satellite cloud imagery based on multi-feature texture analysis and neural networks. In Proceedings of the 2001 International Conference on Image Processing (ICIP), Thessaloniki, Greece, 7–10 October 2001; IEEE: Piscataway, NJ, USA; pp. 497–500. [Google Scholar]
- Chen, X.; Liu, L.; Gao, Y.; Zhang, X.; Xei, S. A Novel Classification Extension-Based Cloud Detection Method for Medium-Resolution Optical Images. Remote Sens. 2020, 12, 2365. [Google Scholar] [CrossRef]
- Luo, Q.; Zhou, Z.; Meng, Y.; Li, Q.; Li, M. Ground-based cloud-type recognition using manifold kernel sparse coding and dictionary learning. Adv. Meteorol. 2018, 2018, 9684206. [Google Scholar] [CrossRef]
- Kliangsuwan, T.; Heednacram, A. Feature extraction techniques for ground-based cloud type classification. Expert Syst. Appl. 2015, 42, 8294–8303. [Google Scholar] [CrossRef]
- Wang, Y.; Shi, C.; Wang, C.; Xiao, B. Ground-based cloud classification by learning stable local binary patterns. Atmos. Res. 2018, 207, 74–89. [Google Scholar] [CrossRef]
- He, K.; Zhang, X.; Ren, S.; Sun, J. Deep residual learning for image recognition. In Proceedings of the IEEE Conference on Computer Vision and Pattern Recognition (CVPR), Las Vegas, NV, USA, 26 June–1 July 2016; pp. 770–778. [Google Scholar]
- Simonyan, K.; Zisserman, A. Very deep convolutional networks for large-scale image recognition. In Proceedings of the International Conference on Learning Representations (ICLR), San Diego, CA, USA, 7–9 May 2015; pp. 1–14. [Google Scholar]
- Zhou, T.; Wang, S.; Zhou, Y.; Yao, Y.; Li, J.; Shao, L. Motion-attentive transition for zero-shot video object segmentation. In Proceedings of the AAAI Conference on Artificial Intelligence (AAAI), Hilton New York Midtown, NY, USA, 7–12 February 2020; pp. 13066–13073. [Google Scholar]
- Zhou, T.; Wang, W.; Qi, S.; Ling, H.; Shen, J. Cascaded human-object interaction recognition. In Proceedings of the IEEE/CVF Conference on Computer Vision and Pattern Recognition (CVPR), Seattle, WA, USA, 14–19 June 2020; pp. 4263–4272. [Google Scholar]
- Woo, S.; Park, J.; Lee, J.Y.; Kweon, I.S. Cbam: Convolutional block attention module. In Proceedings of the European Conference on Computer Vision (ECCV), Munich, Germany, 8–14 September 2018; pp. 3–19. [Google Scholar]
- Hu, J.; Shen, L.; Sun, G. Squeeze-and-excitation networks. In Proceedings of the IEEE Conference on Computer Vision and Pattern Recognition (CVPR), Salt Lake City, UT, USA, 18–22 June 2018; pp. 7132–7141. [Google Scholar]
- Wang, Q.; Wu, B.; Zhu, P.; Li, P.; Zuo, W.; Hu, Q. ECA-Net: Efficient channel attention for deep convolutional neural networks. In Proceedings of the IEEE Conference on Computer Vision and Pattern Recognition (CVPR), Seattle, WA, USA, 14–19 June 2020; pp. 1–12. [Google Scholar]
- Chen, W.; Liu, W.; Li, K.; Wang, P.; Zhu, H.; Zhang, Y.; Hang, C. Rail crack recognition based on adaptive weighting multi-classifier fusion decision. Measurement 2018, 123, 102–114. [Google Scholar] [CrossRef]
- Matuszko, D. Influence of the extent and genera of cloud cover on solar radiation intensity. Int. J. Climatol. 2012, 32, 2403–2414. [Google Scholar] [CrossRef]
- Selvaraju, R.R.; Cogswell, M.; Das, A.; Vedantam, A.; Parikh, D.; Batra, D. Grad-cam: Visual explanations from deep networks via gradient-based localization. In Proceedings of the IEEE International Conference on Computer Vision (ICCV), Venice, Italy, 22–29 October 2017; pp. 618–626. [Google Scholar]
Publisher’s Note: MDPI stays neutral with regard to jurisdictional claims in published maps and institutional affiliations. |
© 2022 by the authors. Licensee MDPI, Basel, Switzerland. This article is an open access article distributed under the terms and conditions of the Creative Commons Attribution (CC BY) license (https://creativecommons.org/licenses/by/4.0/).