Article

Analytical Model for Enhancing the Adoptability of Continuous Descent Approach at Airports

1
Saab AB, Surveillance Business Area, Riyadh 11322, Saudi Arabia
2
Department of Mechanical and Industrial Engineering, Newark College of Engineering, New Jersey Institute of Technology, Newark, NJ 07102, USA
3
David D. Reh School of Business, Clarkson University, Potsdam, NY 13699, USA
4
Department of Information Systems, Faculty of Computing and Information Technology, King Abdulaziz University, Jeddah 21589, Saudi Arabia
*
Author to whom correspondence should be addressed.
Appl. Sci. 2022, 12(3), 1506; https://doi.org/10.3390/app12031506
Submission received: 31 December 2021 / Revised: 23 January 2022 / Accepted: 26 January 2022 / Published: 30 January 2022
(This article belongs to the Special Issue Future Transportation)

Abstract

:

Featured Application

We present an analytical model, using a queueing theory framework, that identifies periods of time for air traffic controllers when they can permit the vast majority of approaching aircrafts to land using Continuous Descent Approach, thereby reducing noise, fuel consumption, and pollution, while enhancing air transportation sustainability.

Abstract

Continuous Descent Approach (CDA) is the flight technique for aircraft to continuously descend from cruise altitude with an idle thrust setting and without level-offs, contrary to the staircase-like Step-down Descent Approach (SDA). Important for air transportation sustainability, using CDA reduces noise, fuel consumption, and pollution. Nevertheless, CDA has been limited to low traffic levels at airports, often at night, because it requires more separation distance between aircraft arrivals and, thus, could decrease throughput. Insufficient attention has been given to helping air traffic controllers decide when CDA may be used. In this paper, we calculate the probability that an aircraft arriving during a particular brief period of time (e.g., 15 min) will need to revert to SDA when the controller tentatively plans to permit CDA for all aircrafts arriving during that time period. If this probability is low enough, the controller may plan to permit CDA during that time period. We utilize an analytical approach and queueing theory framework that considers factors such traffic and weather conditions to estimate the probability. We also provide the number of aircrafts that can be accommodated within the airport’s stacking space using CDA. This number provides insight into whether a particular aircraft may use CDA.

1. Introduction

The air transportation and aviation industry face several challenges due to projected increases in demand for air travel and freight accompanying limited airspace congestion and airport capacity. The International Air Transport Association expects 7.2 billion passengers to travel in 2035, almost doubling the 3.8 billion air travelers in 2016, with the U.S. as the second-fastest-growing market, after China, with 484 million additional passengers per year forecasted for a total of 1.1 billion passengers [1]. With increased pressure on the infrastructure of terminals, runways, airspace around airports, and air traffic control operations, the industry is struggling to cope with this demand, yet it has to limit the harm that aircrafts cause to the environment through carbon emissions and noise levels.
With regard to aircraft emissions, the U.S. Environmental Protection Agency finalized its determination that greenhouse gas emissions from certain types of aircraft engines, primarily engines used on large commercial jets, contribute to the pollution that causes climate change and endangers Americans’ health and the environment [2]. Other countries are taking strict measures to limit emissions from aviation operations at airports by setting penalties for emissions levels above a specified limit. Under the European Union Emission and Trading System, all airlines operating in Europe, European and non-European alike, are required to monitor, report, and verify their emissions and to surrender allowances against those emissions that exceed certain levels from their flights per year [3]. Aircraft noise, on the other hand, is the biggest concern for airport officials at 29 of the 50 busiest U.S. airports [4]. Airports’ support personnel who work in proximity to aircrafts idling on the ground or taking off and landing may suffer hearing loss. Residents of communities surrounding airports suffer sleep disorders and interference with speech, both of which may lead to reduced productivity in learning and work. Furthermore, recent studies have linked noise to non-auditory health effects, such as hypertension, heart disease, and stroke [5]. These issues represent critical challenges to air transportation and aviation industry sustainability, development, and prosperity.
The Continuous Descent Approach (CDA), also known as Optimized Profile Descent (OPD), is an advanced flight technique for aircrafts to descend continuously from cruising altitude to the Final Approach Fix (FAF) or touchdown without level-offs and with an idle, or near idle, thrust setting. Descending using the CDA procedure, an aircraft can stay as high as possible for a longer time than with a conventional descent, thereby expanding the vertical distance between the aircraft’s sources of noise and the ground and thus, significantly reducing the noise levels for populated areas near airports. Furthermore, by descending with an idle, or near idle, engine setting, fuel burn is decreased, resulting in the reduction of fuel consumption and harmful emissions to the environment. A study that conducted flight trials of CDA at Kentucky’s Louisville International Airport using an aircraft fleet of the United Parcel Service (UPS), an express package delivery company, quantified the benefits of CDA in terms of fuel savings by 400 lb. to 500 lb. per flight and noise level by 3.9 A-weighted decibels (dBA) [6]. Another study conducted at San Francisco International Airport estimated a reduction of CO2 emissions of between 700 lb. and 10,000 lb. per flight with CDA flights [7]. To cut down on aircraft emissions, airplane manufacturer Airbus recently has been working on unique ways used by birds and emerging concepts like tandem flying that could reduce fuel burn by up to 10% [8]. When compared with the widely used Step-down Descent Approach (SDA), in which the arrival aircraft descends in a step-like fashion, CDA reduces flight time by around two minutes [9]. FedEx, another express transport and delivery company with one of the largest civil aircraft fleets in the world, has been using CDA at their World Hub, Memphis International Airport. Their use of CDA at Memphis reduced flight time by 2.5 min for each flight, and this translated into cost savings of $105 million based on their field study from 2006 to 2009 [10].
These operational, economical, and environmental benefits from CDA procedures have made it a cornerstone in some aviation modernization programs at the national (e.g., FAA’s Next Generation Air Transportation System, “NextGen”), continental (e.g., EU’s Single European Sky Air Traffic Management Research, “SESAR”), and international (e.g., United Nations’ International Civil Aviation Organization, “ICAO”, Continuous Descent Operations, “CDO”, initiative) levels. Although considered as an effective Noise Abatement Procedure, CDA is not widely implemented, especially during high density operations [11,12]. Due to safety considerations [13,14,15], CDA procedures may require more separation between aircraft arrivals, which may affect the airport arrival rate and runway throughput [16,17]. The larger separation spacing for a CDA aircraft is mainly due to two reasons: the difficulty for air traffic controllers to predict the future position of an aircraft with significantly variable speed [6] and the inability of the pilot to quickly decelerate during descent [18]. Although CDA has been proven to be feasible and without increasing the required spacing between aircraft under light traffic conditions, such as night-time operations [6], aircrafts flying CDA are most likely to be spaced further apart under heavy traffic conditions.
Thus, CDA implementation has been limited to low to moderate traffic levels. During these low traffic conditions, CDA has been used at more airports. To increase the use of CDA, several studies in the literature have used various approaches, such as simulation [19], mathematical modeling [15,20], and flight trials [6,14], to quantify CDA’s benefits and/or suggest solutions to the problem of increasing CDA’s usage at airports through the analysis of sequencing and merging [21], merging and spacing [18], scheduling and conflict detection and resolution [16], time and aircraft energy management during descent [22], fuel and flight-path management [23,24], and ground-to-air air traffic network vulnerability [25]. Other literature has applied quantitative methods to improve aircraft operation [26,27]. However, insufficient attention has been given to developing a quantitative measure to enable air traffic controllers to make informed decisions on safely accepting more CDA operations.
The contribution of this work is the development of a model that addresses this gap in CDA research and that helps air traffic controllers determine brief periods of time (e.g., 15-min periods) in which the vast majority of arriving flights may land using CDA. These time periods are based on time of aircraft arrival into the TMA. An aircraft entering the TMA during one of those time periods may begin its continuous descent upon entering the TMA while completing its continuous descent during a later time period, in which then-arriving aircrafts are no longer using CDA. In fact, although the time to descend using CDA depends on several factors (e.g., aircraft weight), it may be longer than 15 min. Data from previous authors [28,29] implies the time to descend using CDA may be 20–30 min.
Special attention is dedicated to factors that have a significant impact on CDA implementation, such as airspace structure around airports, airport arrival rate, and distance requirements for longitudinal separation between approaching aircrafts. Analyzing airspace structure around an airport offers a systematic way of developing an analytical model that adequately captures the elements associated with descent and approach procedures.
In particular, we calculate the probability that an aircraft arriving during a particular brief period of time will need to revert to SDA under the initial modeling assumption that the controller will permit CDA for all aircraft arrivals during that period. If this calculated probability is low enough, the controller may be comfortable in planning to permit CDA for all arriving aircrafts during that time period, and otherwise, they will not permit any of them to use CDA. Our model utilizes an analytical approach and queueing theory framework that considers factors such traffic and weather conditions to estimate the probability. The non-queueing portion of our modelling provides the number of aircrafts that can be accommodated within the airport’s stacking space when CDA is used for all aircrafts arriving during the time period. This number provides insight to the controller on whether to permit a particular aircraft to use CDA during the period when all (or nearly all) arriving aircrafts will be permitted to descend with CDA (due to the low probability an aircraft will need to use SDA instead). Through the use of this modeling, it is our hope that CDA will be used more often and, thus, reduce noise, fuel consumption, harmful emissions and, thus, provide greener and more sustainable air transportation operations. This paper should draw attention to the opportunity to systematically increase the use of CDA for aviation green operations and air transportation sustainability.
The paper is organized as follows. Section 2 describes the airspace around airports with respect to the terminal maneuvering area and describes descent and approach operations. In particular, two approach operations (CDA and SDA) are discussed and compared. In Section 3, we present the adoptability of CDA and the factors that impact aircraft landing time; the Base of Aircraft Data (BADA) Aircraft Performance Calculation (APC) is estimated and validated against actual landing times of flights operated at Nashville International Airport (BNA). Section 4 presents a background on the queuing theory and the main assumptions and fundamental components used to develop our model, while Section 5 presents the concept of the probability of an aircraft being denied CDA entry as a key output of the queuing model. In Section 6, we illustrate the calculation of the model probabilities using standard industry data (e.g., separation distance requirements) and actual flight data from the BNA airport. Finally, Section 7 presents our main findings and conclusions.

2. Preliminaries and Process Description

We begin this section by describing the airspace around airports, then generally describe aircraft descent and approach operations at airports, and we conclude with a comparison between the two most-commonly used descent approaches: CDA and SDA.

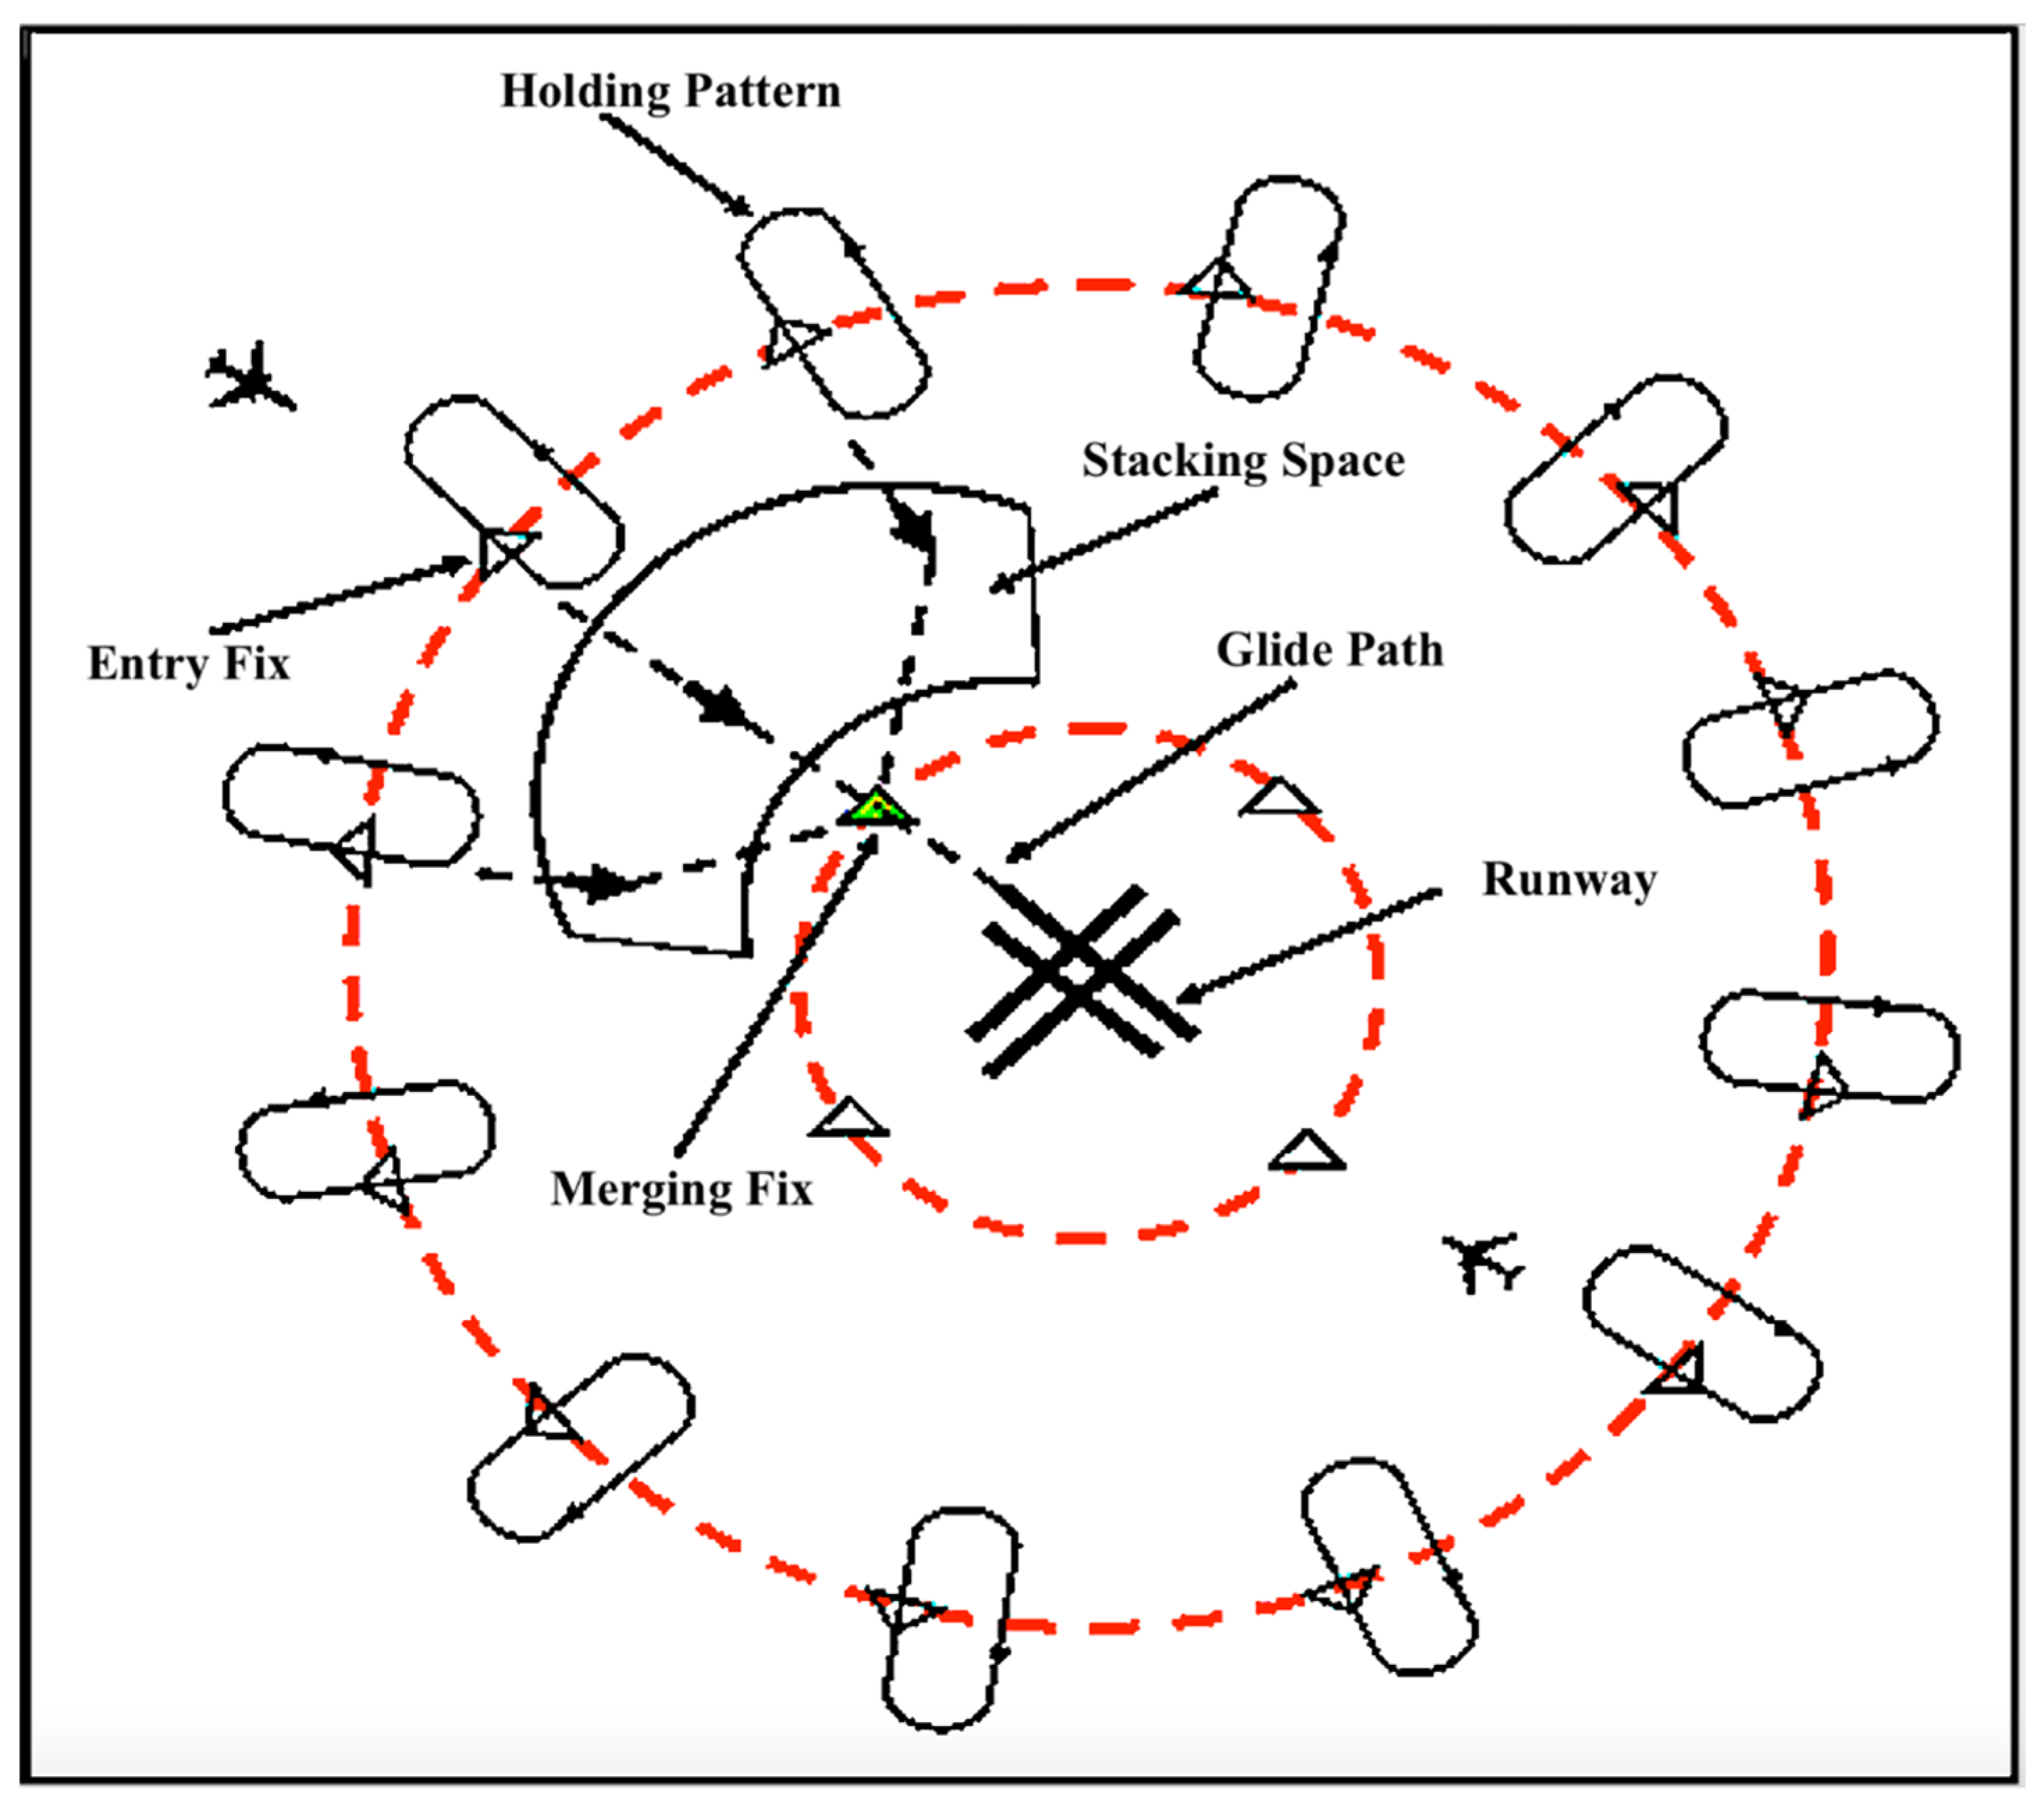
2.1. Structure of Airspace around Airports

Terminal Maneuvering Area (TMA). TMA refers to the designated area of airspace managed by air traffic control services around major airports that have high volumes of traffic. Normally, TMA airspace is designed in a cylindrical configuration, including all altitudes centered around the geographical coordinates of the airport. Geographical positions that define the boundaries of the TMA, known as entry fixes, are considered as entry points to the TMA (although each fix includes all altitudes and thus may be conceptualized as a line), and the arriving aircraft enters the TMA airspace via entry or arrival fixes. When crossing the TMA boundary over one of these entry fixes, the responsibility for the separating aircraft will be handed over usually from a controller at the air traffic control center responsible for separating the en route aircraft (e.g., Air Route Traffic Control Center “ARTCC”) to a controller at the air traffic control center responsible for separating the aircraft approaching an airport (e.g., Terminal Radar Approach Control “TRACON”). A simplified structure of a TMA is illustrated in Figure 1.
As an arriving aircraft nears an entry fix, the air traffic controller may clear the pilot for the approach or, depending on traffic congestion and the separation and sequencing method used, may place the aircraft in a holding pattern. While aircraft separation aims to have the controller apply and maintain the separation distance requirements between aircrafts for safety purposes, aircraft sequencing aims to have the controller organize a stream of aircrafts to provide an orderly sequence of continuous traffic flow towards the final approach path. In practice, there are a number of aircraft-sequencing methods for approach traffic management, but generally, all of them fall under two broad categories: procedural control (published procedures with altitude change and speed instructions) and radar vectoring (controller-generated instructions in terms of headings, altitude, and speeds to optimize traffic flow in order to maximize the number of aircrafts with the least average delay). Today, radar vectoring is one of the main methods to achieve efficient sequencing for aircrafts flying towards the final approach path.
Once an aircraft has been cleared by the controller to approach the airport or to leave a holding pattern, the aircraft approaches the merging fix. However, as the aircraft approaches the merging fix, it flies in the stacking space, the space that the controllers use from the available terminal airspace to stack arriving aircrafts, that is, orderly align aircraft arrivals for approach. In the stacking space, the controller manages air traffic and enhances airspace capacity by stacking arriving aircrafts using techniques such as minimal speed adjustments and path-stretching. This efficient management of air traffic flow enables the controller to bring together aircrafts that have crossed entry fixes from different directions to be stacked and merged at the merging fix. For instance, an aircraft may enter the TMA through one of about 12 entry fixes and then proceed to one of about four merger fixes as they get closer to the airport. The merging fix provides a transition for arriving aircrafts from the stacking space to approach, as it connects traffic from different directions into one merger fix to create one stream of aircraft arrivals to follow a standard published arrival procedure. This way, arrivals from several directions can be accommodated, and traffic flow is efficiently managed within a congested airspace. To safely merge arriving aircrafts, the controller synchronizes aircrafts based on joining window time on the air route leading to the merging fix considering sufficient spacing for other aircrafts to fit into the air traffic stream and while maintaining, at least, the minimum required separation between aircrafts.

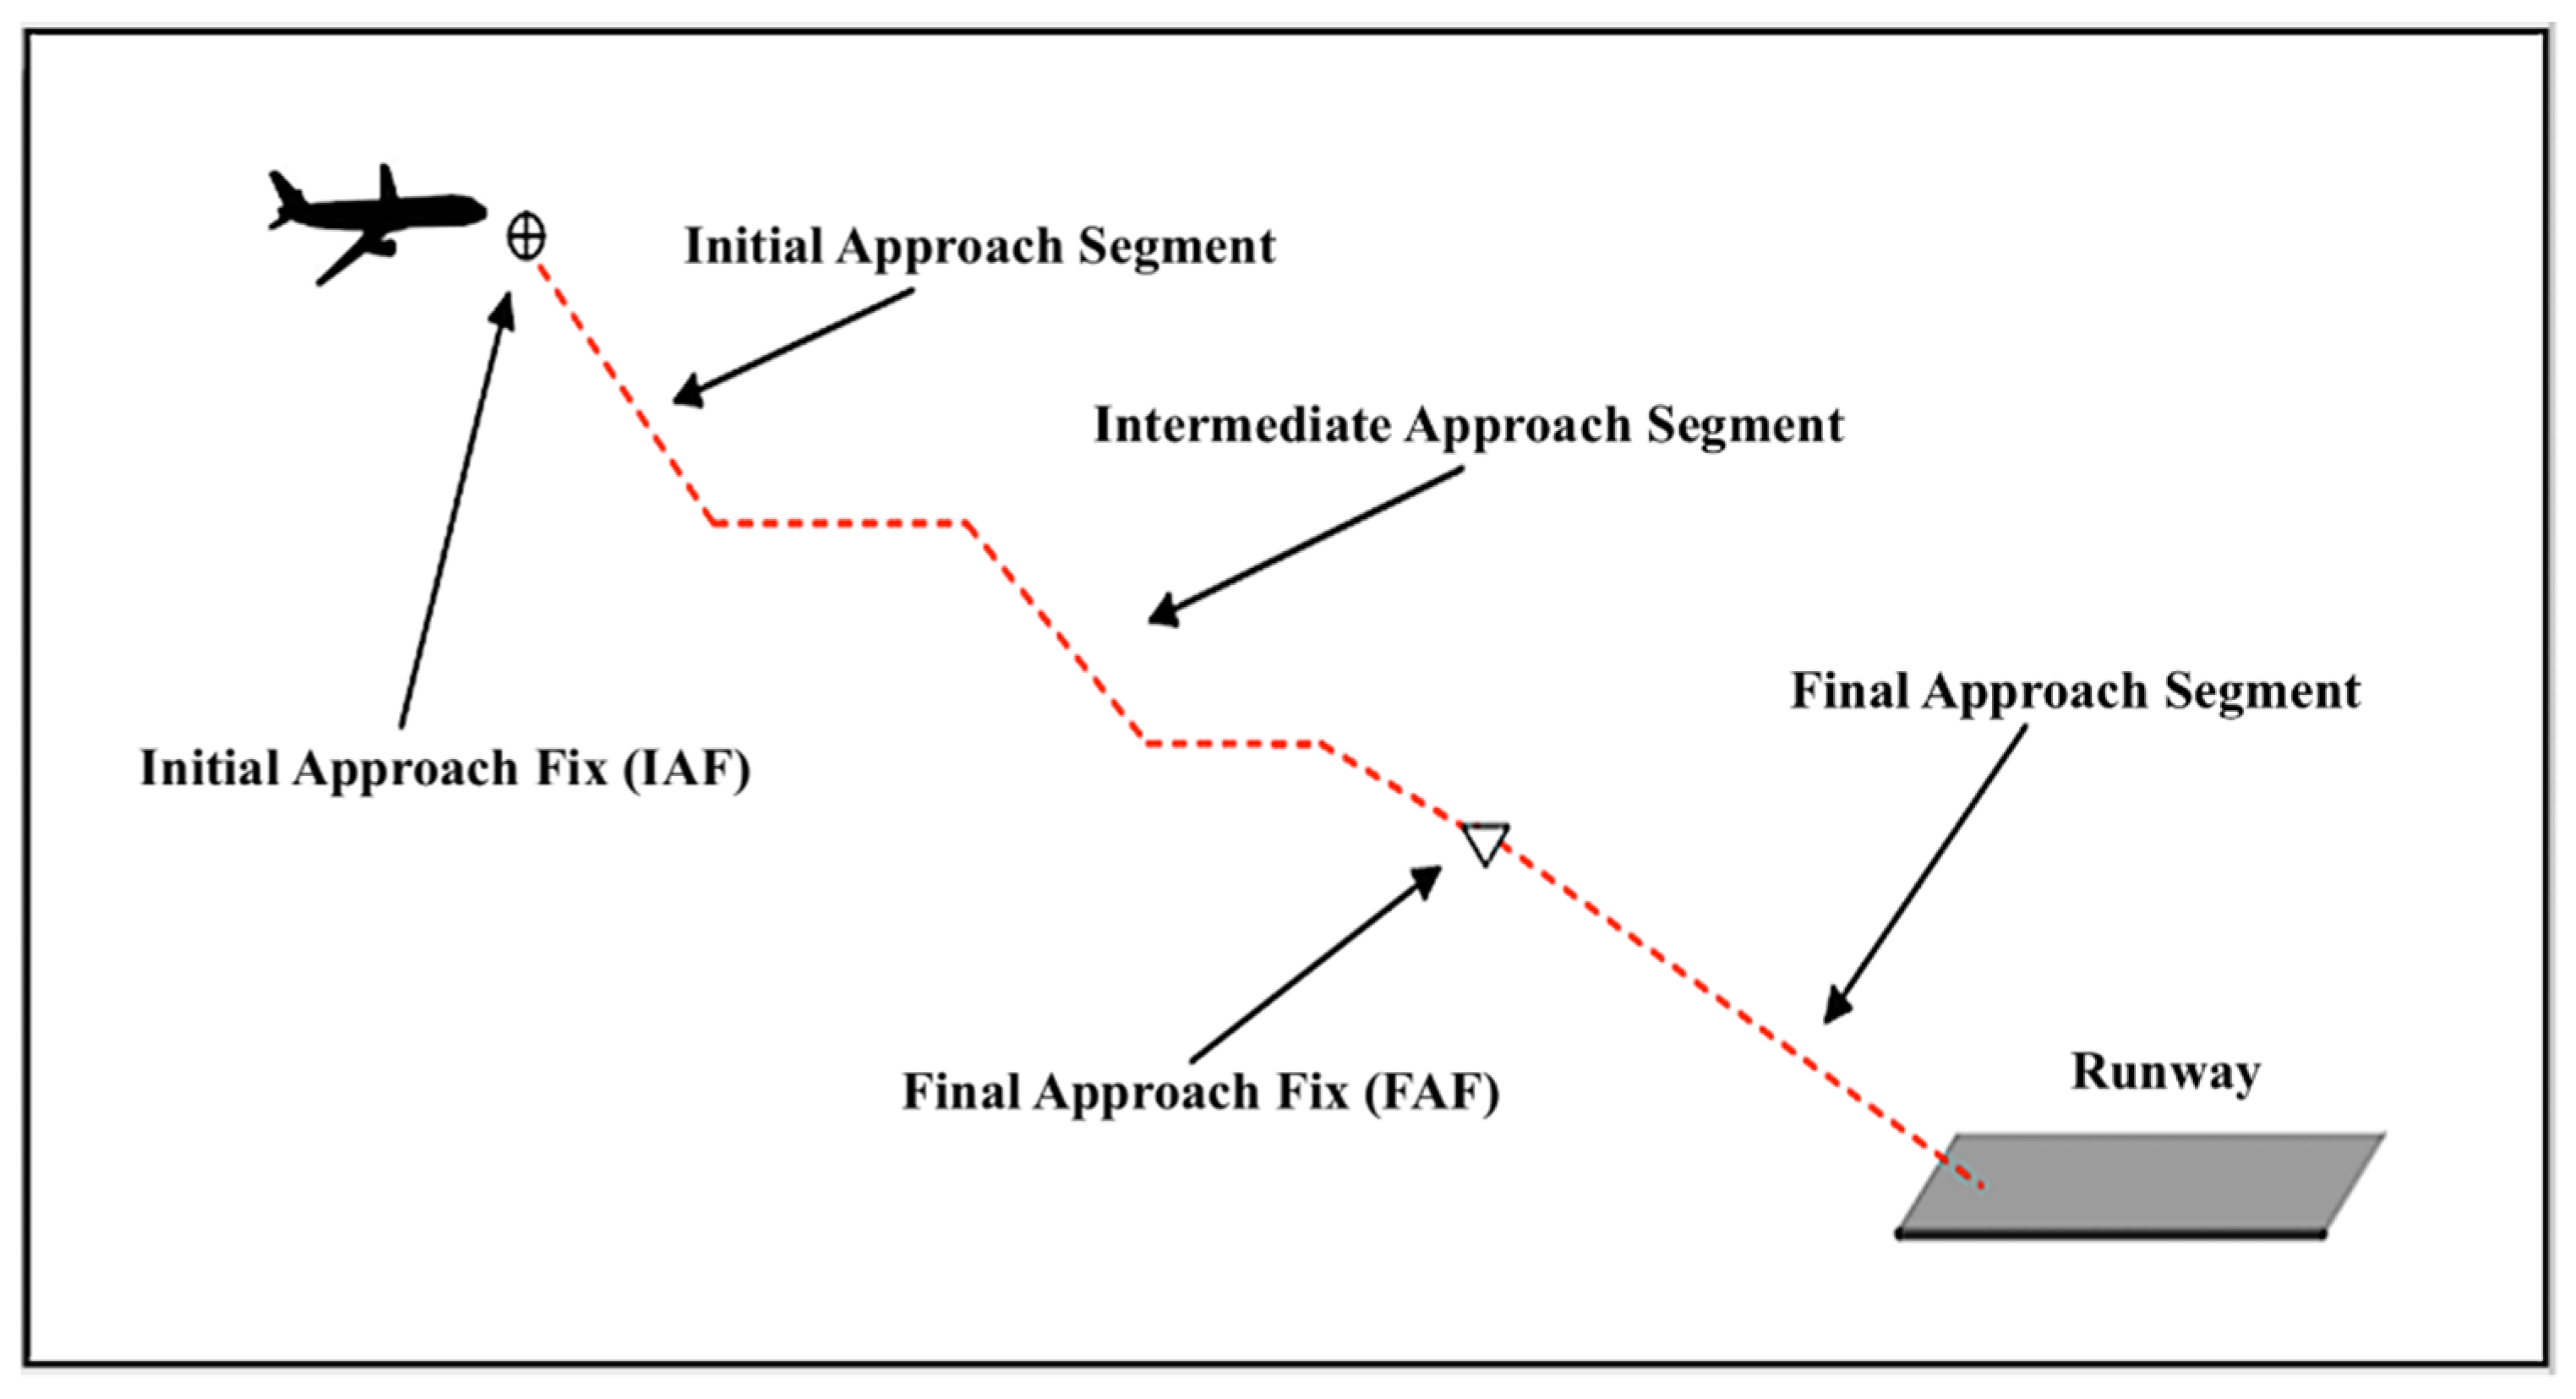
2.2. Description of the Aircraft Descent and Approach Process at Airports

In this subsection, we first describe the aircraft descent operations. Then, we present SDA and finally introduce CDA and compare it with SDA.

2.2.1. Descent and Approach Operations

Aircraft descent could be initiated to attain an optimal profile from the cruise altitude all the way down to landing to minimize fuel burn, emissions, and noise exposure. However, due to Air Traffic Control (ATC) restrictions and aircraft performance limitations, an optimal descent profile may not be attained all the time. For an aircraft operating at typical cruise altitudes, descent will normally initiate at 100 to 130 nautical miles (nmi) from the destination airport. This distance varies primarily due to ATC service restrictions, aircrafts’ equipment and performance capabilities, and weather conditions. The controller may issue crossing restrictions during the descent, as part of a Standard Terminal Arrival Route (STAR) or as a requirement for traffic sequencing. These crossing restrictions are generally issued to the cockpit crew in terms of altitude over a fix, and they may include a speed restriction as well [30].
A stabilized descent requires minimum control adjustments by the pilot in maintaining the planned descent path; more specifically, excessive corrections or control inputs indicate that the descent was improperly planned. Thus, planning the descent from cruise altitude is important because descending early results in more of the flight at a low altitude with increased fuel consumption and noise impacts, and starting the descent late results in problems with controlling both airspeed and descent rates later in the approach phase.
Prior to flight, pilots need to compute the fuel, time, and distance required to descend from the cruising altitude to the approach gate (an imaginary point used by the controller to provide headings (i.e., vectoring) for aircraft arrivals to the final approach course), with the objective of determining the most economical distance from the airport to begin descent. This distance is referred to as the Top of Descent (TOD) point. The computations for the TOD point could be done manually prior to flight or automatically during flight using the Flight Management System (FMS). Conversely, in flight prior to the descent, pilots plan the descent from cruise by reviewing and verifying landing weather to include winds in their consideration, since tempestuous weather at the landing airport can cause slower descents. Furthermore, pilots need to know the cruise altitude and approach gate altitude (otherwise known as the initial approach fix (IAF) altitude), descent rate, and ground speed during descent.
Based on aircraft performance, approach constraints, aircraft weight, and weather data (such as winds, temperature, and icing conditions), the vertical component of the flight plan, which referred to as the Vertical Navigation (VNAV), is computed. Usually, the VNAV approach is computed from the TOD point down to the waypoint at which the descent ends, which is generally the runway or the Missed Approach Point. There are only two types of VNAV paths that the FMS uses: the performance path or geometric path. The performance VNAV path is computed using an idle or near-idle thrust from the TOD point to the first constrained waypoint, which is constrained by speed and/or altitude and represents a typical CDA. The geometric VNAV path is computed from point-to-point between two constrained waypoints or when a vertical angle is assigned, which may represent a typical SDA, as it is shallower than the performance VNAV path and is typically using a non-idle thrust. Detailed descriptions of SDA and CDA are presented in the following subsections.

2.2.2. Step-Down Descent Approach (SDA)

In air navigation, if the aircraft flies under Instrument Flight Rules (IFR), which represents a set of rules governing the navigation of aircraft using instruments, then the instrument approach procedures (IAP) must be followed. The IAP consists of four approach segments along the aircraft flight path, namely the initial, intermediate, and final approach and, as a backup plan to use if needed, a segment for a missed approach. Typically, the initial approach segment starts at the en route (i.e., cruise) altitude from an IAF and ends when the aircraft joins the intermediate approach segment, where the later ends at the final approach fix (FAF).
SDA is the conventional arrival procedure that pilots and air traffic controllers have been accustomed to for many years. In SDA, an aircraft begins its initial descent at the TOD point and continues descending gradually in a series of steps along the descent path. This step-down descent occurs because the aircraft descends over a stair-like path from the current altitude to a new altitude, due to the controller instructions and/or airspace constraints. During the SDA, the aircraft gradually levels-off by transitioning from the initial to the intermediate to the final approach segments through predefined fixes that indicate the start and end of each approach segment. To fly from the fix that marks the end of the previous approach segment to the fix that marks the subsequent one, the aircraft must increase speed by employing thrust to maintain altitude [31]. Figure 2 illustrates the SDA profile and the approach segments of the IAP.
SDA also requires communication between the pilot and controller to inform and authorize air movement, which means more workload on both the aircrew and controller during a critical phase of flight that requires situational awareness and additional concentration. Once an aircraft has reached the fix or waypoint that marks the end of the previous approach segment and marks the subsequent one at the new altitude assigned by the controller, the pilot needs to utilize engine thrust to maintain altitude and prepare for further instructions from the controller with respect to approach. Air traffic may be expedited during periods of high demand at airports when using SDA through radar vectoring; however, the utilization of engine power increases fuel burn, which, in turn, increases emissions and noise levels at lower altitudes [31].

2.2.3. Comparison between CDA and SDA

In this subsection, we provide a comparison between CDA and SDA from an operational perspective.
Considering aircraft approach speed, if a pair of aircrafts are approaching an airport for landing heading for the same runway, both aircraft approach speeds may not be the same when CDA is used, even with the same aircraft type. This is due to the fact that during descent, pilots make efforts to stabilize their approaches by controlling and balancing several parameters such as rate of descent, approach speed, thrust, and the aircraft’s attitude. With CDA, landing is conducted with idle thrust as the aircraft approach speed decreases just before touchdown [32]. With SDA, the pilot utilizes thrust and adjusts speed more frequently along the descent path, and the aircraft approach speed increases just before touchdown. This comparison is illustrated in Figure 3 below. Table 1 highlights some of the differences between CDA and SDA operations.

3. CDA Adoptability and Aircraft Descent Times

This section introduces the factors that influence our model and then estimates and validates the time aircrafts take to land under CDA and SDA operations. The estimation and validation are essential for developing our model. In our model, we assume that during a given brief period of time, say 15 min or 30 min, for example, the air traffic controller will enable all arriving aircrafts to use CDA or not permit any aircrafts to use CDA. This assumption simplifies the controller’s duties and avoids the complexity associated with a significant number of aircrafts within the TMA using CDA and a significant number using SDA. That being said, it remains possible for the controller to plan on permitting all aircrafts arriving in the brief period of time to use CDA, if suggested by the model, and yet on a case-by-case basis, decide whether to deny CDA for a particular aircraft. The case-by-case basis analysis is beyond the scope of our queueing model, but it is considered by the maximum number of aircrafts that may reside in the stacking space at any given time, as we determine much further below.

3.1. Factors Impacting CDA Adoptability and Aircraft Descent Time

Before we present the details of our model [33], we briefly discuss the concept of acceptance, and rejection, in the context of landing operations at an airport and, particularly, with CDA operations. In general, our queueing model assumes that at a given airport, the air traffic controller will either accept all CDA requests from aircraft arrivals to approach and land using CDA over a specified brief time period, say 15 min, or reject them all. Before the queueing model details are calculated, we first calculate the CDA Adoptability Factor (CDA_AF). This factor is a function of λss, the average arrival rate of the aircraft that requests CDA at an airport (which our model assumes is all the aircrafts arriving at the TMA’s stacking space due to the advantages of continuous descent), and AAR, the Airport Arrival Rate, which is defined as the dynamic parameter that specifies the number of arriving aircrafts that an airport can accept during any consecutive 15-min period of time [34]. As shown from the equation below, CDA_AF represents the ratio of λss to AAR:
CDA _ AF = λ s s A A R
If the value of CDA_AF during the brief time period is high (e.g., over 100%), then there is no need to continue the analysis. It is obvious in that case that CDA will not be permitted during that time period. Conversely, if the value of CDA_AF is low (e.g., under 10%), then it is obvious that CDA will be permitted during the time period. The queueing calculations are performed only for those periods of time when the value of CDA_AF does not make it obvious whether or not CDA should be permitted during the time period.

Factors Impacting CDA Adoptability and Aircraft Descent Times

There are a number of factors that could impact the nature of aircraft arrivals at airports. Such factors could be operational, meteorological, planning, technological, or related to airspace structure and procedures design. We discussed some of these factors in Section 2 and discuss others briefly in the following subsections. Technology factors (e.g., the level of Air Traffic Management automation at an airport) are beyond the scope of this work. Other factors, however, such as traffic at neighboring airports and wind speed and direction, can be managed by reducing aircraft stacking space and increasing the minimum separation distance between aircrafts.
The Airport Arrival Rate (AAR) states the hourly capacity of airplane arrivals at an airport, and thus, it is critical to our model.
The aircraft fleet mix, or more generally fleet mix, refers to the ratio of various aircraft types that, based on wake turbulence categories, make up the total arrival traffic that operates at an airport. Fleet mix is essential in airport planning to determine the likely average landing speed and separation requirements on final approach, which are important factors that affect the AAR and, in turn, our model. Generally speaking, and from the perspective of runway capacity, which is defined as the expected number of landings that can be performed per hour on a runway, a relatively homogenous fleet mix, consisting of two dominant aircraft classes, is more favorable than a heterogeneous fleet mix.
The aircrafts’ separation requirements determine the maximum number of aircrafts that can navigate each part of the airspace or can use a runway system per unit of time. The separation requirements for an aircraft landing on the same runway specify the minimum separation in longitudinal distance, or time, that must always be maintained between two aircrafts operating consecutively on the runway. These requirements are also specified for every possible pair of classes and every possible sequence of movements [35]. Table 2 exhibits the ICAO’s minimum wake turbulence separation standards [36], and apparently, the larger the separation required, the lower the AAR. Furthermore, the more heterogeneous the fleet mix at an airport, the more influence there will be on AAR and our model. These separation distances are based upon SDA being used. If CDA is used, then the minimum separation distances are the same when the leading and trailing aircrafts are from the same weight turbulence category but longer than with SDA when the aircraft weight classes differ. Furthermore, the air traffic controller will be inclined to use longer minimum separation distances with CDA because of the greater challenge of controlling aircrafts using CDA.
Among the usually considered weather conditions at airports, such as cloud ceiling and visibility, wind speed and direction are the most influential conditions on ATM operations in general and on approach operations, in particular. The two components of the wind, headwinds and tailwinds, have a significant impact on AAR. In fact, wind speed and direction dictate the availability and orientation of runways at any given time. Adverse wind conditions can reduce AAR due to the increased complexity of merging arrival traffic streams and separating aircrafts as they descend and change heading under intense or varying winds. Specifically, winds aloft may result in a phenomenon called compression, in which the separation between pairs of arriving aircrafts decreases rapidly as they descend to the final approach [37]. The results from applying our model indicate it captures the effect of wind speed.
In general, airport and airspace constraints refer to limitations that hinder airport capacity by creating difficulties for arrival aircrafts, largely due to airspace consideration. Often, such constraints are contingent on the original airspace design, which gradually became less efficient due to increasing demand and fluctuating traffic patterns, or airspace redesign, which necessitates consideration of nearby restricted airspace. On the other hand, a restricted airspace, which is an area of airspace typically used by military operations, could be close to an airport and would impose a specific airspace design that affects the pattern of the arriving aircraft. Other airspace constraints include the topographical nature and terrain (e.g., an airport close to a mountainous terrain). Airspace constraints, collectively as a single factor, are beyond the scope of this work. While estimating the effect of this factor is beyond the scope of this work, our model’s behavior reflects its ability to capture such effect.
Growth in air traffic at airports within close geographical proximity likely will create congestion, especially if these airports are in a large, busy metropolitan area. The impact of air traffic at neighboring airports comes from systems of airports commonly referred to as metroplexes. Operationally, air traffic that flows into and out of airports within a metroplex airport system needs to be coordinated between airports in such systems to maintain efficient air traffic and individual airports’ throughput, while contributing little (if any) impact to the AAR of an airport over another in such a system [38,39] and, therefore, limiting or even preventing the use of our model. The FAA is having ongoing efforts to accommodate CDAs within metroplexes, with plans to deploy during a later phase of NextGen.

3.2. Estimation of Aircraft Descent Time

In this section, we estimate the time an aircraft takes to descend, starting from the TOD point at cruise altitude down to the runway, under CDA and SDA operations, using version 3.11 of Base of Aircraft Data’s (BADA) Aircraft Performance Model (APM) [40]. Estimating aircraft descent time under the two distinct approach operations is a fundamental step towards developing our model.
BADA is an APM developed and maintained by the European Organization for the Safety of Air Navigation, commonly known as EUROCONTROL, through active cooperation with aircraft manufacturers and operating airlines. To estimate aircraft landing time at airports using BADA, we used BADA’s web-based Calculation Tool, the Aircraft Performance Calculation (APC), to calculate aircraft performance for the descent phase of flight. Essentially, BADA’s application software provides access to an online implementation of BADA APM, which consists of a database of aircraft operational performance files and formulas derived from the Total-Energy Model that EUROCONTROL relied on to model aircraft performance in categories such as aircraft, aerodynamics (e.g., drag), and engine thrust [41], as follows:

3.2.1. Aircraft Velocity and Lift Model

For a straight-and-level flight at cruise altitude, the aircraft speed (velocity) is given by
V TAS = a o M c r u i s e T T o
where VTAS is aircraft’s true airspeed (TAS) in nautical miles per hour (knots), ao is the speed of sound at sea level in knots, Mcruise is the aircraft’s Mach number at cruise altitude, and T and To are the temperatures at cruise altitude and at sea level, respectively. The lift coefficient, CL, can be calculated using the classical formula for the lift force, L:
L = C L 1 2 ρ V 2 S
where ρ is the density of air in kilograms per meter cubic, V is the aircraft speed in meters per second, and S is the aircraft’s wing area in square meters.
In cruise flight, the lift force, L, in Newtons, may be assumed to be equal to the aircraft’s weight in kilograms, m. Combining this relationship with Equation (3) and rearranging terms results in
C L = 2 m g ρ V 2 S
where g is the acceleration due to the earth’s gravity. Assuming a no-wind scenario and that the flight path’s angle in degrees is γ, then the relationship between ground speed and true airspeed is given by
V ground = V TAS · cos γ

3.2.2. Drag Model

Drag is the aerodynamic force acting on an aircraft body in terms of air resistance to aircraft motion through air. Similarly, to the lift force, the aerodynamic drag, D, is the product of the dynamic pressure and drag coefficient, as follows:
D = C D 1 2 ρ V 2 S
The drag coefficient is given by the sum of zero-lift, CDo, and induced drag, CDi, coefficients, where the latter is a quadratic function of the lift coefficient, as follows:
C D = C D o + C D i C L 2
Typically, CDo and CDi are functions of the aerodynamic configuration of the aircraft flight phase. Generally, drag coefficients are functions of the aircraft’s Mach number and the Reynolds number (Re = ρVL/μ, where μ is the absolute viscosity coefficient of air). For each aerodynamic configuration, BADA models these coefficients as constants to provide computations for altitude and speed profile thresholds at pre-determined flight phases (i.e., takeoff, initial climb, clean, approach, and landing).

3.2.3. Thrust Model

BADA uses a general formula to calculate the maximum climb thrust, Thrmax,climb, at a standard atmosphere for three different types of engines: jet, turboprop, and piston engines. For jet engines, the general equation is given as
T h r max , c l i m b =   C T c , 1 × ( 1 H p C T c , 2 + C T c , 3 × H p 2 )
Since BADA uses this maximum climb thrust for both take-off and climb phases, the descent thrust is then calculated from the maximum climb thrust using adjustment coefficients for cruise, approach, and landing configurations [41], respectively, as follows:
T h r des , low =   C T d e s , low × T h r max , climb
T h r des , app =   C T d e s , app × T h r max , climb
T h r des , ld =   C T d e s , ld × T h r max , climb
where CTc,1, CTc,2, CTc,3, CTdes,low, CTdes,app, and CTdes,ld are aircraft-specific coefficients, and Hp is the geo-potential pressure altitude, in feet. The rate, in feet per minute, at which an aircraft’s altitude changes with respect to time when descending and approaching the runway for landing is the Rate of Descent (ROD). ROD is given by
R O D = d h d t = ( T h r d e s D ) V T A S m g V g d V d t
where dV/dt is the aircraft’s vertical speed, in feet of descent per minute. Given that the typical target of a flight path is about 3 degrees, the flight path angle, γ, in degrees for a 3-degrees flight over the descent path is
γ = sin 1 ( R O D V a p p )
where Vapp is the aircraft approach speed, in knots. The distance, in nautical miles, that the aircraft covers over the descent path is given as follows:
Distance = ( Δ h ÷ 100 ) γ
where ∆h is the difference between the altitude that the aircraft is currently flying at and the altitude that the aircraft will descend to, in feet. Finally, the time, in minutes, that the aircraft takes to descend and land can be estimated by dividing the difference in altitude, in feet, by the rate of descent, in feet per minute, as follows:
Aircraft   Landing   Time = Δ h R O D

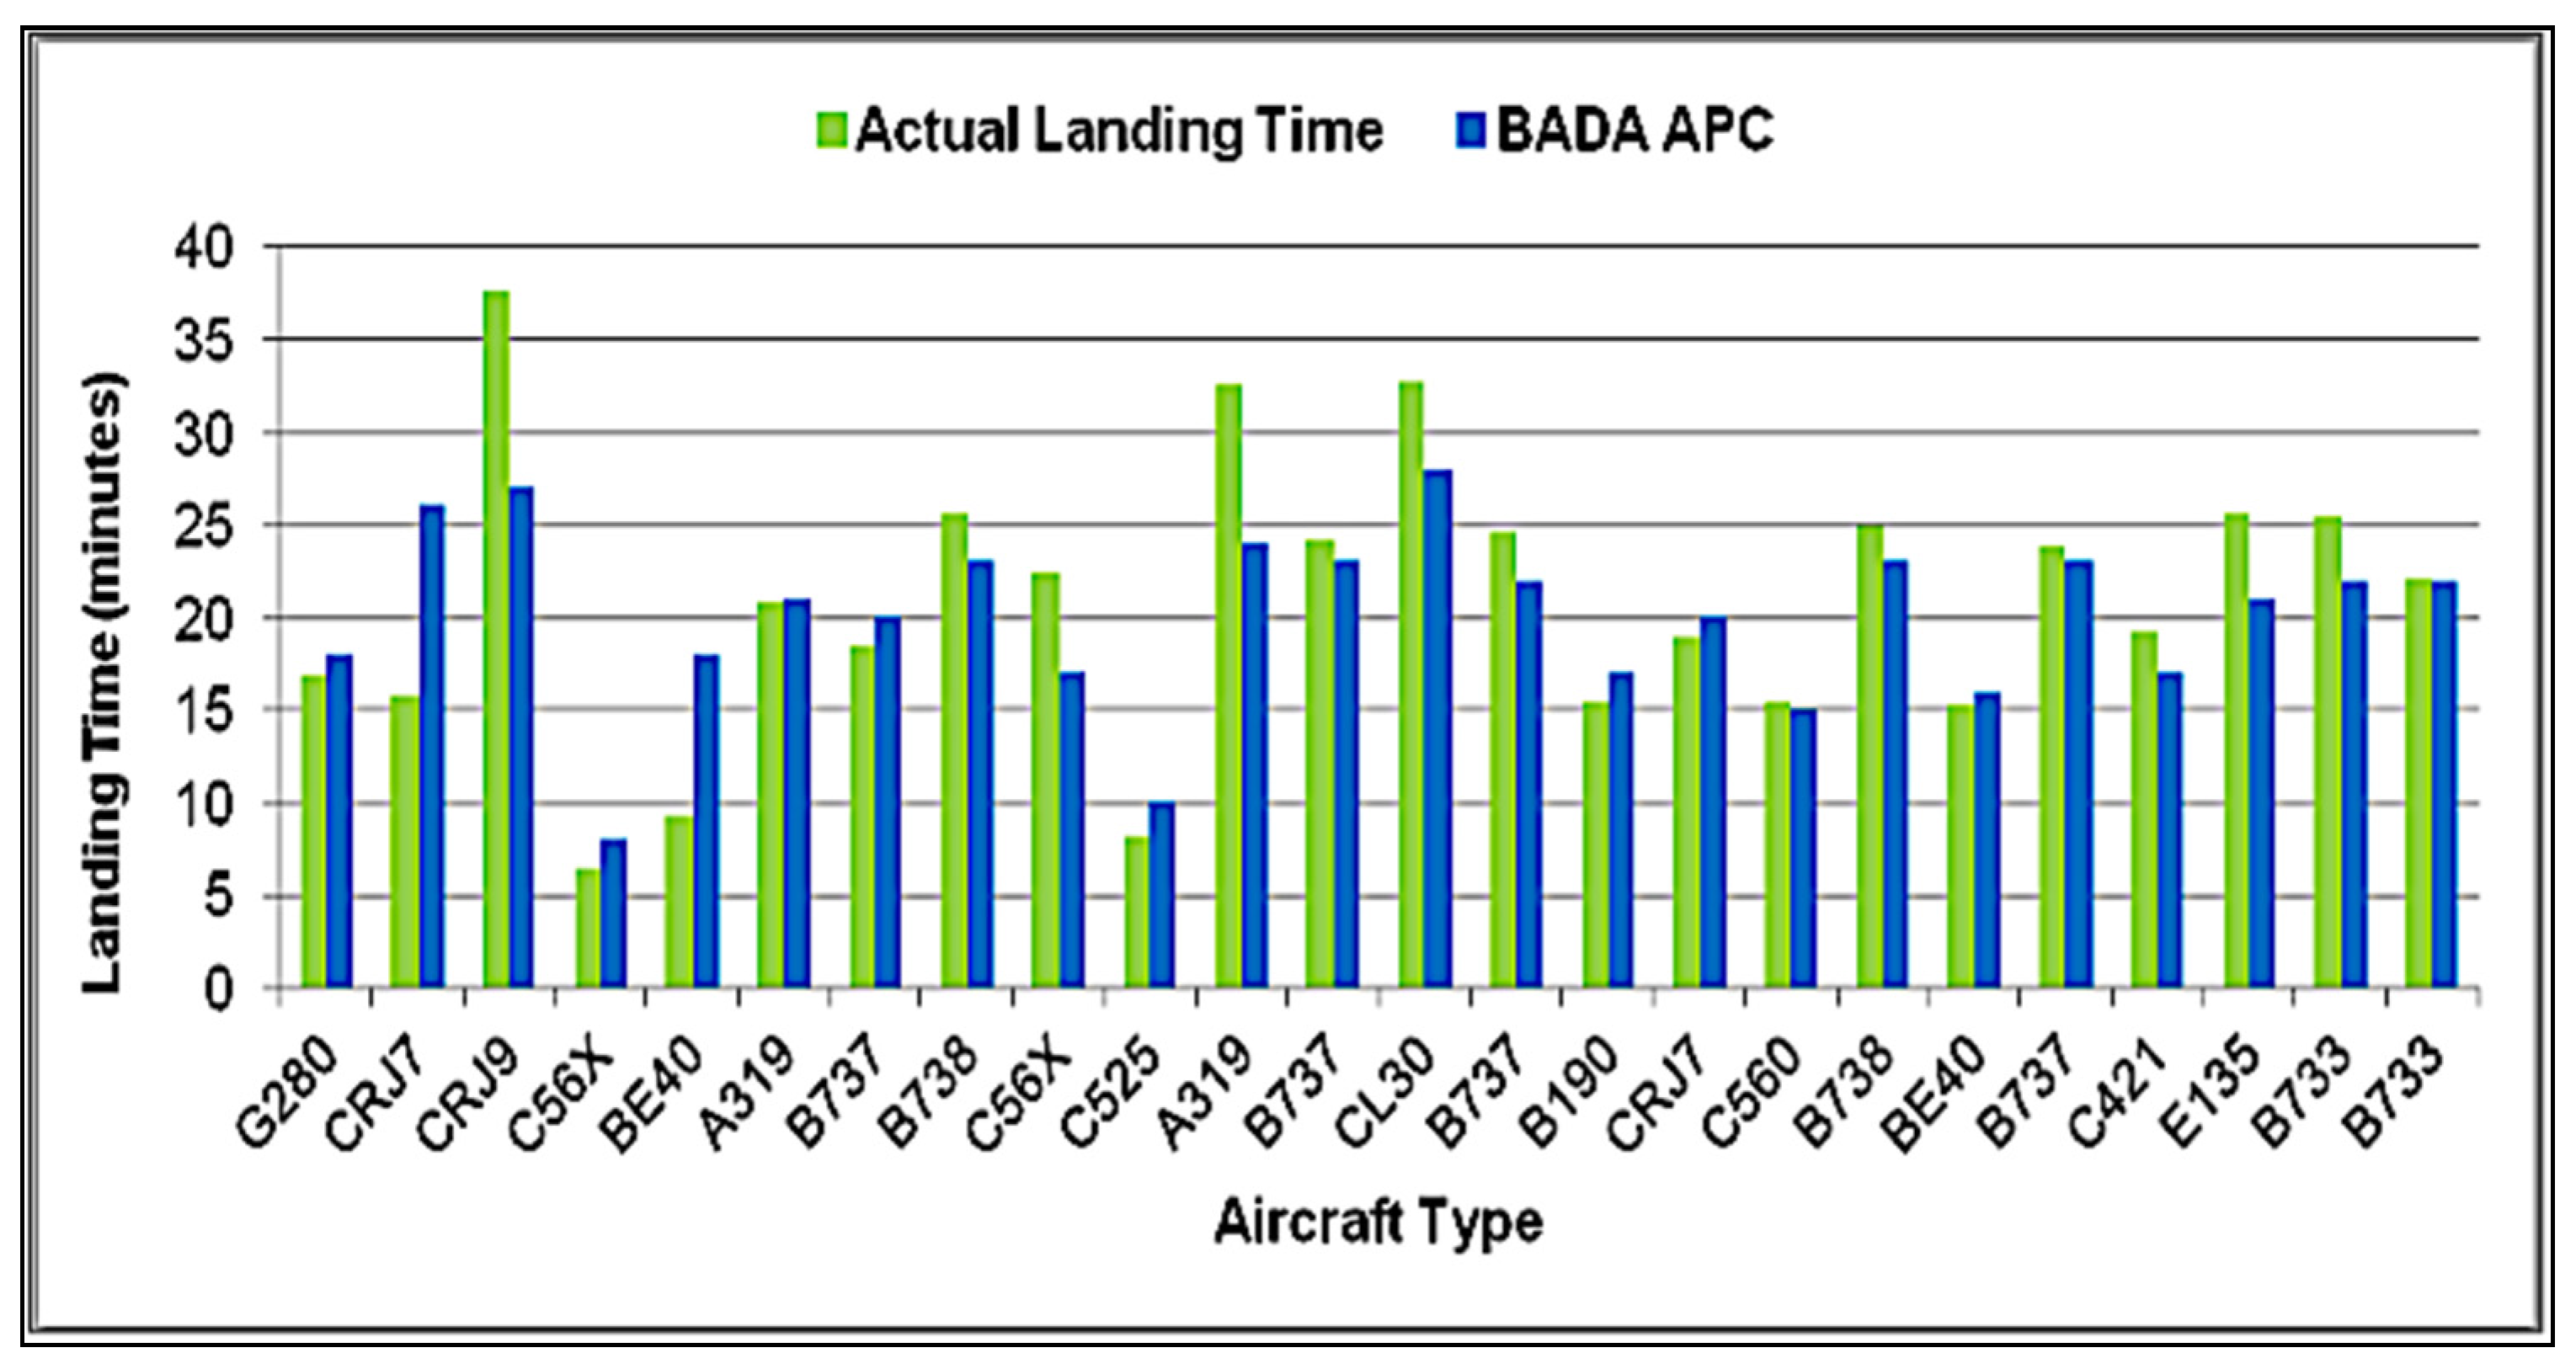
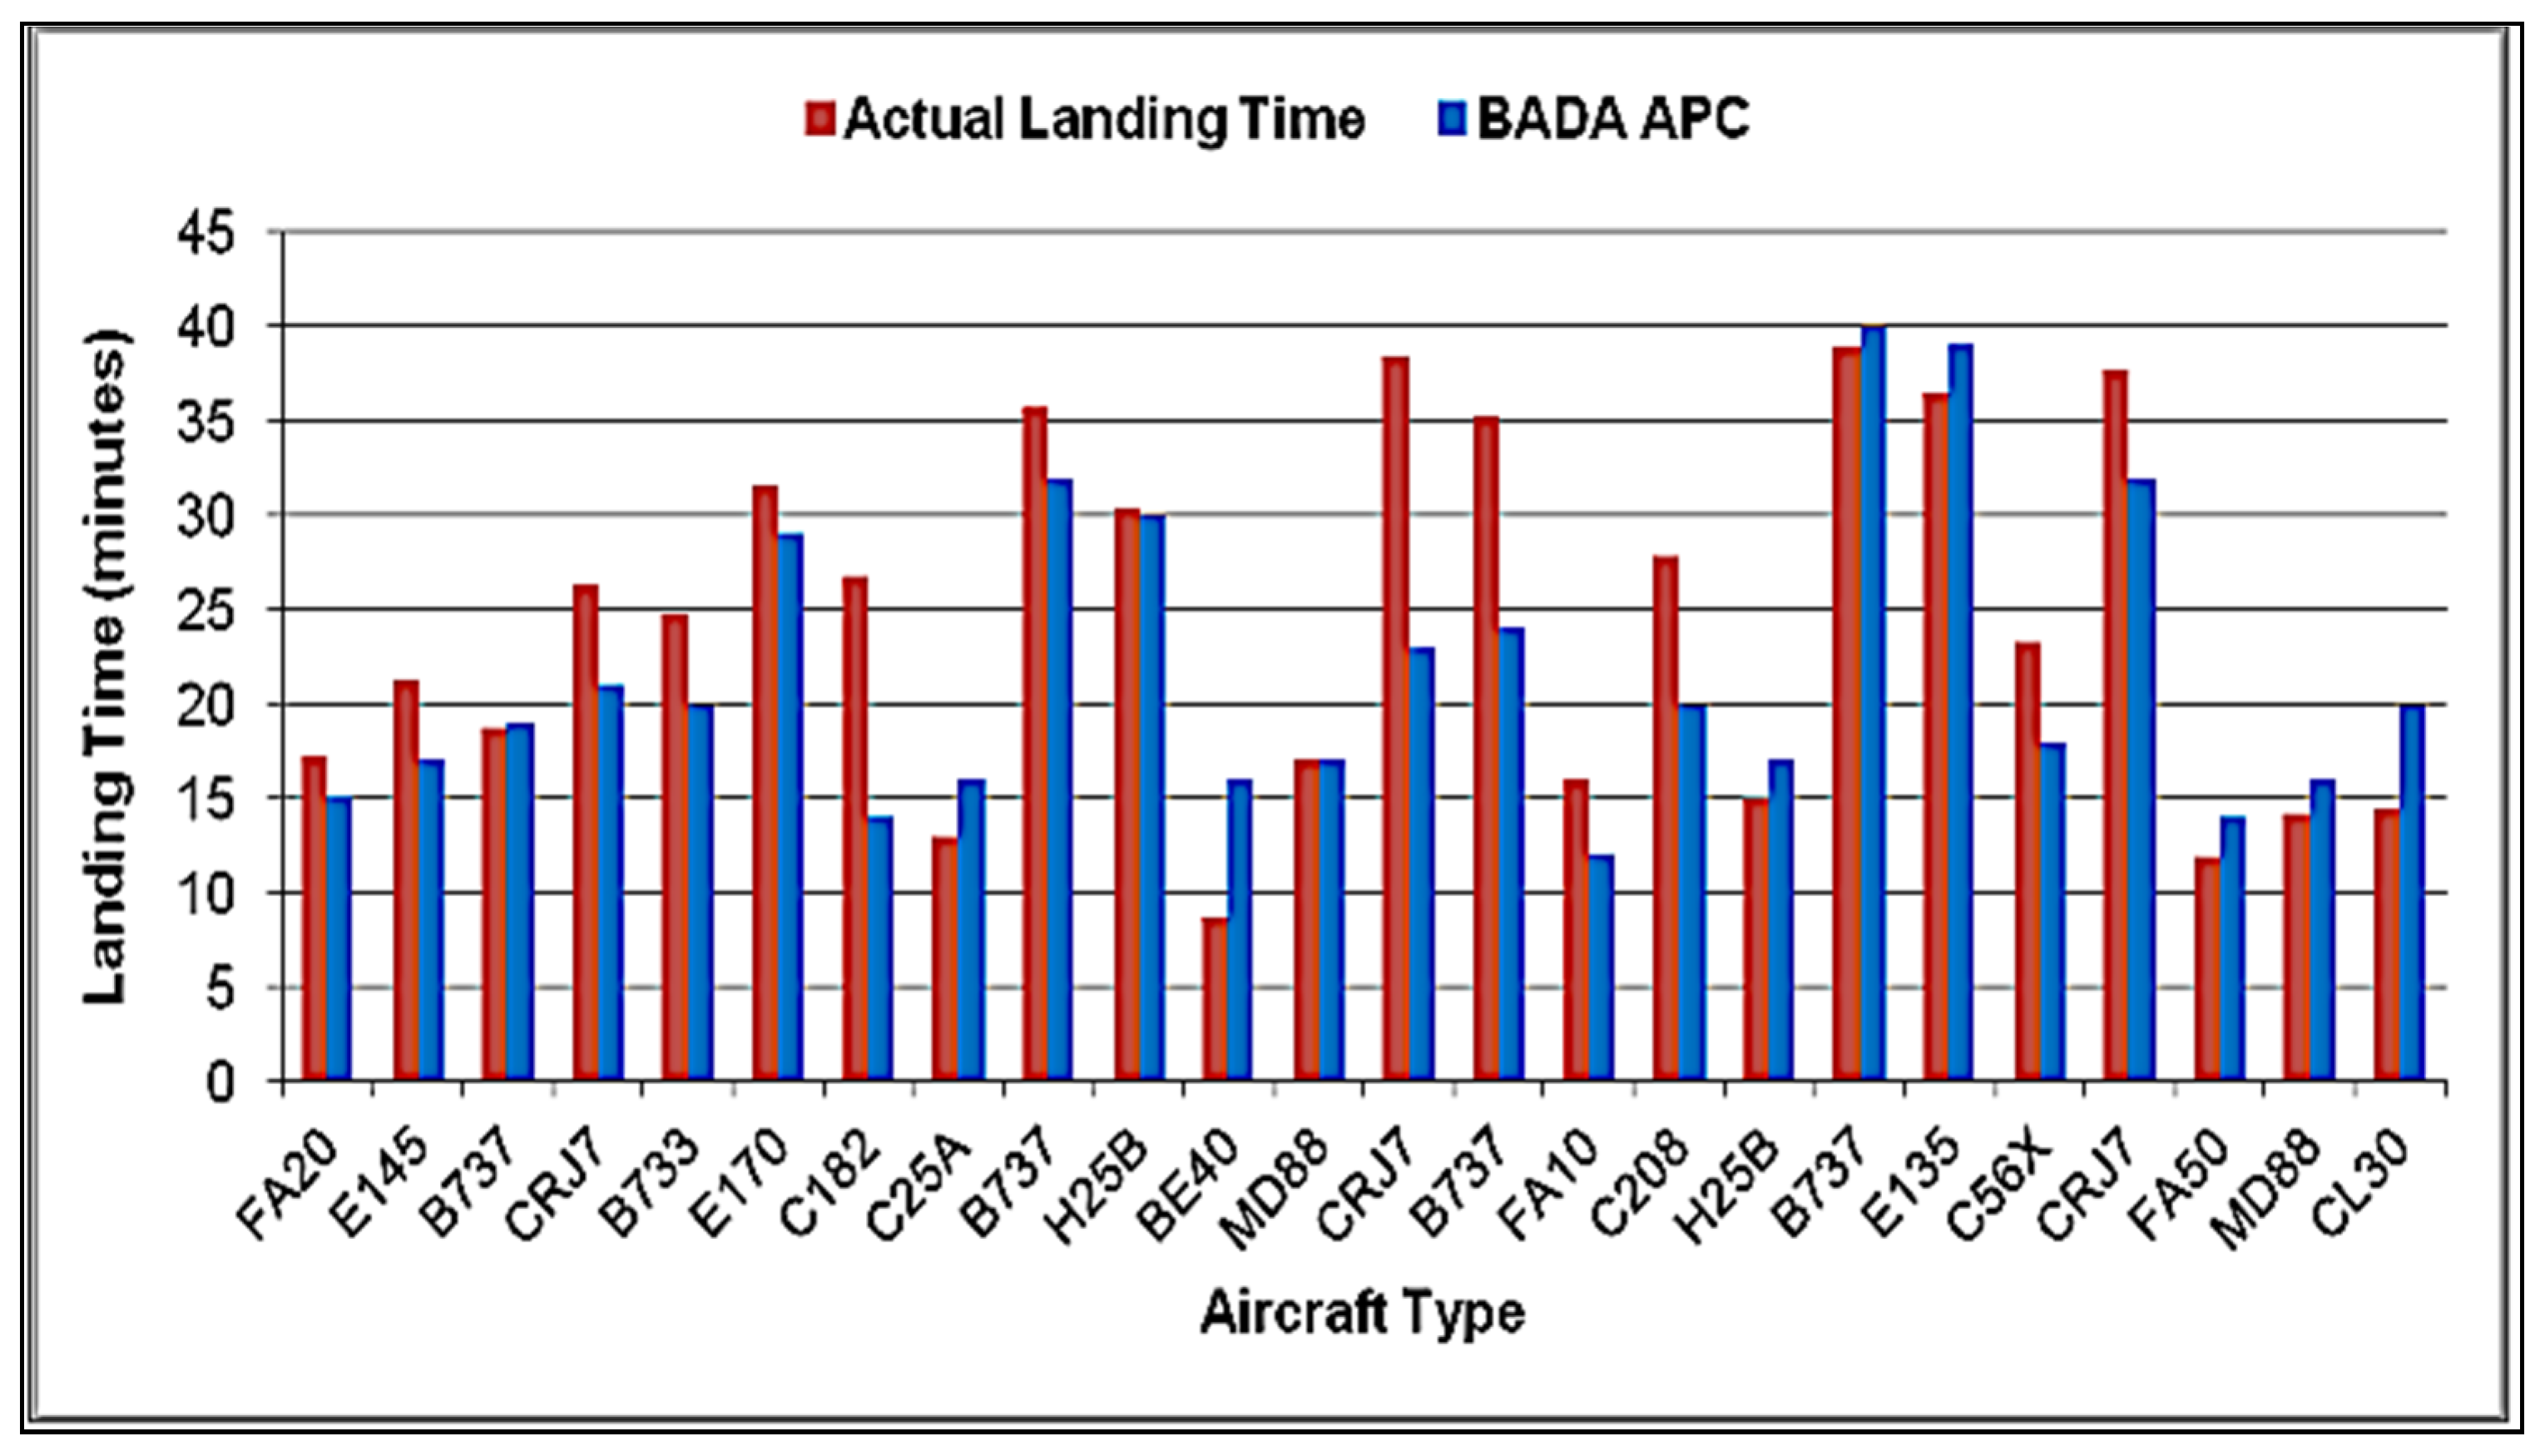
3.3. Evaluation of Aircraft Estimated Descent Time

To evaluate the calculations outputs of BADA APM, Figure 4 shows a comparison between the estimated landing times computed by BADA APC and actual landing times for an aircraft with CDA operated at Nashville International Airport (BNA) on 17 June 2015. There is a slight variation observed across the compared values between the estimated landing times and actual landing times. For example, with a CRJ9 aircraft that has estimated and actual landing times of 38 min and 27 min, respectively, there is an error of almost 29%, while for a CRJ7 aircraft with estimated and actual landing times of 20 min and 19 min, respectively, there is an error of 5.3%. On average, BADA APC have estimated the landing time for an aircraft with CDA operations to be 20 min. When compared with the actual average landing time for an aircraft with CDA at BNA airport, which is 21 min, an error of 4.7% was generated from this estimation.
Similarly, Figure 5 shows a comparison between the estimated landing times computed by BADA APM, using BADA APC, and actual landing times for an aircraft with SDA operated at BNA. It shows that for a B737 aircraft with estimated and actual landing times of 32 min and 36 min, respectively, BADA APC produced an error of about 11%, with an error of about 8% for an E135 aircraft with estimated and actual landing times of 39 min and 36 min, respectively. However, there are SDA instances where BADA APC was able to match the estimated landing time with the actual landing time, such as with the MD88 aircraft, or provide close to a match, such as with the FA50 aircraft. On average, BADA APC have estimated the landing time for an aircraft with SDA operations to be 21.7 min. When compared with the actual average landing time for an aircraft with SDA at BNA airport, which is 24 min, an error of 9.6% results from this estimation.

4. Model Development

4.1. Background on Queueing Theory

In this subsection, we briefly discuss the fundamentals of queueing theory. Queues, or waiting lines, are common in people’s daily lives. Queueing theory is the field of study within operations research (OR) that concerns the study of queueing models to represent the different types of queueing systems (systems that involve some sort of queue) that appear in real-world applications. Thus, these queueing models are helpful for determining how to operate a queuing system [42].
The basic process of most queueing models is that customers requiring service are generated over time by an input source (also known as a calling population). The arrival pattern by which customers are generated from the input source is statistically defined to accommodate the randomness of the customer arrival pattern. A common assumption is that customers arrive according to a Poisson process, that is, customers arrive at random but at a fixed mean rate, or equivalently, the time between consecutive customer arrivals, that is, interarrival time, follows an exponential distribution. These customers enter the queueing system and form a queue to wait for the required service.
Queues could be infinite or finite according to the maximum permissible number of customers that they can contain. At certain times, a customer is selected from the queue for service according to some defined rule referred to as the queue discipline (usually first-come-first-serve, shortly known as FCFS, or some priority-based rule). The service is then provided to the selected customer by a service mechanism that may consist of one or more service facilities, each of which contains one or more servers. The time elapsed from the commencement to the completion of service for a customer is referred to as the service time. Collectively, characteristics of queueing systems include arrival patterns of customers, service patterns of server(s), the number of servers, system capacity, queuing discipline, and the number of service stages, if more than one service stage exists [43].
A convenient notation for summarizing the basic characteristics of the queueing systems was developed by D. G. Kendall and is known in the literature as the Kendall notation. It follows the notation of (a/b/c), where a = customer arrivals distribution, b = service time distribution, and c = number of servers [44]. For instance, the queuing model (M/D/5) uses Markovian (or Poisson) arrivals (or equivalently, exponential interarrival time distribution), deterministic (constant) service time, and five parallel servers.
Generally, there are three basic measures of performance for queuing systems: the waiting time that a typical customer endures, the number of customers that may accumulate in the queue or system, and the idle time of the servers. Since most queuing systems follow random processes (i.e., stochastic processes), these measures are represented as random variables, and thus, their probability distributions need to be defined. Depending on if the main objective of modeling a queuing system is whether to determine some measure of effectiveness for a given process or to design the optimal system based on some defined criterion, the measures of performance could include the expected number of customers in the system, expected number of customers in the queue, expected waiting time in the system, expected waiting time in the queue, and expected number of busy servers.
Beyond the previously mentioned measures of performance, there is a measure of performance of particular interest that indicates the percentage of time the service facility within the queuing system is being utilized. This measure of performance represents the traffic intensity or utilization factor, which is the expected arrival rate of the customers to the queuing system, divided by the expected service rate, assuming one server in the service facility. If more than one server is available, then the number of servers must be multiplied by the expected service time. The utilization factor is an important performance measure of the queuing system.

4.2. Adopting Queueing Theory to Our Model

In this section, we introduce the fundamental parameters and essential conceptual elements for developing our model. In our model, aircrafts arriving at the TMA are viewed as customers of a queuing system. The aircraft within the stacking space are modeled as the customers waiting for the service and being served. Aircrafts leaving the queueing system are viewed as customers completing service at a single server.

4.2.1. Assumptions and Parameters of the Model

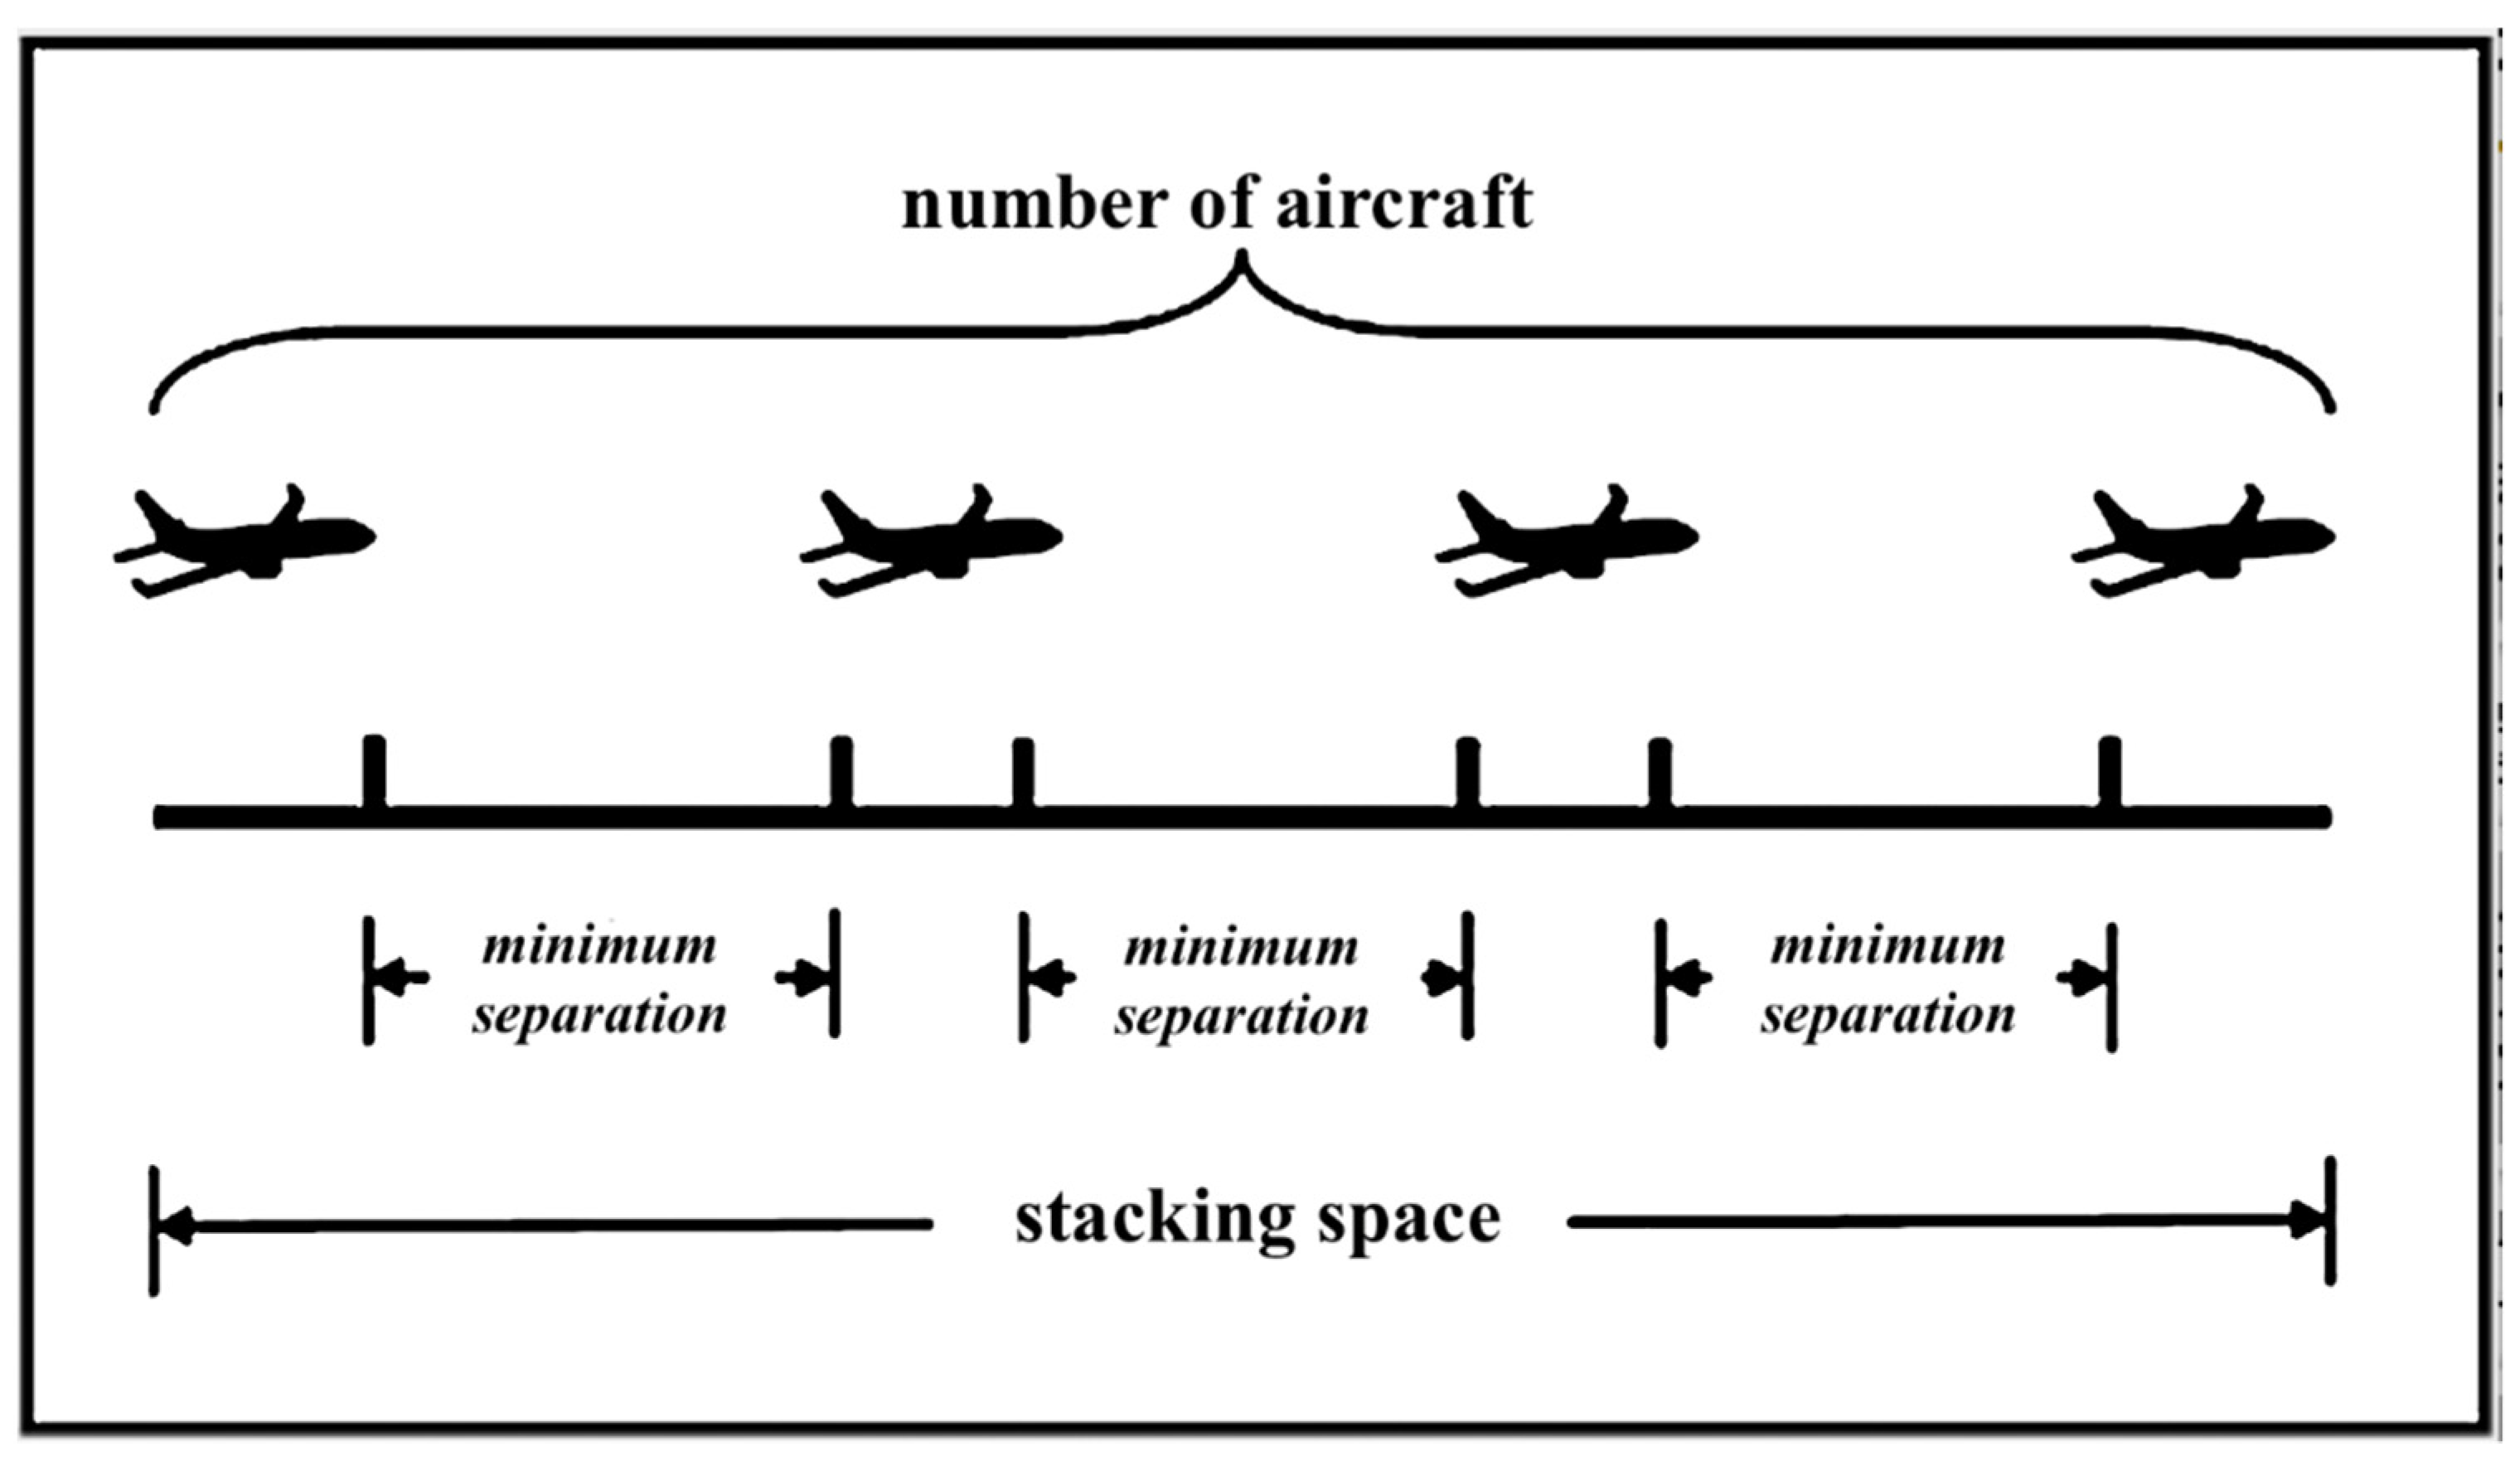
  • The space available for stacking aircraft arrivals in the TMA is considered as the maximum number of aircrafts (customers) that are permitted in the queue, and
  • the longitudinal separation distance between aircrafts conducting CDA are greater than the distance between aircrafts not conducting CDA
Our model assumes that the number of aircraft arrivals over the period of time considered follows the Poisson probability distribution. This distribution has high variability and, thus, is likely to lead to the model results being conservative. Moreover, the fleet mix is assumed to be homogeneous, that is, dominated by two aircraft wake turbulence classes. The following parameters represent the fundamental components of our model: the space available to stack aircraft arrivals, the minimum allowable horizontal separation distance between a pair of consecutive same-weight-class aircraft arrivals, and the number of aircrafts that can be stacked for the approach. Figure 6 illustrates these components in our model. In this regard, while stacking space can be viewed as three dimensional, we model it as one dimensional, reflecting the longitudinal separation of stacked aircrafts as if the aircrafts within the space are all positioned in a single line.

4.2.2. Capacity of the Stacking Space for Aircraft Arrivals

To maximize airport capacity, especially during periods of high demand, the controller longitudinally aligns and separates approaching aircrafts (i.e., positions arriving aircrafts in the queue) for landing on the same runway in a predetermined airspace, according to a predefined requirement for minimum separation between aircrafts that typically operates under IFR [36].
Optimal spacing refers to the efficient implementation of separation requirements by the controller, such that spacing delivers seamless and efficient air traffic control services while maintaining safety. As the controller often emphasizes sequencing (ordering of aircrafts approaching based on their sizes), this should not be the case with CDA operations. During CDA operations, the optimal spacing between aircrafts is more important than optimal sequencing [45]. Thus, we principally assume that the separation distance (mapped as the horizontal distance in Figure 6) between two, same-weight-class, consecutively arriving aircrafts conducting CDA is greater than when these two consecutive arriving aircrafts are conducting SDA, thus
d C D A > d S D A
where:
d C D A = minimum separation distance between aircrafts conducting CDA; and
d S D A = minimum separation distance between aircrafts conducting SDA.
Assuming that the space available to stack aircraft arrivals (i.e., the maximum number of aircrafts in the queuing system) at an airport is Sp, and the minimum allowable horizontal separation distance between a pair of same-weight-class aircraft arrivals is d, then the number of aircrafts stacked for approach, k, must fit safely within the allowable stack space, as follows:
k S p d
The largest integer value of k that satisfies Equation (17) is a key output of our modeling. When CDA is used, that largest integer value of k is the maximum number of aircrafts that can fit within the stacking space under the CDA assumption. The air traffic controller may be able to compare this largest integer with the number of CDA aircrafts presently in the tracking space to ascertain whether there is available stacking space to permit the next arriving aircraft to use CDA or not.
Assuming that the aircraft approach speed, measured in knots, on average, is Vapp and that the distance the aircraft covers during descent from the TOD point to touchdown, measured in nautical miles, is ddes, then the average descent time, tdes, could be estimated as
t d e s = d d e s V a p p
We assume that an airport’s nominal capacity, AAR, is sufficiently large to handle all aircrafts that can fit safely within the stacking space. Therefore, when implementing CDA, this assumption is represented as follows:
A A R × t d e s k
Essentially, stacking space is a contained airspace with predefined boundaries based on traffic and/or obstacles limitations with the purpose to stack aircraft arrivals up to a certain capacity. As the separation distance between aircrafts increases, the stacking space capacity, in terms of the number of aircrafts that could be stacked, k, will decrease. Moreover, as the airport arrival rate increases, typically during periods of high demand when many airport staff are working and the airport operates at near capacity, stacking space capacity may decrease as well. This is due to the high level of traffic causing stress and cognitive pressures on the air traffic controllers who, thus, may decide to increase the minimum separation distance between aircrafts as a safety buffer to reduce stress and the possibility of a safety error.
Furthermore, we assume that almost all aircraft arrivals at the airport are expected to successfully land on a runway, regardless of their descent profile type. To attain this operationally, the runway, as a critical element in ATM and airports operations, is assumed to have an arrival capacity that is at least as large as the AAR. The maximum runway arrival hourly capacity is calculated by dividing the average aircraft ground speed, GS, in knots, crossing the runway threshold by the longitudinal separation distance, d, in nautical miles, required between successive arrivals, as follows:
R w y C a p = G S d
Observe above that the stacking space capacity, k, was determined above based on the minimum allowable separation distances between a pair of aircrafts of a similar weight class. Thus, the value of k represents a bound on the capacity of aircrafts that may safely fit within the stacking space. Consequently, an upper bound of k should be determined based on the worst-case sequencing of aircrafts within the stacking space. That worst case can be determined by assuming a sequence in which the lightest aircraft scheduled to land that day is followed by the heaviest aircraft scheduled that day followed by the lightest aircraft scheduled and so forth. Following these calculations, the air traffic controller may be provided with the lower and upper bounds of the stacking space capacity under the assumption that all aircrafts arriving during that time period use CDA. When a particular aircraft arrives during the period, the controller may compare the number of aircrafts presently in the system versus the lower and upper bounds. If the number in the system is less than the lower bound, then that is a favorable indicator that the arriving aircraft may be admitted using CDA. If the number is above the upper bound, then that indicates that CDA should be denied. If the number of aircrafts within the stack is as much as the lower bound or greater and yet below the upper bound, then the controller will need to consider other factors in reaching a decision on whether CDA is safe for that arriving aircraft. Even if the number in the system is below the lower bound, those other factors may need to be considered by the controller to ensure there is sufficient separation distance between the arriving aircraft and the aircraft it follows most closely within the stacking space. Providing the controller with lower and upper bounds on stacking space is an optional tactic. Doing so depends on whether it would be too much additional information for the, often busy, controller to absorb.

5. The Applied Queueing Model

In this section, we present our model and its key output, the Probability of CDA Blocking, and by blocking, we mean that an aircraft would be denied conducting CDA by the controller. Therefore, the probability of CDA blocking is the probability that (assuming all aircrafts arriving during the brief period of time considered (e.g., 15 min) are assumed to use CDA) an aircraft would need to revert to SDA even though the initial plan was for all aircrafts arriving in that time period to use CDA. However, we first discuss how the concept of traffic intensity, which is borrowed from the queuing theory, applies in the context of our model.

5.1. Traffic Intensity

Queuing theory presents a key parameter known as the traffic intensity, also referred to as the utilization factor, which is denoted by the Greek letter ρss (“rho”), which is defined here as the average hourly demand rate of the stacking space divided by the average hourly capacity (or service) of the stacking space. If the average demand rate (the rate at which aircrafts arrive at the stacking space, i.e., the aircraft arrival rate) is denoted by λss and the average service rate is denoted by µss, then the utilization of airspace factor, ρss, for the stacking space within the TMA is as follows:
ρ s s = λ s s μ s s
where the demand rate is expressed in terms of the number of aircrafts that arrive per hour at the stacking space, and service rate is expressed in terms of the number aircrafts per hour that may enter the stacking space. The value of the service rate, µss, is conceptually equivalent to the airport arrival rate (AAR). However, because λss is expressed in our examples per 15-min time period, the value of the service rate, µss, represents the number of aircrafts that can be processed (served) per 15-min time period, and thus, it is one fourth of the value of AAR. The symbol µss is typically used in publications on queueing theory, while AAR is commonly used in air traffic management. Observe that the service rate, µss, will be lower when CDA is assumed than when SDA is assumed due to the longer separation distances required between aircrafts using CDA.

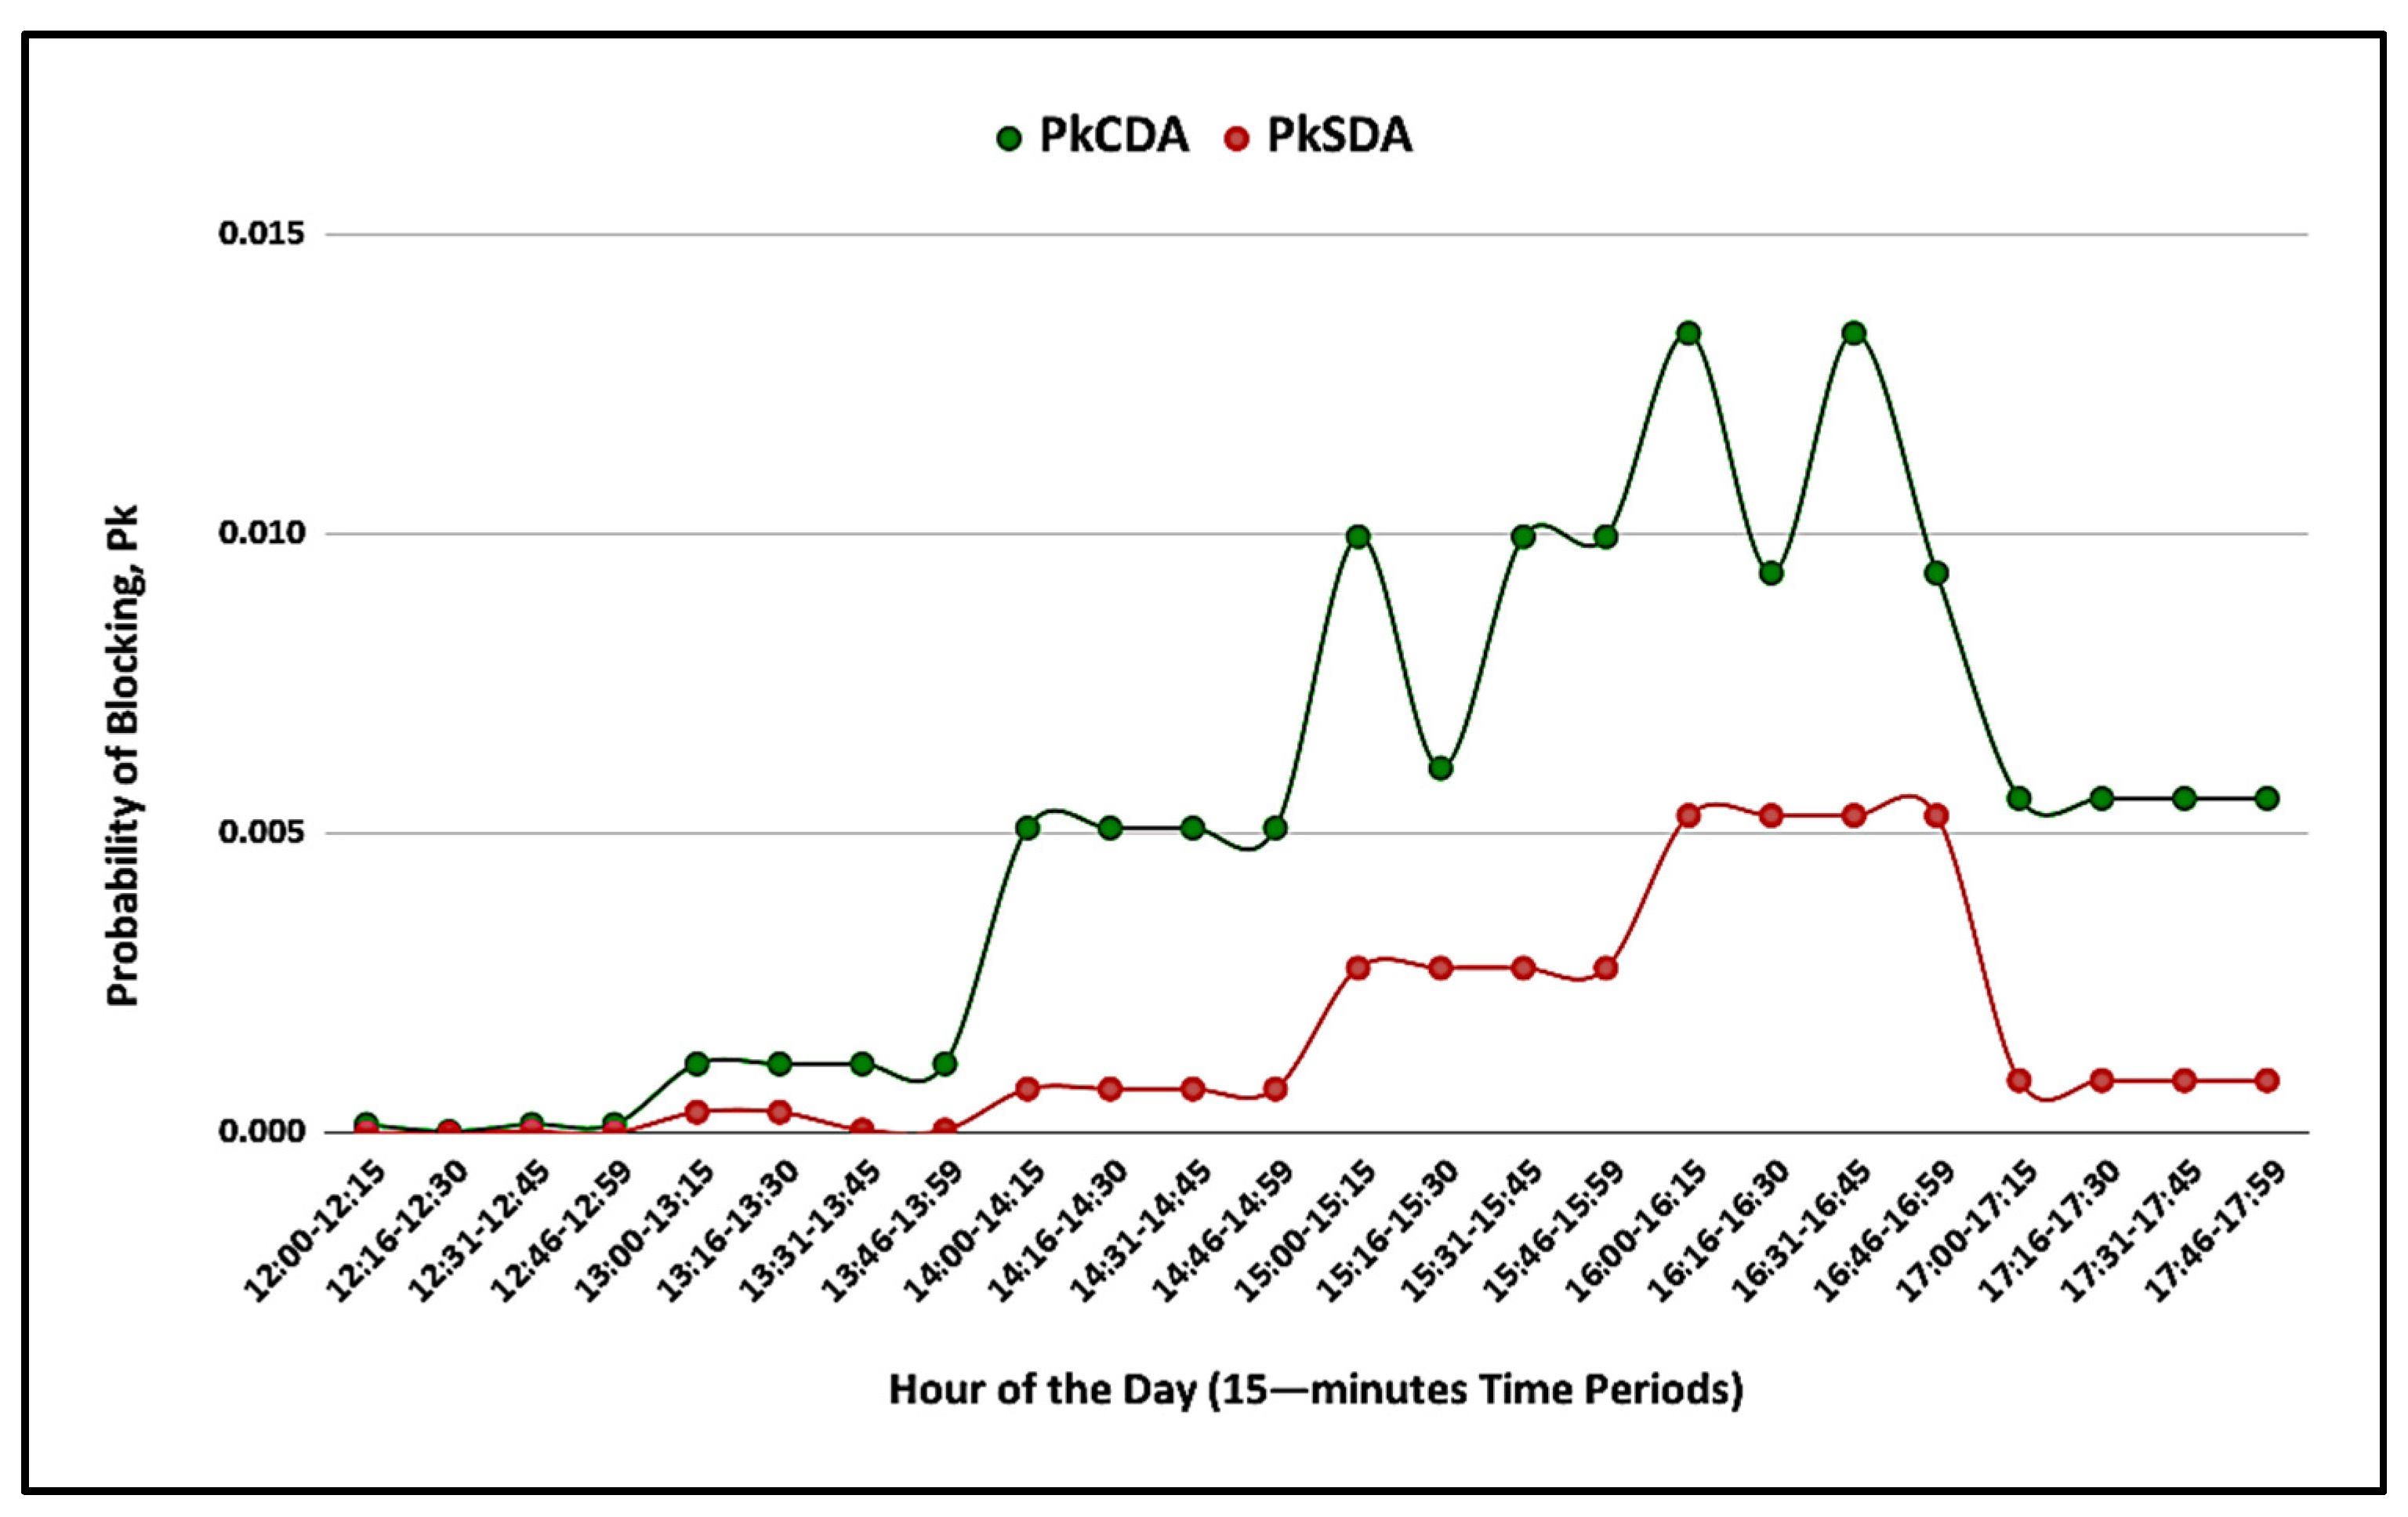
5.2. Probability of Aircraft Blocking

In a queueing system of finite capacity, the probability of “blocking” is the probability that an arriving customer arriving at the queue finds it full and thus exits this system. In our context where aircrafts are the customers, the interpretation of the probability of blocking depends on whether CDA or SDA is assumed for all aircrafts during the brief time period being analyzed. If CDA is assumed for the time period, then a full queue suggests that CDA may not be used, and thus, SDA will be used instead. If SDA is assumed for the time period, then a full queue suggests that the aircraft will enter a holding pattern until the queue has available space to accommodate it. The probability of blocking is the percentage of time an aircraft’s request to embark on CDA (or SDA) is denied principally due to safety and because the stacking space within the TMA is busy and congested. This probability is denoted by Pk and could be specified for an airport and its TMA to define a threshold beyond which CDA is unsafe to implement, or in the case of SDA, it is the probability that an aircraft will need to enter a holding pattern. Since the approach operations would be limited to the two profiles, namely CDA and SDA, then Pk should be determined for these two approach profiles. Theoretically, Pk is expressed based on the M/M/1/k queuing model, in which the arrival process is Poisson with rate λs and the service process is Poisson with rate µs, a single server (that is, the stacking space), and finite system capacity at k aircraft, as follows:
P k = 1 ρ s s 1 ρ s s k + 1 ρ s s k
Because the Markov (Poisson) process distribution has high variability and is assumed for both arrivals and service, the resulting probability is likely to be higher than the value experienced in practice, and thus, the Markov assumption may be viewed as conservative.

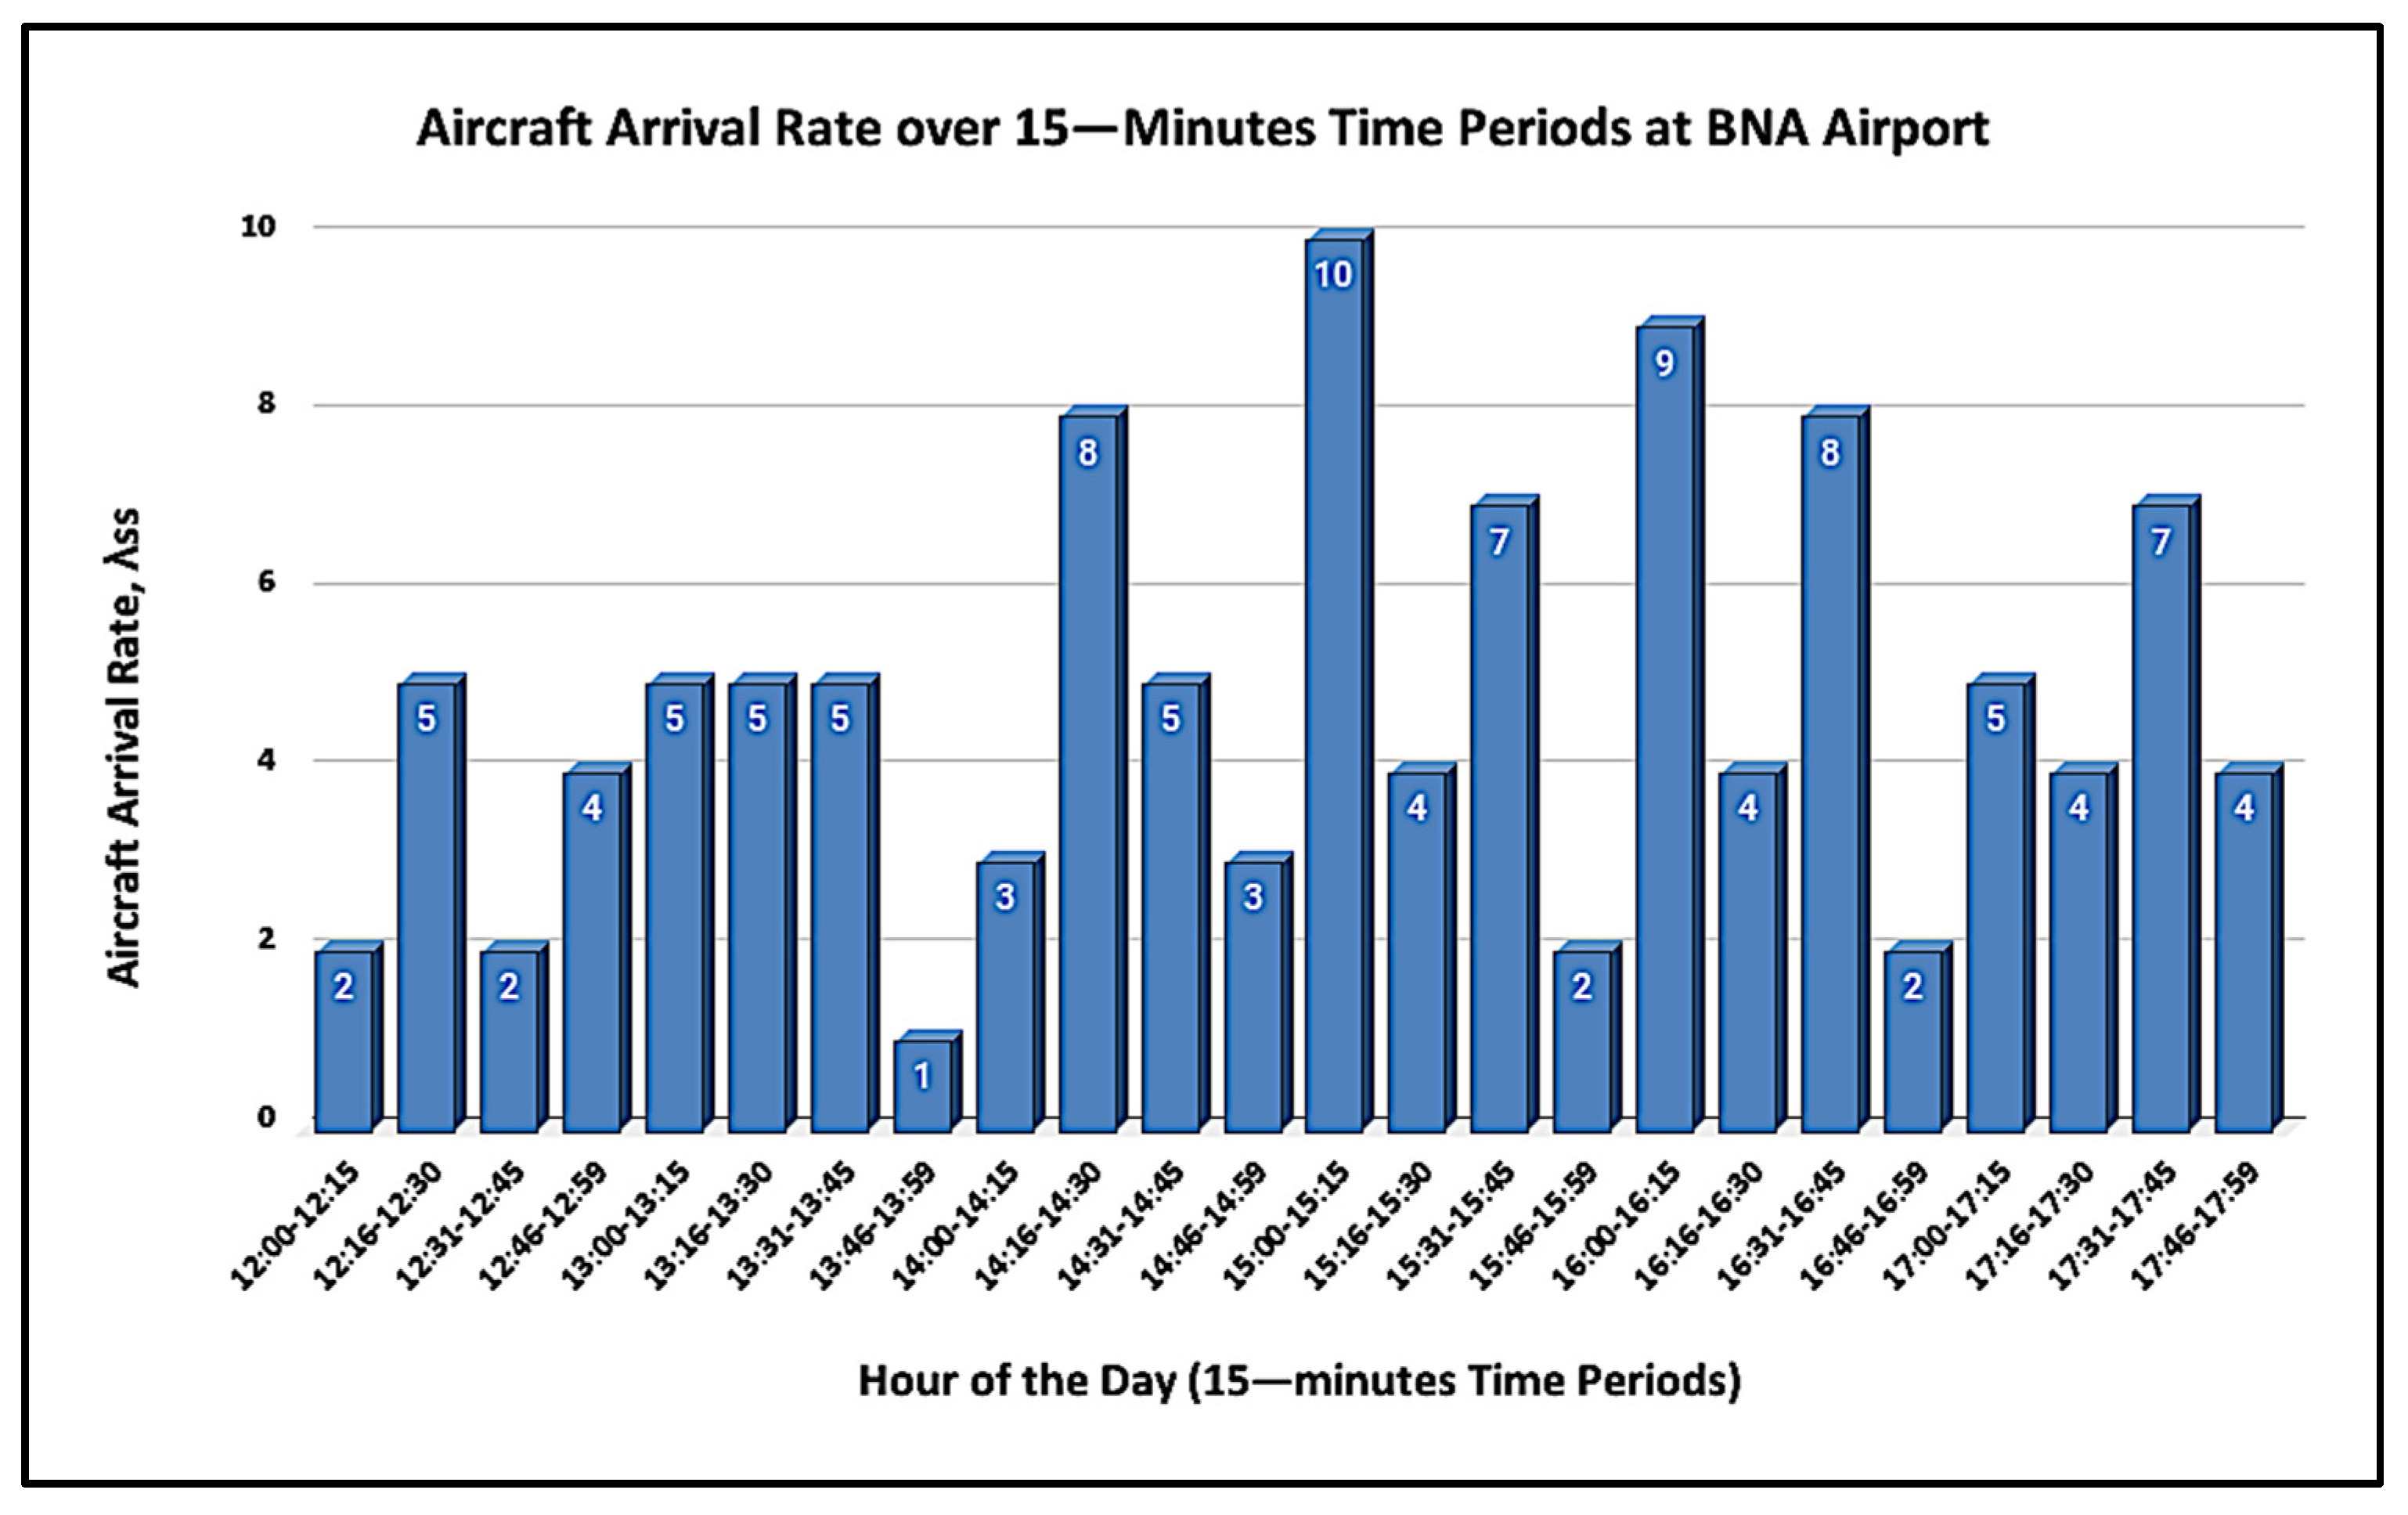
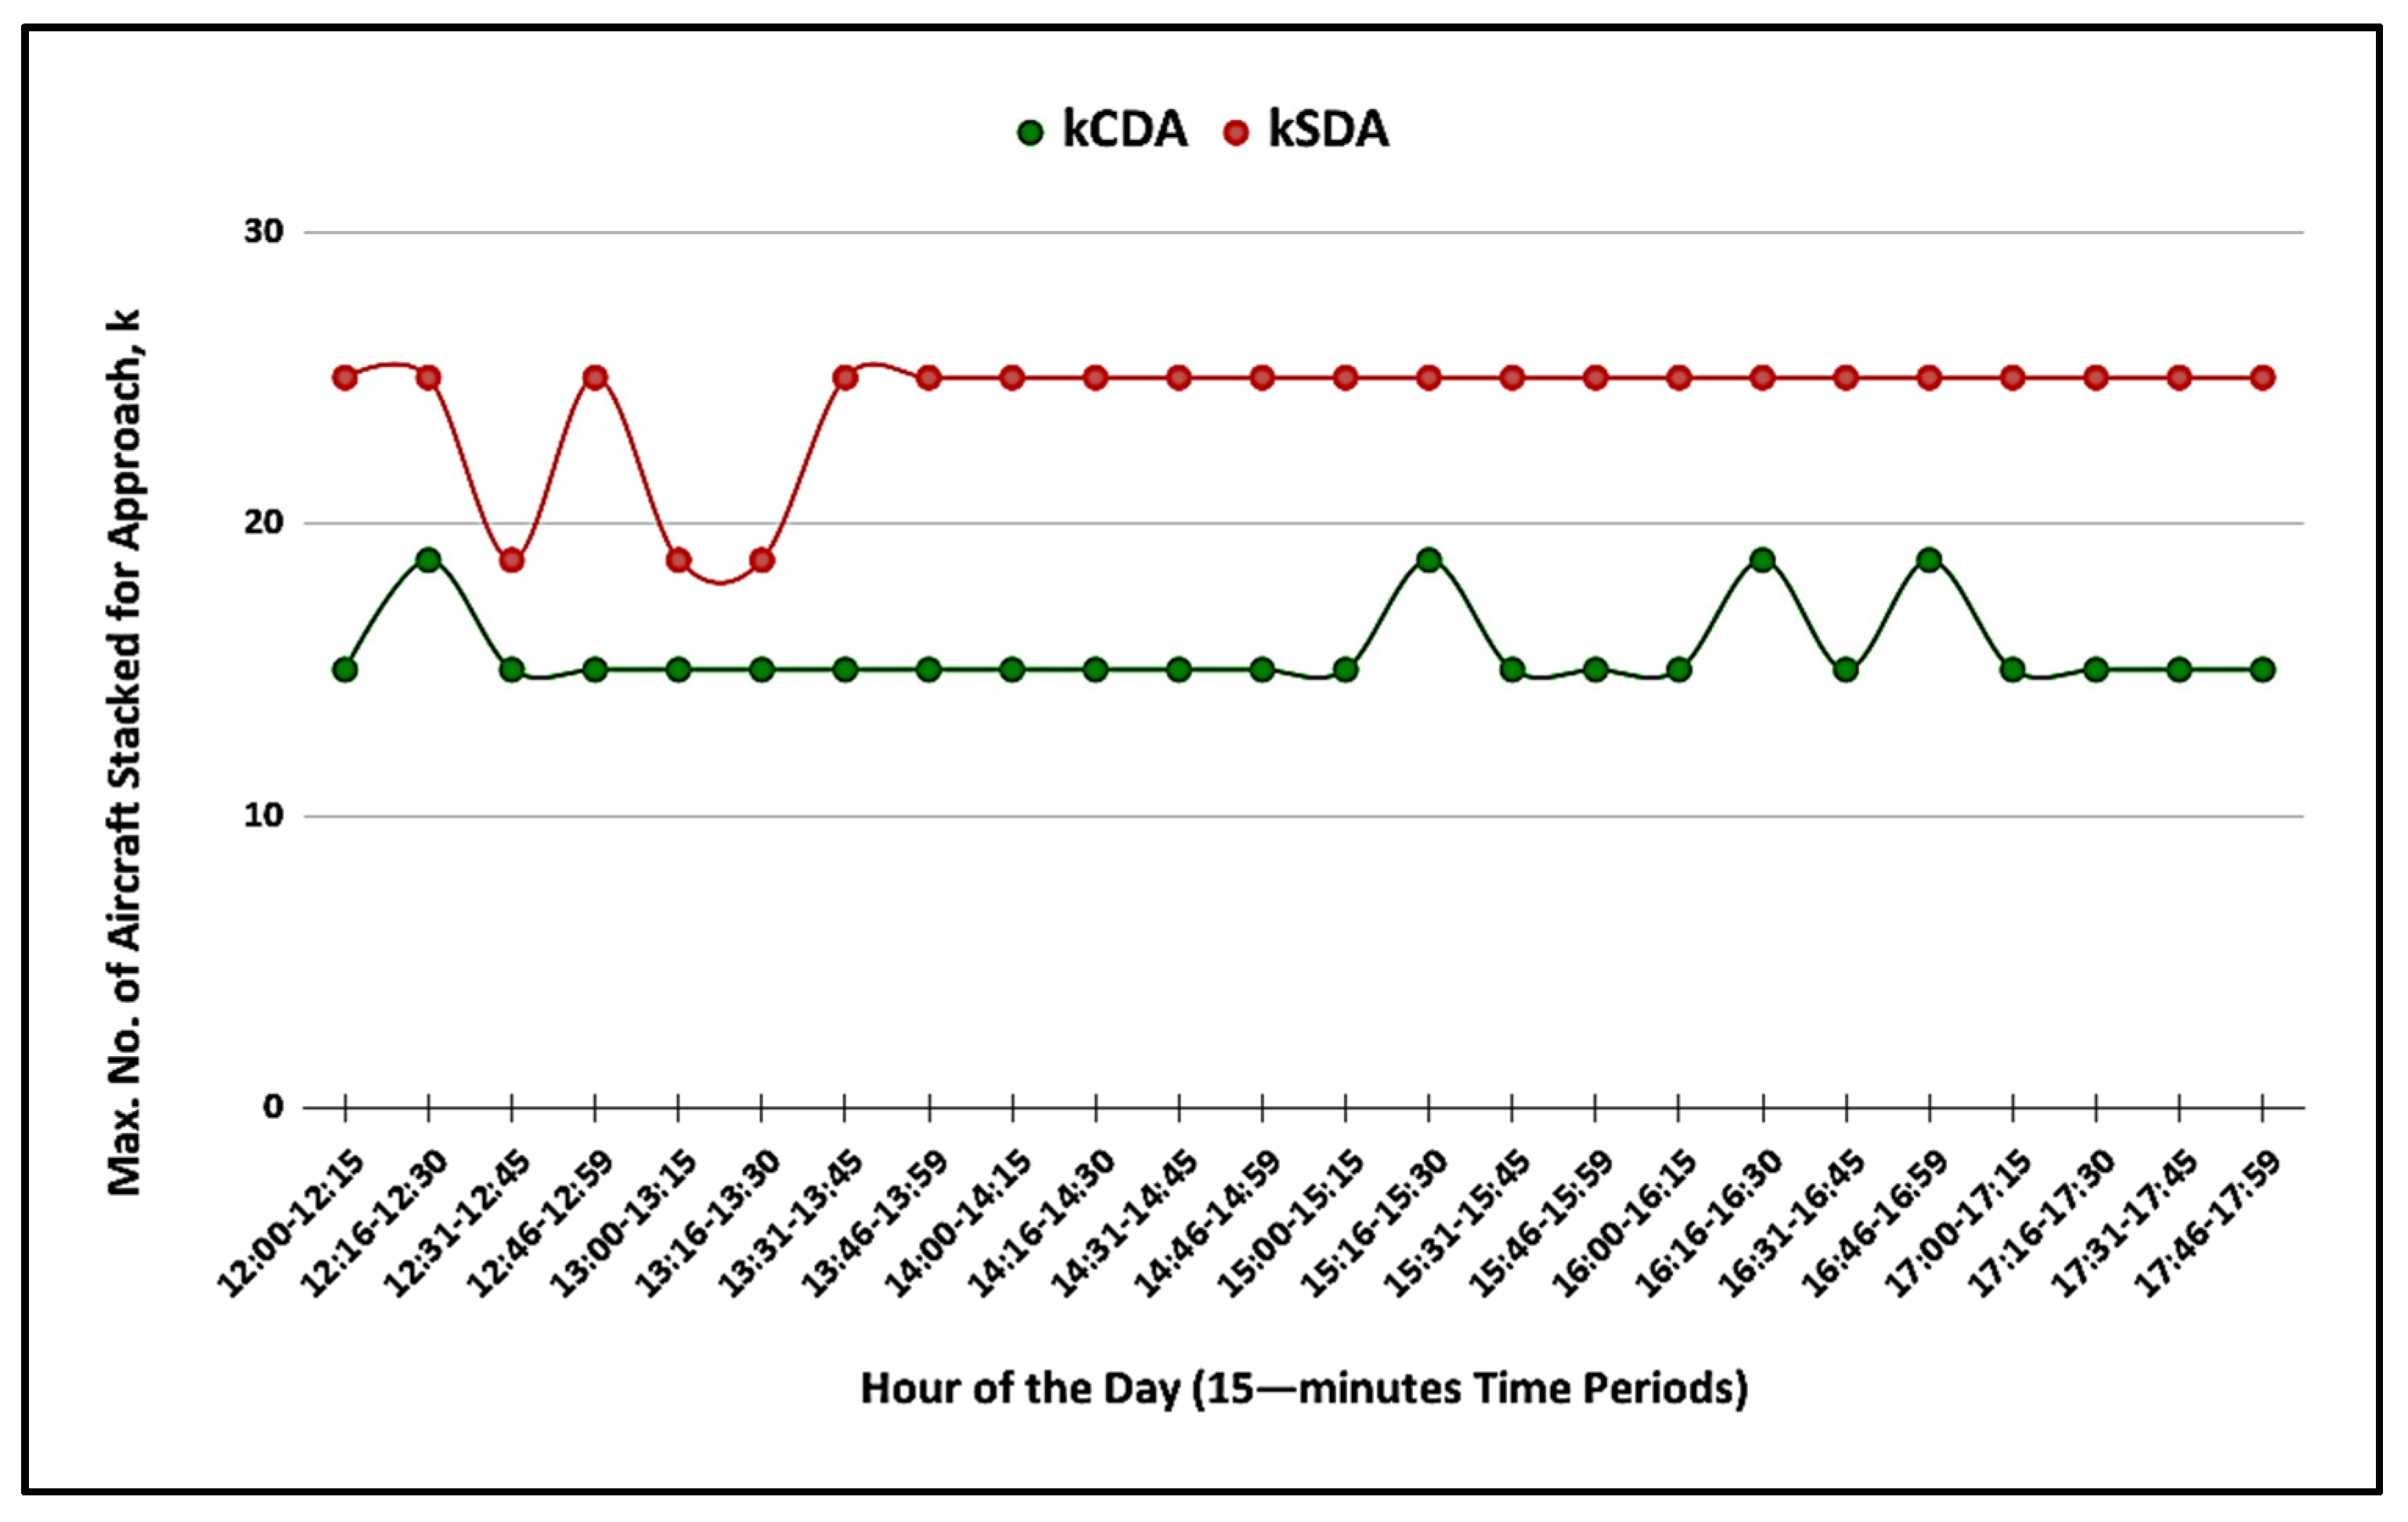
6. Numerical Results to Illustrate the Model

This section illustrates the application of our model through the use of industry standard data (e.g., minimum separation distance rules) and a stream of aircrafts arriving for landing at a mid-sized international airport during an afternoon level of demand. In particular, we used actual flight data from flights operated at Nashville International Airport (BNA) from 1200 to 1759 local time, on 17 June 2015.
Using BNA flight data and standard industry data, we calculated the probability of blocking for each type of descent profile, namely, CDA and SDA. These probabilities are denoted as PkCDA and PkSDA. PkCDA is the probability of blocking if all the aircrafts in the stacking space will conduct CDA, and PkSDA is defined as the probability of blocking if all the aircrafts in the stacking space will conduct SDA. As previously mentioned, the probability of blocking is the percentage of time an aircraft request to embark on CDA is denied for safety considerations and due to the stacking space being congested and busy and similarly the faction of time an aircraft landing with SDA would need to enter a holding pattern.
The relevant parameters in building the model are described as follows. The rate of aircrafts arriving per time period, λss, is determined based upon the actual number of arrivals at BNA within each of the 24 15-min time periods analyzed. The stacking space, Sp, was estimated by visually examining the data and assuming its value as a constant value throughout the six hours. The wind speed, Ws, is the average value at BNA during each time period. The aircraft approach speed, Vapp, is determined based on averages, across all arriving aircrafts, of their initial approach velocity and final approach velocity. The fleet mix of heavy-, medium-, and light-weight aircrafts arriving in each time period and their sequence of arrivals is determined from what actually occurred in each time period.
The minimum separation distances under SDA and CDA assumptions, dSDA and dCDA, respectively, were chosen based on ICAO’s wake turbulence application [36] and matrix model to calculate the separation distance between a mix of aircrafts proposed in [35] in each time period. As mentioned previously, these distances vary based on the wake turbulence categories of the leading and trailing aircrafts and, thus, depend on the fleet mix in each time period. Furthermore, the values of dSDA and dCDA are identical when the leading and trailing aircrafts have the same weight class and differ otherwise.
Figure 7 shows the values of the aircraft arrival rate, λss, over time for BNA.
Consistent with Equation (17), we calculated the number of aircrafts that can fit in the stacking space if CDA is used, kCDA, and the number of aircraft that can fit in the stacking space if SDA is used, kSDA, as follows:
kCDA = Sp/dCDA
kSDA = Sp/dSDA
Those values of kCDA and kSDA for BNA are shown in Figure 8. This figure may be provided as systematic output for the air traffic controllers, thus enabling them to know the bounds on the maximum number of aircrafts that may be permitted within the stacking space for each descent method. Because the minimum separation distances for CDA are longer than with SDA, the value of kCDA is always lower than kSDA, while the difference between the two varies due to the varying fleet mix and arrival sequences in each period.
Using Equation (18) to determine Tdes, we determined the service rate, µCDA and µSDA, under the CDA and SDA conditions in the following manner, using a calculation similar to Equation (19), described earlier:
µCDA = kCDA/TdesCDA
µSDA = kSDA/TdesSDA
Because CDA requires greater minimum separation distances between aircrafts than SDA, this reduces the rate at which CDA arrivals can be processed through the stacking space and, thus, results in µCDA being lower than µSDA.
Using the above parameters and Equation (22), we calculated the values of the probabilities of blocking, PkCDA and PkSDA, for CDA and SDA, respectively, and show the results in Figure 9.
Observe in Figure 9 that the probability of CDA blocking (i.e., CDA requests being denied), PkCDA, is consistently less than the probability of an SDA request requiring the aircraft to enter the holding pattern, PkSDA. By looking at graphs such as Figure 9, the air traffic controller can see those periods of time when the vast majority of aircrafts will be able to use CDA, i.e., when the probability of CDA blocking, PkCDA, is sufficiently low. For example, except for the late afternoon periods between 15:00 to 15:15 and from 15:30 to 16:45, there is less than one percent probability of CDA blocking. Aside from those late afternoon exceptions, the other time periods would be favorable for permitting CDA arrivals for all (or nearly all) arriving aircrafts. Even during the late afternoon time periods, the probability of CDA blocking is low enough that the air traffic controller may be able to permit many of the aircrafts to land using CDA. Different air traffic controllers will have different probabilities at which they will be comfortable with using CDA. Their thresholds in such decision-making may change over time as they gain experience using the model. Overall, the information should be helpful to the air traffic controllers by focusing their attention on those opportunities to increase the use of CDA and thus lead to more sustainable air transportation operations.
After deciding on the periods of time when CDA may be used for all (or nearly all) arriving aircrafts, knowing the bounds on the number of aircrafts that may fit safely in the stacking space, kCDA and kSDA, as shown in Figure 8, may help the air traffic controller to decide on an aircraft-by-aircraft basis whether to admit a particular aircraft’s descent using CDA. For instance, if an aircraft arrives during a period of time when the controller plans on permitting CDA and when the actual number of aircrafts within the stacking space upon a particular aircraft’s arrival at the TMA is less than kCDA, then the controller knows it is likely fine to accept that particular aircraft’s request to use CDA, and otherwise, it is not.

7. Conclusions

Based on the analysis of the parameters that govern CDA implementation during high traffic levels, such as the terminal maneuvering area (TMA) and the size of stacking space to arrange aircraft arrivals, an analytical model has been developed that aims at addressing the accommodation of more CDA operations than is presently done. Our analysis shows that the parameters that have significant impacts on CDA usage include airport arrival rate, capacity of the stacking space, and the minimum separation distance between aircraft arrivals. Although CDA usage is also affected by other parameters, such as wind speed, types of arriving aircrafts, and traffic levels at contiguous airports, we were able to capture the underlying relationship between these parameters and CDA usage, potentially helping air traffic controllers to decide on whether to adopt more CDA more often and using more quantitative information. In particular, we calculated the probability that an aircraft arriving within a brief period of time (say 15 or 30 min) would be denied CDA as a function of airport conditions. This may enable controllers to identify those periods of time when CDA should be anticipated, in other words, when the controller should plan on permitting CDA. This may lead to an increased use of CDA and, thus, result in lower noise, fuel consumption, and pollution. Furthermore, we established bounds for the maximum number of CDA descending aircrafts would fit within the stacking space, providing insight to the controllers on whether to permit a particular aircraft to use CDA or not. Finally, we illustrated our model using actual data from flights operated at Nashville International Airport (BNA).
Future research opportunities include better support for air traffic controllers in analytically determining which arriving aircraft may be able to use CDA for a portion of their descent and when they should switch from SDA to CDA and vice versa. Another research possibility would be to analytically identify opportunities to put arriving aircrafts into a holding pattern for a short while if so doing would be result in it being able to use CDA after holding. Calculations could be performed to identify whether the additional fuel burned from holding (or adjustments to en route speed) would be more than compensated by the saved fuel from using CDA. In addition to the work presented in this paper, these research opportunities and others should be explored to improve aviation green operations and ensure air transportation sustainability.

Author Contributions

Conceptualization, L.L.A.-M., E.A.A. and R.J.M.; methodology, L.L.A.-M., E.A.A. and R.J.M.; software, E.A.A. and A.M.W.; validation, L.L.A.-M., R.J.M. and E.A.A.; formal analysis, E.A.A., R.J.M. and A.M.W.; investigation, E.A.A., R.J.M. and A.M.W.; resources, E.A.A.; data curation E.A.A. and A.M.W.; writing—original draft preparation, E.A.A. and R.J.M.; writing—review and editing, R.J.M.; visualization, E.A.A. and A.M.W.; supervision, L.L.A.-M.; project administration, E.A.A. All authors have read and agreed to the published version of the manuscript.

Funding

This research received no external funding.

Institutional Review Board Statement

Not applicable.

Informed Consent Statement

Not applicable.

Conflicts of Interest

The authors declare no conflict of interest.

References

  1. IATA. IATA Forecasts Passenger Demand to Double Over 20 Years. 2016. Available online: http://www.iata.org/pressroom/pr/Pages/2016-10-18-02.aspx (accessed on 10 March 2020).
  2. EPA. EPA Determines That Aircraft Emissions Contribute to Climate Change Endangering Public Health and the Environment. 2016. Available online: https://archive.epa.gov/epa/newsreleases/epa-determines-aircraft-emissions-contribute-climate-change-endangering-public-health-0.html (accessed on 10 March 2020).
  3. European, C. Reducing Emissions from Aviation. 2017. Available online: https://ec.europa.eu/clima/policies/transport/aviation_en (accessed on 11 March 2020).
  4. Dillingham, G.L.; Martin, B. Aviation and the Environment: Results from a Survey of the Nation’s 50 Busiest Commercial Service Airports; US General Accounting Office: Washington, DC, USA, 2000.
  5. Basner, M.; Babisch, W.; Davis, A.; Brink, M.; Clark, C.; Janssen, S.; Stansfeld, S. Auditory and non-auditory effects of noise on health. Lancet 2013, 383, 1325–1332. [Google Scholar] [CrossRef] [Green Version]
  6. Clarke, J.-P.B.; Ho, N.T.; Ren, L.; Brown, J.A.; Elmer, K.R.; Tong, K.-O.; Wat, J.K. Continuous Descent Approach: Design and Flight Test for Louisville International Airport. J. Aircr. 2004, 41, 1054–1066. [Google Scholar] [CrossRef]
  7. Coppenbarger, R.A.; Mead, R.W.; Sweet, D.N. Field Evaluation of the Tailored Arrivals Concept for Datalink-Enabled Continuous Descent Approach. J. Aircr. 2009, 46, 1200–1209. [Google Scholar] [CrossRef]
  8. McNulty, M. Airbus Says Jets Flying Close Behind Each Other Could Reduce Fuel Costs by 10 Percent. 2019. Available online: https://www.foxbusiness.com/lifestyle/airbus-jets-flying-close-reduce-fuel-costs (accessed on 29 November 2019).
  9. Turgut, E.T.; Usanmaz, O.; Canarslanlar, A.O.; Sahin, O. Energy and emission assessments of continuous descent approach. Aircr. Eng. Aerosp. Technol. 2010, 82, 32–38. [Google Scholar] [CrossRef]
  10. Morrell, P.S. Moving Boxes by Air: The Economics of International Air Cargo; Ashgate: Farnham, UK, 2011. [Google Scholar]
  11. Girvin, R. Aircraft noise-abatement and mitigation strategies. J. Air Transp. Manag. 2009, 15, 14–22. [Google Scholar] [CrossRef]
  12. Postorino, M.N.; Mantecchini, L. A systematic approach to assess the effectiveness of airport noise mitigation strategies. J. Air Transp. Manag. 2016, 50, 71–82. [Google Scholar] [CrossRef]
  13. Schroeder, J. A perspective on NASA Ames air traffic management research. In Proceedings of the 9th AIAA Aviation Technology, Integration, and Operations Conference (ATIO) and Aircraft Noise and Emissions Reduction Symposium (ANERS), Hilton Head, SC, USA, 21–23 September 2009. [Google Scholar]
  14. Stibor, J.; Nyberg, A. Implementation of continuous descent approaches at Stockholm Arlanda airport, Sweden. In Proceedings of the 2009 IEEE/AIAA 28th Digital Avionics Systems Conference, Orlando, FL, USA, 23–29 October 2009; pp. 2.C.1-1–2.C.1-13. [Google Scholar] [CrossRef]
  15. Arnaldo Valdés, R.; Pérez Sanz, V.G.C.L. Modeling Advanced Continuous Descent Approach Procedures in Congested Airports. Int. Rev. Aerosp. Eng. 2009, 2, 304–314. [Google Scholar]
  16. Cao, Y.; Rathinam, S.; Sun, D. A Rescheduling Method for Conflict-free Continuous Descent Approach. In Proceedings of the AIAA Guidance, Navigation, and Control Conference, Portland, OR, USA, 8–11 August 2011. [Google Scholar] [CrossRef]
  17. Robinson, J.; Kamgarpour, M. Benefits of Continuous Descent Operations in High-Density Terminal Airspace Under Scheduling Constraints. In Proceedings of the 10th AIAA Aviation Technology, Integration, and Operations (ATIO) Conference, Fort Worth, TX, USA, 13–15 September 2010. [Google Scholar]
  18. Weitz, L.A.; Hurtado, J.E.; Barmore, B.E.; Krishnamurthy, K. An Analysis of Merging and Spacing Operations with Continuous Descent Approaches. In Proceedings of the IEEE 24th Digital Avionics Systems Conference, Washington, DC, USA, 30 October–3 November 2005. [Google Scholar] [CrossRef]
  19. Wilson, I.; Hafner, F. Benefit Assessment of Using Continuous Descent Approaches at Atlanta. In Proceedings of the IEEE 24th Digital Avionics Systems Conference, Washington, DC, USA, 30 October–3 November 2005. [Google Scholar] [CrossRef]
  20. Khardi, S. Mathematical Model for Advanced CDA and Takeoff Procedures Minimizing Aircraft Environmental Impact. Int. Math. Forum 2010, 5, 1747–1774. [Google Scholar]
  21. Sáez, R.; Polishchuk, T.; Schmidt, C.; Hardell, H.; Smetanová, L.; Polishchuk, V.; Prats, X. Automated sequencing and merging with dynamic aircraft arrival routes and speed management for continuous descent operations. Transp. Res. Part C Emerg. Technol. 2021, 132, 103402. [Google Scholar] [CrossRef]
  22. De Jong, P.M.A.; de Gelder, N.; Verhoeven, R.P.M.; Bussink, F.J.L.; Kohrs, R.; van Paassen, R.; Mulder, M. Time and Energy Management During Descent and Approach: Batch Simulation Study. J. Aircr. 2015, 52, 190–203. [Google Scholar] [CrossRef]
  23. Itoh, E.; Wickramasinghe, N.K.; Hirabayashi, H.; Uejima, K.; Fukushima, S. Analyzing Feasibility of Continuous Descent Operation Following Fixed-flight Path Angle from Oceanic Route to Tokyo International Airport. In Proceedings of the AIAA Modeling and Simulation Technologies Conference, San Diego, CA, USA, 4–8 January 2016; p. 0168. [Google Scholar] [CrossRef]
  24. Fricke, H.; Seiß, C.; Herrmann, R. Fuel and Energy Benchmark Analysis of Continuous Descent Operations. Air Traffic Control Q. 2015, 23, 83–108. [Google Scholar] [CrossRef]
  25. Zhao, W.; Alam, S.; Abbass, H.A. Evaluating ground–air network vulnerabilities in an integrated terminal maneuvering area using co-evolutionary computational red teaming. Transp. Res. Part C Emerg. Technol. 2013, 29, 32–54. [Google Scholar] [CrossRef]
  26. Jafari, S.; Nikolaidis, T. Thermal Management Systems for Civil Aircraft Engines: Review, Challenges and Exploring the Future. Appl. Sci. 2018, 8, 2044. [Google Scholar] [CrossRef] [Green Version]
  27. Lai, Y.-C.; Ting, W.O. Design and Implementation of an Optimal Energy Control System for Fixed-Wing Unmanned Aerial Vehicles. Appl. Sci. 2016, 6, 369. [Google Scholar] [CrossRef] [Green Version]
  28. Wubben, F.; Busink, J. Environmental Benefits of Continuous Descent Approaches at Schiphol Airport Compared with Conventional Approach Procedures. 2000. Available online: http://www.conforg.fr/internoise2000/cdrom/data/articles/000281.pdf (accessed on 21 January 2022).
  29. Alam, S.; Nguyen, M.H.; Abbass, H.A.; Lokan, C.; Ellejmi, M.; Kirby, S. A dynamic continuous descent approach methodology for low noise and emission. In Proceedings of the 29th Digital Avionics Systems Conference, Salt Lake City, UT, USA, 3–7 October 2010. [Google Scholar]
  30. Belobaba, P.; Odoni, A.; Barnhart, C. The Global Airline Industry; John Wiley & Sons: West Sussex, UK, 2015. [Google Scholar]
  31. Nolan, M.S. Fundamentals of Air Traffic Control; Brooks/Cole Company: Pacific Grove, CA, USA, 1999. [Google Scholar]
  32. FAA. Instrument Procedures Handbook; U.S. Department of Transportation: Washington, DC, USA, 2015.
  33. Alharbi, E. Airspace Analysis for Greener Operations: Towards More Adoptability and Predictability of Continuous Descent Approach (CDA); Mechanical and Industrial Engineering Department, New Jersey Institute of Technology: Newark, NJ, USA, 2017. [Google Scholar]
  34. FAA. FAA Order JO 7210.3Z—Facility Operation and Administration; U.S. Department of Transportation: Washington, DC, USA, 2015.
  35. De Neufville, R.; Odoni, A.R.; Belobaba, P.P.; Reynolds, T.G. Airport Systems: Planning, Design and Management; McGraw Hill Education: New York, NY, USA, 2013. [Google Scholar]
  36. ICAO (International Civil Aviation Organization). Documentation 4444—Procedures for Air Navigation Services: Air Traffic Management, 16th ed.; ICAO: Montreal, QC, Canada, 2016. [Google Scholar]
  37. DeLaura, R.A.; Ferris, R.F.; Robasky, F.M.; Troxel, S.W.; Underhill, N.K. Initial Assessment of Wind Forecasts for Airport Acceptance Rate (AAR) and Ground Delay Program (GDP) Planning; Project Reprt ATC-414; MIT Lincoln Laboratory: Lexington, MA, USA, 2014. [Google Scholar]
  38. Wei, P.; Chen, J.-T.; Andrisani, D.; Sun, D. Routing Flexible Traffic into Metroplex. In Proceedings of the AIAA Guidance, Navigation, and Control Conference, Portland, OR, USA, 8–11 August 2011. [Google Scholar]
  39. Ramanujam, V.; Balakrishnan, H. Data-Driven Modeling of the Airport Configuration Selection Process. IEEE Trans. Hum.-Mach. Syst. 2015, 45, 490–499. [Google Scholar] [CrossRef] [Green Version]
  40. Nuic, A.; Poles, D.; Mouillet, V. BADA: An advanced aircraft performance model for present and future ATM systems. Int. J. Adapt. Control Signal Process. 2010, 24, 850–866. [Google Scholar] [CrossRef]
  41. Nuic, A. User Manual for the Base of aircraft data (BADA) revision 3.11. Atmosphere 2010, 2010, 1. [Google Scholar]
  42. Hillier, F.S.; Lieberman, G.J. Introduction to Operations Research; McGraw-Hill Higher Education: New York, NY, USA, 2010. [Google Scholar]
  43. Shortle, J.F.; Thompson, J.M.; Gross, D.; Harris, C.M. Fundamentals of Queueing Theory; John Wiley & Sons, Inc.: Hoboken, NJ, USA, 2018. [Google Scholar] [CrossRef]
  44. Taha, H.A. Operations Research: An Introduction; Pearson Education, Inc.: Hoboken, NJ, USA, 2017. [Google Scholar]
  45. Chen, H.; Solak, S. Lower Cost Arrivals for Airlines: Optimal Policies for Managing Runway Operations under Optimized Profile Descent. Prod. Oper. Manag. 2014, 24, 402–420. [Google Scholar] [CrossRef]
Figure 1. Typical structure of a TMA (top view).
Applsci 12 01506 g001
Figure 2. The vertical profile of SDA based on the IAP and approach segments.
Applsci 12 01506 g002
Figure 3. The vertical profile of CDA compared with SDA.
Applsci 12 01506 g003
Figure 4. Evaluation of aircraft landing times with CDA at BNA airport.
Applsci 12 01506 g004
Figure 5. Evaluation of aircraft landing times with SDA at BNA.
Applsci 12 01506 g005
Figure 6. Parameters of our model for aircrafts approaching airports with CDA.
Applsci 12 01506 g006
Figure 7. The number of aircrafts arriving in each time period at BNA airport.
Applsci 12 01506 g007
Figure 8. Capacity of the TMA’s stacking space k.
Applsci 12 01506 g008
Figure 9. Probability of blocking of the two descent methods.
Applsci 12 01506 g009
Table 1. Summary of the Differences between CDA and SDA.
Comparison CriteriaCDASDA
Operational BenefitsReduces noise, emissions, and flight time and improves fuel efficiency.May expedite air traffic during high volumes of arrivals.
FacilitationTactical radar vectoring, published arrival procedures (STAR), or a combination of these.Subject to standard radar vectors with speed and altitude control.
Approach Type Based on Vertical NavigationPerformance path computed by the FMS using idle or near-idle thrust from the TOD point to the first waypoint.Geometric path computed by the FMS between two constrained waypoints.
Sequencing and Separation of Air TrafficRequires more spacing between aircrafts during radar vectoring and early sequencing that may require advanced sequencing tools.Follows separation minima standards based on the sequencing method.
Impact on Airport
Capacity
May reduce airport capacity.No reduction in
airport capacity
Descent InitiationThe pilot initiates descent from a TOD point that is as close to the airport as possible.Normally, the pilot initiates descent from the TOD point at cruise altitude further from the airport than with CDA.
Aircraft Performance: AirspeedSmooth speed profile, although the pilot may occasionally adjust speed at the controller’s request to account or to balance the rate of descent.Fluctuating speed profile as the pilot decelerates before level-off and accelerates to resume descent from a level.
Table 2. ICAO Minimum Wake Turbulence Separation Standards.
Trailing Aircraft
Leading AircraftSeparation in Distance (nmi)Separation in Time (s)
HeavyMediumLightHeavyMediumLight
Heavy456105131158
Medium 34 79105
Light 3 79
Publisher’s Note: MDPI stays neutral with regard to jurisdictional claims in published maps and institutional affiliations.

