Abstract
From the perspective of universal design, signs should be easy to understand for all users. In Japan, tourist information signs have become increasingly multilingual in recent years as the number of tourists from other countries has increased. However, it is not clear whether the current signs are comprehensible to both Japanese and non-Japanese speakers. In this study, field and questionnaire surveys on signs were conducted in Matsue City, a regional city in Japan, and the evaluations of Japanese and non-Japanese speakers were compared. In the field survey, a caption evaluation method was used to evaluate the visual environment, and in the questionnaire survey, the SD method was used to evaluate the signs obtained in the field survey. The results indicated that non-Japanese speakers were more likely to focus on signs, and signs with diagrams and maps were evaluated more positively. In addition, the evaluation structure of signs was found to consist of four elements: “Harmonicity”, “Clarity”, “Visibility”, and “Comprehensibility”. “Harmonicity” was indicated to be as important as “Clarity” and “Visibility”. These results suggest that the replacement of text with diagrams on signs contributes to the improvement of impressions and is particularly effective for non-Japanese speakers.
1. Introduction
Currently, the number of foreign tourists visiting Japan is increasing rapidly [1,2], and in response, the national and local governments have established guidelines for the improvement of information signage and are revising existing signs. However, it is not clear as to what extent these improvements are being promoted in regional cities and how effective they are. Therefore, in this study, evaluations were carried out in Matsue City, a regional city in Japan, on the factors that contribute to the improvement of signs.
The number of international tourists visiting Japan has been increasing since 2010, with the number of international tourists in 2018 approximately 3.3 times greater than in 2010 [3]. In 2020, the spread of COVID-19 reduced the number of tourists by 99% compared to the previous year [4]. However, as the government focuses on attracting more international tourists to increase its income, it is expected that the number of international tourists will increase further once the COVID-19 pandemic has been reduced. One of the most important reasons why the government is targeting an increase in inbound income is to revitalize local economies [5]. As Japan’s declining birth rate and aging population are currently reducing the financial resources of regional cities, the government considers that an increase in income is necessary to help maintain sustainable economic activity in regional cities. However, the majority of inbound revenue is currently concentrated in major urban cities, and the benefits are not sufficiently distributed to important regional cities [4]. Therefore, the improvement of tourist resources in regional cities such as signage and the attraction of more international tourists will help to revitalize the local economy. Keliikoa et al. [6] conducted a study on information signs in Kailua, a suburb of Hawaii, and found that being a cyclist, a woman, and a non-resident were significantly associated with the use of information signs. They also found that both residents and non-residents thought that signs were beneficial to the community [6]. It can be said that the improvement in signs can be beneficial to the local economy by attracting tourists as well as local residents.
As part of its efforts to attract international tourists to Japan, the Japanese government has been developing legislation and programs for the development of multilingual signage since the early 2000s [7,8,9]. One of the methods of developing multilingual signs is to add text for other languages such as English to tourist information signs currently written only in Japanese. Regarding the criteria for multilingual signage, it is indicated that “In principle, signs should be in Japanese, English, and pictograms, and other languages should be considered as necessary” and that “From the viewpoint of the characteristics of the resource and the region, it is desirable to include the necessary languages (e.g., Thai, Russian, etc.), as long as there are no problems with visibility or aesthetics” and it is considered that this will play an important role in accommodating tourists visiting from various countries. Such guidelines for signage have been actively developed not only by the Japanese government, but also by local councils. However, the level of achievement of these improvements differs from city to city, and the actual conditions and effectiveness of these improvements are not clear in regional cities compared to urban cities where improvements and studies are actively being carried out. Figure 1 shows the signs installed in Matsue City, a major city in Shimane Prefecture. The presentation of the signs including multilingual notations differs from one sign to another, and it is necessary to investigate whether signs are being installed where they are needed. In addition, Xie et al. [10] pointed out that there is insufficient quantification of how effective sign systems designed according to the guidelines are in practice. In order to attract international tourists to regional cities, it is necessary to verify the actual conditions and effects of the development not only in major cities, where studies are actively being carried out, but also with regard to regional cities.
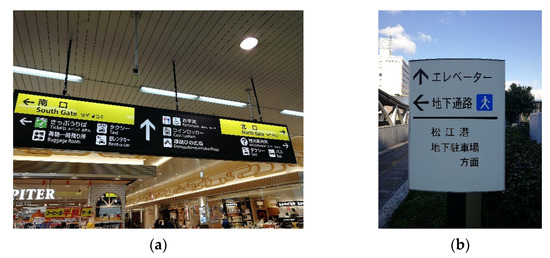
Figure 1.
Signs located at the study site. (a) Example of a sign in the target area with all notations in both English and Japanese and some in Korean and Chinese. (b) Example of a sign in the target area that is only written in Japanese.
Furthermore, if all these languages are written together on a sign, the size of the letters and pictograms becomes too small, and the readability is decreased. Therefore, it is necessary to consider an appropriate notation method for both Japanese and non-Japanese speakers. Specifically, the “comprehensibility” of a signage includes visibility and conspicuity, of which the size of the text is a part. The following factors were included in “comprehensibility”: Conspicuity—the degree to which the eye is drawn to an object in the visual field; Visibility—the degree to which the presence and shape of an object is easily visible; Legibility—the degree to which the appearance and meaning of a sentence can be easily read; Understandability—the degree to which text content is easily understood; and Distinguishability—the degree to which it is easy to recognize objects and scenes [11]. There are many factors that contribute to the comprehension of signs including color, font, and size within the sign alone. In addition, there are factors in the surrounding environment such as the location of the sign and lighting. However, the complexity of signage needs to be limited to prevent excessive cognitive processing, according to Rousek et al. [12] In particular, visually impaired people may miss information or need to move closer to the actual sign [12]. To design a sign that is easily comprehensible regardless of language, gender, age, or physical characteristics, it is necessary to be as inclusive as possible and to make signage as concise as possible.
Considering the recent increase in the number of international tourists visiting Japan, this study focused on the influence of different languages on signs and their relationship with other factors. Leib et al. [13] compared different nationalities with regard to wayfinding at airports and reported that there were clear differences in which sign types were most appropriate and which were preferred. Lee et al. [14] also suggested that there was a significant relationship between sign comprehension and nationality, with some signs being interpreted very differently in different cultures.
However, although the participants in each of these studies were of different nationalities, the language of the signage was English only, so it is not clear how tourists from non-English speaking countries would understand the signage, or how they would evaluate signage in several languages. In a study focusing on the language of the signs, Chew et al. [15] investigated the signage on escalators in Malaysia including the availability of safety information, standardization, and languages used. However, although the percentage of each language used is listed, the influence of language differences on users is not clear. The study by Keliikoa et al. [6] also found in the interviews with residents that there was a need for multilingual signs to help tourists, but the effectiveness of these signs has not been investigated. Therefore, an investigation into the influence of different languages on signage and an evaluation of multilingual signs may be helpful in considering the most suitable signage design for non-English speaking countries or countries with a high number of non-English speaking tourists.
Based on the above study, this study aimed to investigate the following two points.
- The first objective was to investigate how the visual environment is evaluated by different national languages in a regional city tourist destination. Furthermore, the study aimed to investigate the impact of signage on the evaluation of tourist destinations and to identify areas for improvement by examining the proportion of positive and negative evaluations of signage in the evaluation of the visual environment.
- The second was to investigate the effect of the difference in the attention to and impression of signs caused by the difference in native languages and other factors related to the evaluation of signs, in order to collect findings for a universal design that takes into account the different characteristics of tourists.
2. Evaluation I: Comparison of the Visual Environment in National Languages
2.1. Overview of Evaluation I
It is thought that there are differences between Japanese speakers and non-Japanese speakers not only in their responses to signs, but also in the various objects they focus on and their impressions. Therefore, in order to collect the free opinions of Japanese speakers and non-Japanese speakers on the visual environment in general, an evaluation was conducted in Matsue Jouzan Park, a major sightseeing spot in Matsue City, using the caption evaluation method devised by Koga et al. [16,17]. The caption survey method is a method of understanding the characteristics of a target area by having several people walk around the target area, taking photographs of the objects discovered, and summarizing their impressions in a few short, formalized sentences. The caption evaluation method is often used in the field of urban planning because of its ability to collect a wide range of free opinions about the target area.
2.2. Method
2.2.1. Participants
Participants were divided into Japanese-speaking and non-Japanese-speaking groups on the basis of their native language. In order to control for factors other than the content of the survey such as the age of the participants, the participants were selected at Shimane University. Nineteen Japanese speaking students (14 males and five females in their 20s and 30s) and eight non-Japanese speaking students (three males and five females, all in their 20s) joined the evaluation. None of the participants in this evaluation had visual difficulties such as color blindness (color vision deficiency). Five non-Japanese speaking students were from China, and one each from Korea, Taiwan, and Vietnam. Since Taiwan is the most common nationality of international tourists visiting Shimane Prefecture, followed by South Korea, Hong Kong, and China, it is considered that the participants in this evaluation generally reflect the nationality of international tourists in Shimane Prefecture [18]. In addition, because this evaluation assumes a situation in which the participants are visiting the target area for the first time and do not have a detailed understanding of the location, it was confirmed beforehand that the evaluation participants had not visited Matsue Castle prior to this study.
2.2.2. Date and Location of the Evaluation
The evaluation was conducted on a sunny day to avoid the influence of weather. The evaluation for Japanese speakers was conducted on 2 August 2019 (Friday, 16:30–17:30) and the evaluation for non-Japanese speakers was conducted on 27 October 2019 (Sunday, 15:35–16:45). The difference in the time at which the Japanese speakers and non-Japanese speakers were evaluated was adjusted to achieve the same level of visibility because of the interval between the two evaluations. Before each evaluation, the illuminance was checked using an illuminance meter, and it was confirmed that there was no difference.
The evaluation was conducted in Matsue Jouzan Park, located in the area around Matsue Castle. The evaluation area is shown in Figure 2. The area near Matsue Castle and Matsue Jouzan Park is populated with cultural facilities and tourist sites where houses from the Edo period have been well preserved and is one of Matsue City’s most popular tourist spots, attracting many domestic and international visitors [19]. Although there are several buildings such as a castles and shrines in the target area, the objects within the facilities were not included in the target of this evaluation because it was focused on outdoor objects. In order to research the differences between Japanese and non-Japanese speakers focusing not only on signage but also on various other objects, the target of this evaluation was chosen as the visual environment in Matsue Jouzan Park. In this study, the visual environment was defined as all visible objects.
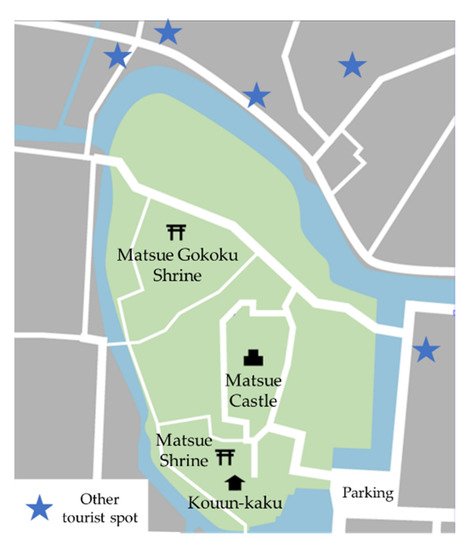
Figure 2.
In and around the study area. The evaluation was carried out in the area colored green.
2.2.3. Procedure
The participants were first provided with instructions for the evaluation and their agreement was confirmed. Subsequently, a map and a bundle of evaluation forms were handed out to the participants, and they were allowed to freely walk around the target area and look for objects of interest. When the participants found an object, they evaluated it according to the items on the evaluation form for the caption evaluation method. The evaluation form is illustrated in Figure 3. The items consisted of a three-point scale in which participants were asked to give their overall impression of the object as “good”, “bad”, or “concern”, and three free-description lines as “Elements (what)”, “Characteristics (which part)”, and “Impressions (how do you feel)” The participants also wrote down the place on the map provided and took photos of the objects with a camera. The participants repeated these steps and walked freely for one hour. By matching the captions with the images taken and the recording locations, the analyst checked which objects the participants had focused on, at which locations, and recorded how they evaluated them.
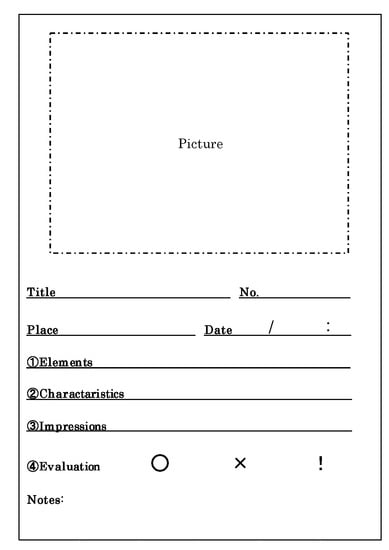
Figure 3.
The evaluation form used in the caption evaluation method. The picture data taken by the participants were attached to the picture section of the form after the survey was completed.
2.3. Result of Evaluation I
2.3.1. Overview of Results
As a result of the evaluation, 148 data records from Japanese speakers and 60 from non-Japanese speakers were obtained, totaling 208 data records. The results of the evaluation of Japanese and non-Japanese speakers are shown in Table 1, and the results of each evaluation are plotted on a map in Figure 4.

Table 1.
Percentage of each evaluation for Japanese speakers and non-Japanese speakers.
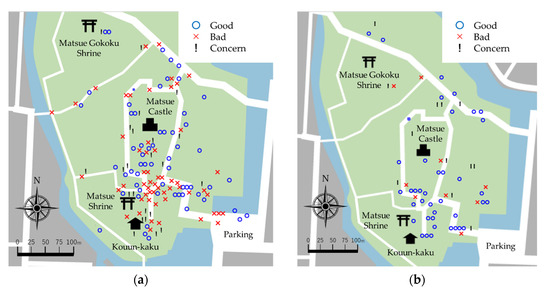
Figure 4.
The results of each evaluation are plotted on a map. (a) Results for Japanese speakers showing more evaluations on the section from the entrance to Matsue Castle than non-Japanese speakers. (b) Results for non-Japanese speakers showing that a wider area was evaluated than the results for Japanese speakers.
Most of the evaluations by Japanese speakers were made on the section from the entrance to Matsue Castle, and significantly more of these objects were evaluated as “bad”. On the other hand, the other routes and the square of Matsue Castle were more frequently evaluated as “good”. In the Japanese speakers’ evaluations, handrails and stairs were the most frequently mentioned objects in addition to signs. The handrails were often evaluated badly by the Japanese speakers, because they were described as “rusty” or “the seal is peeling off”. Regarding the stairs, there were good evaluations such as “there are two types of steps (so it is easy to walk up)”, but there were also bad evaluations such as “the steps are too big” and “the kick up is too big”. The images of the evaluated handrails and stairs are shown in Figure 5. Non-Japanese speakers generally provided “good” evaluations, with particular focus on signs, and there were many language related descriptions such as “English explanations available” and “Japanese only”. The other targets were scattered in general, but there were relatively many evaluations of historical items such as wells and castle walls. Historical objects evaluated by non-Japanese speakers are shown in Figure 6. The reason why most of the Japanese speakers’ evaluations were made on the section from the entrance to Matsue Castle is that many of the Japanese speakers frequently moved along the route from the entrance, where the investigation started, to Matsue Castle, the main tourist spot. On the other hand, the non-Japanese speakers moved around more extensively, each with a different range of movement. The overall trend was that the proportion of good and bad evaluations was similar for Japanese speakers, whereas the proportion of good evaluations was higher than that of bad evaluations for non-Japanese speakers. Therefore, in order to analyze which objects each of them evaluated well or poorly, we categorized the free-description items.
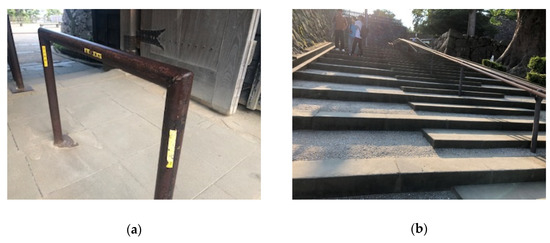
Figure 5.
The images of the evaluated handrails and stairs by Japanese speakers. (a) Handrails evaluated as bad by several Japanese speakers. It was evaluated as uncared for and detrimental to the landscape. (b) The staircase was evaluated as good because it is easy to walk up for Japanese speakers. On the other hand, some people evaluated that the steps were too big.
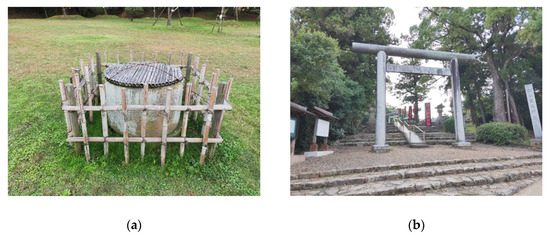
Figure 6.
The images of the evaluated historical objects by non-Japanese speakers. Most of the historical objects were evaluated as good. (a) A well in the center of the square. (b) Torii gate placed at a shrine in Japan.
2.3.2. Classification of Free-Description Items
In order to classify the free-description items, the KJ method was used to categorize the three items of “Elements”, “Characteristics”, and “Impressions” of Japanese speakers and non-Japanese speakers by six to ten analysts. Of the total 208 data records, 204 were included in the analysis excluding four with missing values. Among the free-description items obtained in this evaluation, “Characteristics” and “Impressions” were often described abstractly, and it was considered that the analysts may not agree on the classification. Therefore, following the method of Kojima et al., after the small categories were created by the KJ method, the similarity between them was evaluated at five points, and the medium and large categories were classified by cluster analysis (distance: Euclidean square distance, clustering method: Ward’s method) [20]. As an example, the results of a cluster analysis of elemental items are shown in Figure 7. The classified clusters and data for each cluster for all data are shown in Figure 8.
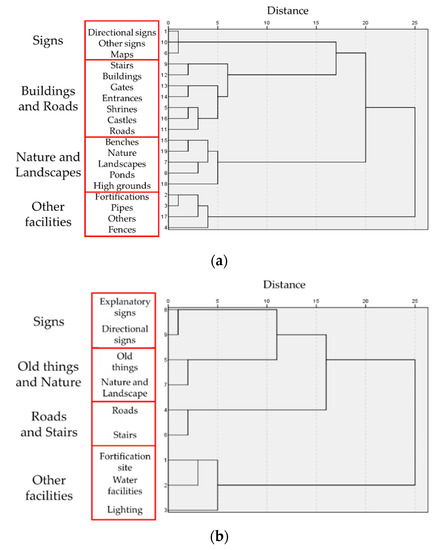
Figure 7.
Clusters classified by elemental items for (a) Japanese speakers and (b) non-Japanese speakers.
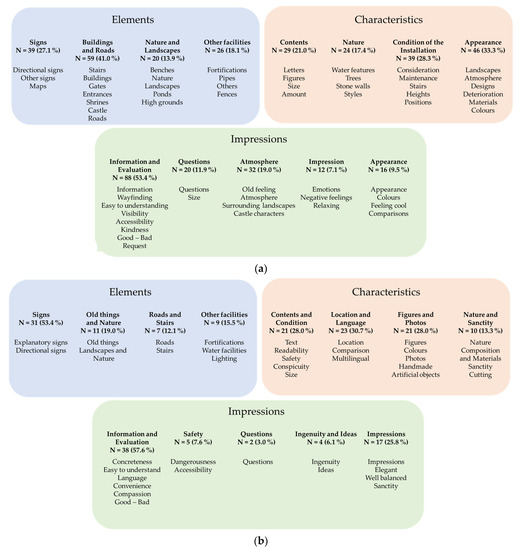
Figure 8.
The classified clusters and the data for each cluster for all data. (a) Results for Japanese speakers. (b) Results for non-Japanese speakers.
A cluster analysis was conducted on 19 sub-categories of factors evaluated by Japanese speakers. The results of the cluster analysis showed that similarity decreased when the distance exceeded ten. Therefore, the clusters that were combined at a distance closer than ten were grouped together, and four clusters were identified. Similarly, a cluster analysis was conducted on nine sub-categories of factors evaluated by non-Japanese speakers. The results of the cluster analysis show that the similarity decreased when the distance exceeded five. Therefore, the clusters that were combined at a distance closer than ten were grouped together, and four clusters were identified for Japanese speakers and for non-Japanese speakers.
As a result of the classification, “Sign”, “Other facilities”, “Information and evaluation”, “Question”, and “Impression” were commonly noted by Japanese speakers and non-Japanese speakers. In particular, the cluster of “signs” showed a high rate of 27.1% among Japanese and 53.4% among foreigners, suggesting that both groups are interested in signs. Similarly, “Information and Evaluation” also showed a high rate for both Japanese and foreigners. In addition, there were some clusters with more subdivided categories such as “Buildings and Roads” for Japanese speakers vs. “Roads and Stairs” for non-Japanese speakers, and “Contents” and “Condition of the installation” for Japanese speakers vs. “Contents and Condition” for non-Japanese speakers. From these subdivided clusters, it can be concluded that the evaluated participants showed a high level of interest in the clusters because of the large number of objects evaluated and the wide range of subject matter.
2.3.3. Relationship between the Clusters and the Evaluations of the Participants
To test the relationship between the clusters and the evaluations of the participants, a χ2 test was conducted. The adjusted residuals were also calculated. As a result of the χ2 test, the results of the Japanese speakers showed a significant difference at the level of 1% in “Elements”, “Characteristics”, and “Impressions” (Elements; χ2(6) = 20.414, p < 0.01) (Characteristics; χ2(6) = 19.662, p < 0.01 and Impressions; χ2(8) = 25.815, p < 0.01). The results for non-Japanese speakers showed a significant difference at the level of 1% for “Elements” and “Impressions” (Elements; χ2(6) = 17.051, p < 0.01 and Impressions; χ2(8) = 25.815, p < 0.01). However, there was no significant difference in “Characteristics” (χ2(6) = 10.259, n.s.). The results of the χ2 test and the adjusted residuals for each cluster are presented in Table 2 and Table 3.
Table 2.
Results of the χ2 test and the adjusted residuals for each cluster of Japanese speakers.
Table 3.
Results of the χ2 test and the adjusted residuals for each cluster of non-Japanese speakers.
The adjusted residuals indicated that there were clusters in which the evaluations were reversed between the Japanese and non-Japanese speakers. In the clusters “Signs” and “Information and Evaluation”, the percentage of bad evaluations was high among Japanese speakers, while the percentage of good evaluations was high among non-Japanese speakers. In addition, the percentage of bad evaluations was low for “Buildings and Roads” among Japanese speakers, while the percentage of good evaluations was low for “Roads and Stairs” among non-Japanese speakers.
2.4. Consideration of Evaluation I
As shown in Figure 8, a high percentage of both Japanese and non-Japanese speakers focused on signs. In particular, about half of the evaluations of non-Japanese speakers were for signs, suggesting that they were actively seeking signs. However, Japanese speakers and non-Japanese speakers showed opposite tendencies in terms of their impressions when they evaluated the signs. Table 2 shows that the percentage of bad evaluations was high among Japanese speakers, while the percentage of good evaluations was high among non-Japanese speakers. There are two possible reasons for this finding. The first is the evaluation of the figures and pictures on signs. In Table 3, the percentage of the good evaluation of “Figures and Photos” was high among non-Japanese speakers, which means that the presence of a figure or photo on the sign may have been evaluated as good and easy to understand. The second is an evaluation of the content and condition of the sign. In Figure 8, the clusters that were combined into one cluster, “Contents and Installation”, in the results for non-Japanese speakers, were separated into two clusters, “Contents” and “Condition of the installation”, in the results for Japanese speakers. This suggests that Japanese speakers focused more on the details of the content and condition of the sign and evaluated it more negatively.
Other than signs, roads and stairs were the other areas where the evaluations were reversed. In Table 2 and Table 3, “Roads and Stairs” were identified independently in the results of the non-Japanese speakers, with a high percentage of bad evaluations. Additionally, “Safety’ also had a high percentage of bad evaluations. This suggests that non-Japanese speakers were more concerned about accessibility and safety, which may have influenced their evaluations. In addition, the objects that remind us of the historical past such as the stone walls and buildings of Matsue Castle were highly evaluated by both Japanese and non-Japanese speakers. The Matsue Castle is a historical building designated as a national treasure, so it is understandable that the participants would pay more attention to objects that remind them of the historical past. This result was also found for nature, suggesting that the natural environment may have a good influence on the evaluation of a tourist destination to the same extent as the main object of the destination.
The results showed that Japanese speakers and non-Japanese speakers differed in their evaluation of the signs, with Japanese speakers evaluating the condition and content of the signs, while non-Japanese speakers evaluated the presence of graphics and photographs. However, it is not clear how these differences affect the impression of signs. Therefore, in Evaluation II, we investigated how the elements of signs affect the impressions of Japanese and non-Japanese speakers.
3. Evaluation II: Factors Affecting the Evaluation of Signs
3.1. Overview of Evaluation II
The purpose of Evaluation II was to understand what factors of signs affect the impression evaluation of Japanese speakers and non-Japanese speakers. For this purpose, a questionnaire survey was conducted to investigate the influence of different factors in the impression evaluation when presented with sign images.
3.2. Method
3.2.1. Participants and Location of Evaluation
Participants were selected from Shimane University using the same criteria as in Evaluation I. Twenty-one Japanese-speaking students (11 males and 10 females, teens to 20s) and 15 non-Japanese speaking students (8 males and 7 females, teens to 20s) belonging to Shimane University participated in the evaluation. The evaluation for Japanese speaking students was conducted in Lecture Room 11, Building 1, Faculty of Science and Technology, Shimane University on 13 December 2019 (Friday, 10:25–10:40), and the evaluation for non-Japanese speaking students was conducted in Room 402, Building 2, Liberal Arts Building, Shimane University on 16 December 2019 (Monday, 10:25–10:40).
3.2.2. Procedure
A questionnaire consisting of six forms of responses and six forms of presentation of sign images was distributed to the participants. The forms of response and the presentation of sign images were each labeled with a corresponding number. The participants were instructed to write their impressions on the forms of response while referring to the corresponding numbered pages of the sign images.
The images used were selected from among the images of signs taken by the participants in Evaluation I. The three analysts discussed and selected six images. The factors of each sign image were the category (directional sign/information sign), the amount of text (lots or little), and the presence of a pictogram (present/absent). For the categories, directional signs are defined as “signs indicating the direction of an object with an arrow and a place name” and information signs are defined as “signs indicating an object in the surroundings with a map and a place name”, referring to the “Shimane Tourist Information Sign Guidelines” [7]. In the case of information signs, the amount of text and the presence of pictograms were not taken into consideration because the map is considered to be the main information. Selected sign images and details are shown in Figure 9.
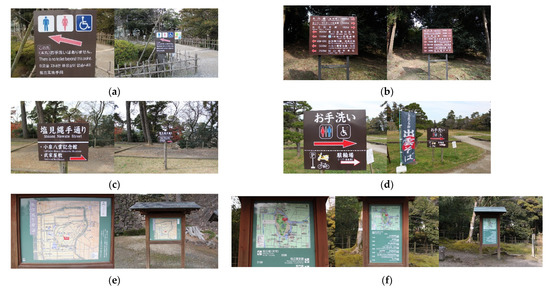
Figure 9.
Sign images shown to the participants in the impression evaluation. On the left is a close view and on the right is a whole view. In Sign 6 only, the left side is a close view, the middle one is a middle view, and the right one is a whole view. (a) Sign 1 (category; directional sign, amount of text; lots, the presence of a pictogram; present). (b) Sign 2 (category; directional sign, amount of text; lots, the presence of a pictogram; absent). (c) Sign 3 (category; directional sign, amount of text; little, the presence of a pictogram; absent). (d) Sign 4 (category; directional sign, amount of text; little, the presence of a pictogram; present). (e) Sign 5 (category; information sign). (f) Sign 6 (category; information sign).
The images of Signs 1 to 5 were taken at distances of 1 m and 3 m in order to show the whole view and the close view. The image of Sign 6 was taken from a distance of 5 m in addition to the distances of 1 m and 3 m, because the entire view could not be captured. The f-stop and ISO were fixed at 3.5 and 400, respectively, and the shutter speed was adjusted within the range of 1/200 to 1/1600, in order to equalize the light intensity of each image.
In the SD method (semantic differential method), 20 adjectives were chosen as terms used to evaluate impressions. To evaluate the overall impression of the signs, an additional “good—bad” item was added, making a total of 21 items used. Table 4 lists the selected items. All results were on a bi-polar 5-point scale, with three being the middle.
Table 4.
Twenty items used for the SD method to evaluate impressions.
3.3. Results of Evaluation II
3.3.1. Overview of the Results of the SD Method
First, each item of the SD method was scored. Figure 10 shows the results of comparing the scores of Japanese and non-Japanese speakers for each item. The results suggest that non-Japanese speakers evaluated the signs more highly than Japanese speakers because they gave higher evaluations for several items sch as “easy to understand–difficult to understand” and “clear–unclear”. On the other hand, both Japanese and non-Japanese speakers evaluated “dynamic–static” and “flashy–sober” items lower than a score of 3, suggesting that both Japanese and non-Japanese speakers evaluated the signs as providing a calming atmosphere.
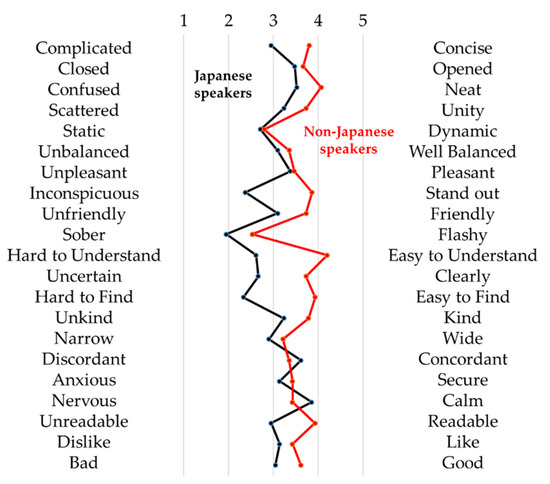
Figure 10.
Average scores for each item used for the SD method for Japanese and non-Japanese speakers.
3.3.2. Analysis of the Evaluation Structure by Factor Analysis
In order to analyze the evaluation structure of the participants, a factor analysis (Estimation method: maximum likelihood method, Rotation method: Promax rotation) was conducted on the 20 items of the SD method excluding the “Good–Bad” item, which is the overall evaluation. Of the total 216 data, 209 were analyzed excluding seven with missing values.
As a result of factor analysis, four factors were identified: “Harmonicity”, “Clarity”, “Visibility”, and “Comprehensibility”. The cumulative contribution ratio of the factors was 61.006%, indicating that the structure of the factors can explain the overall structure to a certain extent. Since there were two items that showed similar loadings on several factors, these were deleted, and 18 items were included in the following analysis. The factor loadings for each item and the inter-factor correlations are listed in Table 5.
Table 5.
Factor loadings for each item and the inter-factor correlations.
3.3.3. Analysis of Causal Relationships between Factors by Multiple Regression Analysis
In order to analyze how the identified factors affect the evaluation of the signs, a multiple regression analysis was conducted (Dependent variable: “good–bad”, Independent variables: “Harmonicity”, “Clarity”, “Visibility”, “Comprehensibility”; Variable selecting method: forced input method). The results of the multiple regression analysis are shown in Table 6, and the path diagram is shown in Figure 11.
Table 6.
The results of the multiple regression analysis.
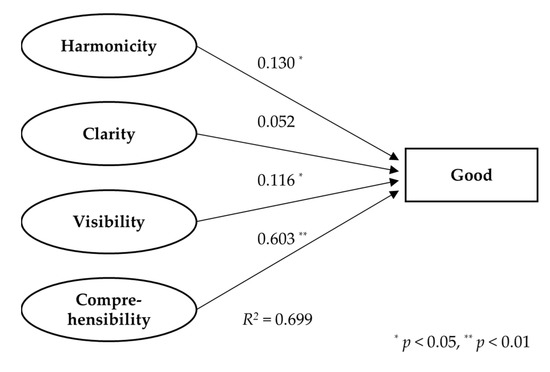
Figure 11.
Path diagram for the multiple regression model. Evaluation of the signs is strongly influenced by “Comprehensibility” and less influenced by other factors.
The results showed that the standard partial regression coefficient for “Comprehensibility” was high (0.603), while the standard partial regression coefficients for “Harmonicity”, “Clarity”, and “Visibility” were all low. These three factors were moderately correlated with “Comprehensibility”, suggesting that they have an influence on “Comprehensibility”. Therefore, the multiple regression model was modified and analyzed again in order to examine the relationship between “Harmonicity”, “Clarity”, “Visibility”, and “Comprehensibility”.
The modified model consisted of a single regression analysis (Dependent variable: “Good–Bad”, Independent variable: “Comprehensibility”) and a multiple regression analysis (Dependent variable: “Comprehensibility”, Independent variables: “Harmonicity”, “Clarity”, “Visibility”: Variable selection method: forced input method). The results of the modified multiple regression analysis are shown in Table 7, and the modified path diagram is shown in Figure 12.
Table 7.
The results of the modified multiple regression analysis.
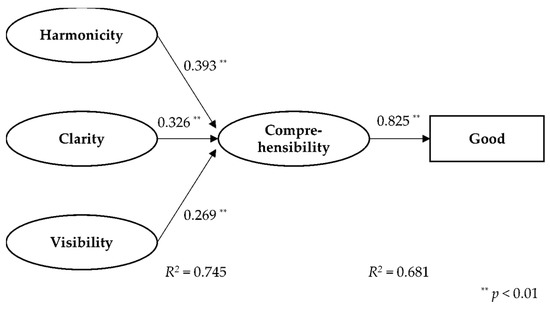
Figure 12.
Modified path diagram for the multiple regression model. The evaluation of the signs is strongly influenced by “Comprehensibility”, and other factors had the same level of influence on the “Comprehensibility” of the sign.
The results show that the coefficient of determination and the multiple coefficients of determination were R2 = 0.681 and 0.745, respectively, and all the standard partial regression coefficients were significantly different at the 1% level. Therefore, it is considered that the modified model can explain the evaluation structure of the participants’ impressions. This indicates that the evaluation of signs is based on the evaluation of “Harmonicity”, “Clarity”, and “Visibility”, and that these evaluations affect the evaluation of “Comprehensibility”. In addition, the standard partial regression coefficients of “Harmonicity”, “Clarity”, and “Visibility” indicated that the effects of all the items on “Comprehensibility” were similar.
3.3.4. Analysis of the Relationship between Individual Factors and Evaluation Using Analysis of Variance
In order to analyze the relationship between individual factors and the evaluations, an analysis of variance was conducted with “Good–Bad” as the dependent variable and “Gender” and “Native language” as the independent variables. The results showed a significant trend in the interaction between gender and native language, indicating that the evaluations of Japanese-speaking women were lower than those of non-Japanese-speaking women (F (1, 208) = 3.307, p < 0.10). The results for each native language and gender are shown in Figure 13.
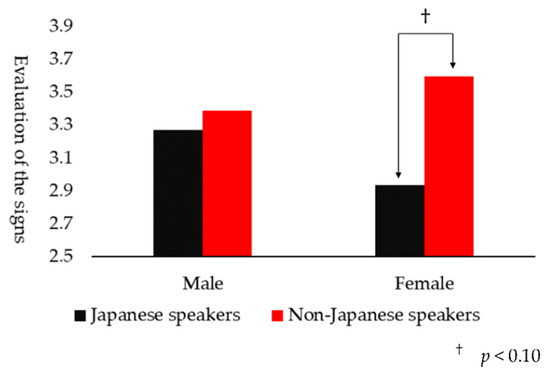
Figure 13.
Comparison of sign evaluation by gender and native language. The evaluations of Japanese-speaking women were significantly lower than those of non-Japanese-speaking women.
Since the results of the analysis of variance indicated that Japanese-speaking females had a lower evaluation of signs, the effect of sign factors on the evaluation structure by gender was analyzed. For each of the males and females, an analysis of variance was conducted with the three factors of “Harmonicity”, “Clarity”, and “Visibility” as dependent variables and “Amount of text” and “Pictogram presence” as independent variables. A summary of the results is provided in Table 8.
Table 8.
Comparison of factors influencing “Comprehensibility” by gender.
There was a significant difference of 1% for the amount of text in all conditions for both males and females, and the evaluations were higher for less text than for more text. For the “Clarity” factor, there was a significant trend in the interaction between the amount of text and the pictogram for males, and a significant difference at the 5% level for females. In both cases, the higher the amount of text and the presence of a pictogram, the lower the evaluation. The results show that the amount of text had an effect on Harmonicity, Clarity and Visibility. With a large amount of text and no pictograms, “Visibility” decreased for both Japanese speakers and non-Japanese speakers, although the amount of decrease was different between males and females.
3.4. Consideration of Evaluation II
Among the factors identified by the factor analysis, “Visibility” is considered to correspond to the conspicuity and visibility of the previous studies, “Clarity” to the readability of the previous studies, and “Comprehensibility” to the legibility of the previous studies. On the other hand, the “Discordant–Concordant” items of “Harmonicity” corresponded to the distinguishability of the previous studies, while the “Well balanced–Unbalanced” items were considered to be related to the design layout within the sign and the “calm–nervous” items to be influenced by the surrounding environment. This suggests that, contrary to other factors, the factor “Harmonicity” is composed of several aspects.
“Clarity” and “Visibility” are traditionally considered important in the evaluation of signs. However, Figure 12 shows that “Harmonicity” is equally important. It is necessary to investigate the details of “Harmonicity” in the future, because the “Harmonicity” identified in this evaluation is composed of several aspects. Therefore, it is important to plan signage not only from the viewpoint of “Visibility”, but also from the viewpoint of the layout and surrounding environment.
In Table 8, signs with a large amount of text were evaluated lower than those with less text, suggesting that it is necessary to consider the amount of text and white space when selecting the information to be displayed on signs. In addition, the evaluations of “Clarity” of the signs with a large amount of text and without pictograms decreased,, the decrease being especially large for women. In light of the above, the lowest evaluated sign among the signage presented to the participants in Evaluation II was Sign 2. The reason for this may be that Sign 2 was considered to be difficult to read, especially for non-Japanese speaking women because of the large amount of text, especially in English, which is also written in a smaller font size. Therefore, reorganizing the information by dividing the sign and adding pictograms, it may be possible to increase “Clarity”, “Visibility”, and “Harmonicity” of the sign and improve the evaluation of both Japanese and non-Japanese speakers. The improvement plan of the sign is shown in Figure 14.
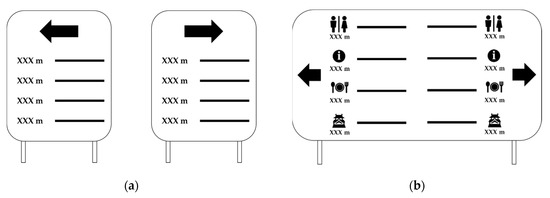
Figure 14.
Improvement plan of Sign 2, which was evaluated as the most difficult to read. (a) An example of dividing a sign and reorganizing too much information. (b) An example of adding a pictogram to make the information easier to recognize.
4. Discussion
In this study, a field survey was conducted with the aim of investigating how the visual environment at a tourist destination in a regional city is evaluated by different languages and to investigate the impact of signage on the evaluation of the tourist destination. In addition, a questionnaire survey was conducted with the aim of investigating the effects of different national languages on the evaluation of signs such as differences in attention to and impressions of signs, and to collect findings for a universal design taking into account the different characteristics of tourists.
The main findings of this study on tourist information signage is listed below.
- When designing signage, not only visibility and clarity, but also the layout and consideration of the surrounding environment should all be of equal importance.
- The difference between Japanese and non-Japanese speakers was that Japanese speakers tended to focus on the details of the sign, while non-Japanese speakers focused on whether the sign was clearly depicted with diagrams and pictures.
- In common with Japanese speakers and non-Japanese speakers, signs with smaller letters were evaluated lower in the factors: “Visibility”, “Clarity”, and “Harmonicity”.
- Compared to Japanese speakers, non-Japanese speakers placed more importance on accessibility, and wayfinding or having difficulty walking affected their evaluation.
As mentioned in the introduction, the Japanese government is currently promoting multilingual signs, but the above results suggest that it may be better to avoid the easy shift to multilingual signs. It would be better to use other methods such as creating separate signs in Japanese and foreign languages, using pictograms effectively to make signs understandable without foreign language notation, and using ICT technology to enable non-Japanese speakers to view additional information, rather than making all signs multilingual. In some cases, it may be possible to improve signs for non-Japanese speakers while maintaining clarity and visibility. In the future, based on these findings, it will be necessary to conduct a demonstration experiment to verify whether there is a change in the impression of tourists by actually proposing improvements to the signage as shown in Figure 14. Moreover, although this study focused on outdoor signs, indoor signs are considered to be different from outdoor signs in various aspects such as the size of the letters used and the information provided. Therefore, it is necessary to investigate indoor signs in a similar way.
5. Conclusions
Although it is considered that the nationality and cultural background of users influence their comprehension of information signs, studies on the differences in sign languages have not yet been analysed in detail and more knowledge is needed. In order to study multilingual signs in particular, this study investigated whether the evaluation of signs was influenced by differences in the native language, and what factors were related to this evaluation. The results showed that Japanese speakers and non-Japanese speakers differed in their focus on the sign, while a common feature of both groups was that they rated the sign lower when there was too many text. Although this study investigated Shimane Prefecture in Japan as an example of a regional city tourist destination, the findings of this study are transferable to other non-English speaking regions, and are particularly useful for regions with a high proportion of tourists. In particular, the finding obtained in Evaluation II that harmonicity influences the evaluation of signs to the same extent as visibility and clarity is a unique result compared to other studies, and suggests that it may have a significant impact on the future development of tourist destinations.
Author Contributions
Conceptualization, J.H.; Formal analysis, K.S.; Investigation, K.S.; Methodology, K.S.; Supervision, J.H.; Visualization, J.H.; Writing—original draft, K.S.; Writing—review & editing, J.H. All authors have read and agreed to the published version of the manuscript.
Funding
This research received no external funding.
Institutional Review Board Statement
Not applicable.
Informed Consent Statement
Informed consent was obtained from all subjects involved in the study.
Data Availability Statement
Not applicable.
Acknowledgments
We would like to express our deepest gratitude to the Matsue Castle Tourism Facilities Division and the Shimane University International Exchange Center for their cooperation in this research.
Conflicts of Interest
The authors declare no conflict of interest.
References
- Comerio, N.; Pacicco, F.; Serati, M. An Analysis of Sub-National Tourism in Japan: Tourist and Economic Spillovers and Their Determinants. Ann. Tour. Res. 2020, 85, 102881. [Google Scholar] [CrossRef]
- Kataoka, H.; Hashiguchi, K.; Wago, K.; Ichikawa, Y.; Tezuka, H.; Yamashita, S.; Kuhara, Y.; Akiyama, T. Dynamic Guide Signs Control Pedestrians of Public Facilities. In UbiComp ’16: Proceedings of the 2016 ACM International Joint Conference on Pervasive and Ubiquitous Computing; ACM: New York, NY, USA, 2016. [Google Scholar]
- JTB Tourism Research & Consulting Co. Japan-Bound Statistics Tourism Statistics. Available online: https://www.tourism.jp/en/tourism-database/stats/inbound/ (accessed on 25 December 2021).
- Director-General for Policy (Economic and Fiscal Analysis), Cabinet Office. Regional Economies 2018. Available online: https://www5.cao.go.jp/j-j/cr/cr18/cr18.html (accessed on 25 December 2021).
- Secretariat of the Headquarters for the Promotion of Administrative Reform, Cabinet Secretariat. Regional Revitalisation (General Discussion and Focus on Tourism and Inbound). Available online: https://www.gyoukaku.go.jp/review/aki/r01tokyo/img/g6.pdf (accessed on 25 December 2021).
- Keliikoa, L.B.; Packard, M.Y.; Hansen Smith, H.; Kim, I.N.; Akasaki, K.A.; Stupplebeen, D.A. Evaluation of a Community Wayfinding Signage Project in Hawaii: Perspectives of Pedestrians and Bicyclists. J. Transp. Health 2018, 11, 25–33. [Google Scholar] [CrossRef]
- Tourism Promotion Division, Shimane Prefecture. A Stripe, Tourist Information Signature Guideline. Available online: https://www.pref.shimane.lg.jp/tourism/tourist/kankou/jigyo/guidelines/ (accessed on 25 December 2021).
- Japan Tourism Agency. Guidelines for Tourism Promotion Signs; Japan Tourism Agency: Tokyo, Japan, 2005.
- Japan Tourism Agency. Guidelines for Improving and Reinforcing Multilingual Support for a Tourism-Based Nation; Japan Tourism Agency: Tokyo, Japan, 2014.
- Xie, H.; Filippidis, L.; Galea, E.R.; Blackshields, D.; Lawrence, P.J. Experimental Analysis of the Effectiveness of Emergency Signage and Its Implementation in Evacuation Simulation. Fire Mater. 2012, 36, 367–382. [Google Scholar] [CrossRef]
- Sasaki, M.; Kawabata, Y.; Kawabata, M. A Study on the Ease of Identifying Public Signs from the Perspective of Visual Cognition; The Imaging Society of Japan: Tokyo, Japan, 2014. [Google Scholar]
- Rousek, J.B.; Hallbeck, M.S. Improving and Analyzing Signage within a Healthcare Setting. Appl. Ergon. 2011, 42, 771–784. [Google Scholar] [CrossRef] [PubMed]
- Leib, S.; Dillman, B.; Petrin, D.; Young, J. A Comparison of the Effect of Variations to U.S. Airport Terminal Signage on the Successful Wayfinding of Chinese and American Cultural Groups. J. Aviat. Technol. Eng. 2012, 1, 79–89. [Google Scholar] [CrossRef][Green Version]
- Lee, S.; Dazkir, S.S.; Paik, H.S.; Coskun, A. Comprehensibility of Universal Healthcare Symbols for Wayfinding in healthcare Facilities. Appl. Ergon. 2014, 45, 878–885. [Google Scholar] [CrossRef] [PubMed]
- Chew, C.-C.; Chang, C.-T.; Lim, X.-J.; Ibrahim, H.-A.; Azmi, H.; Wahabi, N.-I.; Hamdan, N.-S.; Nazan, N.-A.; Karim, N.-H.; Malawi, N.-A.; et al. The Quality of Escalator Signage for Public Safety in Malaysia: An Observational Study. Glob. Health J. 2021, 5, 198–203. [Google Scholar] [CrossRef]
- Koga, T.; Taka, A.; Munakata, J.; Kojima, T.; Hirate, K.; Yasuoka, M. Kyapusyonhyouka. Archit. Inst. Jpn. J. Archit. Plan. 1999, 64, 79–84. [Google Scholar] [CrossRef]
- Ikeda, Y.; Tsujimura, S.; Sano, T.; Yasue, M.; Imanishi, M.; Hirate, K. A Study on the Evaluation Construct of Sign at the Station. J. Archit. Plan. 2017, 82, 2799–2806. [Google Scholar] [CrossRef][Green Version]
- Fun Japan Communications Ltd. Inbound and Outbound Tourist Data and Travel Trends in Shimane Prefecture. Available online: https://fj-com.co.jp/articles/47%e9%83%bd%e9%81%93%e5%ba%9c%e7%9c%8c%e3%82%a4%e3%83%b3%e3%83%90%e3%82%a6%e3%83%b3%e3%83%89/2340/ (accessed on 25 December 2021).
- The San in Chuo Simpo Newspaper Co., Ltd. Buke Yashiki (Matsue) Samurai Residence. Available online: https://www.matsue-bukeyashiki.jp/en/index.html (accessed on 25 December 2021).
- Kojima, T.; Koga, T.; Munakata, J.; Hirate, K. Multivariate Analysis on Verbal Data of “Caption Evaluation Method”. Studies of the Cognition and the Evaluation of Townscape Part 2. Archit. Inst. Jpn. J. Archit. Plan. 2002, 67, 51–58. [Google Scholar] [CrossRef][Green Version]


Publisher’s Note: MDPI stays neutral with regard to jurisdictional claims in published maps and institutional affiliations. |
© 2022 by the authors. Licensee MDPI, Basel, Switzerland. This article is an open access article distributed under the terms and conditions of the Creative Commons Attribution (CC BY) license (https://creativecommons.org/licenses/by/4.0/).