1. Introduction
In recent years, users have been exposed to a large volume of multimedia contents due to the emergence of Over-the-Top (OTT) platforms such as Netflix and Disney Plus, highlighting the importance of developing content recommender systems that identify users’ tastes from their daily usage logs and recommend serendipitous contents that users may potentially like, so that users are can be stayed and tuned longer on the OTT platform services.
The most well-known recommendation strategy of commercial OTT services is to use users’ rating data, which is then fed for collaborative filtering [
1]. However, the taste of movies can be represented in various types of experiences other than the rating scores, and those experiences are often defined as Cinematic Experience (CX) [
2]. Generally, it is a concept that refers to the interplay between inner mental reality and outer material reality when watching a movie. Specifically, it refers to the environment that immerses a movie or the psychological context and aftertaste when watching a movie, meaning that CX would require more numerical and categorical forms such as sentiment and emotion of the users, to be used for contents recommendation.
One of the representative data that can reflect the user’s CX are sentiment and emotion, and they are collected and used individually for personalized recommendations by OTT platforms. For instance, Youtube collects not only the sentiment feedback via five-point scales from negative to positive but also the emotion feedback by asking users about their feelings after watching the recommended item. Similarly, some of previous studies have shown that sentiment or emotion information improves recommendation performance [
1,
3,
4]. However, to the best of our understanding, no studies have used both of these two CX elements simultaneously for a recommender system.
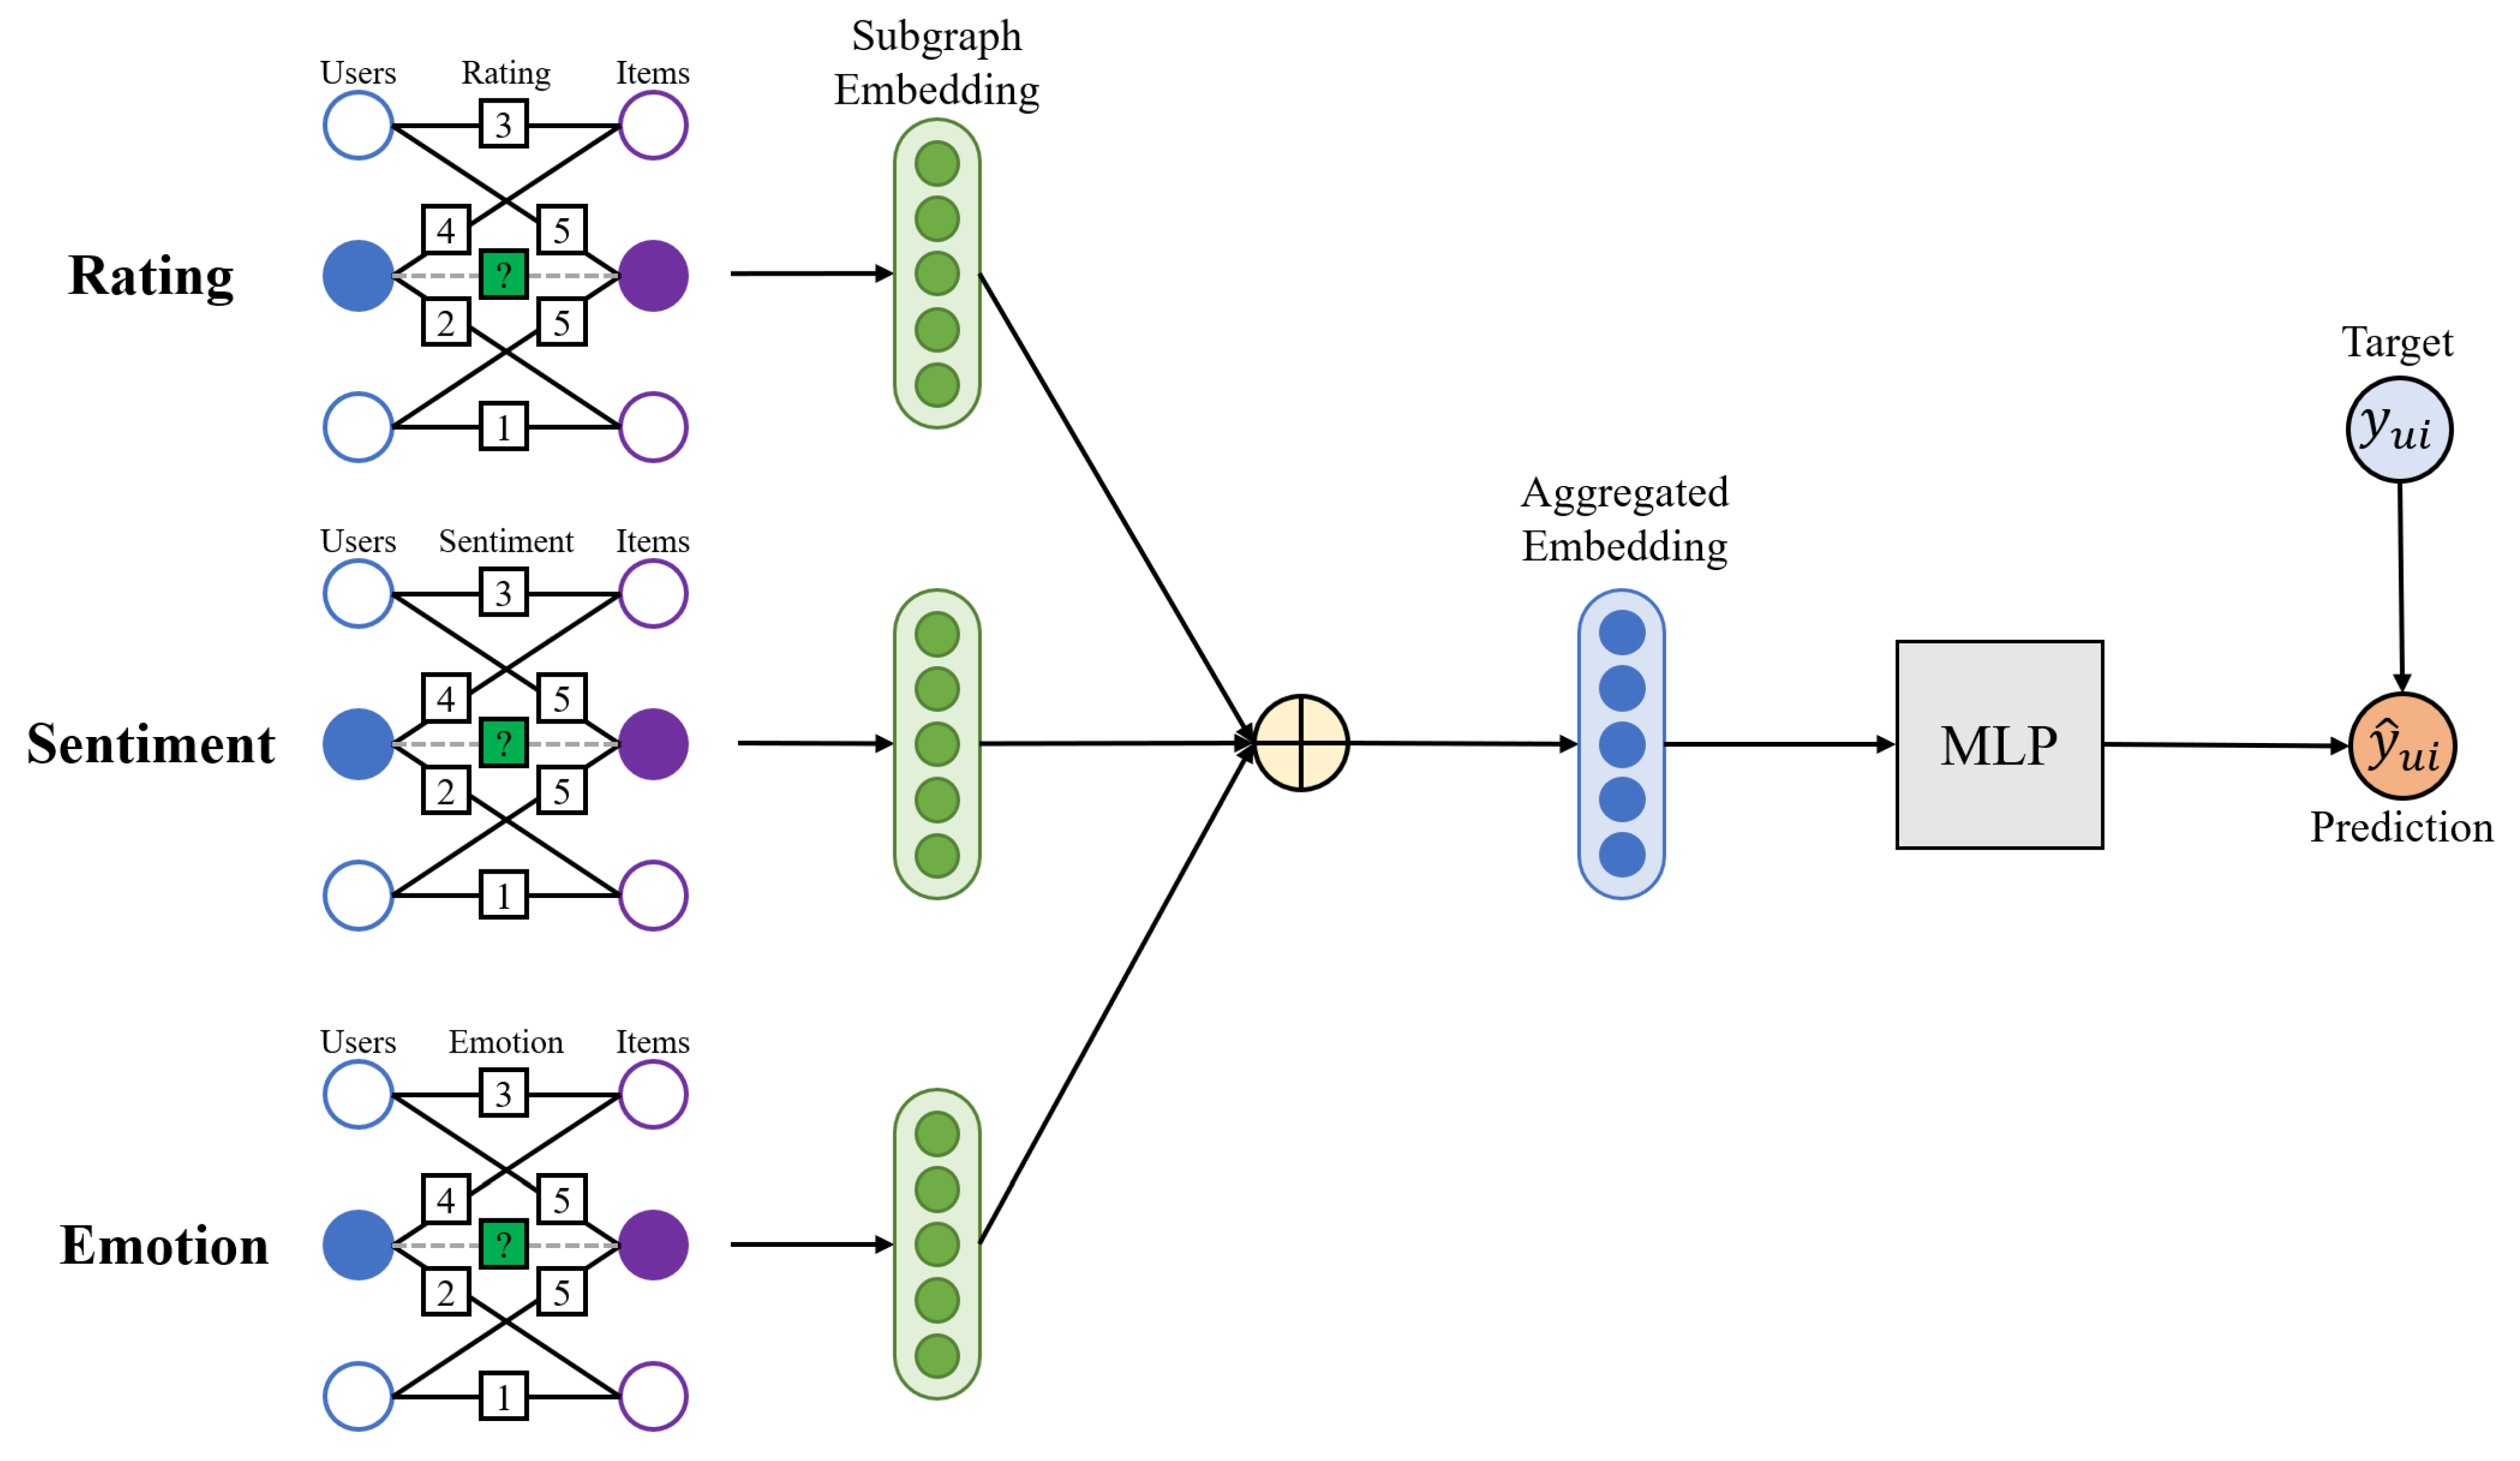
In fact, sentiment and emotion are clearly distinguished in two measurement types: ordinal type and categorical type. First, sentiment typically divides the user’s positive and negative feelings into five levels, such as negative, somewhat negative, neutral, somewhat positive, and positive, and it is characterized by having an order. Second, emotion commonly divides the user’s psychological feelings into six levels, such as anger, fear, joy, love, sadness, and surprise; and it is characterized by having categories without orders. The dimension difference between the sentiment and emotion has challenged combining these data together for further recommendation, addressing the need of exploiting new approaches to embed multiple CX experiences into one dimension to enhance the user retention on the OTT platforms.
Recently, the recommendation method, which constructs the interaction between user and movie in a graph and reflects metadata and relations through the graph-natural-network (GNN), has become popular [
5,
6,
7,
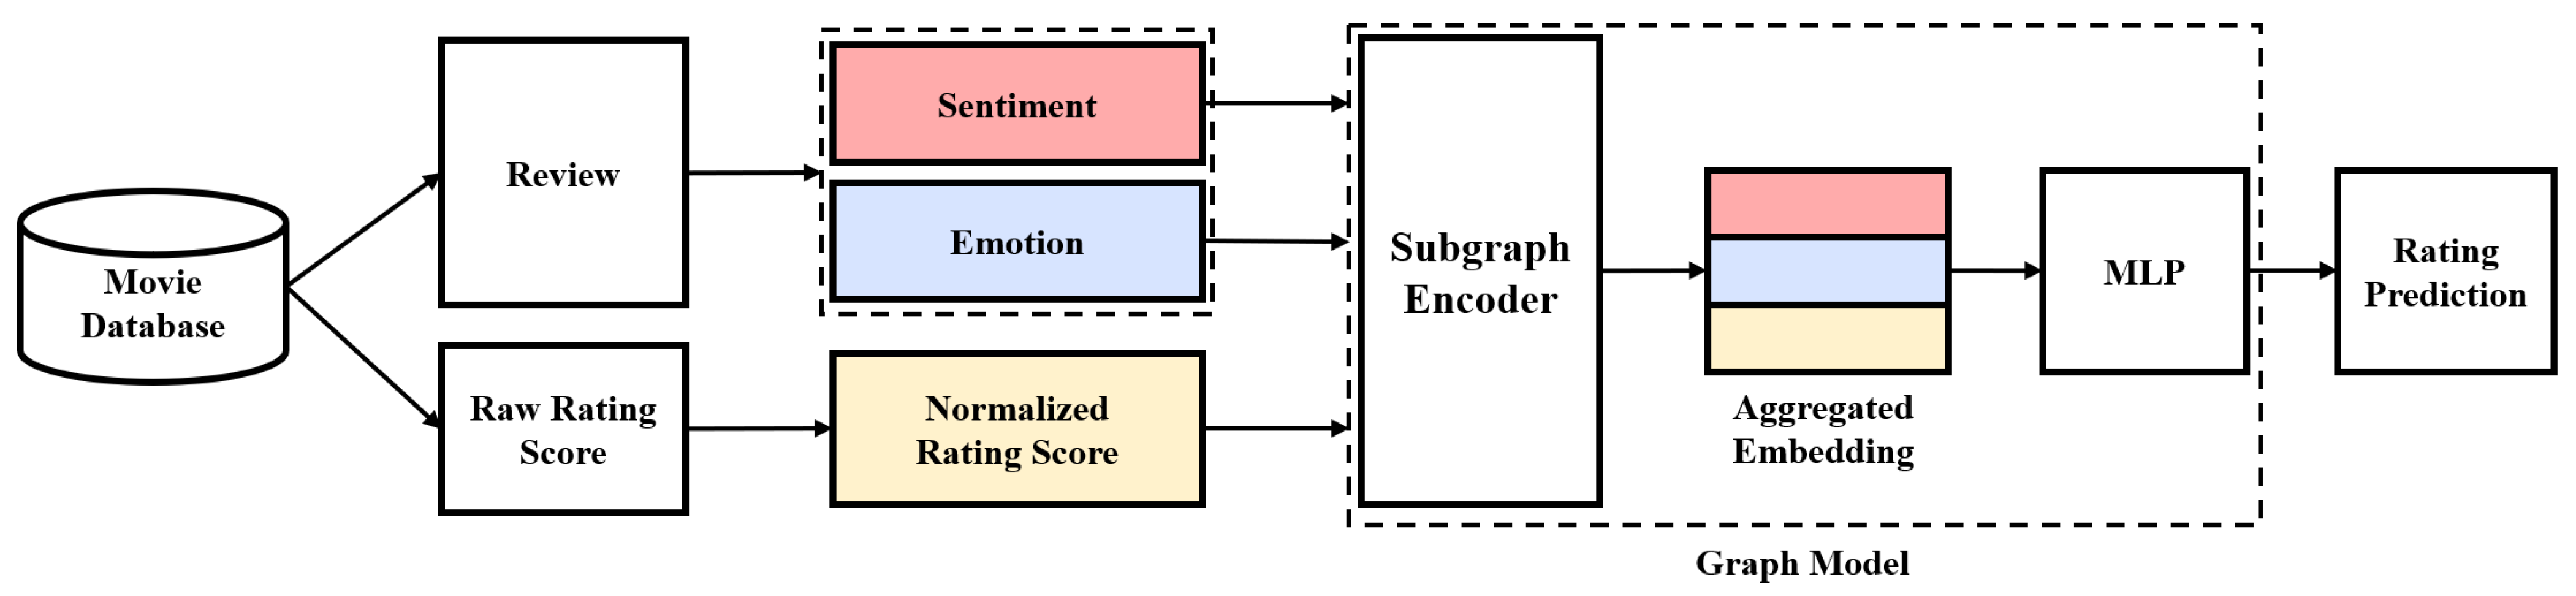
8]. In this paper, we propose a new graph-based movie recommender system with BERT, which utilizes all of the rating, sentiment, and emotion information by considering the differences of the information in different dimensions. Inductive Graph-based Matrix Completion (IGMC) [
6] is a link prediction method that transforms the rating matrix of user–item into a bipartite graph and predicts missing rating using subgraph embeddings. It is worth noting that the proposed model obtains user’s psychological context using fine-tuned BERT for sentiment and emotion, and predicts final ratings using IGMC by combining BERT results and rating information into a subgraph. Using Rotten Tomato movie data (
https://www.rottentomatoes.com/, data accessed 13 September 2021) and Amazon review data (
http://jmcauley.ucsd.edu/data/amazon/, data accessed 20 September 2021) [
9,
10], our experiment was conducted with baselines widely used in existing recommender systems. Throughout the experiment, we observed that CX information and IGMC-based models outperformed the baselines.
In summary, our contributions in this paper can be summarized as follows:
We build a stacking ensemble recommender system that exploits both the ordinal and categorical CX features by exploiting BERT and IGMC approaches simultaneously.
We further investigate individual effects of sentiment and emotion features by adding the features into the proposed model sequentially.
By adopting the stacking ensemble approach that predicts the sentiment and emotions from multiple fine-tuned BERTs, and further exploits the results for the final prediction, we achieve higher effectiveness compared to the state-of-the-art recommendation baselines.
The remainder of this paper is structured as follows:
Section 2 reviews related studies and
Section 3 describes the procedure of the proposed model for content recommendation.
Section 4 demonstrates the effectiveness of the proposed model through experiments and presents the results. Lastly,
Section 6 discusses limitations and future work, and concludes the study.
2. Related Work
Recommender systems select the most appropriate items to a specific user based on user profiles, item profiles, and user–item interactions. Recommender systems have different types of filtering such as content-based, collaborative, demographic-based, and hybrid [
11]. Recently, many studies have adopted neural network architectures to mine complex, and nonlinear patterns of user–item interactions [
12].
There largely exists two types of approaches to contents recommendation: rating-only and multi-relational based recommendation.
First, recommendation models in [
13,
14] predicted a future rating of a user by using the user reviews as input data. In such methods, sophisticated recommendation became difficult when there was a substantial number of neutral ratings. As the number of user reviews was limited to track the individual user interests, various sources such as user tags [
15] and user behavior logs [
16] were further exploited for contents recommendations.
Second, in [
17], sentimental analysis was conducted in a statistical-based manner based on an sentimental dictionary, text mining, natural language processing (NLP) [
18], but only two levels (positive, negative) or three levels (positive, neutral, negative) were utilized. Indeed, it is essential to further subdivide the user’s psychological information for better recommendation. However there yet exists the difficulty to extract the user’s psychology in detail by dividing sentiment into a smaller level.
Although the sentiment analysis would be successfully conducted at a smaller level, it is yet difficult to use data altogether because the dimensions of sentiment and emotion are different. For example, in Hyun et al’s study [
19], positive and negative signals were scaled to −0.5 to 0.5 to reflect the results of sentiment analysis in the rating, combined with rating, and then used in the recommendation system. Similarly, if emotion information is to be reflected in the recommendation, scaling becomes problematic as it is not ordinal but categorical, suggesting that a new method should be considered because a native linear combination faces the lack of the effectiveness in recommendation due to the dimension difference of multiple relations. Previous studies have shown that sentiment or emotion information improves recommendation performance [
1,
3,
4,
20,
21]. To the best of our knowledge, however, no studies have used both of these two in combination for recommender systems.
Existing recommender systems range from traditional statistical-based methods to deep learning methods. Traditional methods can be further divided into memory-based or model-based approaches. In memory-based approach, collaborative filtering (CF) [
22,
23] is a widely used algorithm and can be divided into user-based or item-based CFs according to criteria for similarity comparison. User-based CF is a method of identifying a user’s neighbors whose preferences are similar using their historical information. On the other hand, item-based CF is a method of identifying neighbors of items.
In the model-based approach, matrix factorization (MF) [
24,
25] predicts the missing rating of the sparse matrix by dividing the rating matrix into the latent user matrix and the latent item matrix. As one of the representative linear algebra techniques for matrix decomposition, singular value decomposition (SVD) [
26] predicts the missing rating by dividing the rating matrix into
m*m orthogonal matrix,
m*n rectangular diagonal matrix (singular values), and
n*n orthogonal matrix. In this method,
m is the number of users, and
n is the number of movies. Furthermore, SVD++ is employed as an optimized SVD algorithm to enhance the accuracy of prediction by generating implicit feedback.
Recently, recommendation methods based on graph neural networks (GNNs) have gained attention. GNN-based methods learn user–item relations from graph data and predict new relations. The graph convolutional network is a powerful tool for non-Euclidean data such as social networks, knowledge graphs, user–item interaction graphs. Graph convolutional network generates user/item embeddings from graph [
12]. User/item embeddings can be used to predict ratings of user–item pairs.
Graph convolution matrix completion (GCMC) [
5] is a link prediction method that transforms the rating matrix of user–item into a bipartite graph and predicts missing rating using a graph auto-encoder. On the basis of this idea, recent studies performed recommendations using a bipartite graph and link prediction method [
27,
28]. In [
29], it was confirmed that link prediction performance was improved when text information was reflected and node embedding was performed with GCN. In GCMC, node embedding and relationship information between nodes were used through the GCN method, and by comparing RMSE, it was confirmed that user and item feature information could also be used as an important factor in recommendation.
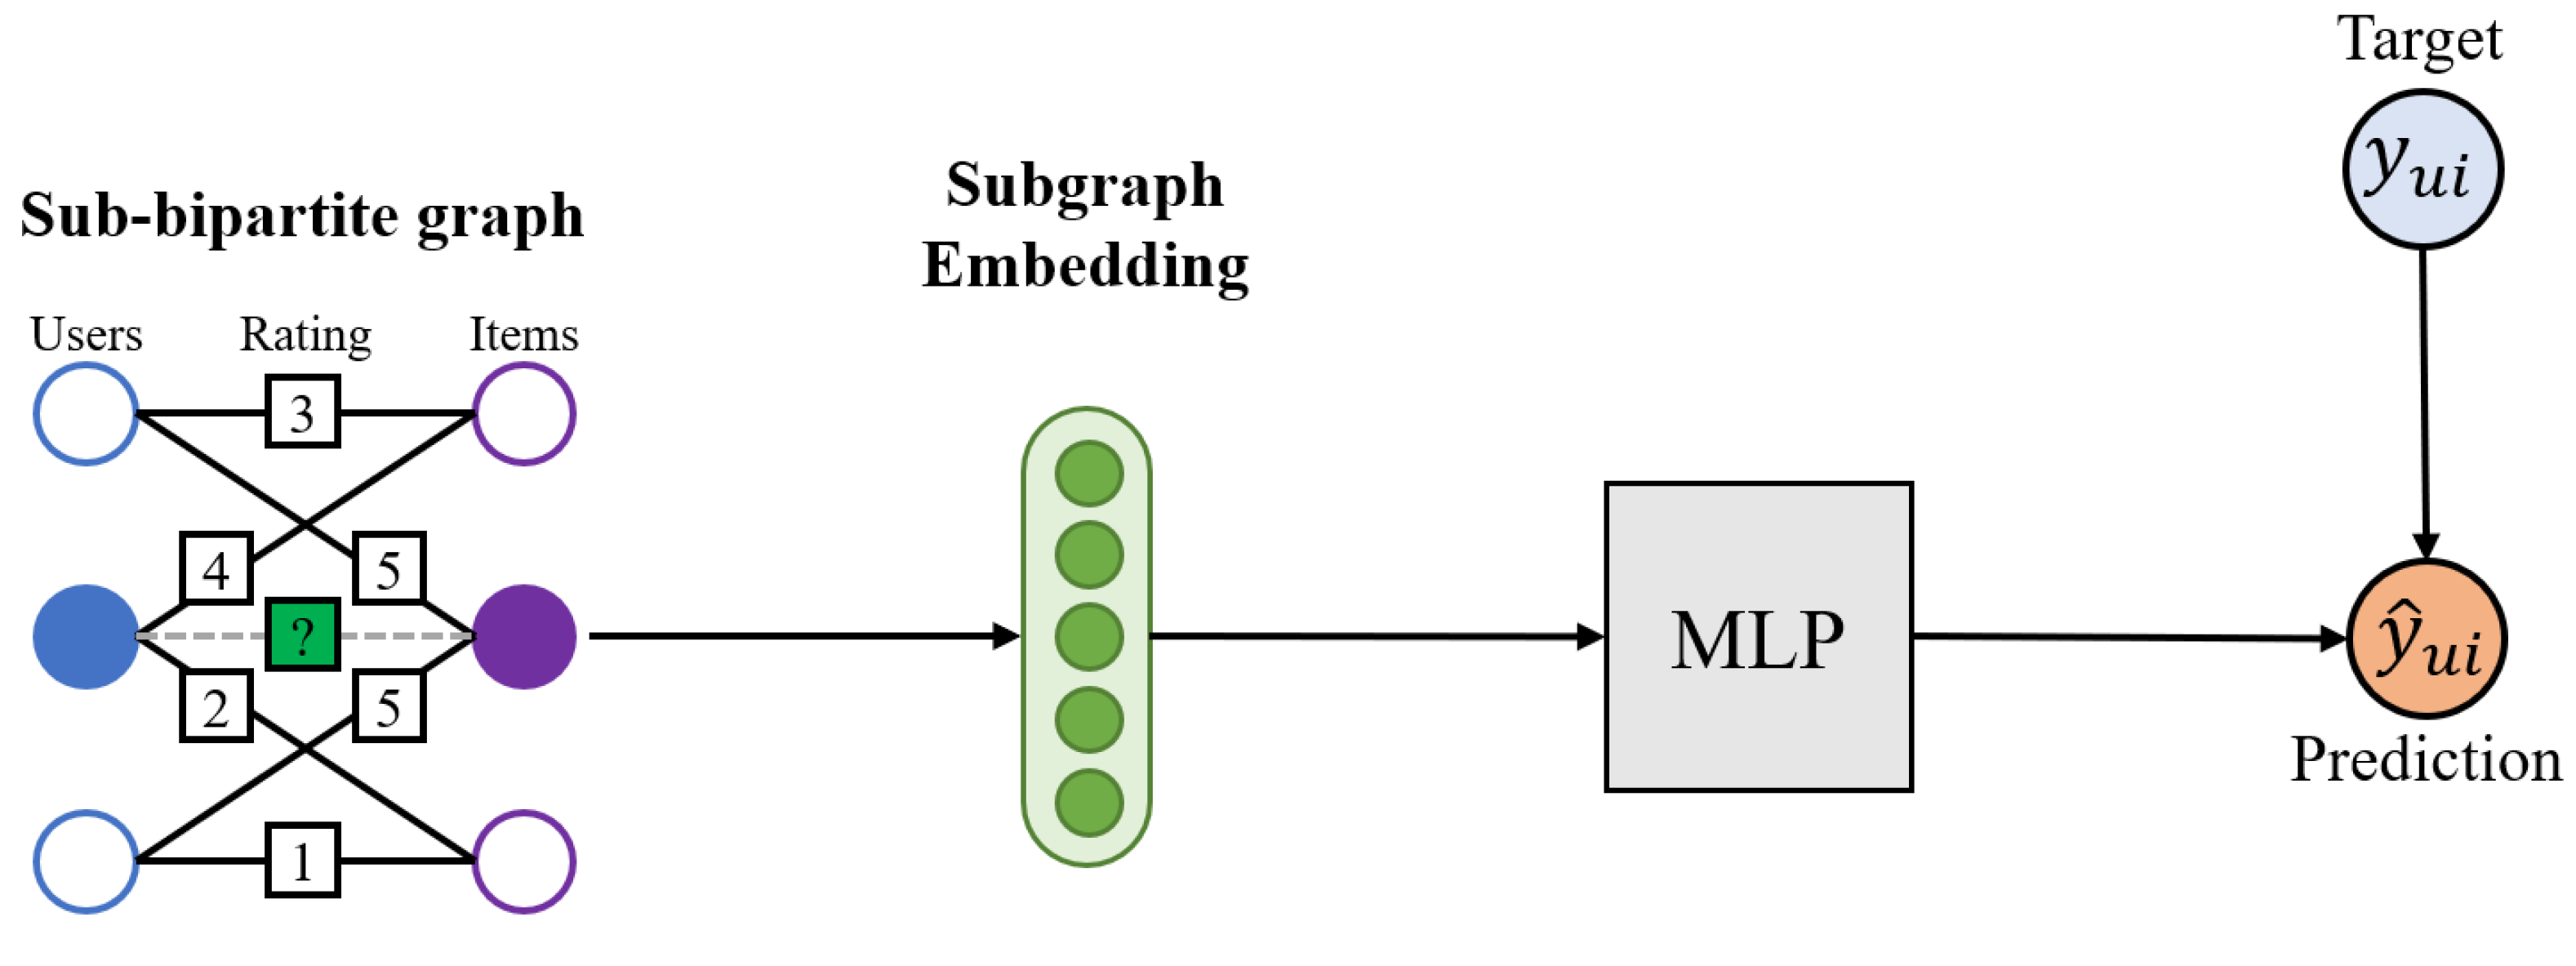
Recently, a model that improved over the GCMC model was introduced, named IGMC [
6]. It is a current state-of-the-art GNN model that most accurately predicts the rating scores using a bipartite graph by conducting subgraph-level embedding without side information.
Figure 1 shows the link process of IGMC. Sub-bipartite graphs were used as inputs in the model and the model outputs subgraph embeddings through the message passing process. Finally Multi-Layer-Perceptron (MLP) predicts ratings by reconstruting rating matrix from subgraph embeddings. Although the model was effective without side information, the performance of IGMC can be further improved by exploiting CX as side information, which has yet to be explored.
4. Experiment
A. Datasets
We used two movie datasets: Rotten Tomatoes and Amazon Review. Because each dataset was rated in a different type of rating system, two different datasets were used to see if the proposed model could reflect all types of rating systems, from general to particular types of rating systems. For example, the Amazon dataset is used by general users, and the ratings range from 1 to 5. However, Rotten Tomatoes Dataset is a dataset crawled by a specific researcher and provided to Kaggle, and has an unstructured rating such as categorical type (A, B, C, D), continuous type (0.75, 0.573), and fractional type (1/5, 35/70). In the subsequent sections, the preprocessing process of each dataset is presented.
Rotten Tomatoes movie dataset We used a Kaggle dataset (
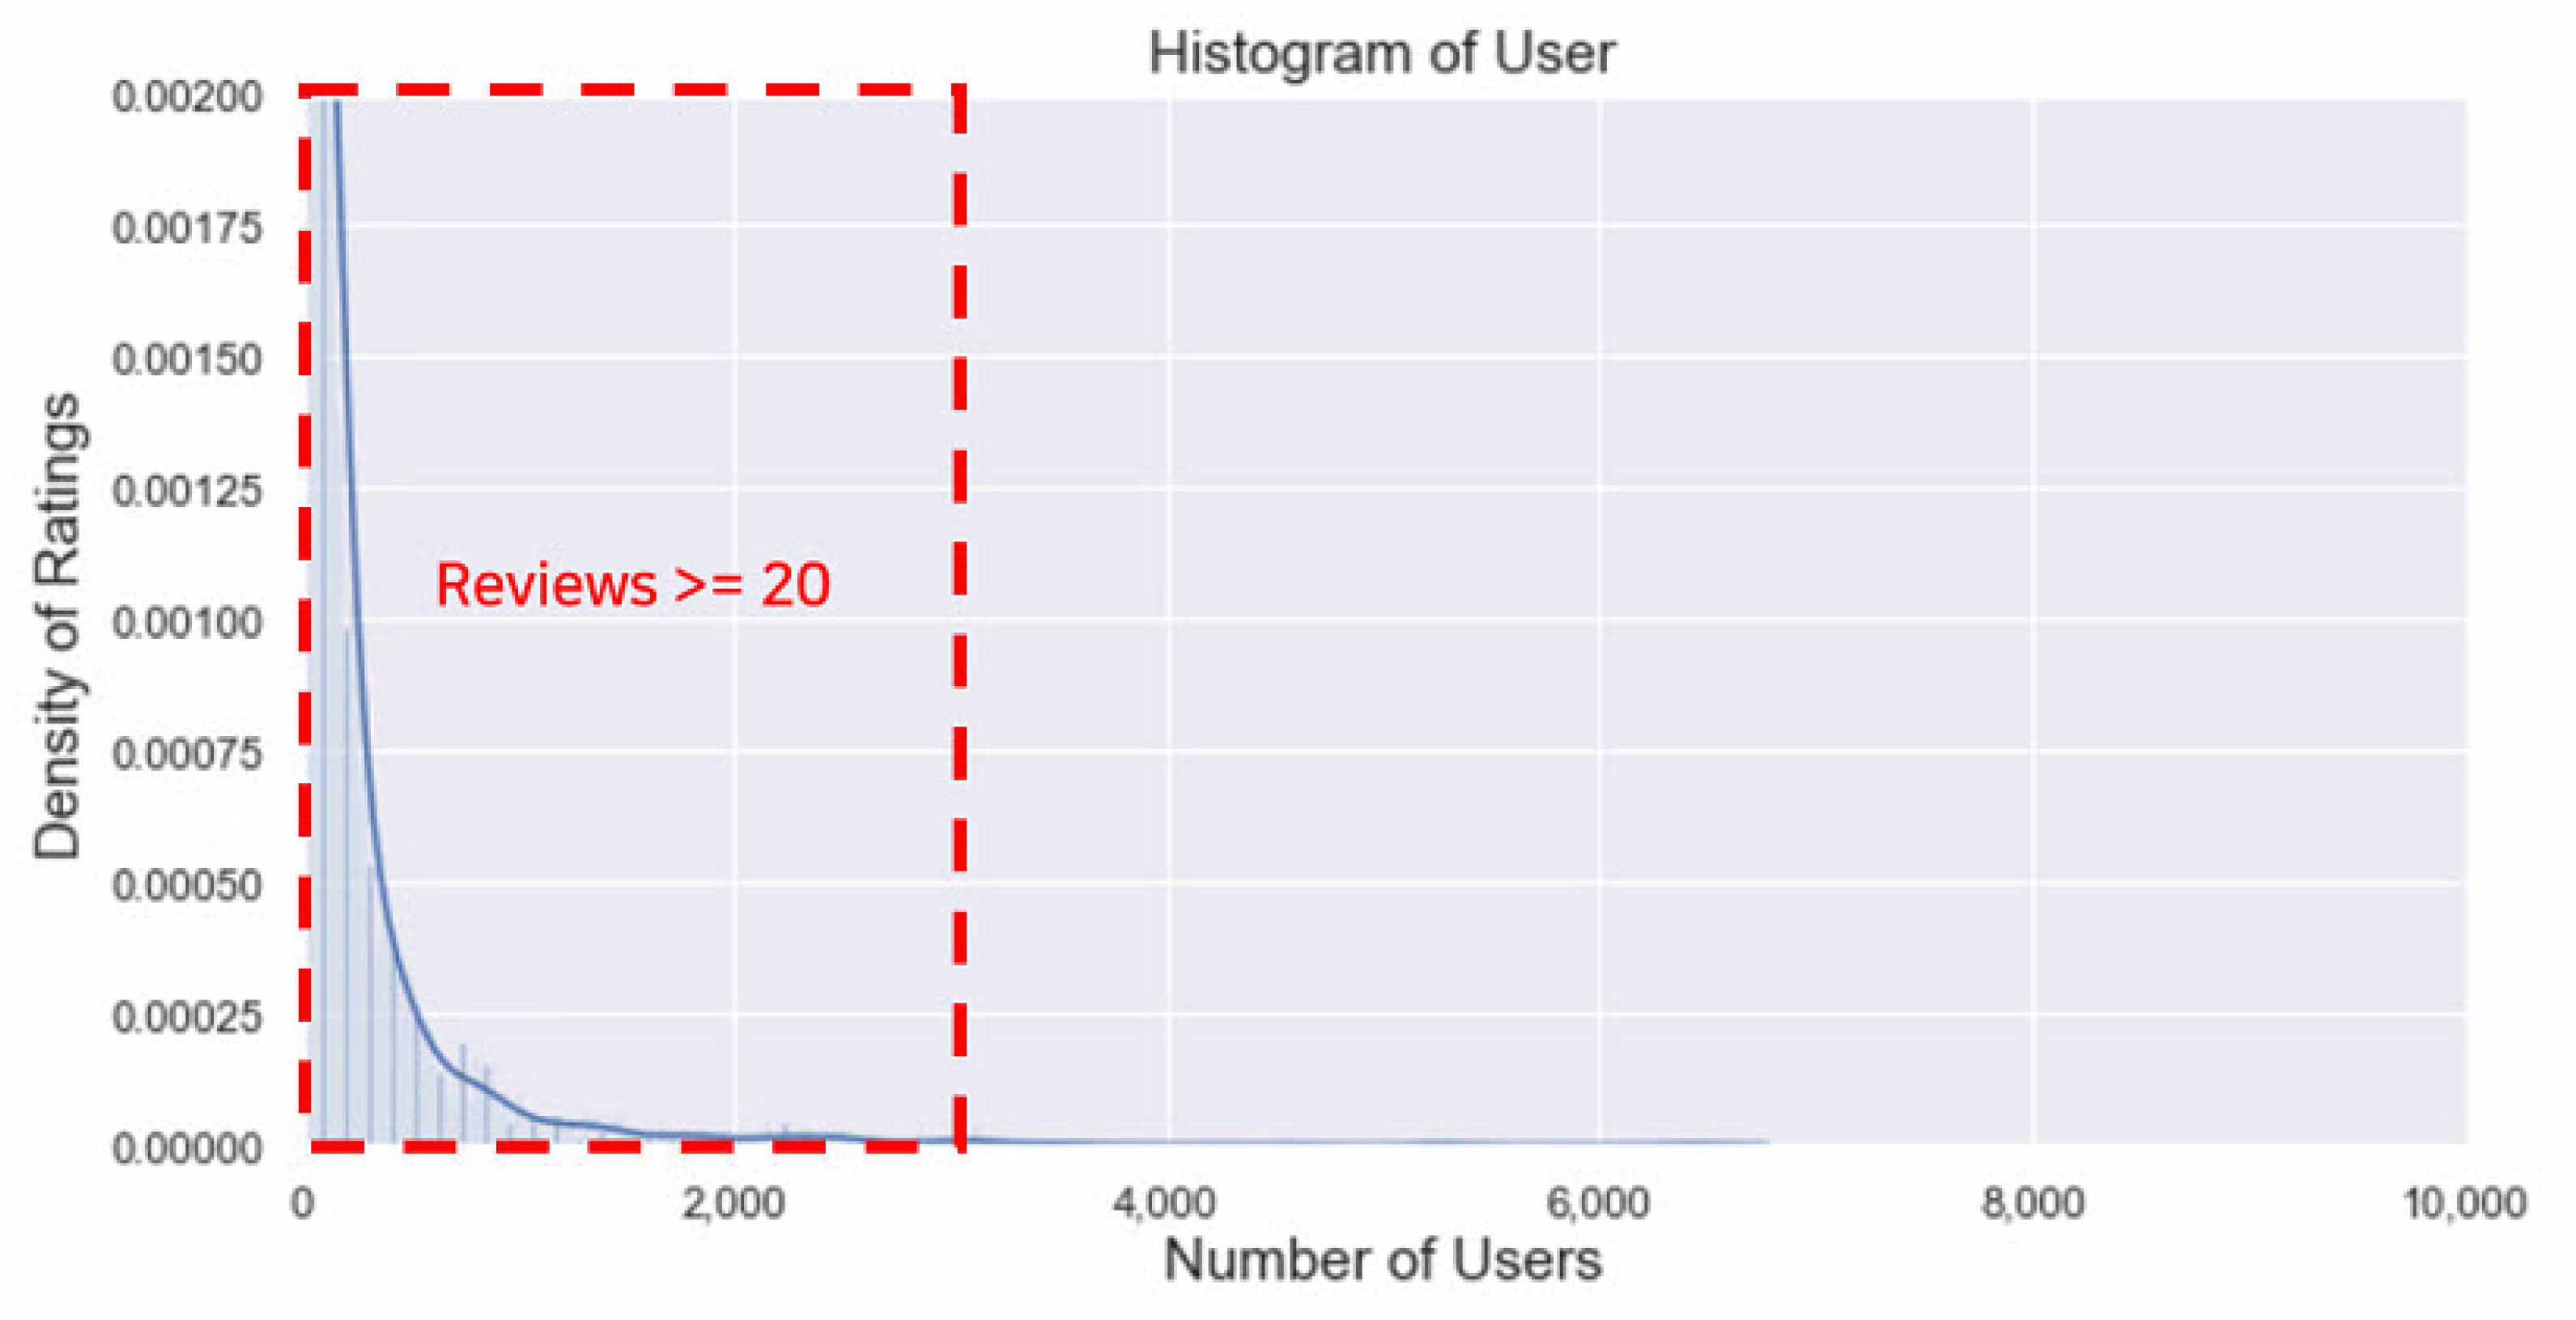
https://www.kaggle.com/stefanoleone992/rotten-tomatoes-movies-and-critic-reviews-dataset, last accessed: 15 October 2021), which has been constructed by crawling movies’ meta-data and review data from the Rotten Tomatoes website. The dataset was divided into movie data and rating data, where the number of the user ratings and reviews were 758,709 in total, accounting for 67% of the whole dataset. There were three considerations when building the dataset. First, users with more than 20 ratings were selected to minimize the effect of the long-tail as shown in
Figure 4. Second, when building the training and testing sets, it was divided based on the timestamps to find out if the model successfully predicts the future ratings based on the historical data. Third, user_ids and movie_ids existing in the training set remained only in the testing set for constant observation.
After all, 1112 user_ids and 8521 movie_ids were used. For node embedding of GCMC, ‘title, year, and genres’ were used in the movie data, and ‘top_critic and publisher_name’ were used in the user data. Because movie_id and user_id did not exist in the original dataset, movie_ids were attached in index order in the movie_data, and user_ids were attached in groups of ‘critical_name, top_critical, and publisher_name’ in the user_data.
Amazon Review dataset We used Amazon product data, a popular benchmark dataset [
30,
31,
32,
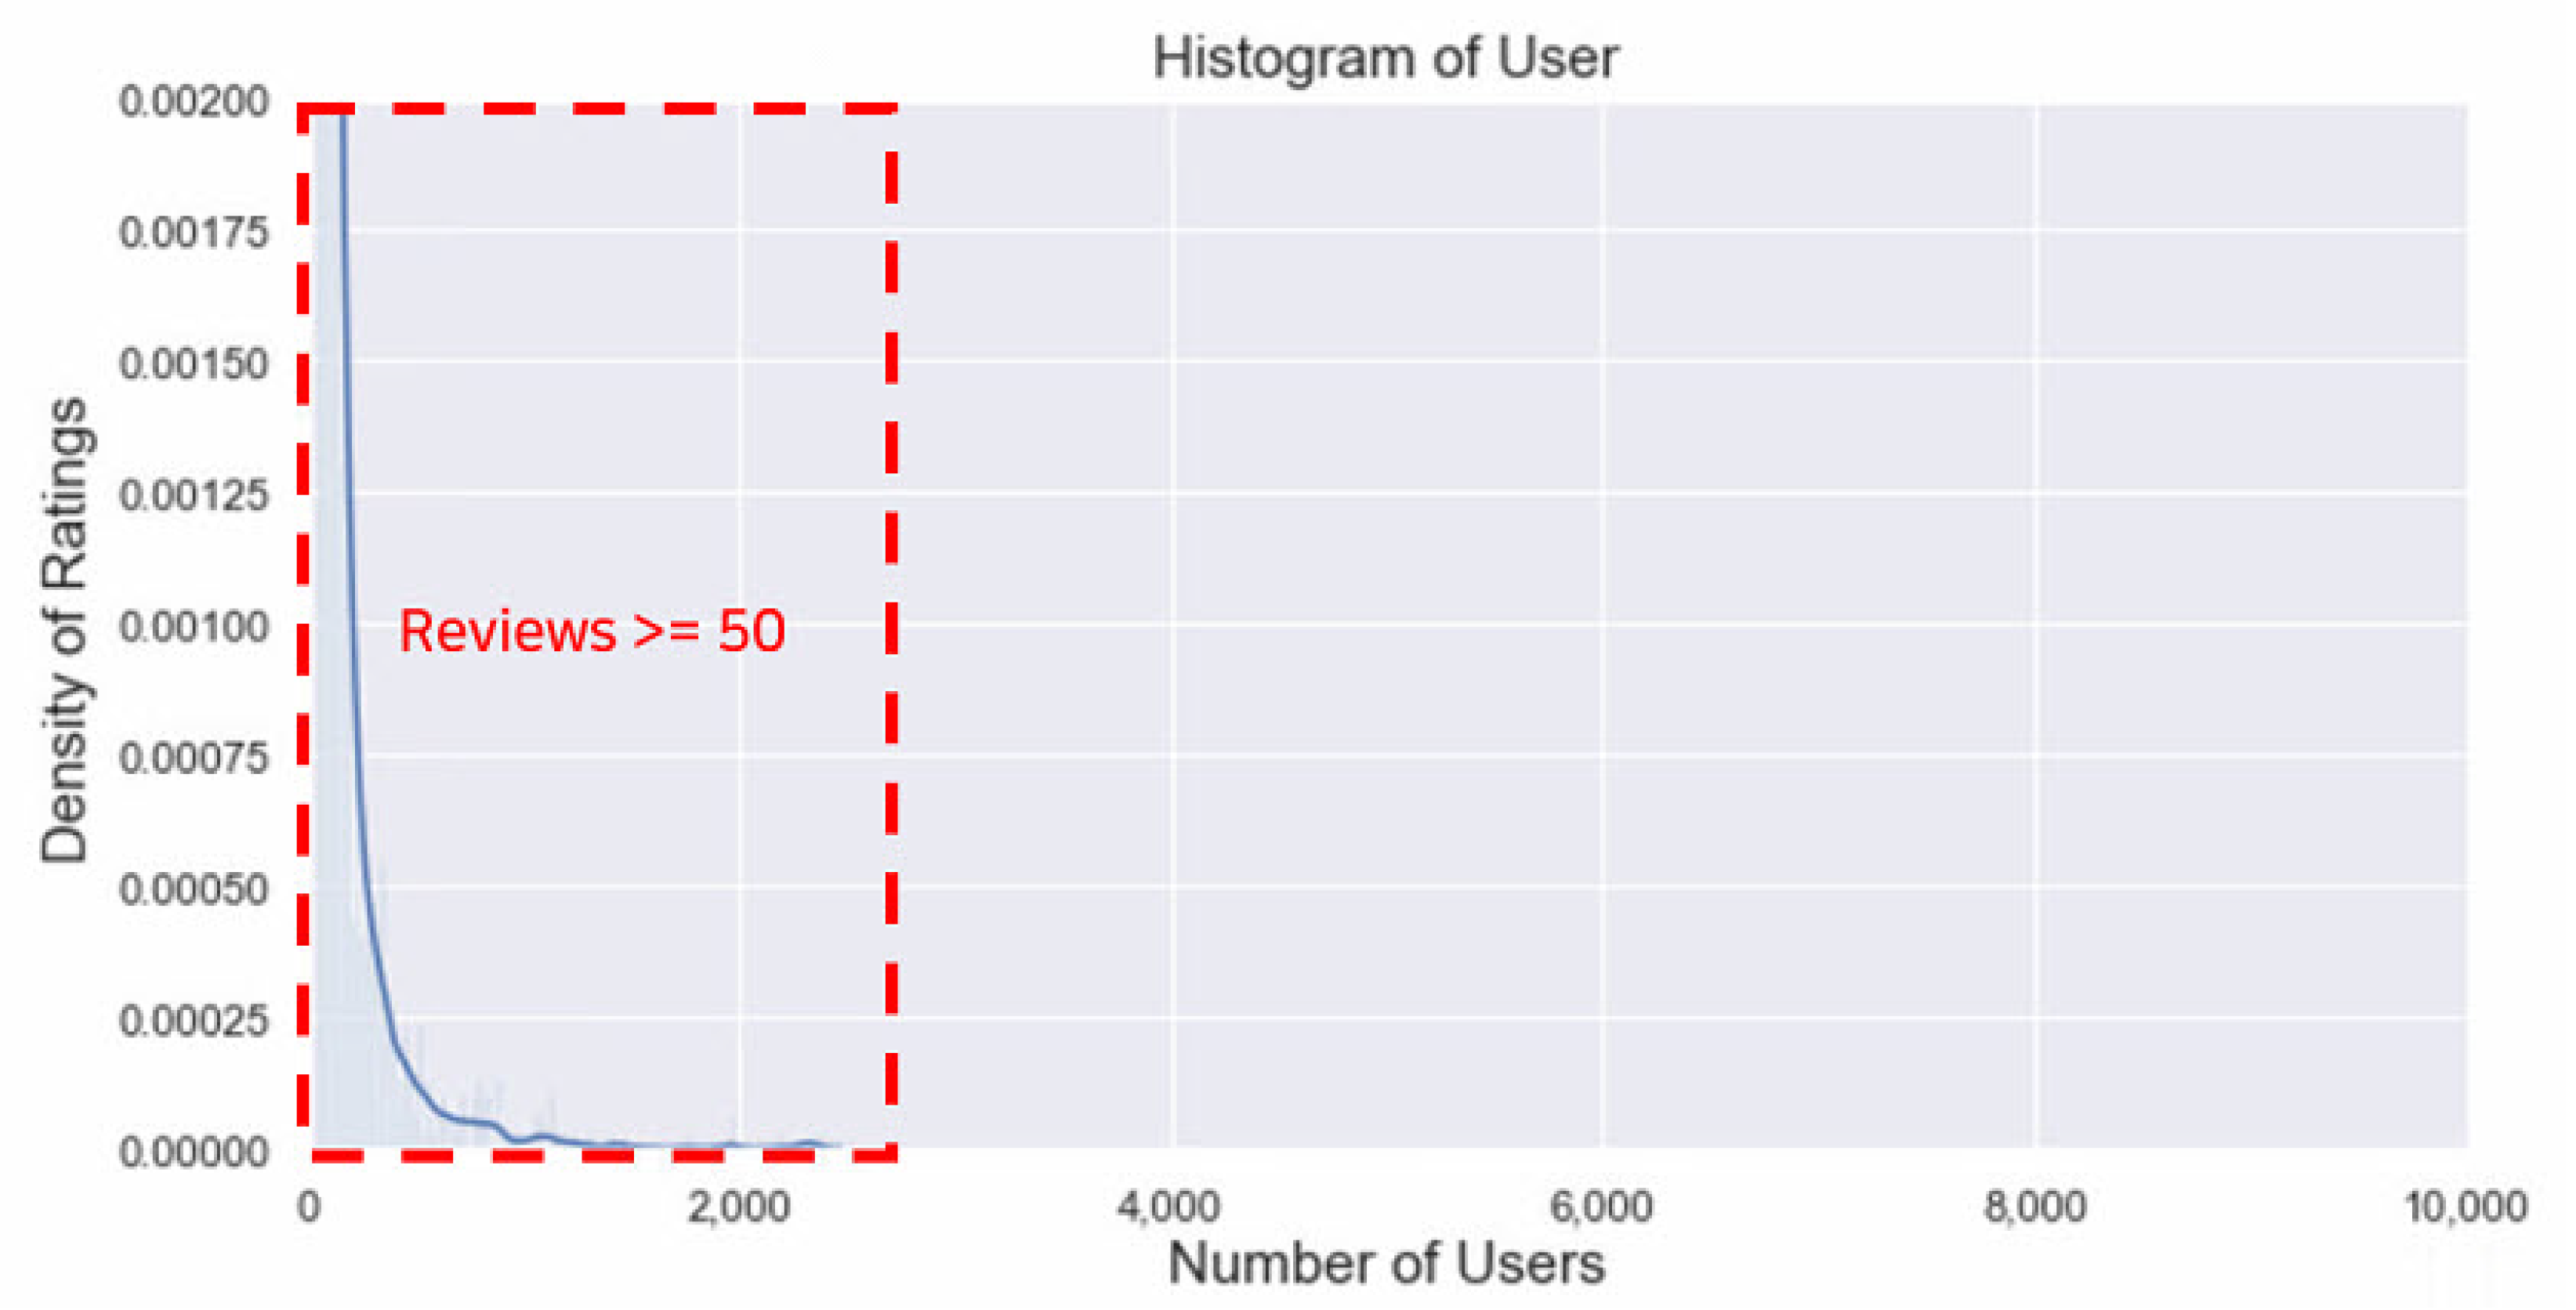
33] containing product reviews and metadata of Amazon from 1996 to 2018. It also includes various categories such as Books, Electronics, Movies and TV, and Beauty. Among the categories, we used Movies and TV data, given the purpose of our experiment. First, we used the smaller version of the dataset (about 1,697,533 reviews) and chose users with more than 50 reviews to exclude the cold-start problem.
Figure 5 shows the form of a long-tail graph as in Rotten Tomatoes. Second, train and test data were divided at a ratio of 8:2 according to the timestamp. Finally, 3264 user_ids and 14,124 movie_ids were used. Because the Amazon product data does not provide meta information of movies, the GCMC model does not use node features in the Amazon product data.
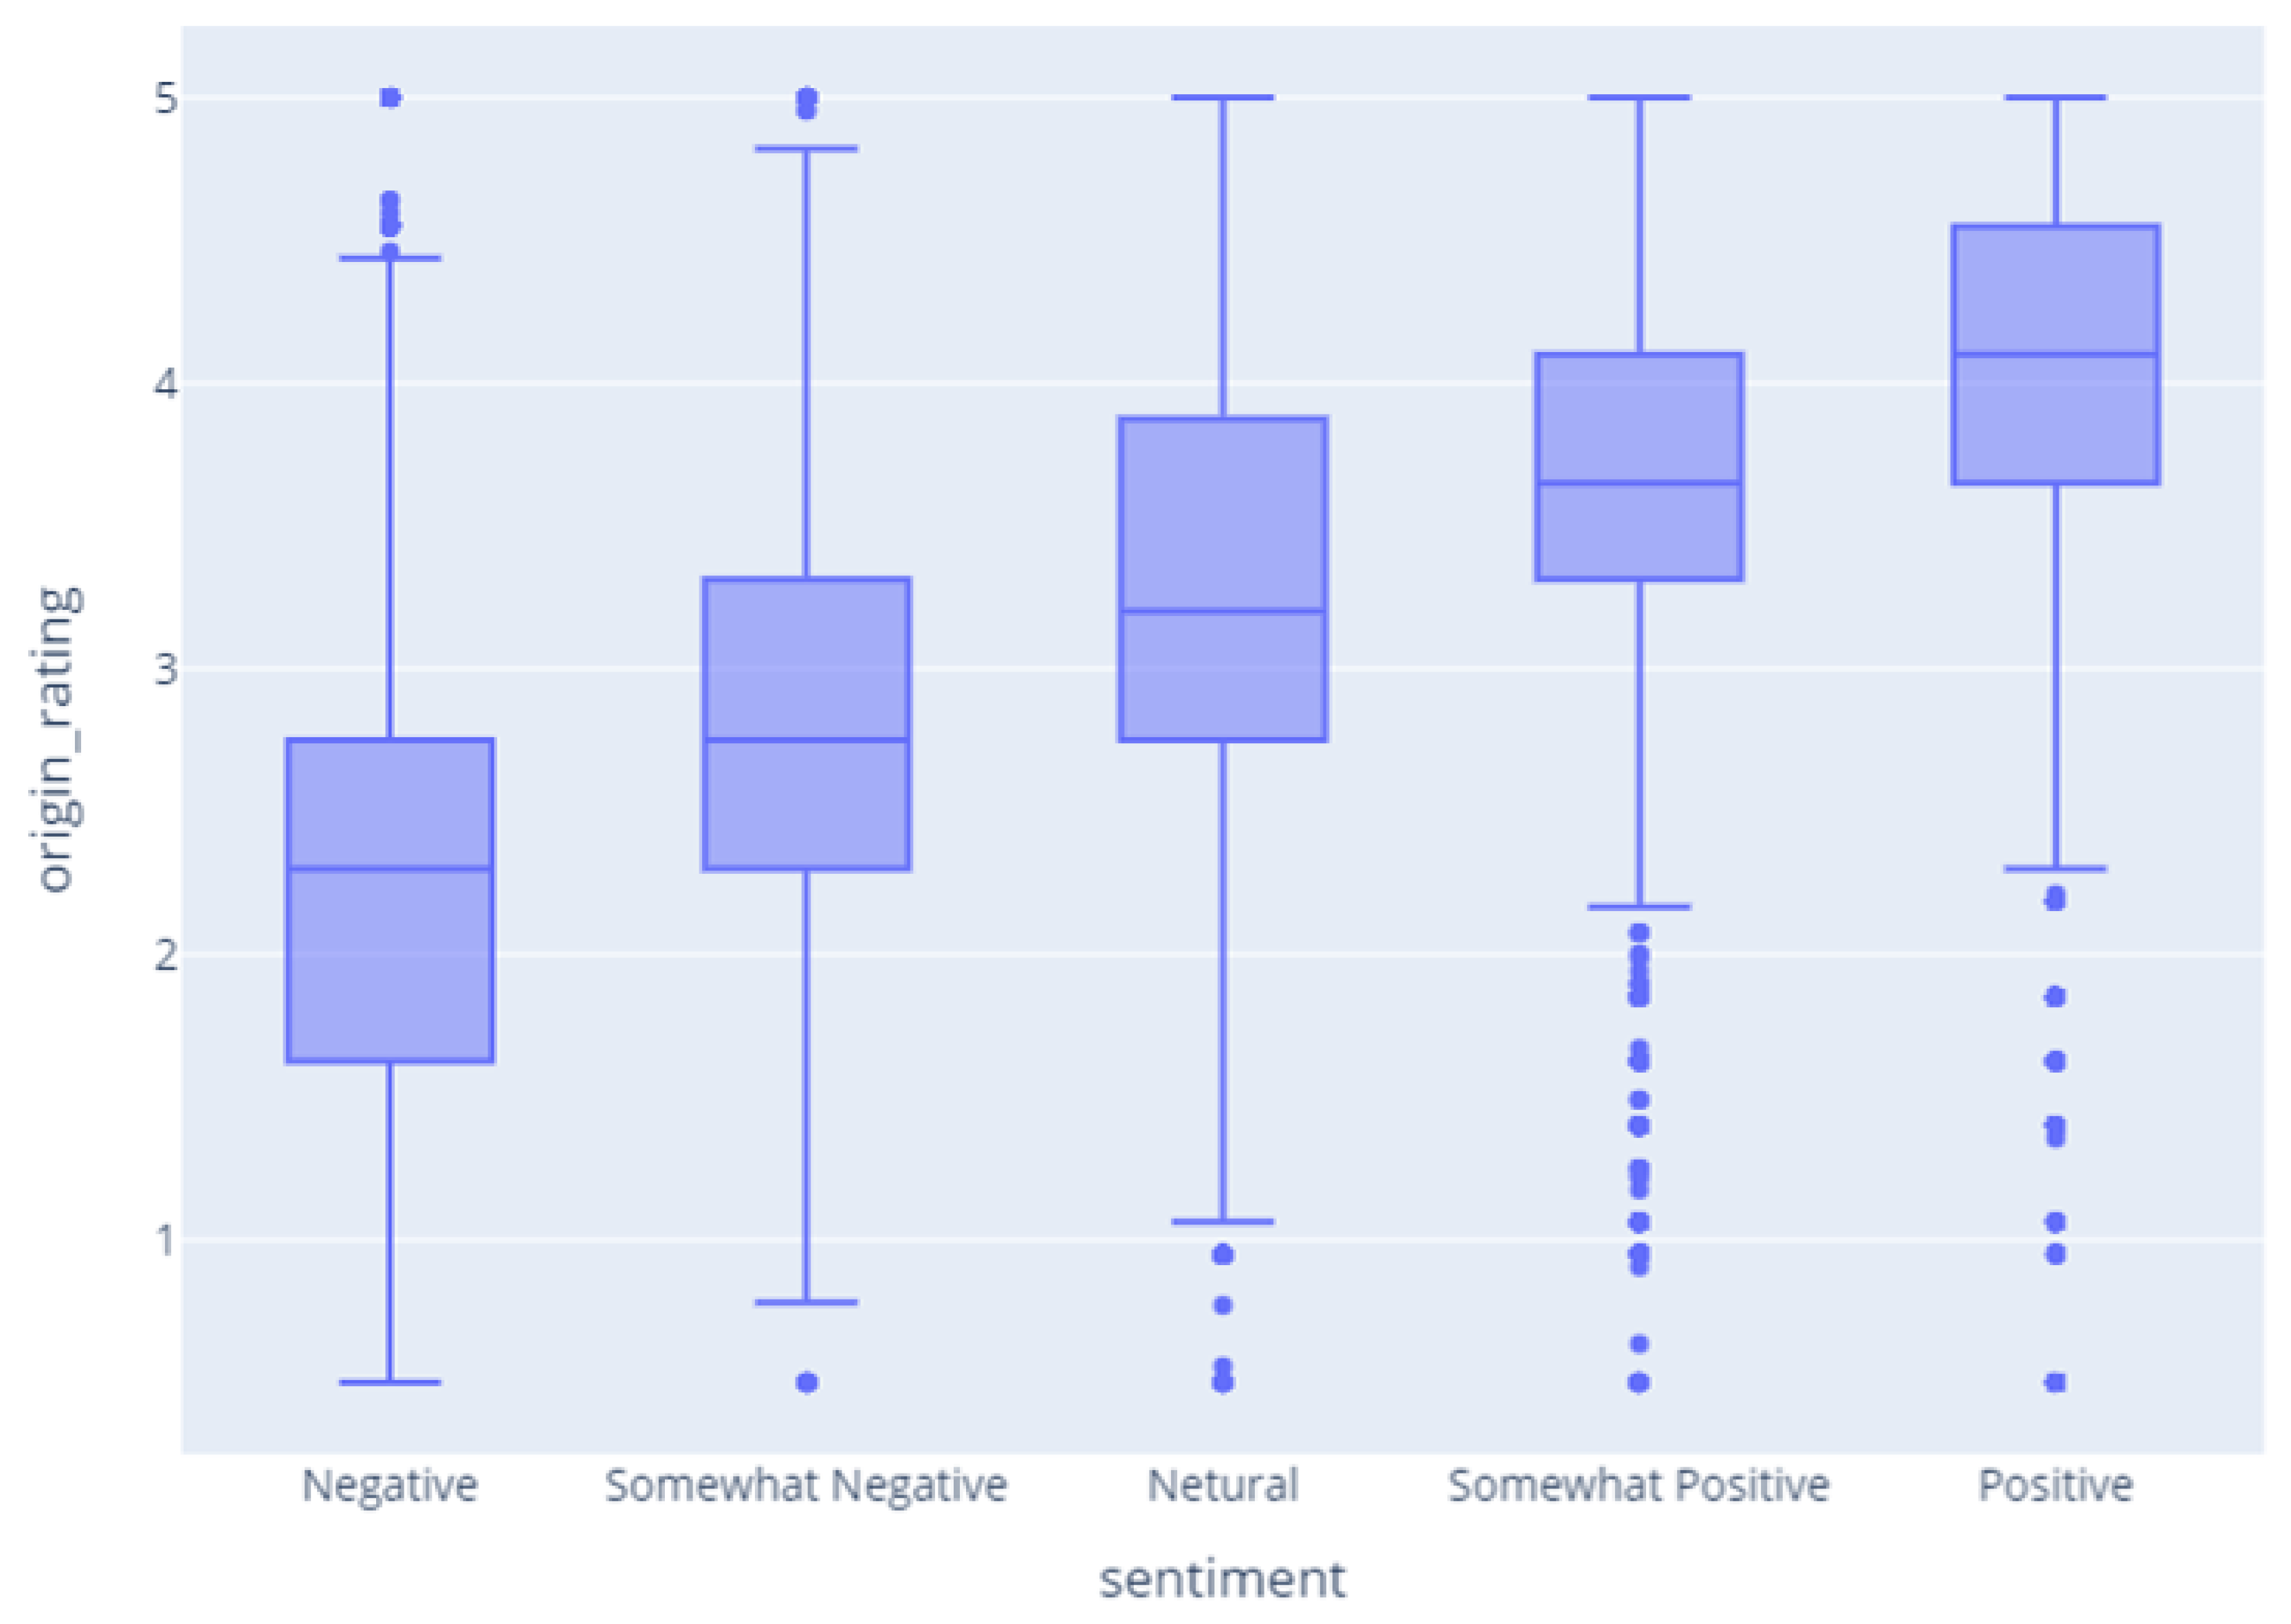
Feature generating using fine-tuned BERT To learn BERT, data from ‘Sentimental Analysis on Movie Reviews’ and ‘Emotions Dataset for NLP’ in Kaggle were used. After fine-tuning two independent BERTs using the training data sets, the review data were entered into the BERTs and the predicted results were used as the labels for user_id and movie_id. It was observed that the sentiment data were highly correlated with its rating. On the other hand, in the emotion data, no clear correlation was seen.
Figure 6 shows the correlation between the sentiment and rating. The higher the positive sentiment, the higher the rating is, indicating that there is a positive correlation between the two variables. Accordingly, when features having orders are combined, it may be expected that the recommendation performance is increased.
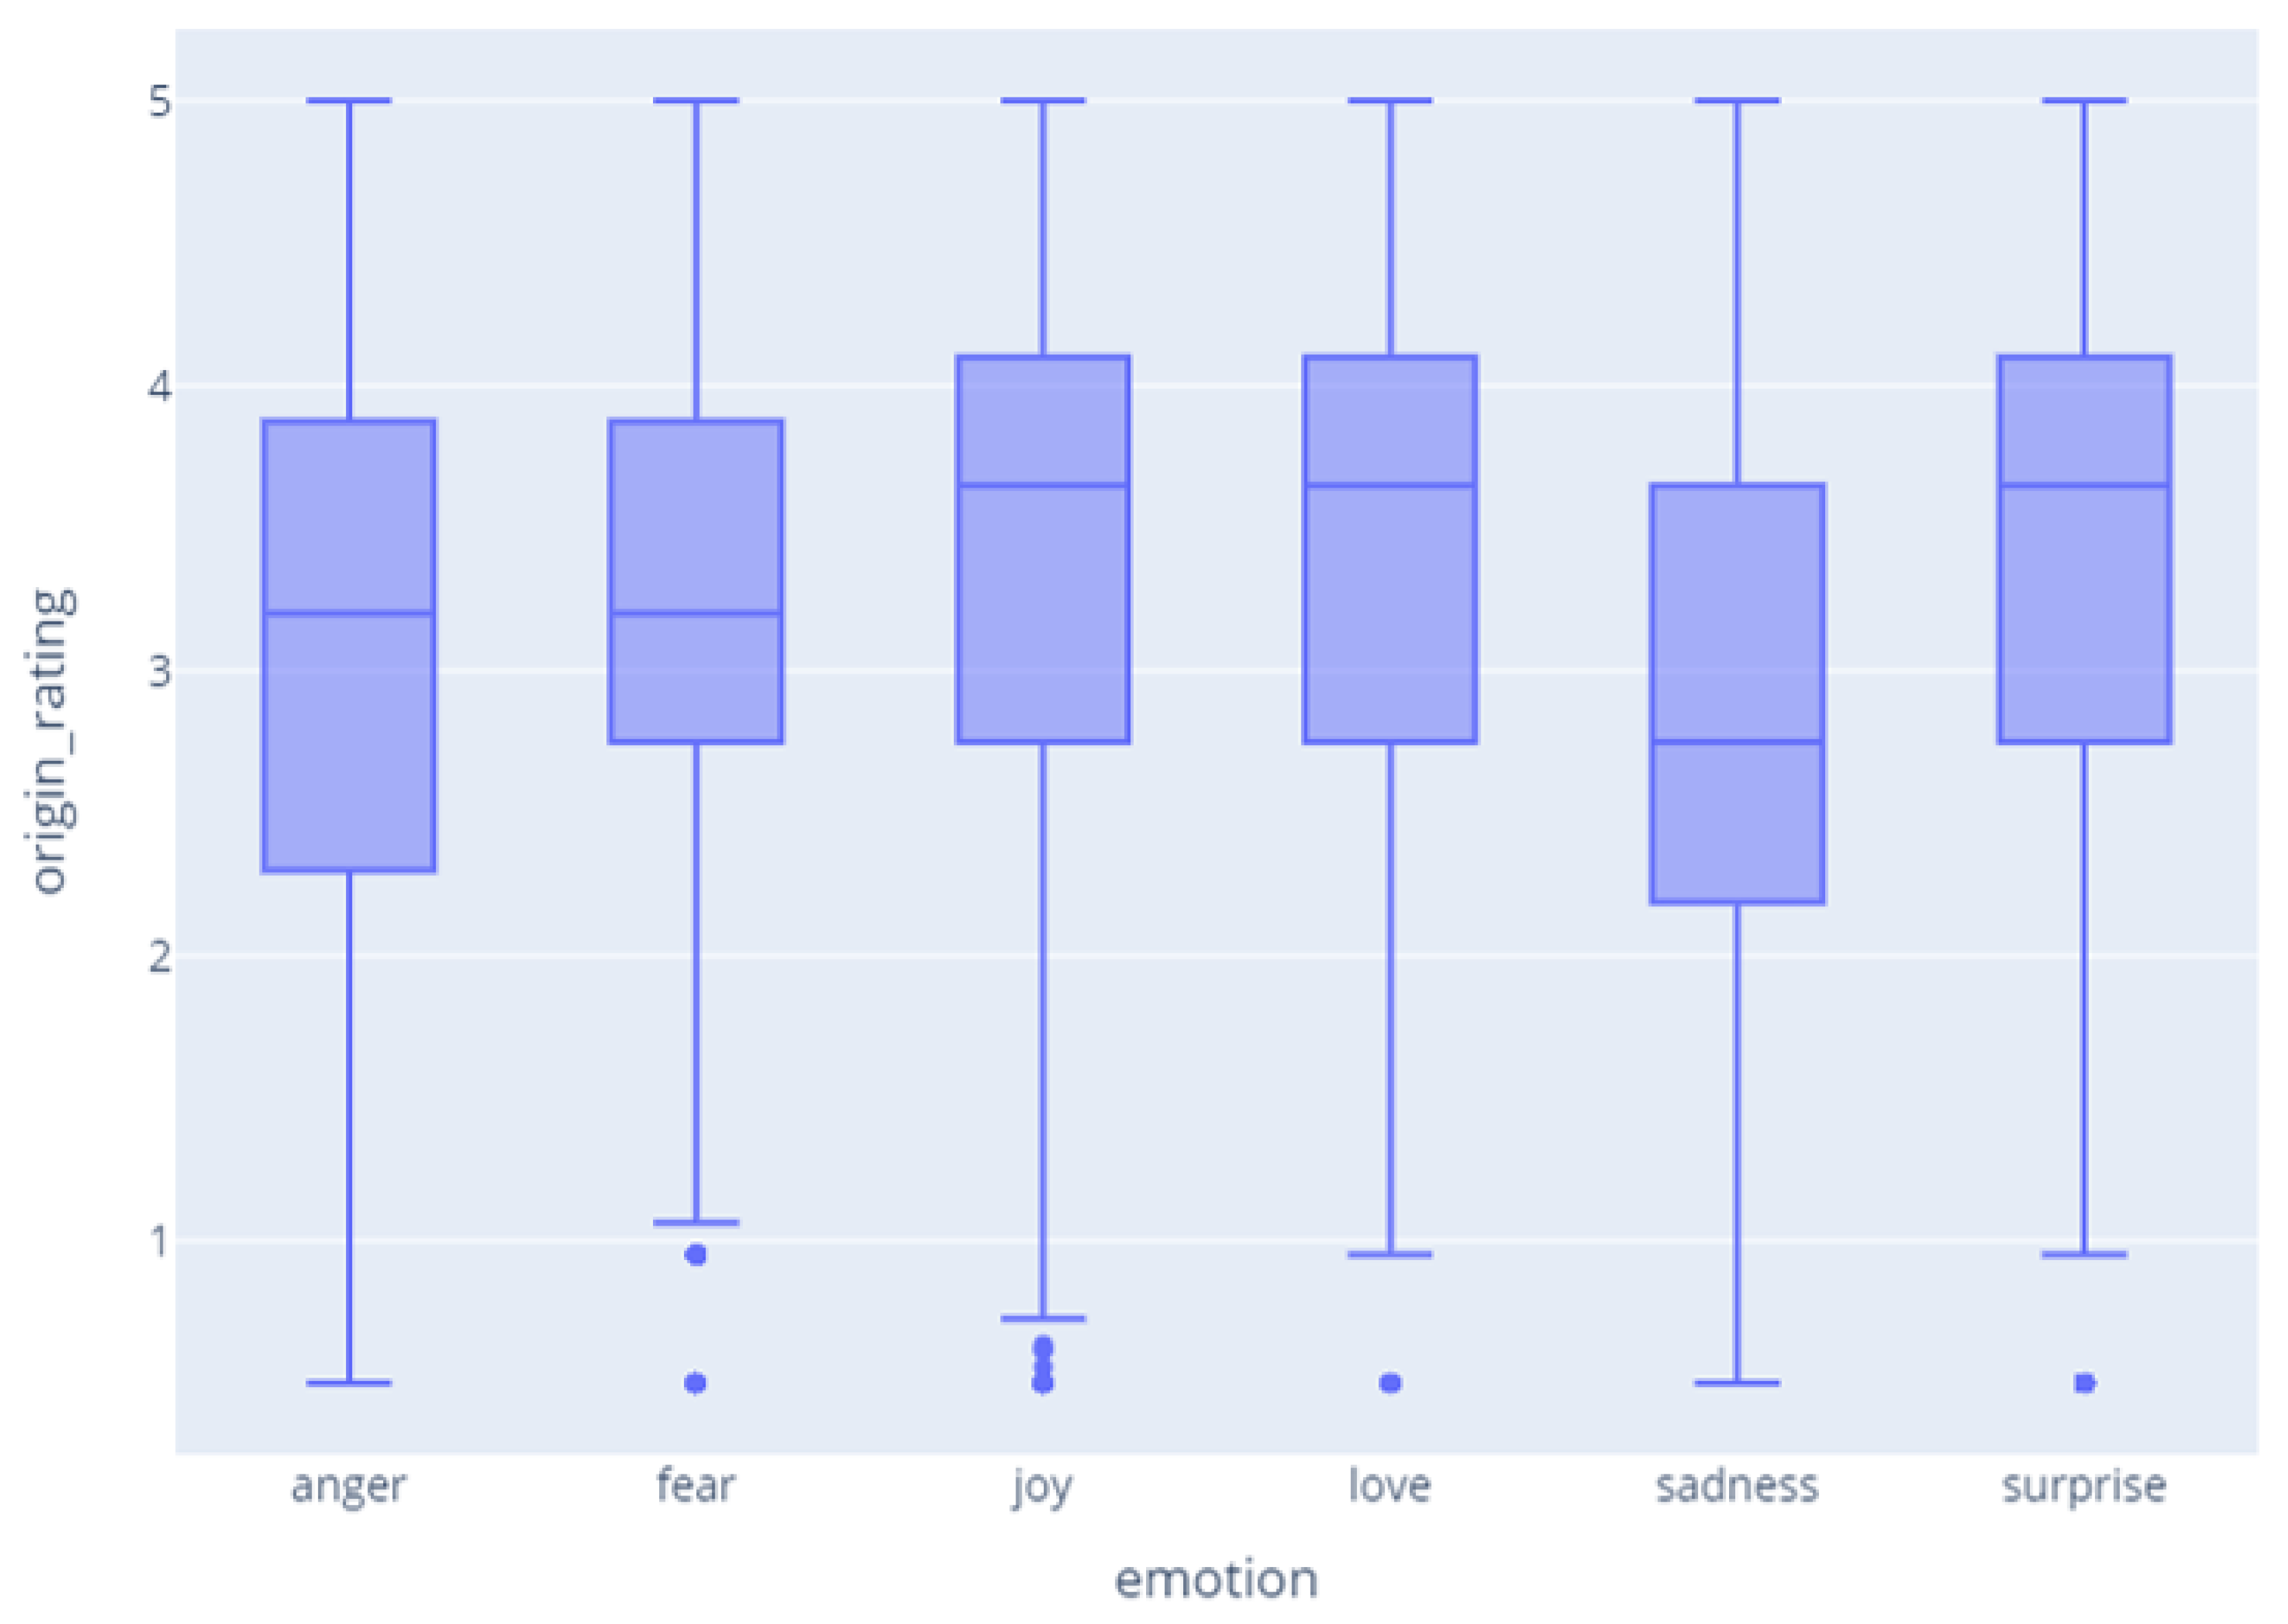
Meanwhile,
Figure 7 shows the correlation between the emotion and rating, and shows that there is no clear correlation. By observing the dataset, we found that, when users felt the emotion of ‘joy, love, surprise’, they left high ratings, and when they felt the emotion of ‘sadness’, they tended to leave low ratings. On the other hand, when they felt the emotion of ‘fear’, they often left relatively high ratings.
B. Compared methods
In the experiment, we chose multiple traditional and graph-based models for comparison. For the CF model, we investigated both item and user-based CF models. As matrix factorization has been widely adopted for commercial usage in recent days, we also included SVD-based models (SVD and SVD++). It should be noted that the proposed model is a graph-based approach for the recommendation, indicating that the current state-of-the-art graph-based model should be also included for the experiment. For this purpose, GCMC and IGMC models were selected, and those hyperparameters were determined by grid search to ensure their best performances.
Traditional models KNNWithMeans, SVD, and SVDpp of the Surprise library were used to implement the traditional models. The KNNWithMeans model was a variant of CF and used as user and item-based CFs through the user_based option. The hyperparameters for the grid search were chosen to be best performing of the models. In the KNNWithMeans model, k were 10, 15, and 25, and name were Pearson_baseline and Cosine. In the SVD and SVDpp models, learning rate were 0.005, 0.006, and 0.007.
GCMC model In order to see the performance of individual models by the changes of the hyperparameters, the seed was fixed, and a grid search was conducted to perform hyperparameter tuning for each model. The final hyperparameters used for the experiment were as follows. Dimension was fixed at 75, 150, and 225. Drop outs were fixed at 0.3, 0.5, and 0.7. Learning rate was fixed at 0.005, 0.01, 0.02, and 0.03.
C. Loss definition in IGMC
IGMC uses a unique type of loss, which consists of Mean Square Error (MSE) and Adjacent Rating Regularization (ARR) Loss. MSE loss is used for general regresion based analysis that adjusts the weight of the models by learning the MSE difference between the prediction and actual values. However, graph neural network models such as GCMC and IGMC calculate the last output for each rating by Softmax and then transform it into a regression analysis form, so if only the MSE method is used, it can be learned without reflecting the similarity between each rating. For example, if the type of rating has scores from 1 to 5, score 1 and 2 are more similar than score 1 and 5. This distance between scores would not be reflected in the model.
Equation (
1) shows the MSE loss function that performs training process by reducing the difference between the predicted and actual ratings. Meanwhile, Equation (
2) shows ARR loss function that trains adjacent ratings. The closer the rating scores are, the more similar the weights such as
and
are.
indicates regulating matrices in a Frobenius norm. Equation (
3) is the loss used when using only the rating in the IGMC method. However, because our model has three types of data, we need to define a new type of loss to reflect the characteristics of the IGMC model. As the sentiment is an ordinal data, Equation (
4) is finally defined for our model applying the ARR loss functions on two data types such as ratings and sentiments. Here, because the emotion is a categorical type, it is not considered. Compared to the use of existing IGMC loss, the performance was slightly increased, but there was no significant effect.
D. Results
Through the experiment, we investigated whether or not the recommendation performance could be improved by using additional relational data such as CX data in the GNN method. The results of comparing performance with Rotten Tomatoes and Amazon data are as follows. The results are presented for Rotten Tomatoes and Amazon data in
Table 1 and
Table 2, respectively.
Table 1 shows the best RMSE of Rotten Tomatoes data using traditional models and GNN-based models. The conventional and GCMC models used only ratings, while IGMC models used ratings and additional data. In the traditional models, user-based CF produced the worst results, and its performance was lower than item-based CF, supporting the previous observations that item-based CF often outperforms user-based CF [
19]. The SVD model performed better than the CF, and the SVD++ model outperformed the other traditional models.
As the graph reflects the complex information between users and items, GNN-based models performed better than traditional models such as CF and SVD. Although the IGMC model did not use side information, it outperformed the GCMC model supporting that it is the current state-of-the-art GNN model. In the end, the result of the IGMC model with Cinematic Experience (CX) outperformed the basic IGMC. According to [
6], there is a possibility that using side information in IGMC could further improve performance, and our study shows that the model’s performance can be improved with CX information, indeed.
Table 2 shows the best RMSE of Amazon movie data using traditional models and GNN-based models. Unlike Rotten Tomatoes’ results, user-based CF performed better than item-based CF, but the difference of RMSE is slight. As observed in the Rotten Tomatoes dataset, the SVD model performed better than the CF, and the SVD++ model outperformed the other traditional models. We observed that the SVD++ model was performing better than GCMC. Although GNN-based models generally perform better than traditional models, we confirmed that traditional models can be effective depending on the characteristics of the data. Yet, the IGMC model with Cinematic Experience (CX) performed better than the basic IGMC.
We attribute the superior outcome to the fact that the graph features interact with various relations. In GNN, the features between the nodes and edges are transmitted through the message passing method. By doing so, more diverse information would be delivered within the model according to the combination of the edge types and node features. Meanwhile, the proposed model extracts the features, which are not revealed in the rating, from the review data by representing those as graphs. In the end, a multi-modality recommendation can achieve improved performance by transforming graphs with different dimensions such as sentiment, emotion into embedding in the same dimension.
E. Ablation study of IGMC model
We conducted an ablation study as shown in
Table 3 to discover features that affected the recommendation performance. The aforementioned experiment results showed that the rating-based recommendation approach is limited, and the CX information can be used as boosting features to improve performance.
Since sentiment clearly showed a positive correlation with rating in the experiment, it showed a high-performance improvement when combined with rating. On the other hand, emotion did not correlate with rating. Yet, there was a correlation with emotion types such as sadness and joy, which contributed to improved performance.
The results of the ablation study also showed better performance when combining sentiments with ratings rather than emotions. However, when sentiment and emotion were used altogether, the performance was the best, implying that they would complement one another. In the graph between the sentiment and rating, ‘negative review and high rating’ or ‘positive review and low rating’ could somewhat hinder the performance of the recommendation, but such information should be reflected to see similar results to the existing industrial recommender system. Therefore, when experimenting in such an environment, it sounds plausible that exploiting both sentiment and emotion could produce the best results.
In summary, our model aggregated a multi-relational graph by performing GNN’s operations for each edge type. Latent vectors were used to predict missing ratings, and when combined with CX information, they showed improved results.
F. The impact of parameter
GCMC model For the final model run, drop out was set to 0.5, the dimension was set to 256, and learning rate was set to 0.006. However, when the hyperparameters were changed, there was no significant effect because the range of changes in RMSE was small.
Surprise In both KNNwithMeans of user-based and item-based, the performance was the best when k was 25 and name was cosine, meaning that the higher the k, the more neighbors can be considered. In both SVD and SVDpp, the performance was the best when learning_rate was 0.006.
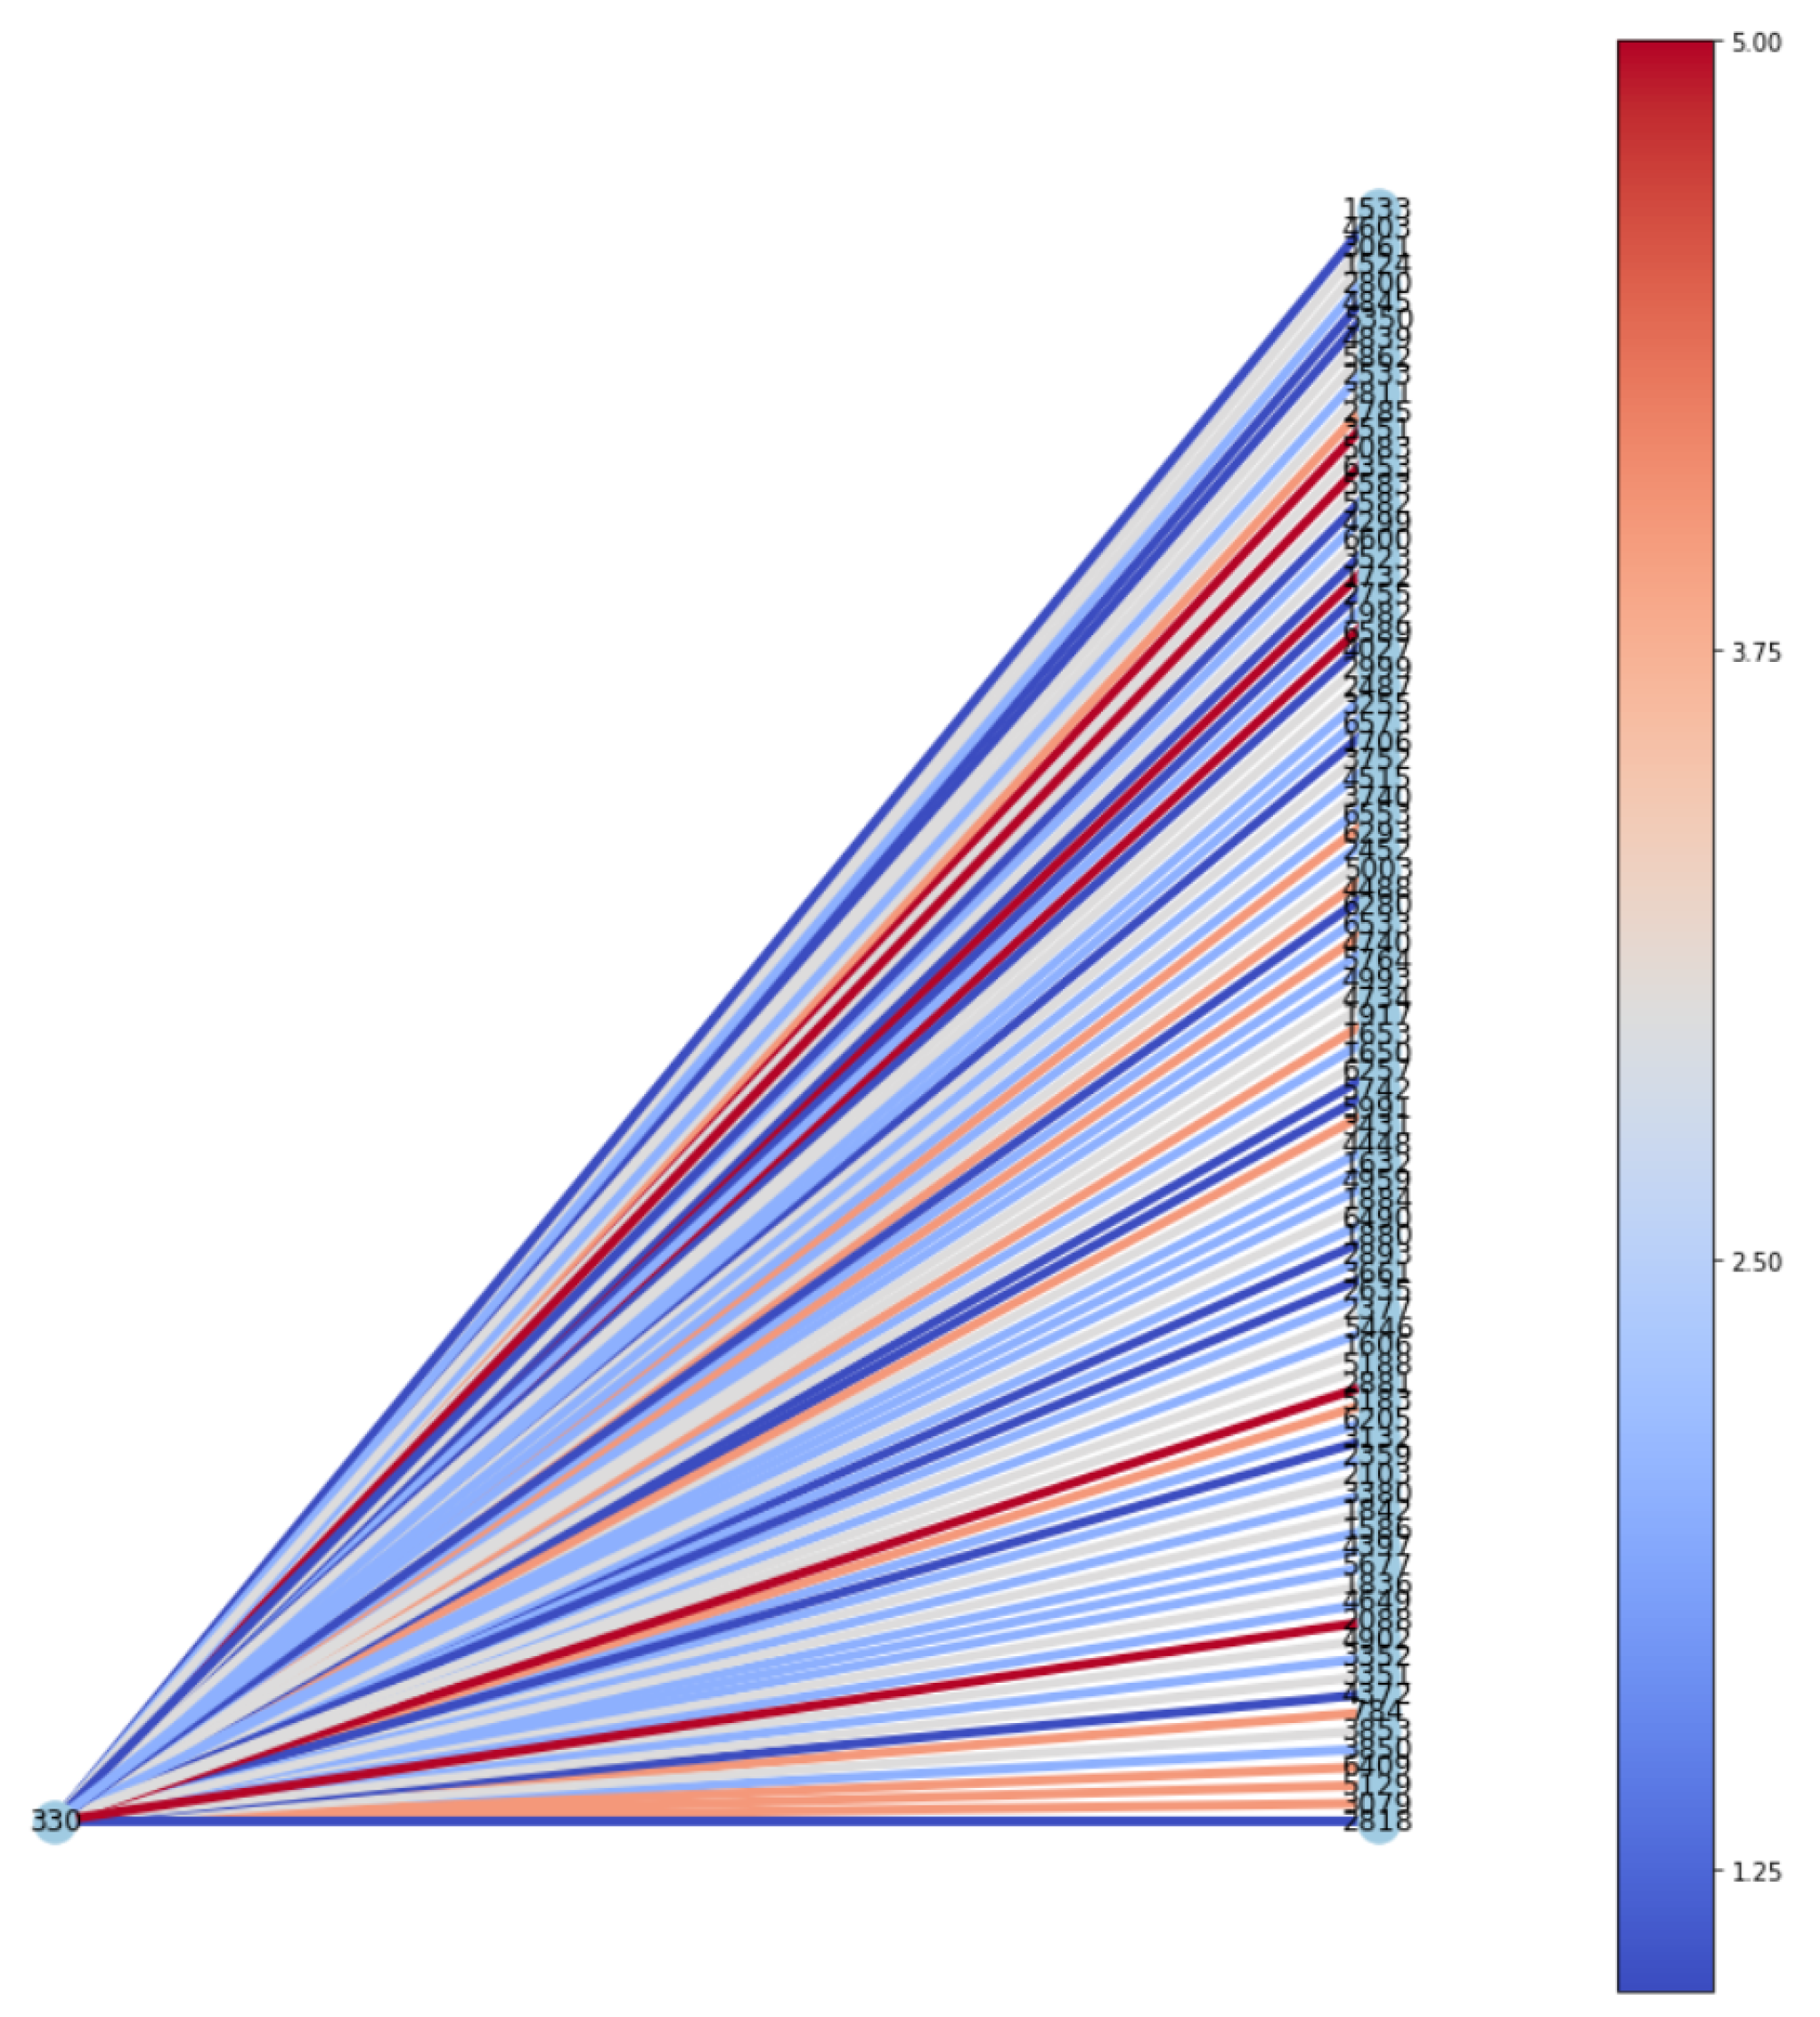
G. Visualization of subgraph
Inspired by [
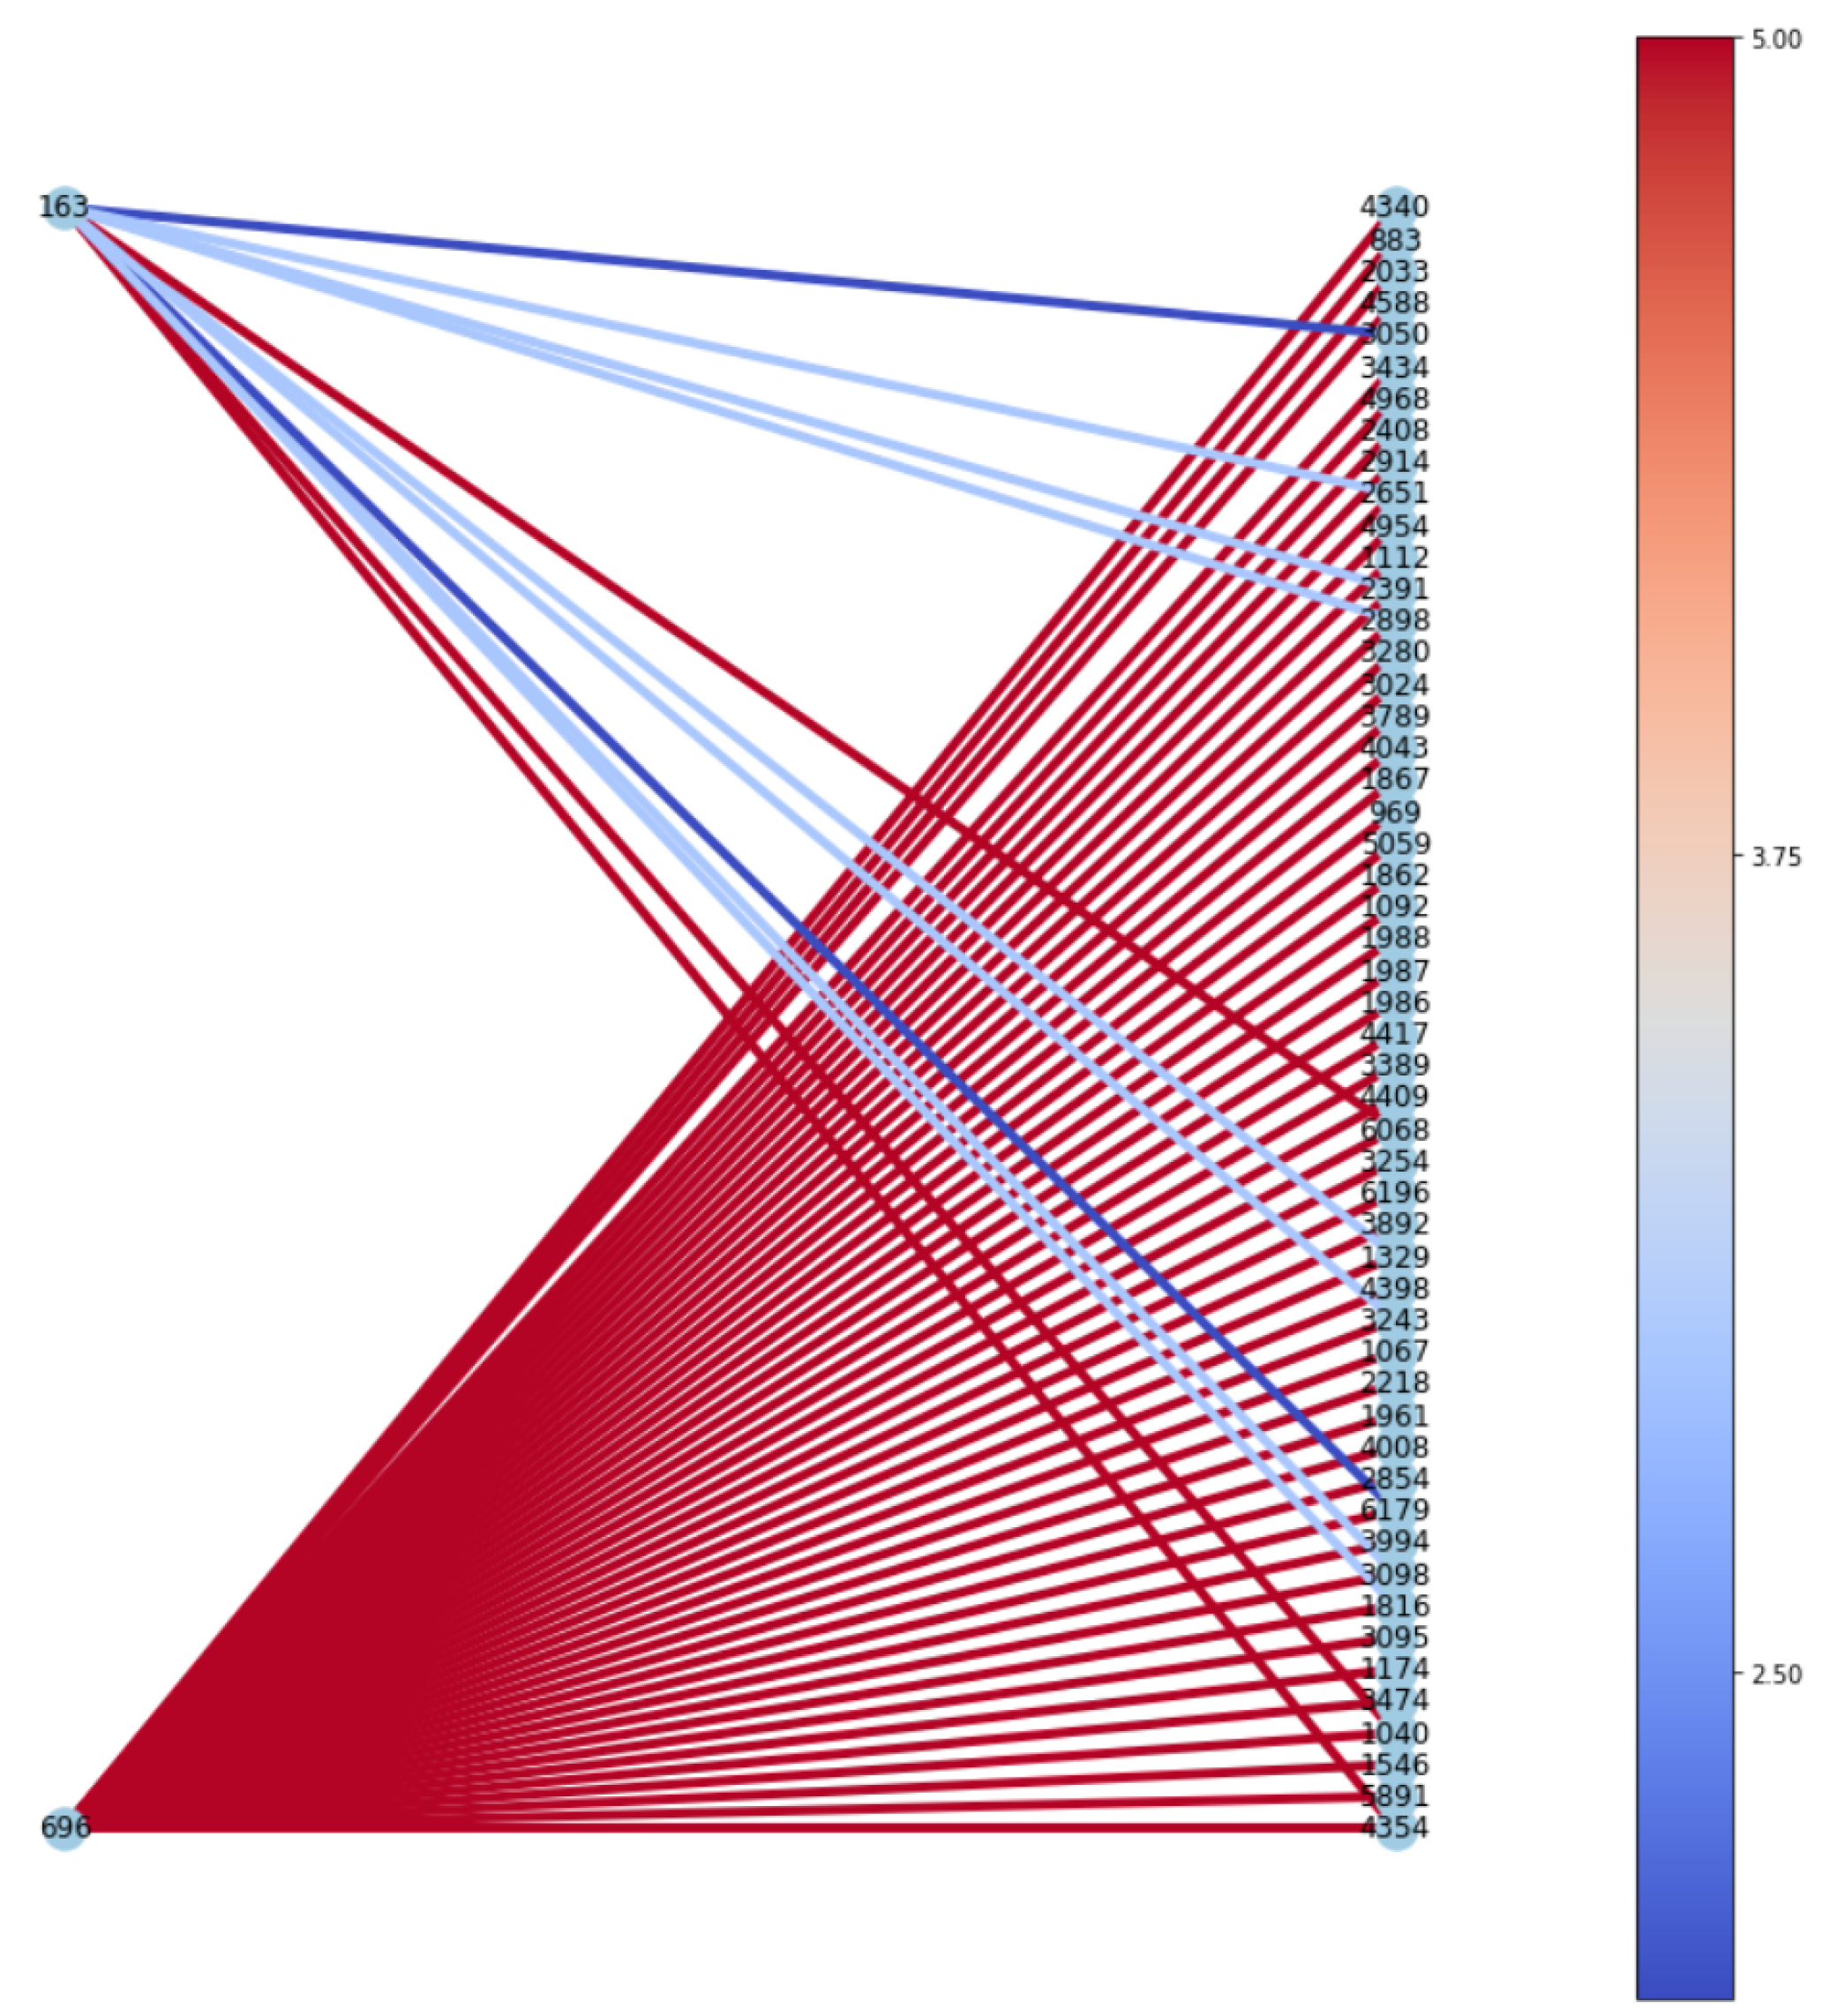
6], we visualized subgraphs of testing data with the highest and lowest predicted ratings for Rotten Tomatoes, as shown in
Figure 8 and
Figure 9, respectively. As IGMC produces distinct subgraph patterns for each rating, it is helpful to look at those patterns for further investigation closely. In each subgraph, nodes on the left are users, and nodes on the right are 100 neighbor items that the model referred to produce the predicted rating for the target item. In
Figure 8, the model produced a low score (i.e., 0.73) for the target item, and the items the model referred to tended to have relatively lower ratings, colored in blue. On the other hand,
Figure 9 visualized a case where the higher the predicted score was (i.e., 4.68), the higher the actual ratings of the neighboring nodes were, colored in red.


