Article

Using Artificial Neural Network Models to Assess Hurricane Damage through Transfer Learning

Department of Physics & Physical Oceanography, University of North Carolina Wilmington, Wilmington, NC 28403, USA
*
Author to whom correspondence should be addressed.
Current address: Department of Electrical and Computer Engineering, North Carolina State University, Raleigh, NC 27606, USA.
Appl. Sci. 2022, 12(3), 1466; https://doi.org/10.3390/app12031466
Submission received: 23 December 2021 / Revised: 11 January 2022 / Accepted: 20 January 2022 / Published: 29 January 2022
(This article belongs to the Topic Artificial Intelligence (AI) Applied in Civil Engineering)

Abstract

:
Coastal hazard events such as hurricanes pose a significant threat to coastal communities. Disaster relief is essential to mitigating damage from these catastrophes; therefore, accurate and efficient damage assessment is key to evaluating the extent of damage inflicted on coastal cities and structures. Historically, this process has been carried out by human task forces that manually take post-disaster images and identify the damaged areas. While this method has been well established, current digital tools used for computer vision tasks such as artificial intelligence and machine learning put forth a more efficient and reliable method for assessing post-disaster damage. Using transfer learning on three advanced neural networks, ResNet, MobileNet, and EfficientNet, we applied techniques for damage classification and damaged object detection to our post-hurricane image dataset comprised of damaged buildings from the coastal region of the southeastern United States. Our dataset included 1000 images for the classification model with a binary classification structure containing classes of floods and non-floods and 800 images for the object detection model with four damaged object classes damaged roof, damaged wall, flood damage, and structural damage. Our damage classification model achieved 76 % overall accuracy for ResNet and 87 % overall accuracy for MobileNet. The F1 score for MobileNet was also 9 % higher than the F1 score of ResNet at 0.88. Our damaged object detection model achieved predominant predictions of the four damaged object classes, with MobileNet attaining the highest overall confidence score of 97.58 % in its predictions. The object detection results highlight the model’s ability to successfully identify damaged areas of buildings and structures from images in a time span of seconds, which is necessary for more efficient damage assessment. Thus, we show that this level of accuracy for our damage assessment using artificial intelligence is akin to the accuracy of manual damage assessments while also completing the assessment in a drastically shorter time span.

1. Introduction

Coastal storms and hazard events are often analyzed to address dangers faced by coastal communities around the world. Many potential threats to communities residing in coastal areas are captured with a comprehensive plan for risk analysis. In 2018, a preliminary risk analysis estimated almost $17 billion in damages across the state of North Carolina in the wake of Hurricane Florence [1]. As a result, accurate and efficient evaluations of damage from coastal hazards such as hurricanes are necessary to provide data for addressing post-disaster relief efforts. Damage assessment is a primary tool for understanding the levels of damage to coastal populations in the aftermath of a hazard event. Knowledge of damage is further applied to models for risk assessment to mitigate damage from future hazards [2].
Efficient relief plans and proper allocation of relief funding to the affected areas are impractical without accurate data. Traditionally, post-disaster data have been collected through methods involving individuals or teams making initial observations and assessments of damage. These people capture photographs of the damage in door-to-door assessments or windshield surveys (e.g., [3,4]). Remote validations are a supplemental tool used during the damage assessment process which increases the swiftness of the manual evaluations. These desktop assessments replace onsite validations when the risk for preliminary damage assessment staff is high and images of the damaged area are readily available [4]. However, these validations still rely on humans to identify damaged structures and verify damage assessments making them prone to a significant level of inaccuracy.
In a myriad of classification tasks, artificial neural network technology has proven to be significantly more efficient in performing the same work as a human to a higher level of accuracy. Machine learning techniques possess particular advantages over humans in tasks that incorporate a large data set from multiple events of highly similar situations [2]. Hurricanes provide a multitude of events for data collection that can be used by artificial neural network models to perform damage assessment. There are usually two types of data capturing hurricane damage to buildings. The first type is satellite imagery (e.g., [5,6]), and the other type is ground-level images/photos (e.g., [7]) taken by drones or other similar ways. Both data types have been used for damage assessment. For example, Weber and Kané [8] used the Mask R-CNN [9] to predict both building locations and damage level based on pre-disaster and post-disaster images of xBD database [6]. Furthermore, Hao et al. [10] developed a multi-class deep learning model with an attention mechanism to assess damage levels of buildings given a pair of satellite images depicting a scene before and after a disaster using the xView2 dataset [11]. Cheng et al. [12] developed a stacked convolutional neural network architecture to train on an in-house visual dataset from Hurricane Dorian that was collected using an unmanned aerial vehicle. An effective hurricane damage assessment model should train on both aerial and ground-level image data to increase adaptability for emergency damage assessment of a future coastal hazard.
Social media has been explored as a primary source of data for hurricane damage assessment because of the swift integrability these platforms provide to automated damage assessments (e.g., [13,14,15]). Hao and Wang [16] used five machine learning classifiers that take social networking platform images and output the damage types and severity levels presented in images. Leveraging social media platforms to train damage assessment models has shown success with rapid operation capabilities.
The transfer learning approach to developing artificial neural network models for hurricane damage assessment has also been recently explored. Most of these studies focus on using transfer learning on pre-trained convolutional neural network (CNN) models with aerial images of hurricane damage to buildings (e.g., [17,18,19,20]). Liao et al. [21] uses transfer learning on two well-established CNNs, AlexNet and VGGNet, to create classification models for the two-dimensional orthomosaic images gathered from unpiloted aerial systems. These and other similar studies limit the source of the training dataset, making the classification models useful only for functional datasets comprised of aerial images taken by satellite or drone. Our work incorporates both aerial and ground-level images for hurricane damage classification and detection of damaged buildings to create a more operational damage assessment framework to apply to future coastal hazards.
Incorporating transfer learning for building damage assessment is affected by the transferability of the learned features and information from the source domain to the target domain used for testing the model. Domain adaption when using transfer learning arises when there are discrepancies among images in the source domain and between the source and target domains (e.g., [22,23]). These discrepancies are a result of how remote sensing captures images with varying sensors, locations, times, and perspectives. This issue with domain invariance extends to the transferability of information derived from different coastal hazards. A CNN-based model was shown to reach high classification performance when training on the same damage type for different disasters [24]. The source and target domains in our study do not present any major discrepancies. Rather, our damage classification and damage detection models focus on a single coastal hazard that causes multiple types of damage to enhance the efficacy of damage assessment.
There are several challenges in the area of building damage assessment using artificial neural network models. First, machine learning training requires a considerable amount of input data in order to sufficiently assess the damage or classify the damage levels from images (e.g., [5,6]). Second, in-house machine learning model development requires a significant amount of effort to achieve high accuracy. This study focuses on the building damages due to hurricanes in the U.S. southeast area, and we improve the efficiency of assessing hurricane damage to buildings by applying neural network models for damage classification and object detection. We address the first challenge by developing our in-house building damage dataset using internet search engines, and we address the second challenge by utilizing the advanced artificial intelligence models for computer vision, MobileNet [25], ResNet [26], and EfficientNet [27], through transfer learning.
This paper is organized as follows: Section 2 presents the development of our in-house building damage images including data collection, data statistics, and data pre-processing. 
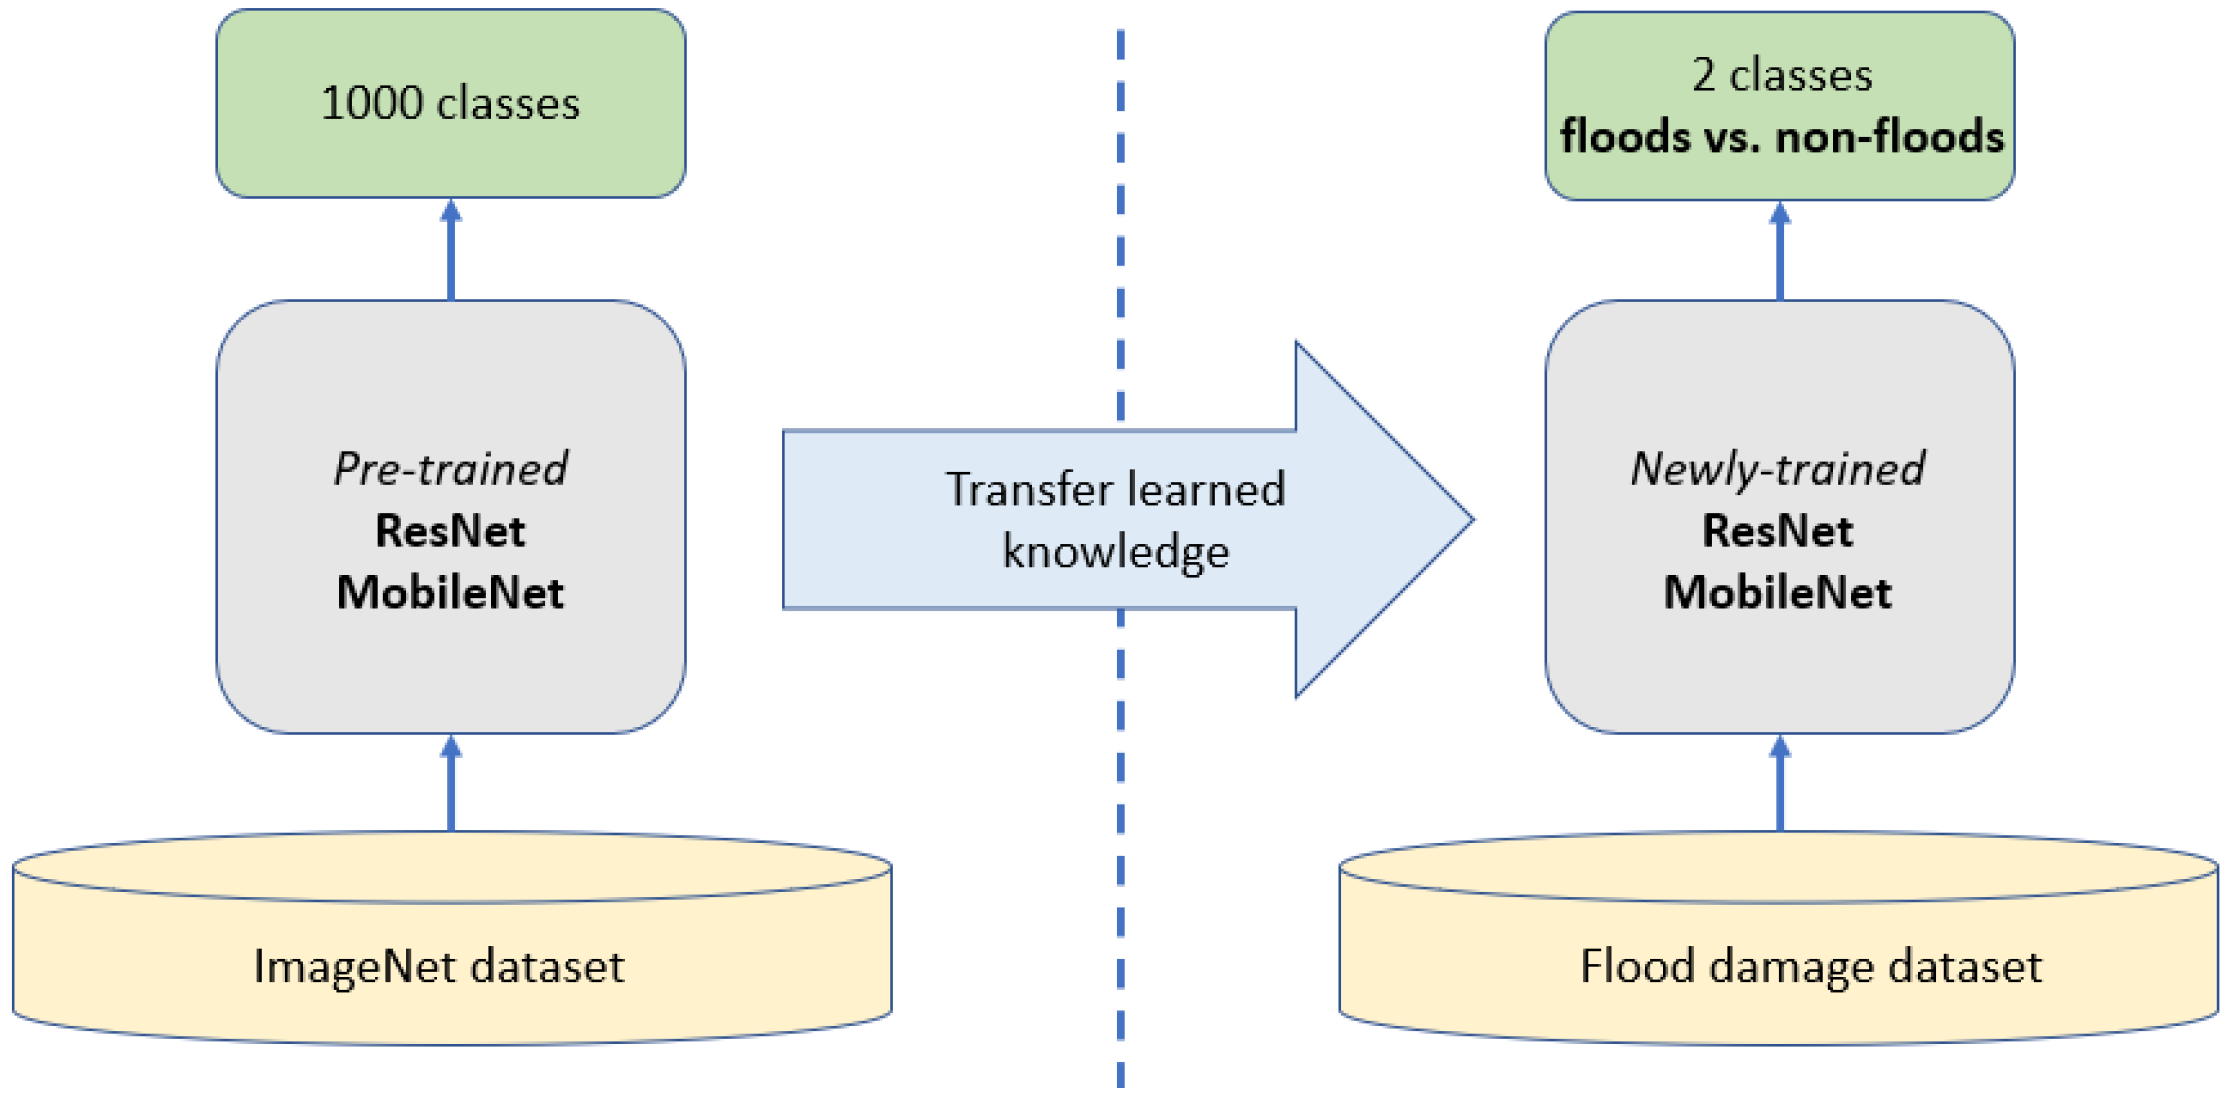
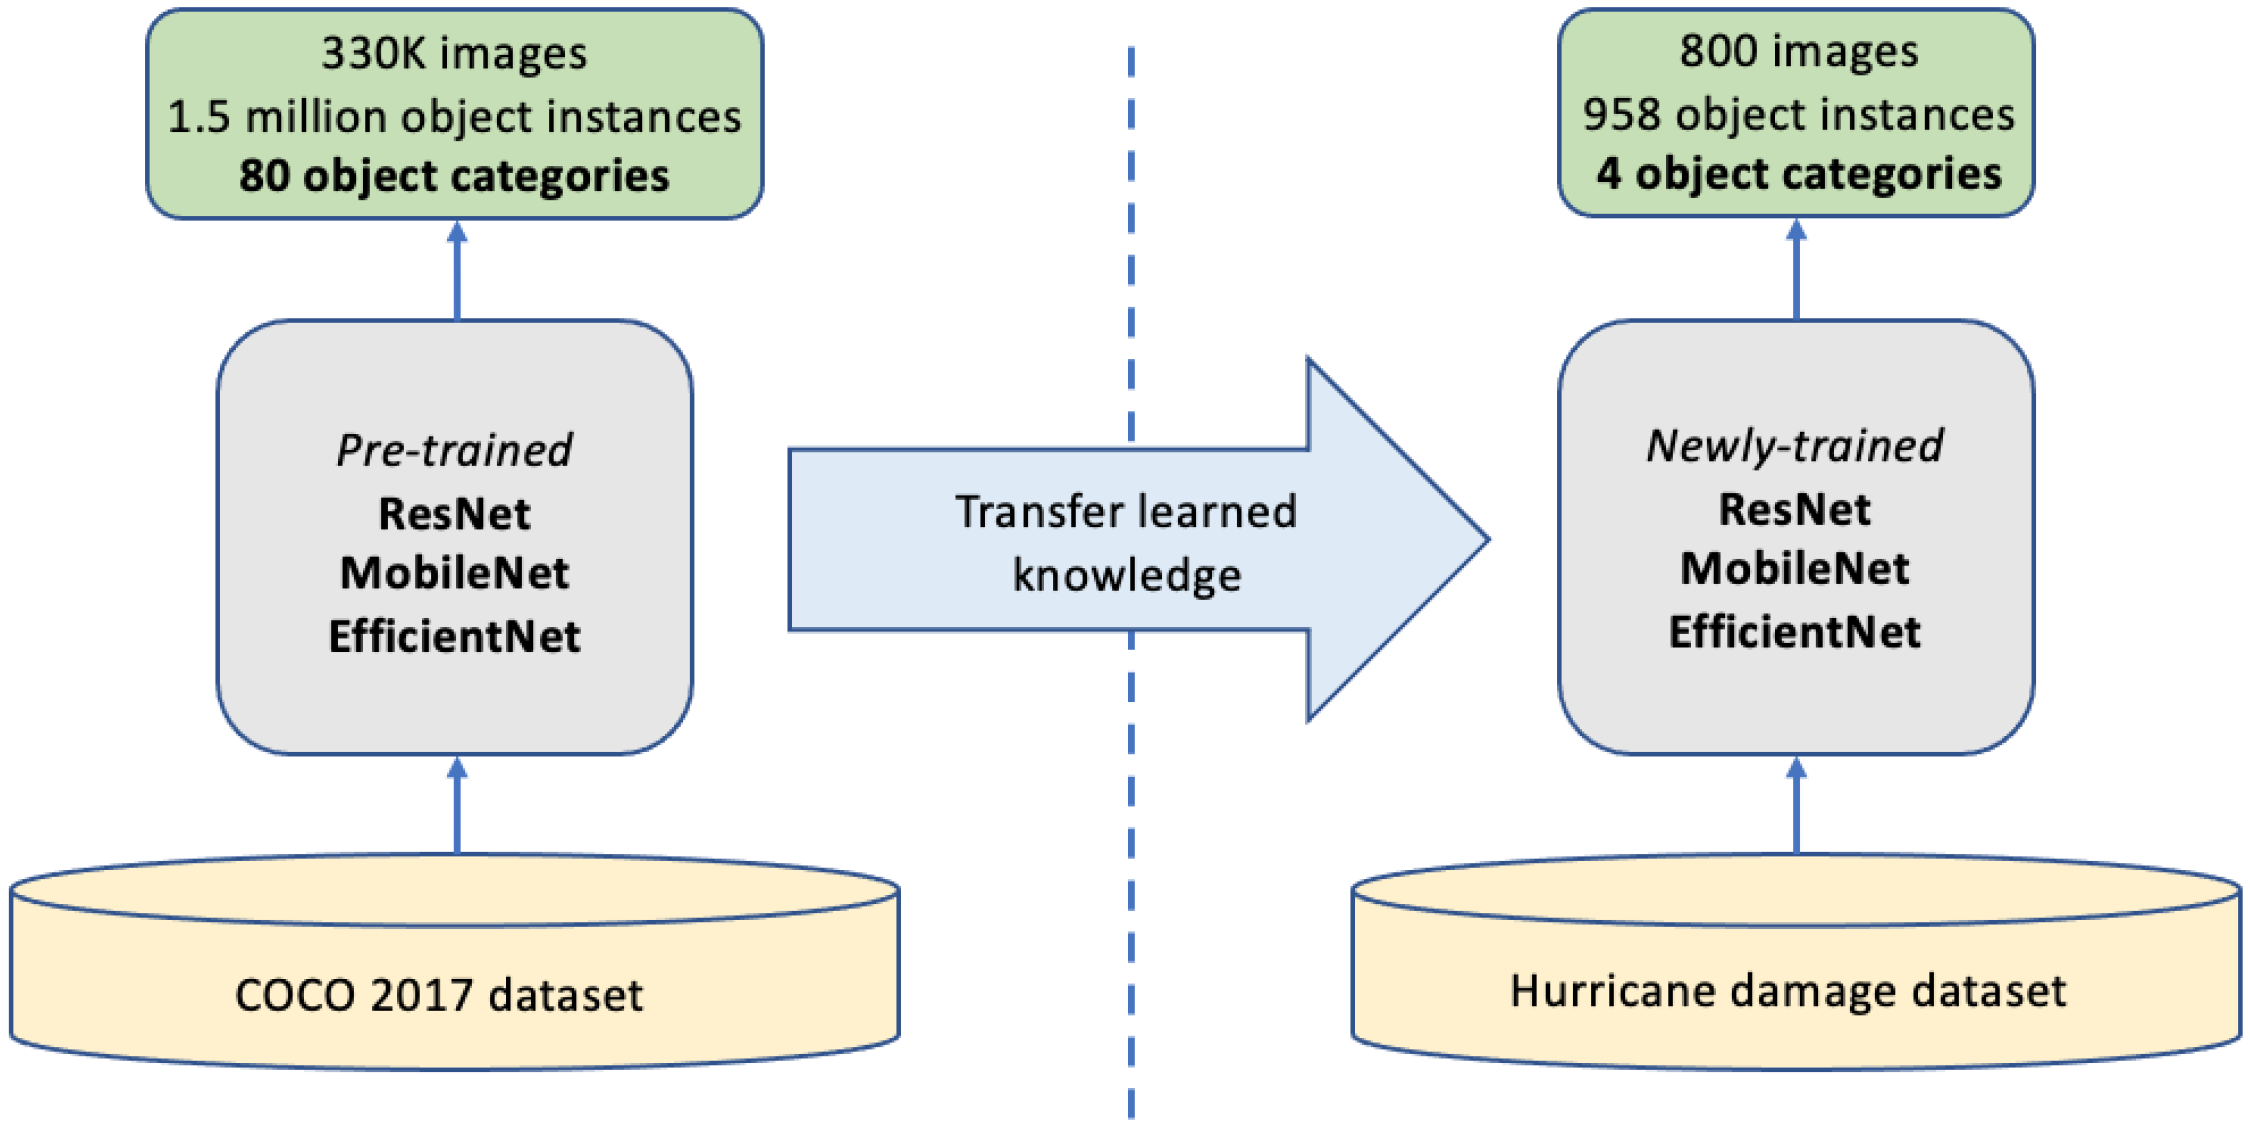
Section 3 reviews the background of three artificial intelligence models that were used as the base of transfer learning for building damage assessment and explains the transfer learning workflow for both damage classification and damage detection. 
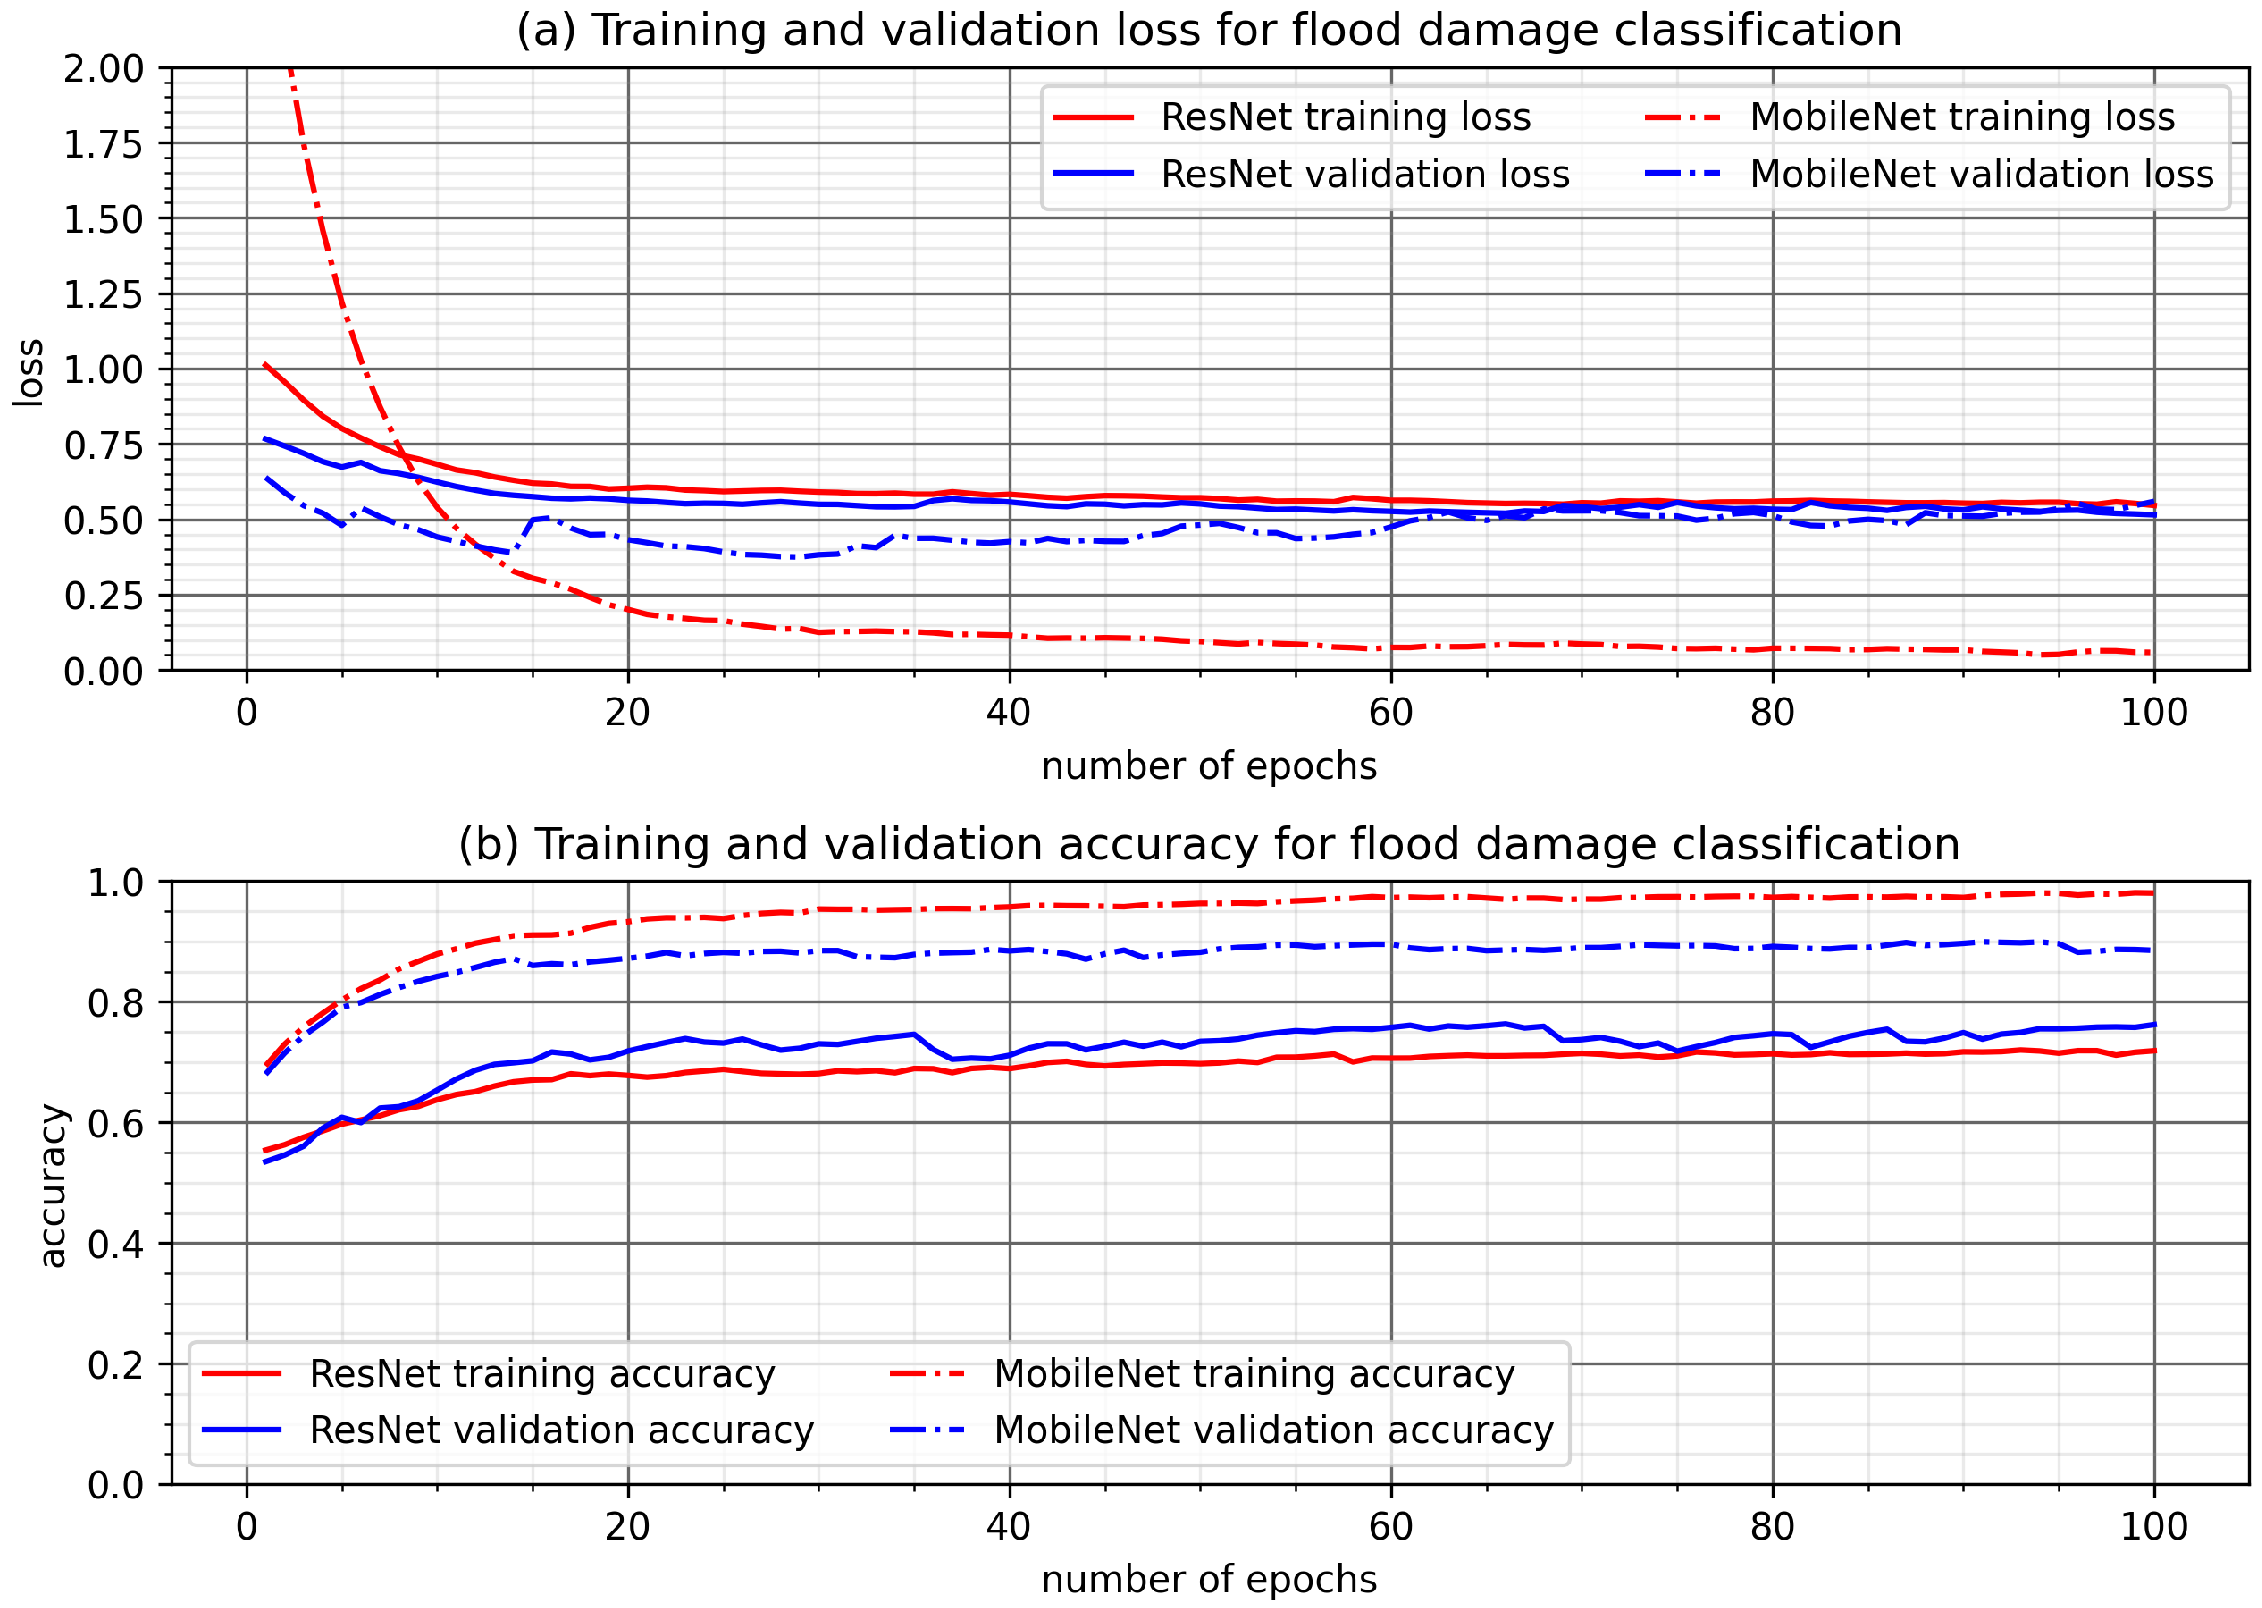
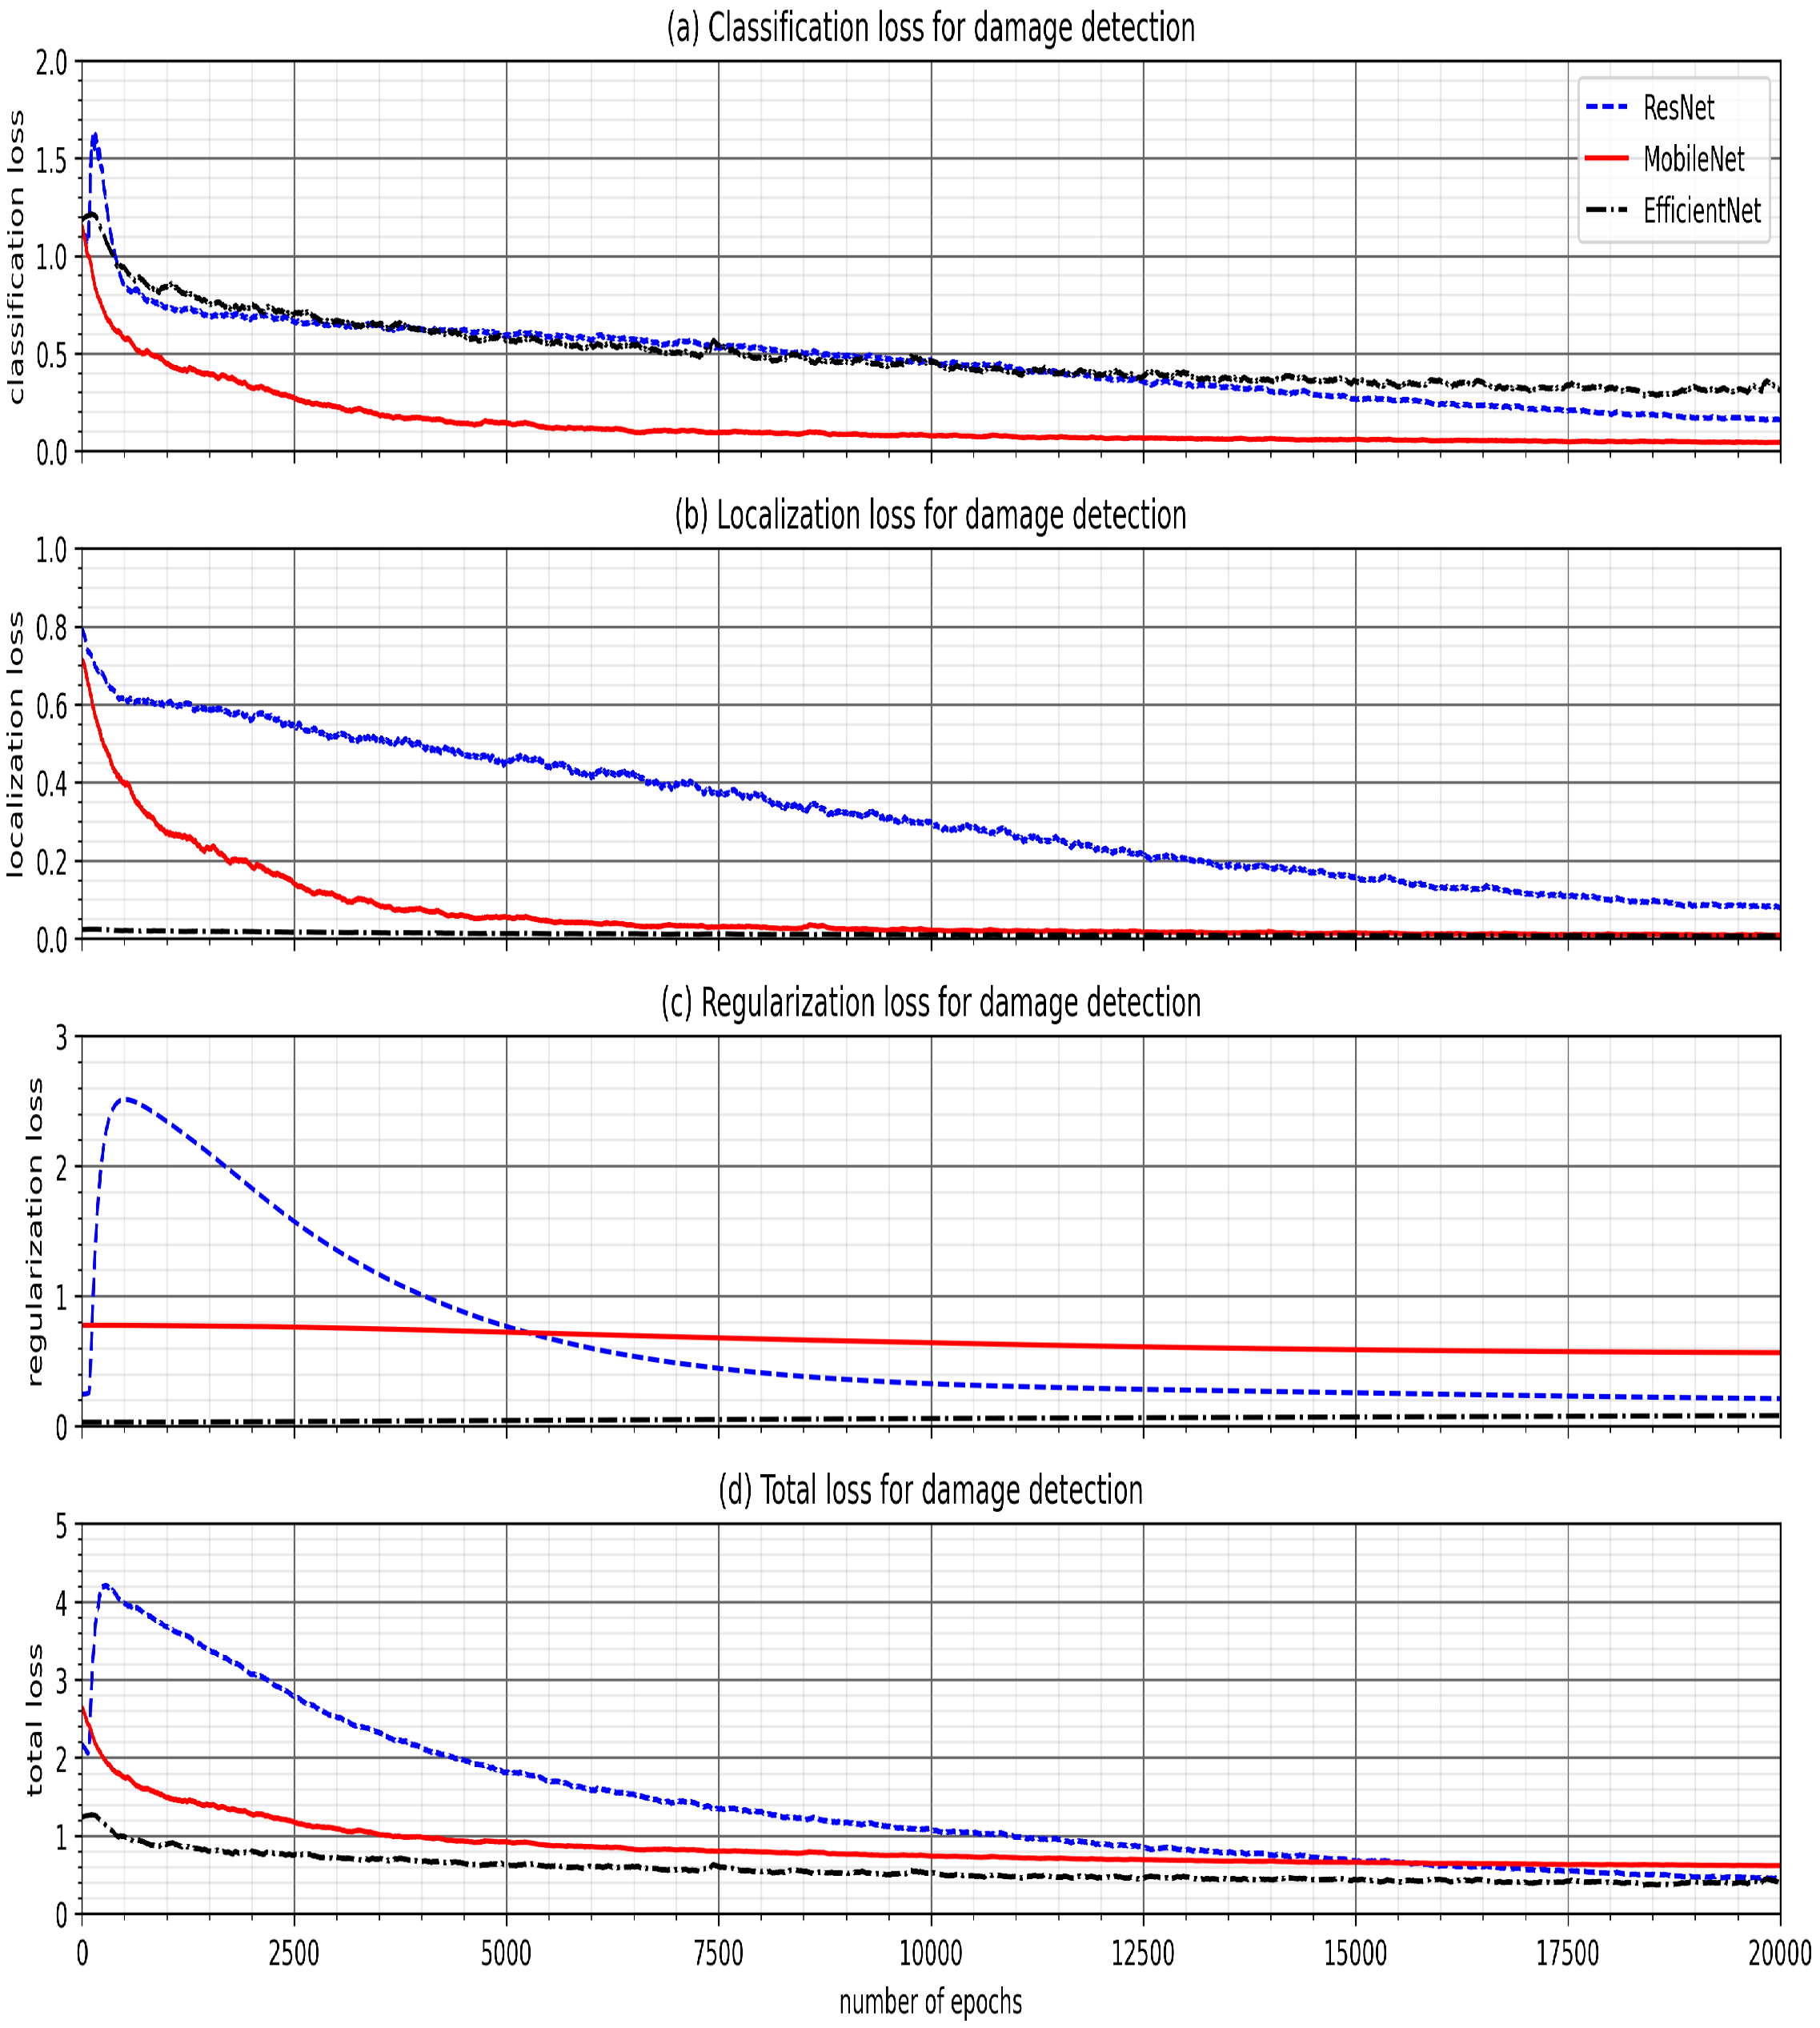
Section 4 presents the training metrics, the damage classification results, and the damage detection results, further discussing the transfer learning results among three models. Finally, the conclusion and significance of this study are stated in Section 5.

2. Building Damage Dataset

This section first presents the development of our in-house building damage image dataset. Then, we explain the data statistics for damage classification and damage detection.

2.1. Data Collection and Preparation

This study primarily focuses on the hurricane damage to buildings in the U.S. southeast region. We sourced the data from an internet search specifying criteria for photos related to hurricane damage, and a few thousand images taken from hurricane damage in Florida, Georgia, North Carolina, and South Carolina were prepared for a preliminary data cleanup. Each image in our in-house dataset was further examined for types of buildings and structures contained in the images to ensure they were characteristic of the U.S. east coast region.
The raw dataset was further processed for two tasks: damage classification and damaged object detection. For the first task, we examined the data to be used in the classification model and identified potential classes for image categorization. This step involved the additional cleanup and removal of remaining images that were duplicates or would not be a candidate for one of the image classes. For the second task, we also examined individual images to be used in the object detection model and removed those that did not capture a damaged structure. After final examination of both versions of the data, the images were ready for pre-processing before inputting them into the neural network models using transfer learning.

2.2. Data Statistics

The next step required dividing the dataset into a set for the classification model and a second set for the object detection model. The main difference among the two datasets was that the set applied to object detection required images only containing buildings, and the set applied to classification was independent from only using images containing buildings. Images contained in both sets of data are of varying pixel resolution and unaltered from the original source.
Historical hurricanes usually brought about significant flood damage due to storm surges and heavy precipitation. Thus, the damage classification research in this work aims to determine if there are floods in the image. To this purpose, we selected 1000 images from our dataset and divided them into two categories, floods and non-floods, as indicated in Table 1. The motivation is to examine if neural network models can perform binary classification on our dataset. Flood damage is characterized by flood waters in the images, and it can occur in various ways. Typical floods damages in our dataset include (1) flooded buildings, houses, and communities, (2) flooded streets, (3) flooded vehicles, and (4) flooded coastal areas. The non-floods images are related to hurricane damage, but they do not include floods in them; these images needed to be characteristic of areas and buildings damaged from hurricanes because the purpose of our classification models is to exemplify their success learning from data that would be used for traditional hurricane damage assessment. Finally, the binary classification task does not require additional data processing other than sorting the images into two categories.
Unlike the data preparation for damage classification, machine learning object detection requires the preparation of labeled data, which guides the model to learn common features in a specific type of object. The pre-processing image labeling in this work was accomplished by using the open-source annotation tool, LabelImg [28]. This tool allowed us to take an input image in our dataset and create bounding boxes around the areas of interest in the image corresponding to an annotation label. The position of the bounding box and the label were then exported for neural network model training. The object detection dataset consisted of 800 images that were annotated, and annotation labels are the damaged objects as listed in Table 2. Four categories of objects were identified from our hurricane damage dataset, and the features associated with each of them are briefly explained below.
  • Damaged roof. The bounding box label highlights a roof that has the whole roof, some shingles, or parts of the roof damaged. The bounding box label typically encompasses the entire roof in the image; however, if the entire roof is not visible then the damaged area and any additional parts of the roof that are visible were included.
  • Damaged wall. The labeling bounding box highlights a damaged building wall or windows within a wall. Damage to walls/windows could range from areas with minor disintegration of brick or glass structure to entire loss of the wall or window structure.
  • Flood damage. The bounding box label highlights flood waters in an image. The flood water can occur in various places as explained in the binary classification dataset. Due to this sporadic nature, in some images, multiple bounding box labels were used to encapsulate the entirety of the flood water.
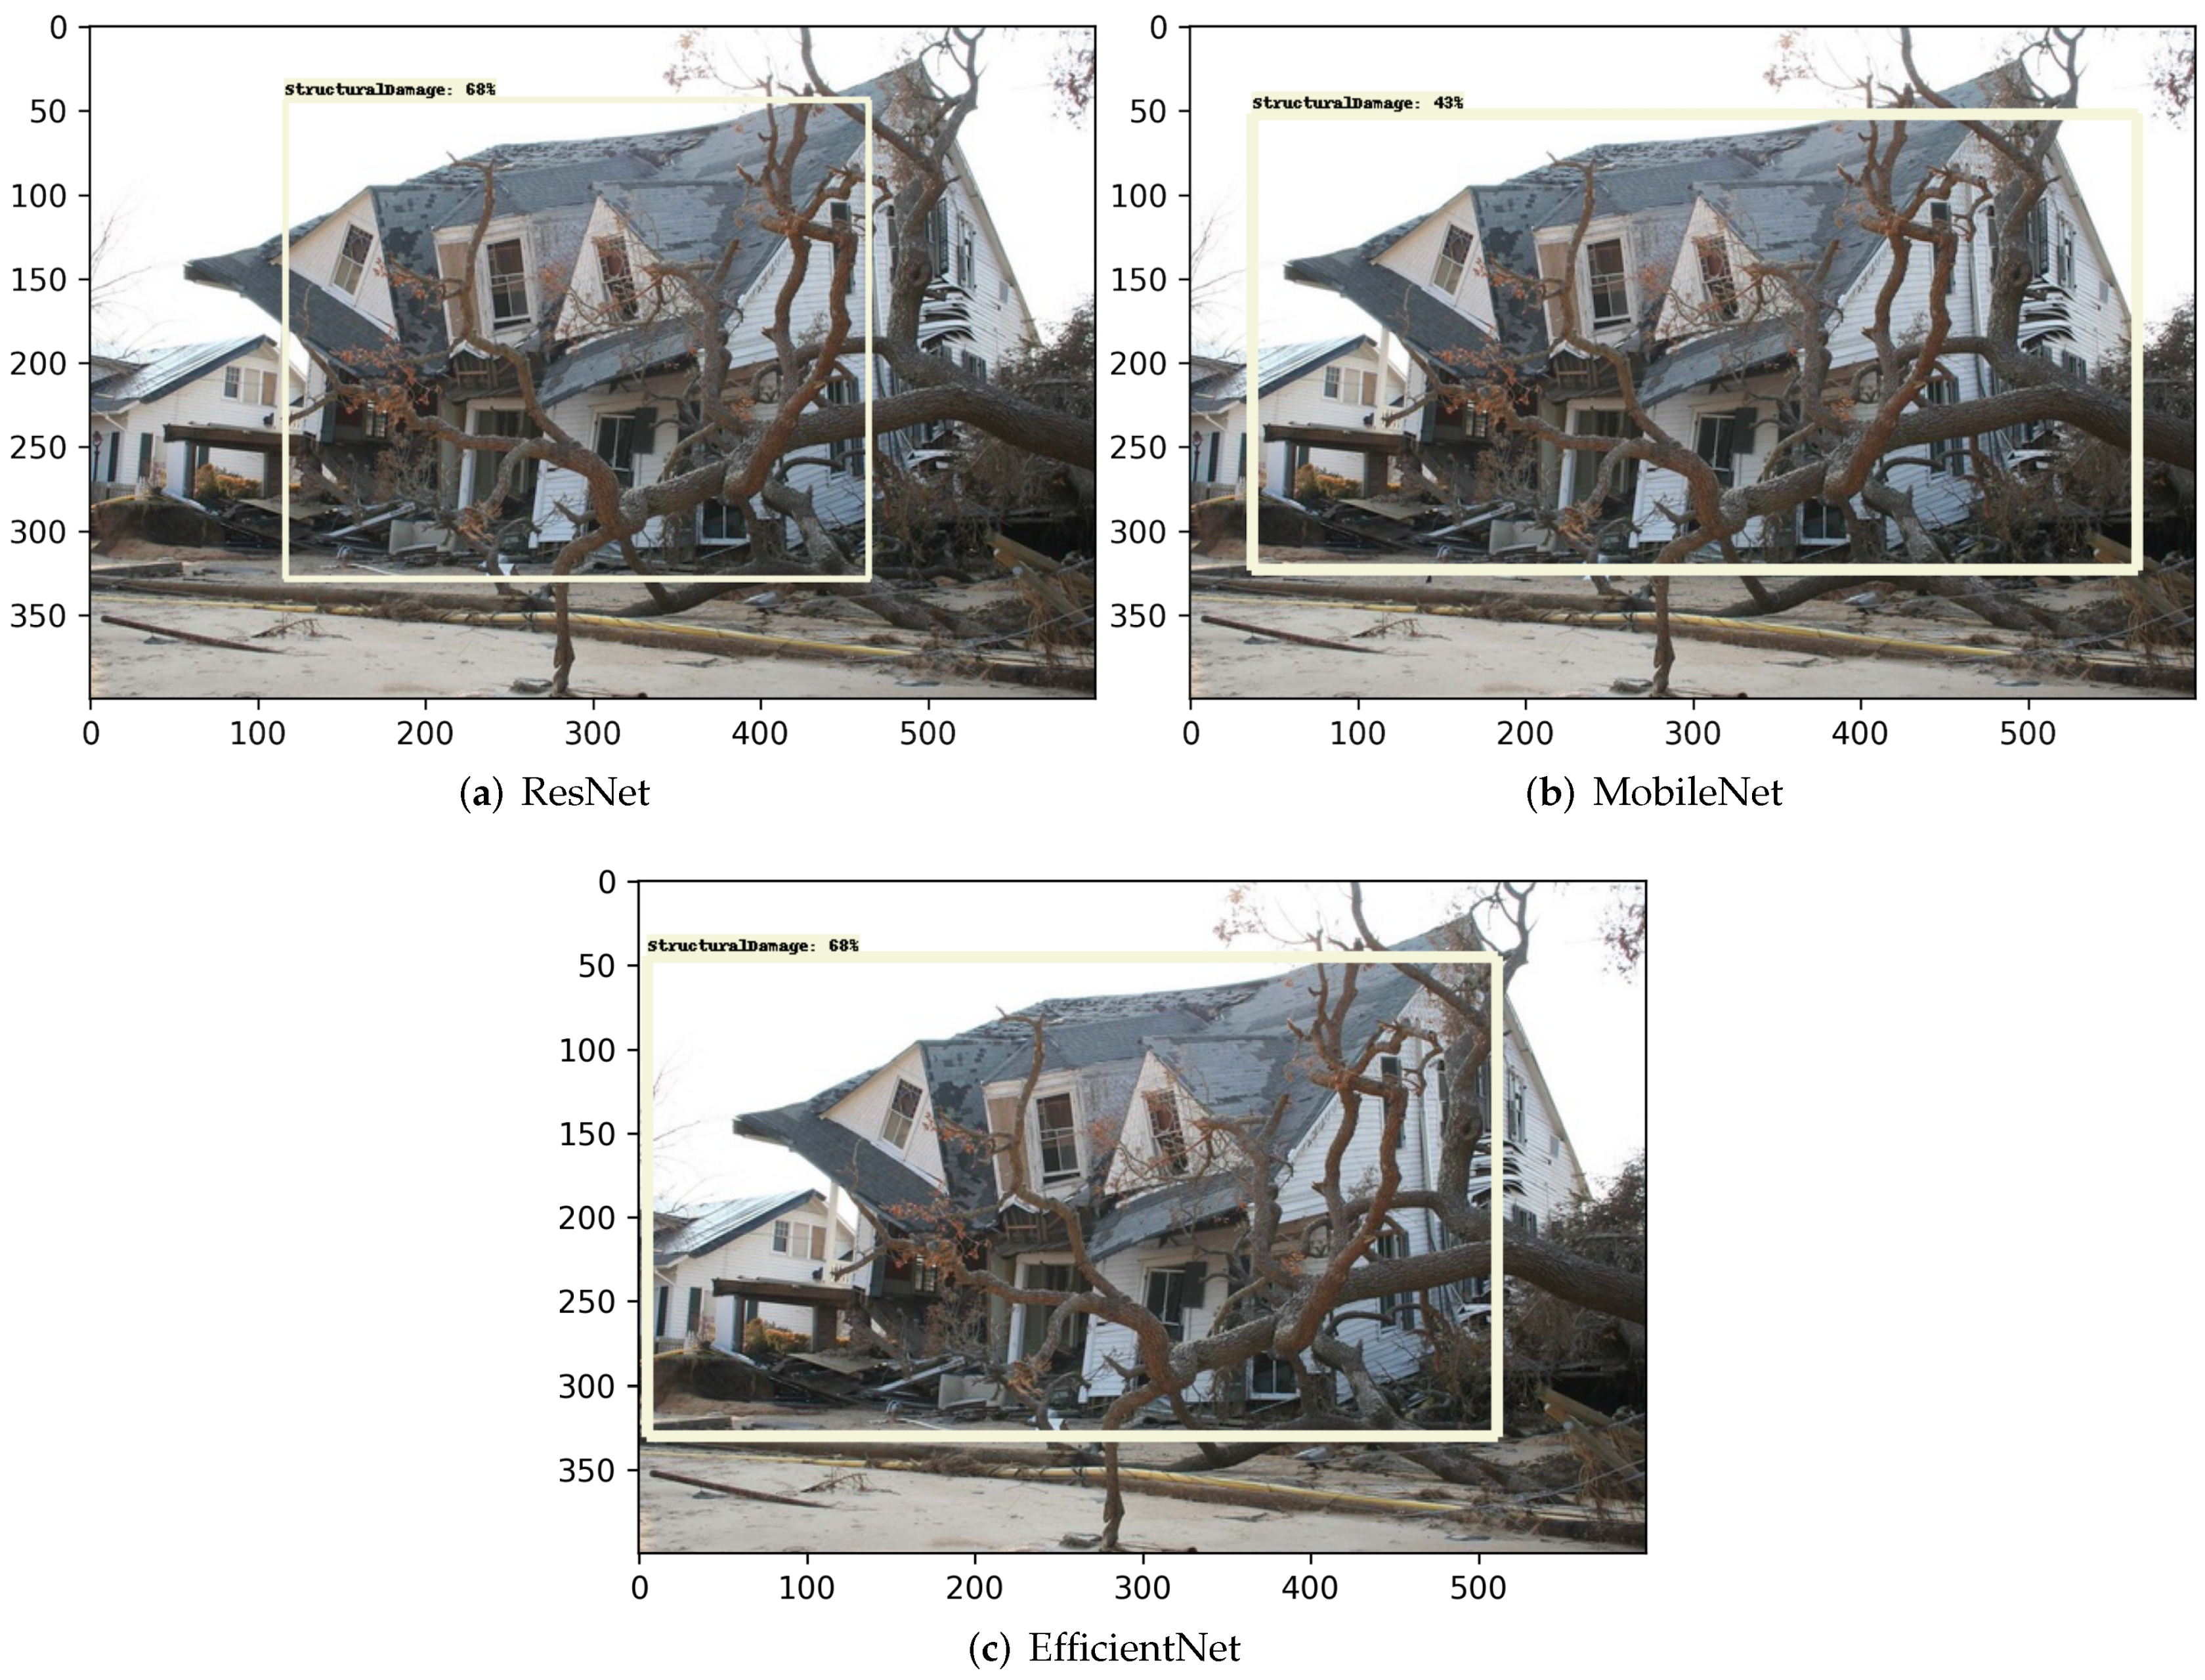
  • Structural damage. The bounding box label highlights a building suffering from structural damage, e.g., the disintegration of the roof and/or any floor(s) within the building, complete loss of multiple walls/structures, or the collapse of the whole building.
It should be pointed out that the total number of samples in Table 2 is 958, which is greater than the total number of annotated images, i.e., 800. The difference is due to the fact that multiple objects were annotated/observed in a single image, resulting in a larger number of objects than the number of images.

3. Transfer Learning

The previous section showed that our in-house hurricane damage dataset only has about 800–1000 images. To be able to develop effective hurricane damage assessment machine learning models using such a small dataset, we utilize a machine learning technique, transfer learning, in this work. This section first presents the background information about transfer learning. Then, we review the existing neural network models that were used in this study, and we focus on the typical model architecture. Next, we present the transfer learning workflows used in this study.

3.1. The Fundamentals of Transfer Learning

Transfer learning is a machine learning technique that leverages feature representations from a pre-trained artificial neural network model to train a new target model on a different, usually smaller size dataset. The crucial step for implementing transfer learning is to use learned weights/parameters from a pre-trained neural network model, which is a saved model that was previously trained on a large dataset, e.g., the ImageNet [29] and Coco [30] datasets. This choice is justified by the fact that if the original dataset is large enough and general enough, then the spatial hierarchy of features learned by the pre-trained models can effectively act as a generic model of the visual world; thus, its features are useful for many different computer vision problems, even though these new topics involve completely different classes than those of the original task [31].

3.2. Artificial Neural Network Models

This study utilizes three well-established neural network models in computer vision, namely, ResNet [26], MobileNet [25], and EfficientNet [32]. These networks were selected for several reasons. First of all, we aim to explore the efficiency of varying neural network architectures for hurricane damage assessment. To that end, collating results from multiple models would provide deeper insight than results obtained from one model trained on a single neural framework. Second, these models have been pre-trained using large image datasets, and their pre-trained weights are freely available. The following sub-sections provide a brief review of the selected three neural network models with a focus on their typical model architecture.

3.2.1. ResNet

The ResNet architecture was developed with a deep residual learning framework to directly address the issue of degradation of training accuracy in deeper networks that begin to converge [26]. Identity shortcut connections within the ResNet architecture do not rely on parameters and allow a continuous flow of information between layers as well as additional learning of residual functions. Thus, the residual net framework allows for easier optimization of the residual mapping and increased accuracy from enhanced depth of the residual nets [26]. The 50-layer ResNet contains a 3-layer bottleneck design that results in a more efficient model when paired with the identity shortcuts. We incorporated the 50-layer ResNet architecture into our model to match the target input resolution and simplistic model structure.

3.2.2. MobileNet

The MobileNet architecture focuses on streamlining the convolution layers through depthwise separable convolutions to build an attenuated deep neural network [25]. The separation of the convolution into two layers, one for filtering the inputs and one for combining the outputs with the depthwise convolution, significantly decreases the magnitude of computation and model scale. This in turn generally leads to low latency for incorporating the MobileNet model into classification and object detection.
Additionally, the MobileNet architecture makes use of two global hyper-parameters: a width multiplier and a resolution multiplier. The width multiplier aims to shrink each layer of the network in a uniform fashion, while the resolution multiplier is applied to the input image which results in reducing each subsequent layer by the same parameter [25]. We incorporated MobileNet V1 to match the target input resolution and maintain consistency with the choice of primitive model architectures.

3.2.3. EfficientNet

The EfficientNet architecture was created through a focus on prioritizing efficiency while maintaining state-of-the-art accuracy. Traditionally, convolutional neural networks are scaled up from a baseline model to improve the accuracy of detections/classifications; more training data and model layers generally produce more accurate predictions. EfficientNet uses compound scaling of the network’s dimensions (width, depth, and resolution) to achieve high accuracy while striving to be the most efficient CNN [32].
The EfficientDet network is an extension of the EfficientNet architecture that was created specifically for object detection applications; it uses the EfficientNet model architecture as a base network. This variant of EfficientNet focuses on compound scaling paired with a weighted bi-directional feature pyramid network (BiFPN) to connect subsequent layers of the model together for the most successful optimizations of model efficiency and accuracy [27].

3.3. Transfer Learning Workflow for Flood Damage Classification

Figure 1 shows the workflow to train ResNet and MobileNet for flood damage classification. Both ResNet and MobileNet were trained using the ImageNet dataset, which includes more than 1 million images and 1000+ target classes or labels. Our transfer learning work utilizes the pre-trained knowledge in these two models, i.e., model weights that characterize typical features in images in the real world. Specifically, our hurricane damage classification transfer learning work consists of the following steps.
  • Obtain the pre-trained neural network model and its weights;
  • Remove the top layer which is used to predict the original 1000 classes;
  • Freeze other layers in the pre-trained model to avoid destroying any of the extracted feature information;
  • Add new and trainable layers on top of the frozen layers. These layers learn to turn the old features into the target predictions (i.e., floods and non-floods images) using a new dataset;
  • Train the new layers on our in-house hurricane damage dataset related to flood damage.
It should be pointed out that there are no floods nor non-floods classes in the ImageNet dataset. As a result, the primary goal to use these pre-trained models is feature extraction. Our flood damage dataset was configured with a 60/20/20 split for training, validation, and testing purposes. Furthermore, data augmentation was used to increase our training samples to reduce model overfitting. The data augmentation technique randomly transforms training samples to yield believable-looking images, and it helps expose the model to more aspects of the data for better generalization [31].

3.4. Transfer Learning Workflow for Hurricane Damage Detection

Figure 2 shows the object detection workflow for training ResNet, MobileNet, and EfficientNet. All three networks were pre-trained on the same image resolutions (640 × 640 pixels) and the COCO 2017 dataset [30] which contains 330,000 images and 80 object categories. Each of the three models were also configurable to begin with the same training parameters. Therefore, the batch size was set to four images, and each model training instance was terminated after the twenty-thousandth epoch. Our damage detection dataset was configured with a 50/50 split for training and testing purposes when pre-processed into each of our models. This left 400 images and their corresponding annotations for model training and the other 400 images and their corresponding annotations for testing each of the models’ predictions. Our transfer learning work leverages the pre-trained model weights for features extracted from the typical objects contained within the COCO 2017 dataset. More specifically, our hurricane damage detection transfer learning work consists of the following steps.
  • Initialize training with pre-trained neural network model and extracted feature weights;
  • Configure a new pipeline with specified training parameters for our model;
  • Use the pre-trained model checkpoint as the starting point for adding new, trainable layers that contain predictions of the four distinct object categories in our dataset;
  • Train the new layers on our in-house hurricane damage dataset related to building damage.
Because the four object categories from Table 2 do not appear in the COCO 2017 dataset, the primary objective for using the pre-trained models is feature extraction.

3.5. Computing Environment

This machine learning research was conducted using Google Colab, a free Jupyter notebook environment that runs entirely in the cloud. The computing environment was configured as follows.
  • The CPU model name is Intel(R) Xeon(R) CPU @ 2.00 GHz;
  • The clock speed of the CPU is 2 K MHz, and the CPU cache size is 39,424 KB;
  • The Graphics Processing Units (GPU) card is NVIDIA Tesla P100. It is based on the NVIDIA Pascal GPU architecture, and it has 3584 NVIDIA CUDA cores. The GPU memory is 16 GB. A single GPU card was used in this study.

4. Results and Discussion

4.1. Metrics and Prediction Skills

The metrics utilized in tracking the training behavior of the classification models and object detection models differ and are presented in the following sections. Additionally, there are specific prediction skills primarily used in determining the success in evaluating the classification models.

4.1.1. Classification Metrics

The metrics used to track the progress of classification models during training are loss and accuracy. Cross-entropy loss is the particular formulation in Equation (1) where the index i is the i-th training example in a dataset, y i is the ground-truth label for the i-th training example, and y i ^ is the prediction for the i-th training example [33]. Cross-entropy loss is much larger for false predictions with a high level of confidence, resulting in those predictions being more denounced. Cross-entropy loss is used in many classifier models such as MobileNet and ResNet.
Cross-Entropy Loss = 1 N i = 1 N ( y i log ( y i ^ ) + ( 1 y i ) log ( 1 y i ^ ) ) .
Accuracy is defined by Equation (2) for binary classification models in terms of the four possible predictions: true positive ( T P ), true negative ( T N ), false positive ( F P ), and false negative ( F N ). This metric simply measures the percentage of correct predictions made during the validation step of training when considering the total number of predictions.
Accuracy = T P + T N T P + T N + F P + F N
In addition to the training metrics, the metrics used for evaluating the classification models include precision, recall, and the F1 score. Precision is defined by Equation (3) and measures the percentage of correct positive predictions when considering the total number of positive predictions made.
Precision = T P T P + F P
Recall is defined by Equation (4) and measures the percentage of positive predictions made when considering the total amount of positive samples.
Recall = T P T P + F N
The F1 score is an equally weighted combination of both precision and recall. Equation (5) describes the formulation of the F1 score which implies that both FP and FN predictions are considered in determining the value. This characteristic of the F1 score makes it a well-balanced measure of model performance.
F 1 score = 2 1 Precision + 1 Recall = 2 ( Precision Recall ) Precision + Recall .

4.1.2. Object Detection Metrics

The training metrics used to track the progress of the object detection models deal with the associated loss parameters for distinct training operations—the three major operations being classification, localization, and regularization. Classification loss is associated with the determination of the target object class [34]. Classification loss is represented as a combination of the cross-entropy loss from Equation (1) and the SoftMax activation function in Equation (6)
σ ( z ) j = e z j k = 1 K e z k
where z is a vector input containing K elements corresponding to the possible object classes, j is the index variable for the input vector z, and z j is the j-th element of z. The denominator of Equation (6) contains the normalization term that ensures σ ( z ) j is a valid probability distribution where all j elements sum to 1, allowing the predicted object classes to be converted to probabilities before computing the cross-entropy loss [33]. The localization loss is associated with bounding box regression to pinpoint the target object through training another head with an independent loss function [34]. This loss function must account for given samples/instances of bounding box coordinates represented as y i and the target coordinates of the ground-truth bounding box represented as y i ^ in Equation (7). This localization loss is characterized as a Mean Square Error (MSE).
MSE = i = 1 n ( y i y i ^ ) 2 n .
The third type of loss, regularization loss, aims to reduce overfitting in the neural network by penalizing certain values of the weights in each layer. The result is a constrained range of values for these weights that purportedly reduces the memory capacity of the model without sacrificing model performance. Regularization is formulated in two distinct fashions (and usually implemented as a combination of both) with L1 and L2 regularization. L1 and L2 are shown in Equation (8) with the weight value w, total number of weights in a given layer n, and the regularization hyperparameter λ
L 1 = MSE + λ i = 1 n | w i | ,
L 2 = MSE + λ i = 1 n w i 2 .
It is clear from Equation (8) that L1 is a function of a scaled sum of the magnitude of each weight value, and L2 is a function of a scaled sum of each weight value squared.
Finally, the total loss function is used as a generalized metric for evaluating the training performance. It is a weighted sum of the classification loss, the localization loss, and the regularization loss parameters that are calculated by the model. The model weights for classification loss and localization loss were kept equal at a value of 1.0 while the regularization loss weight was set to a much smaller fraction of the previous weights. This was standard for configuring the training of all three damage detection models. It should be added that there are two opposed structures for the heads being trained to evaluate the loss parameters mentioned above: the convolution head and fully connected head. The former is more appropriate and has better results for the classification task, while the latter is more advantageous at conducting bounding box regression [35].

4.2. Model Training

We present the transfer learning model training and validation metrics in this section. Validation occurs in the training process to evaluate the model’s predictions on the validation dataset which contains images the model has not encountered during training. This gives an objective estimate of the model’s accuracy and loss to compare to the training accuracy and training loss. Figure 3 shows the training metrics for flood damage classification using the cross-entropy loss and the accuracy defined in Equations (1) and (2), respectively. Figure 3a shows that the training loss and the validation loss using the ResNet model both converge to a value of approximately 0.5, indicating that the model does not experience overfitting or underfitting issues. On the other hand, training loss for the MobileNet model is around 0.05, while its validation loss is similar to that of ResNet, 0.5. Figure 3b shows training accuracy and validation accuracy for the two base models. Accuracy measures the ratio of correct prediction (including true floods damage prediction and true non-floods damage prediction) to the total number of predictions. The accuracy for the ResNet model converges to a value between 0.7 and 0.75. The accuracy using MobileNet is slightly different between training and validation. The training accuracy is close to 0.975, while the validation accuracy is about 0.9. Overall, the training metrics comparison shows that flood damage classification using the MobileNet model has a similar validation loss compared to that of ResNet, but it has a better accuracy.
Figure 4 shows the training metrics for hurricane damage detection which utilize the cross-entropy, MSE, L1, and L2 loss functions in Equations (1), (7) and (8). Figure 4a shows that EfficientNet converges to an approximate value of 0.3, ResNet converges to an approximate value of 0.18, and MobileNet converge to the lowest value of training classification loss at approximately 0.05. All three models achieve values for classification loss ≤ 0.3, which is generally accepted for concluding model training. However, ResNet experiences a sharp spike in classification loss between 0 and 500 epochs. This can be attributed to the early point in the training process where there has not been a significant relation of extracted features within the model’s network to image features for the four classes in our model.
Figure 4b shows that ResNet converges to a training localization loss of approximately 0.8, while MobileNet and EfficientNet both converge to an approximate value of 0.01 for training localization loss. EfficientNet also has a unique path of convergence for this parameter, as it begins the training process with a localization loss value of approximately 0.05 and finishes with a value of 0.01 which characterizes its loss curve to be constant relative to the loss curves for ResNet and MobileNet. This result can be attributed to the BiFPN structure of the EfficientDet model [27] which optimizes the accuracy of predictions, specifically bounding box regression in this case.
Figure 4c shows that EfficientNet converges to an approximate value of 0.08, ResNet converges to an approximate value of 0.2, and MobileNet converges to the largest value of approximately 0.56 for regularization loss. The relatively high value for MobileNet can be attributed to less effective modeling of the regularization loss with the second term in both L1 and L2 of Equation (8). This term likely contributes a larger value for the MobileNet layer weights than the layer weights for EfficientNet and ResNet. Additionally, the MobileNet layer architecture lacks multiple two dimensional convolutions as implemented in the ResNet and EfficientNet layer architectures. The addition of supplemental convolution layers would likely further reduce overfitting in each model. Thus, the regularization loss would naturally decrease in accordance.
Figure 4d shows that ResNet and EfficientNet both converge to an approximate value of 0.4 while MobileNet converges to an approximate value of 0.6 for the total loss. The increased value of total loss for MobileNet can be attributed to the regularization loss which converges to a relatively large value in comparison to the localization loss and the classification loss for MobileNet. Thus, the significantly higher value of regularization loss for MobileNet skews the value of total loss, despite the model’s significantly lower values for classification loss and localization loss.

4.3. Damage Classification

After the completion of the transfer learning model training using the base models of ResNet and MobileNet on our in-house flood damage dataset, the newly trained models are tested with images they did not see during the training stage. Among the test dataset, the number of floods images is 92, and the number of non-floods images is 107. It is noted that the floods and non-floods images are slightly imbalance. The same set of floods images and non-floods images was tested by the newly trained models using ResNet and MobileNet. In this study, the floods class was the positive class, and the non-floods class was the negative class, resulting in the following four possible predictions:
  • TN/True negative: an image was non-floods and predicted as non-floods;
  • TP/True positive: an image was floods and predicted as floods;
  • FN/False negative: an image was floods and predicted as non-floods;
  • FP/False positive: an image was non-floods and predicted as floods.
Figure 5 shows the confusion matrix for both ResNet and MobileNet. Each row in a confusion matrix represents a true label (i.e., an actual class), while each column in a confusion matrix represents a predicted label. In this study, the first row and the first column have the label of non-floods, while the second row and the second column have the label of floods. The diagonal elements of the confusion matrix represent that the predicted label is equal to the true label, while off-diagonal elements are those that are mislabeled by the classifier. The values in each of the elements are normalized by the total number of images for each class. It is expected that a perfect classifier would have only true positives (lower right) and true negatives (top left). Figure 5 shows both ResNet and MobileNet are able to classify non-floods and floods images with the larger percentages along the diagonal elements. An accurate prediction means that a non-floods image was predicted as non-floods, and a floods image was predicted as floods. The prediction accuracy of ResNet is about 76%, and the accuracy of MobileNet is about 87%. Both classifiers show that true positive predictions (85% by ResNet and 89% by MobileNet) are higher than true negative predictions (66% by ResNet and 85% by MobileNet). A further comparison shows that the transfer learning model using MobileNet outperforms the one trained using ResNet for both true positive and true negative predictions. Specifically, the true positive prediction percentage of MobileNet is about 89%, while the true positive prediction percentage of ResNet is about 85%. Similarly, the true negative prediction percentage of MobileNet is about 85%, while the true negative prediction percentage of ResNet is about 66%.
Model classification performance is further evaluated by using precision, recall, and F1 score, as defined in Equations (3)–(5), respectively. The result is summarized in Table 3. The precision metric measures the accuracy of the true positive predictions (i.e., floods label) by dividing the true positive predictions over the sum of true positive and false positive predictions. The precision values for ResNet and MobileNet are 0.75 and 0.87, respectively. This indicates that MobileNet shows a higher accuracy (about 12%) than ResNet in terms of floods image classification. The second metric recall measures the true positive rate (i.e., the ratio of floods images that are correctly detected by the classifiers. The result shows that the recall of MobileNet is about 4% higher than that of ResNet. The last metric examined in this study is the F1 score, which is the harmonic mean of precision and recall, as defined in Equation (5). As a result, the classifier only obtains a high F1 score if both precision and recall are high. The F1 score result shows that MobileNet obtains a F1 score that is about 9% higher than that obtained by the ResNet-based classifier. In short, both the confusion matrix comparison in Figure 5 and metric comparison in Table 3 show that the flood damage classification models developed through transfer learning are accurate. Furthermore, the classifier using MobileNet as the base model performs better than a transfer learning model developed on the basis of ResNet.

4.4. Damage Detection

In the following sections, we compare the predictions from each model on a set of four test images that the model has not seen previously with each image containing one of the four specific classes of damage. The scores in Table 4, Table 5, Table 6 and Table 7 are confidence/probability scores associated with each predicted type of damage. Each confidence score is assigned by the model to a different bounding box prediction as a measure of how likely the detected object in the image belongs to the predicted class. In other words, the confidence score is a measure of the model’s ability to isolate a damaged area within an image and correctly identify that damage using the model’s trained classifiers. Higher confidence scores are associated with the most accurate predictions of damaged areas in the image. The top three confidence scores were taken from each inference run on the corresponding image, and the top confidence score is associated with the bounding box prediction displayed on the images in Figure 6, Figure 7, Figure 8 and Figure 9.

4.4.1. Damaged Roof Comparison

In Table 4, the top predictions for MobileNet and EfficientNet correctly classify the object as a damaged roof, and MobileNet achieves the higher confidence score of 90.93% for that predicted class. The bounding box location in Figure 6c predicted by EfficientNet more accurately encompasses the entire damaged roof structure in comparison to the bounding box location in Figure 6b predicted by MobileNet. On the other hand, the top two predictions made by ResNet are inaccurately classified as structural damage, and the bounding box location in Figure 6a is also inaccurate due to the different image features associated with the structural damage class. The same applies to the third prediction made by ResNet of the flood damage class and the third prediction made by EfficientNet of the structural damage class.

4.4.2. Damage Wall Comparison

In Table 5, the top predictions for ResNet, MobileNet, and EfficientNet correctly classify the object as a damaged wall, and MobileNet again achieves the highest confidence score of 97.58% for that predicted class. The bounding box location in Figure 7b predicted by MobileNet more accurately encompasses the entire damaged wall structure in comparison to the bounding box location in Figure 7a predicted by MobileNet and Figure 7c predicted by EfficientNet. However, the second and third predictions made by ResNet and MobileNet are inaccurately classified as either structural damage or a damaged roof, likely due to similar features of a damaged wall in this image that the model has learned to extract in predicting the structural damage and damaged roof classes as well.

4.4.3. Flood Damage Comparison

In Table 6, the top predictions for ResNet, MobileNet, and EfficientNet correctly classify the object as flood damage, and MobileNet again achieves the highest confidence score of 97.45% for that predicted class. The bounding box location in Figure 8b predicted by MobileNet more accurately encompasses the entire flood damage area in comparison to the bounding box location in Figure 8a predicted by ResNet and Figure 8c predicted by EfficientNet. However, the second and third predictions made by ResNet and MobileNet are inaccurately classified as either a damaged wall or a damaged roof, likely due to some features of the building in the background of the image that would be extracted to predict those classes. The same applies to the second prediction made by EfficientNet of the structural damage class.

4.4.4. Structural Damage Comparison

In Table 7, the top predictions for ResNet, MobileNet, and EfficientNet correctly classify the object as structural damage, and MobileNet actually achieves the lowest confidence score of 42.85% for that predicted class. ResNet and EfficientNet achieve similar confidence scores of 68.11% and 67.96%, respectively, for their top prediction. Although the bounding box location in Figure 9b predicted by MobileNet more accurately encompasses the entire structural damage area in comparison to the bounding box location in Figure 9a predicted by ResNet and Figure 9c predicted by EfficientNet, the second and third predictions made by ResNet and MobileNet are inaccurately classified as either a damaged wall or a damaged roof, very likely due to the similar features of structural damage in this image that the model has learned to extract in predicting the damaged roof and damaged wall classes as well. The same applies to the third prediction made by EfficientNet of the flood damage class.

4.4.5. Overall Performance of the Damage Detection Models

It can be seen from the results of the inference for each type of damage that the most accurate damage detector is the model trained on the MobileNet architecture. The MobileNet model most consistently achieved the highest confidence scores when predicting each type of damage with the highest overall confidence score of 97.58% when predicting the damaged roof in Figure 6b. This is likely a result of the unique structure of the MobileNet architecture; the depthwise separable convolutions allow for these detections to have an improved computation and overall model scale in comparison to the EfficientNet and ResNet models. Additionally, the width and resolution multipliers that are incorporated into the model architecture likely give the MobileNet model a significant advantage in scaling the layers for a more-tailored fit to each object class. Thus, each classifier corresponding to the four object classes predicts the type of damage after it is located in the image with high accuracy.
However, the damage detection model with the most consistent classifier was actually EfficientNet. As can be seen in Table 4, Table 5, Table 6 and Table 7, EfficientNet was the most consistent model with classifying the predicted damage as the correct object/label. Out of the top three predictions among each of the four types of damage, EfficientNet incorrectly classified the damage a total of three times, while MobileNet and ResNet incorrectly classified the damage six times and eight times, respectively. This result is likely due to the primary advantage of the EfficientNet architecture being its efficiency of predictions due to the use of compound scaling. In turn, this efficiency is optimized by the BiFPN mentioned previously; increased efficiency of accurate predictions leads to the EfficientNet model producing more consistently accurate classifications of the damage—but at the cost of losing a certain degree of accuracy in predicting the precise location of the damage, thus leading to a lower confidence score for EfficientNet in general.
Since our in-house dataset for damage detection was not included in the original dataset used to develop all three AI models (ResNet, MobileNet, and EfficientNet), then our models are subject to developing a certain level of negative transfer [36,37]. The effect of negative transfer on model performance leads to less accurate predictions made by each model. Lower confidence scores can be attributed to the negative impact each model endured from transferring learned features of each pre-trained model to the target domain of our dataset.

5. Conclusions

This study has developed transfer-learning-based artificial intelligence models to assess building damages due to hurricanes in the U.S. southeast region. We developed our in-house building damage image dataset and subset it into (i) damage classification (i.e., floods vs. non-floods) and (ii) damaged object detection including damaged roof, damaged wall, flood damage, and structural damage. We developed transfer learning workflows that take advantage of feature extraction from three advanced neural network models in computer vision (i.e., EfficientNet, ResNet, and MobileNet) and successfully retrained these models for building damage assessment. Finally, we evaluated the classification and object detection performance among the different models. Our major findings and contributions include
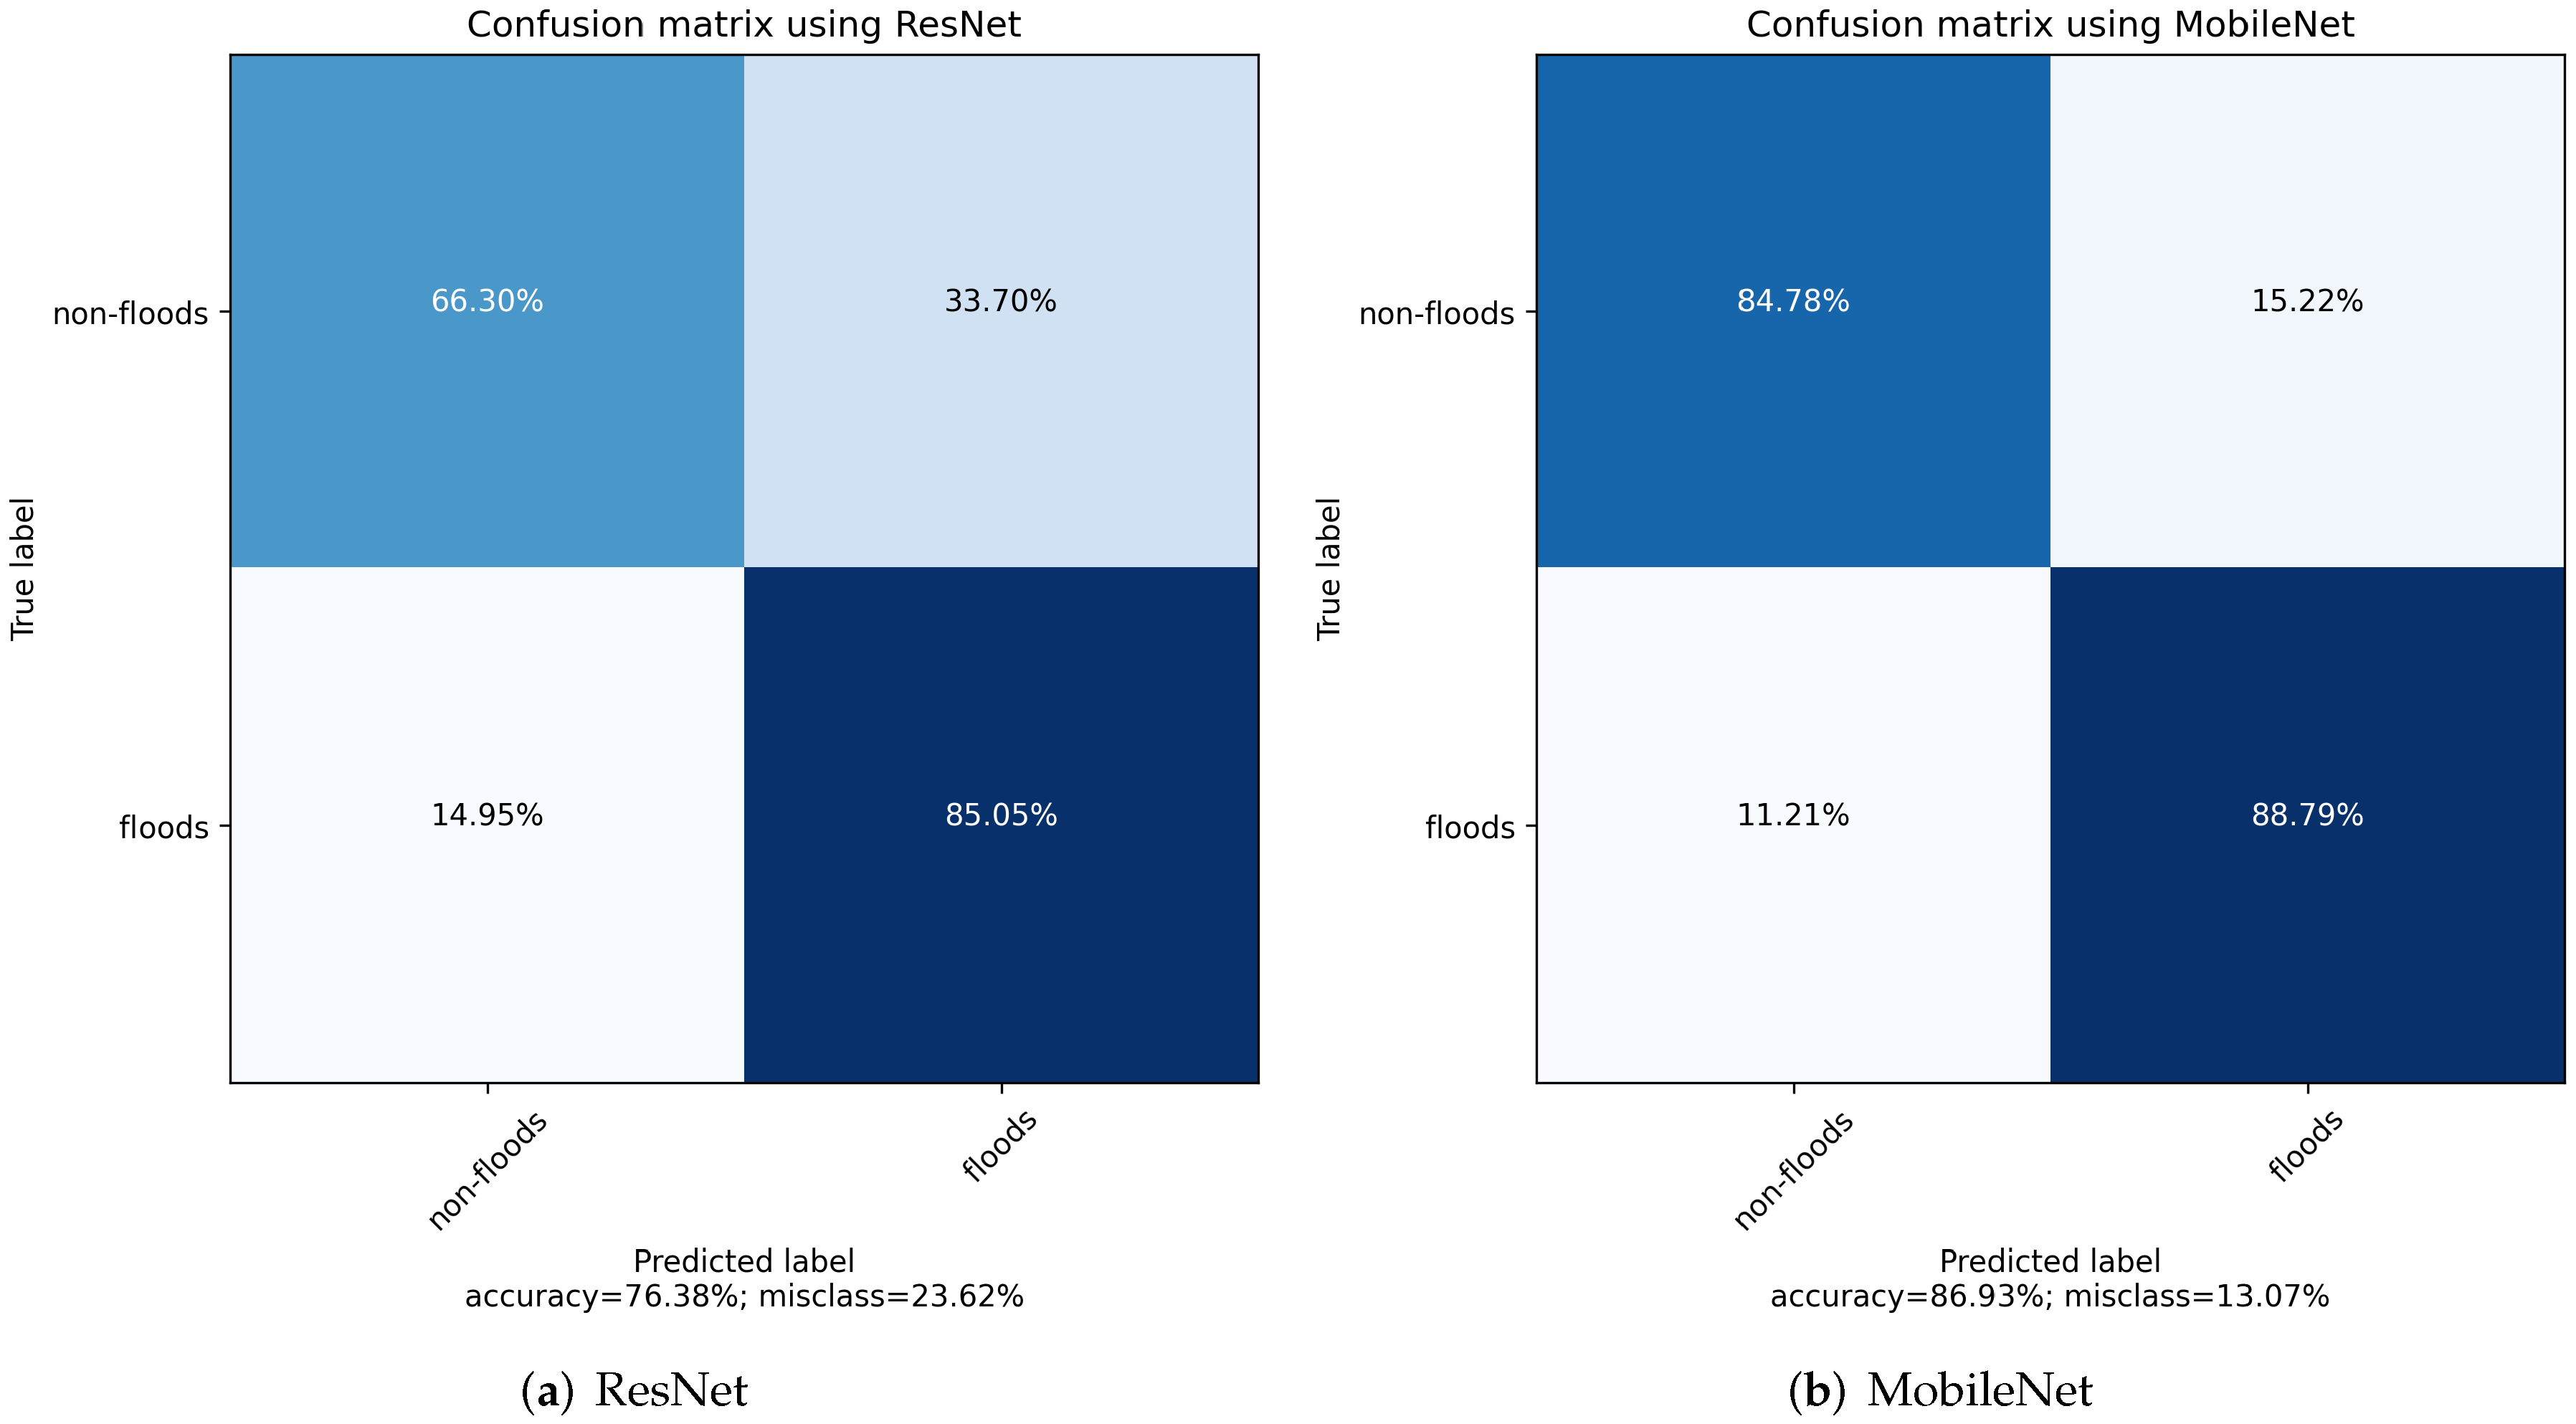
  • The transfer learning based flood damage classification models were developed using ResNet and MobileNet. A binary classification was carried out to detect floods and non-floods images. Several methods were used to evaluate the performance of the transfer learning models. The confusion matrix comparison showed both ResNet and MobileNet are able to correctly classify floods and non-floods with a relatively high accuracy. Specifically, the overall accuracy is about 76% using ResNet and 87% using MobileNet. Three metrics (precision, recall, and F1 score) were further calculated and compared between two models. The result obtained using MobileNet as the base model is consistently better than that using ResNet. For example, the F1 score, a harmonic mean of precision and recall, is about 0.88 using MobileNet. It is about 9% higher than the F1 score using ResNet (0.79). Overall, this study showed that hurricane flood damage to buildings can be correctly classified using artificial intelligence models developed using transfer learning techniques on the basis of advancing machine learning models in computer vision.
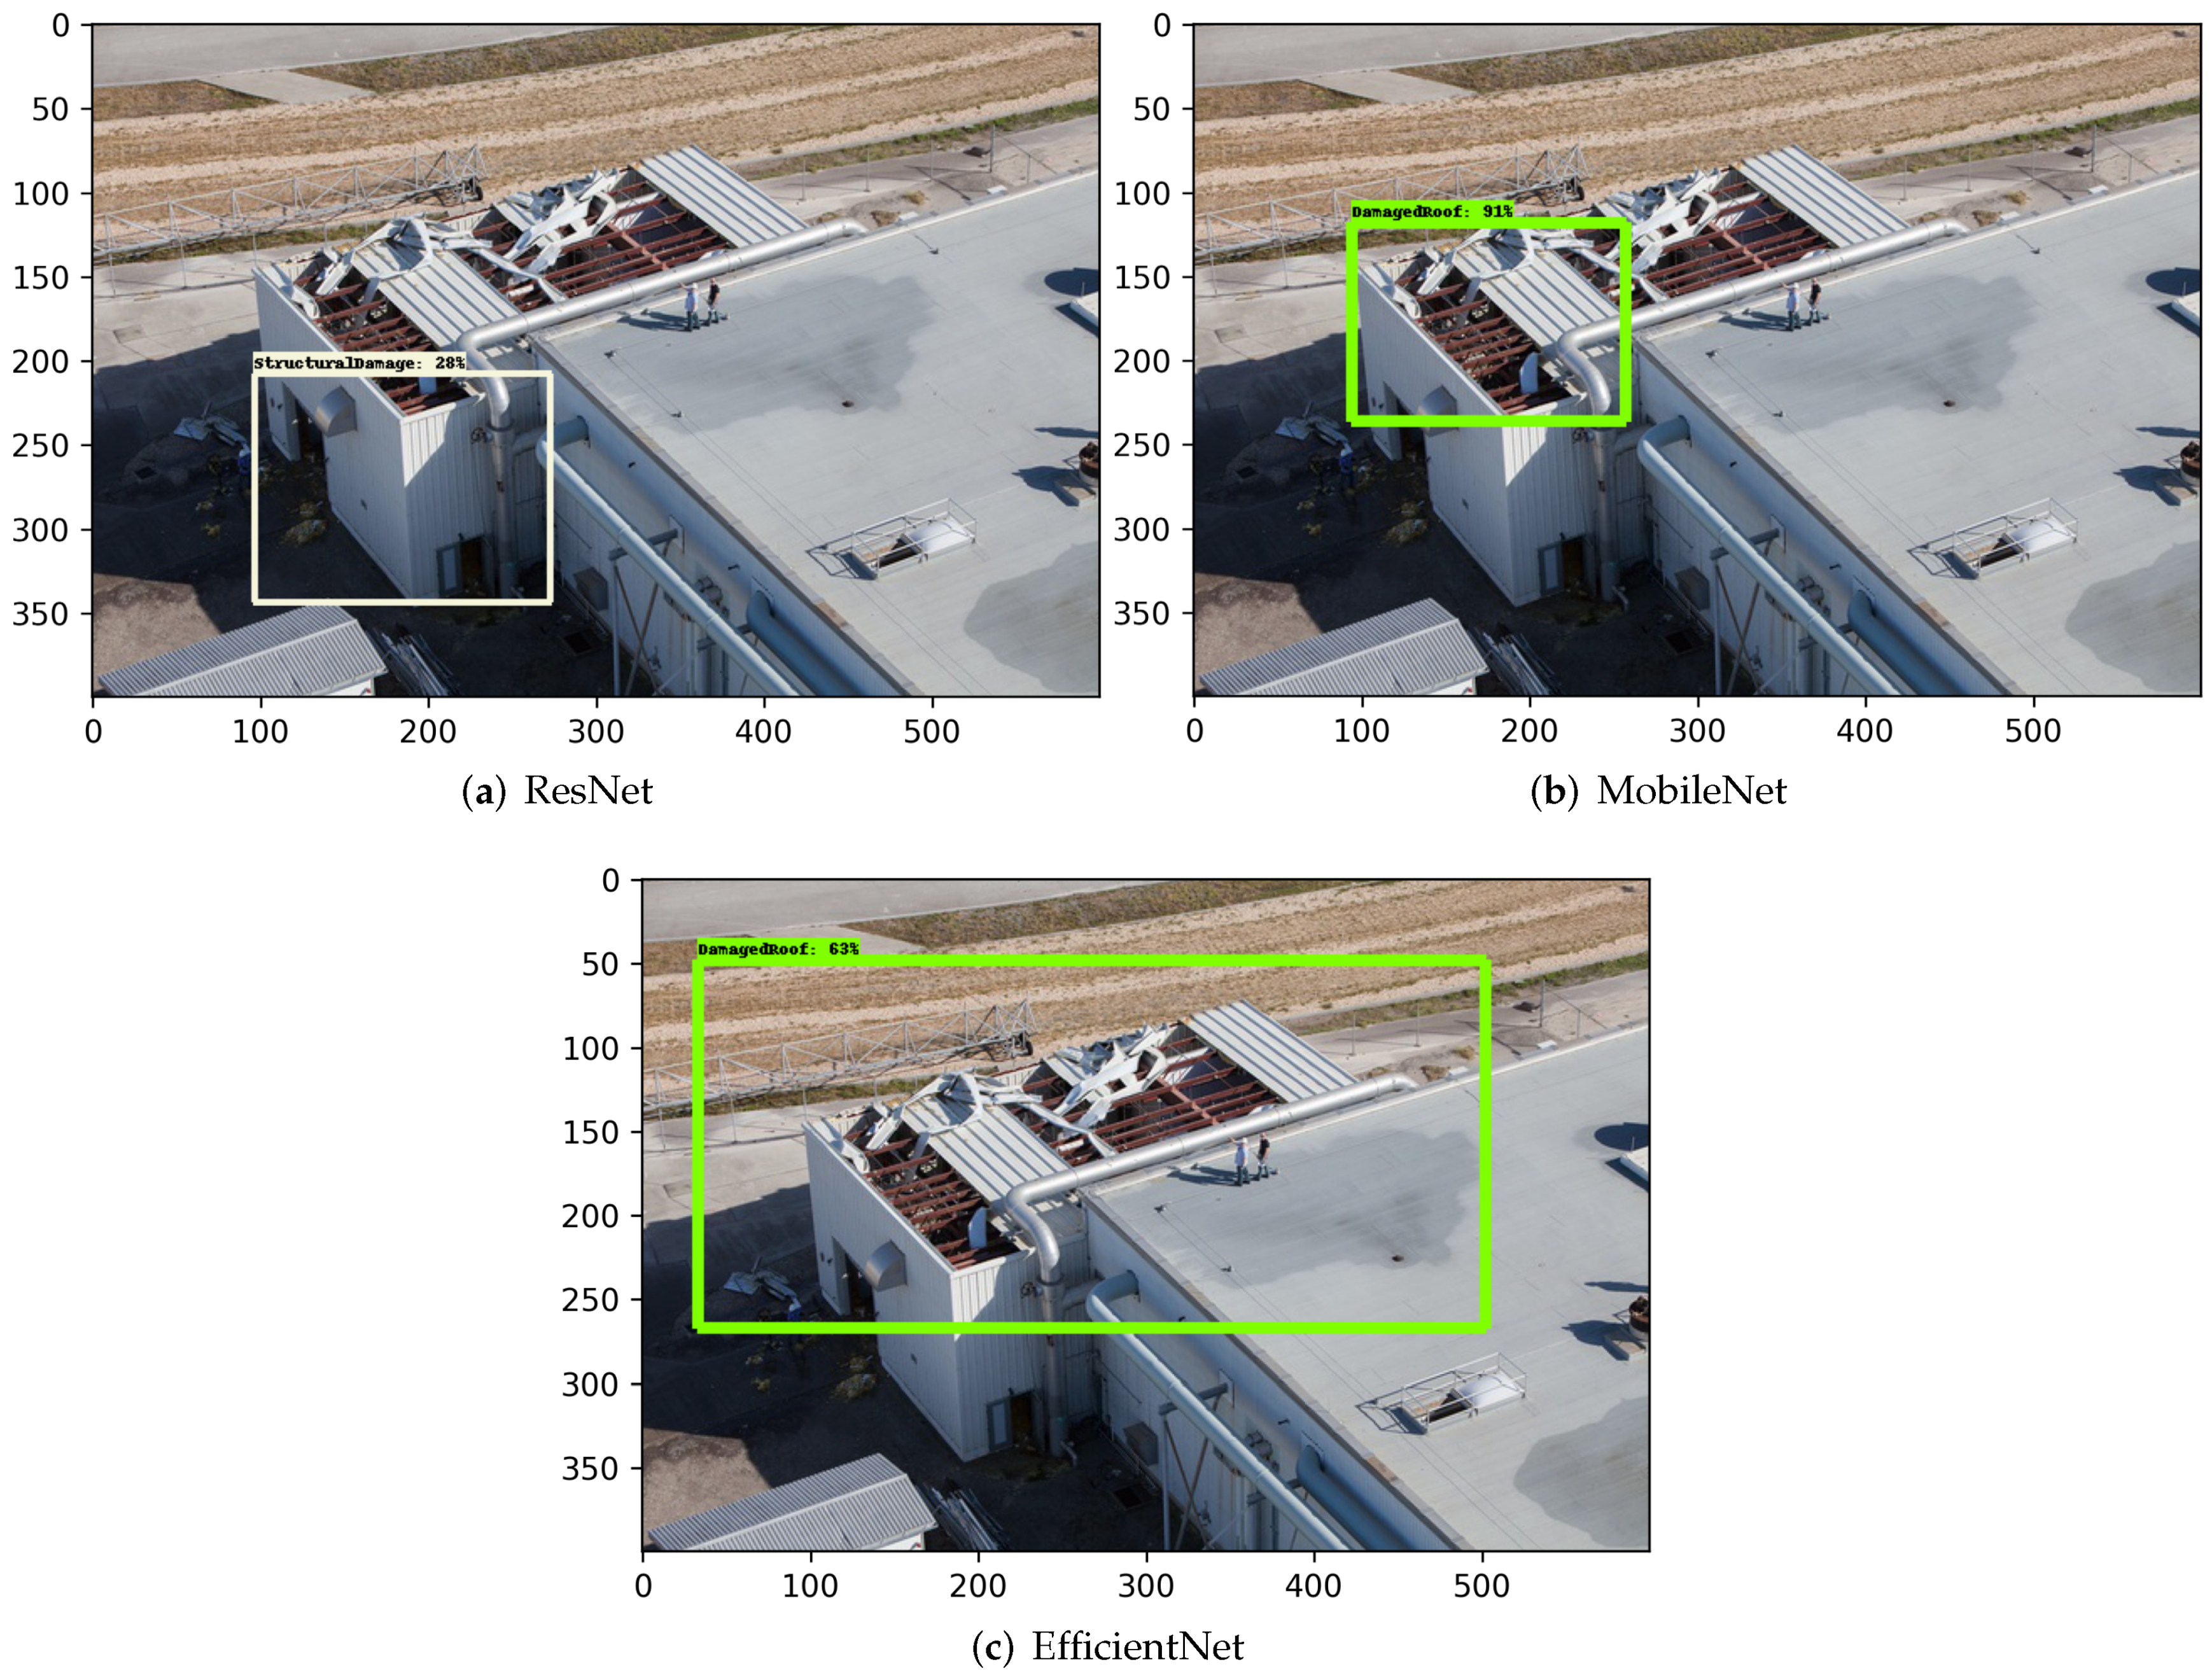
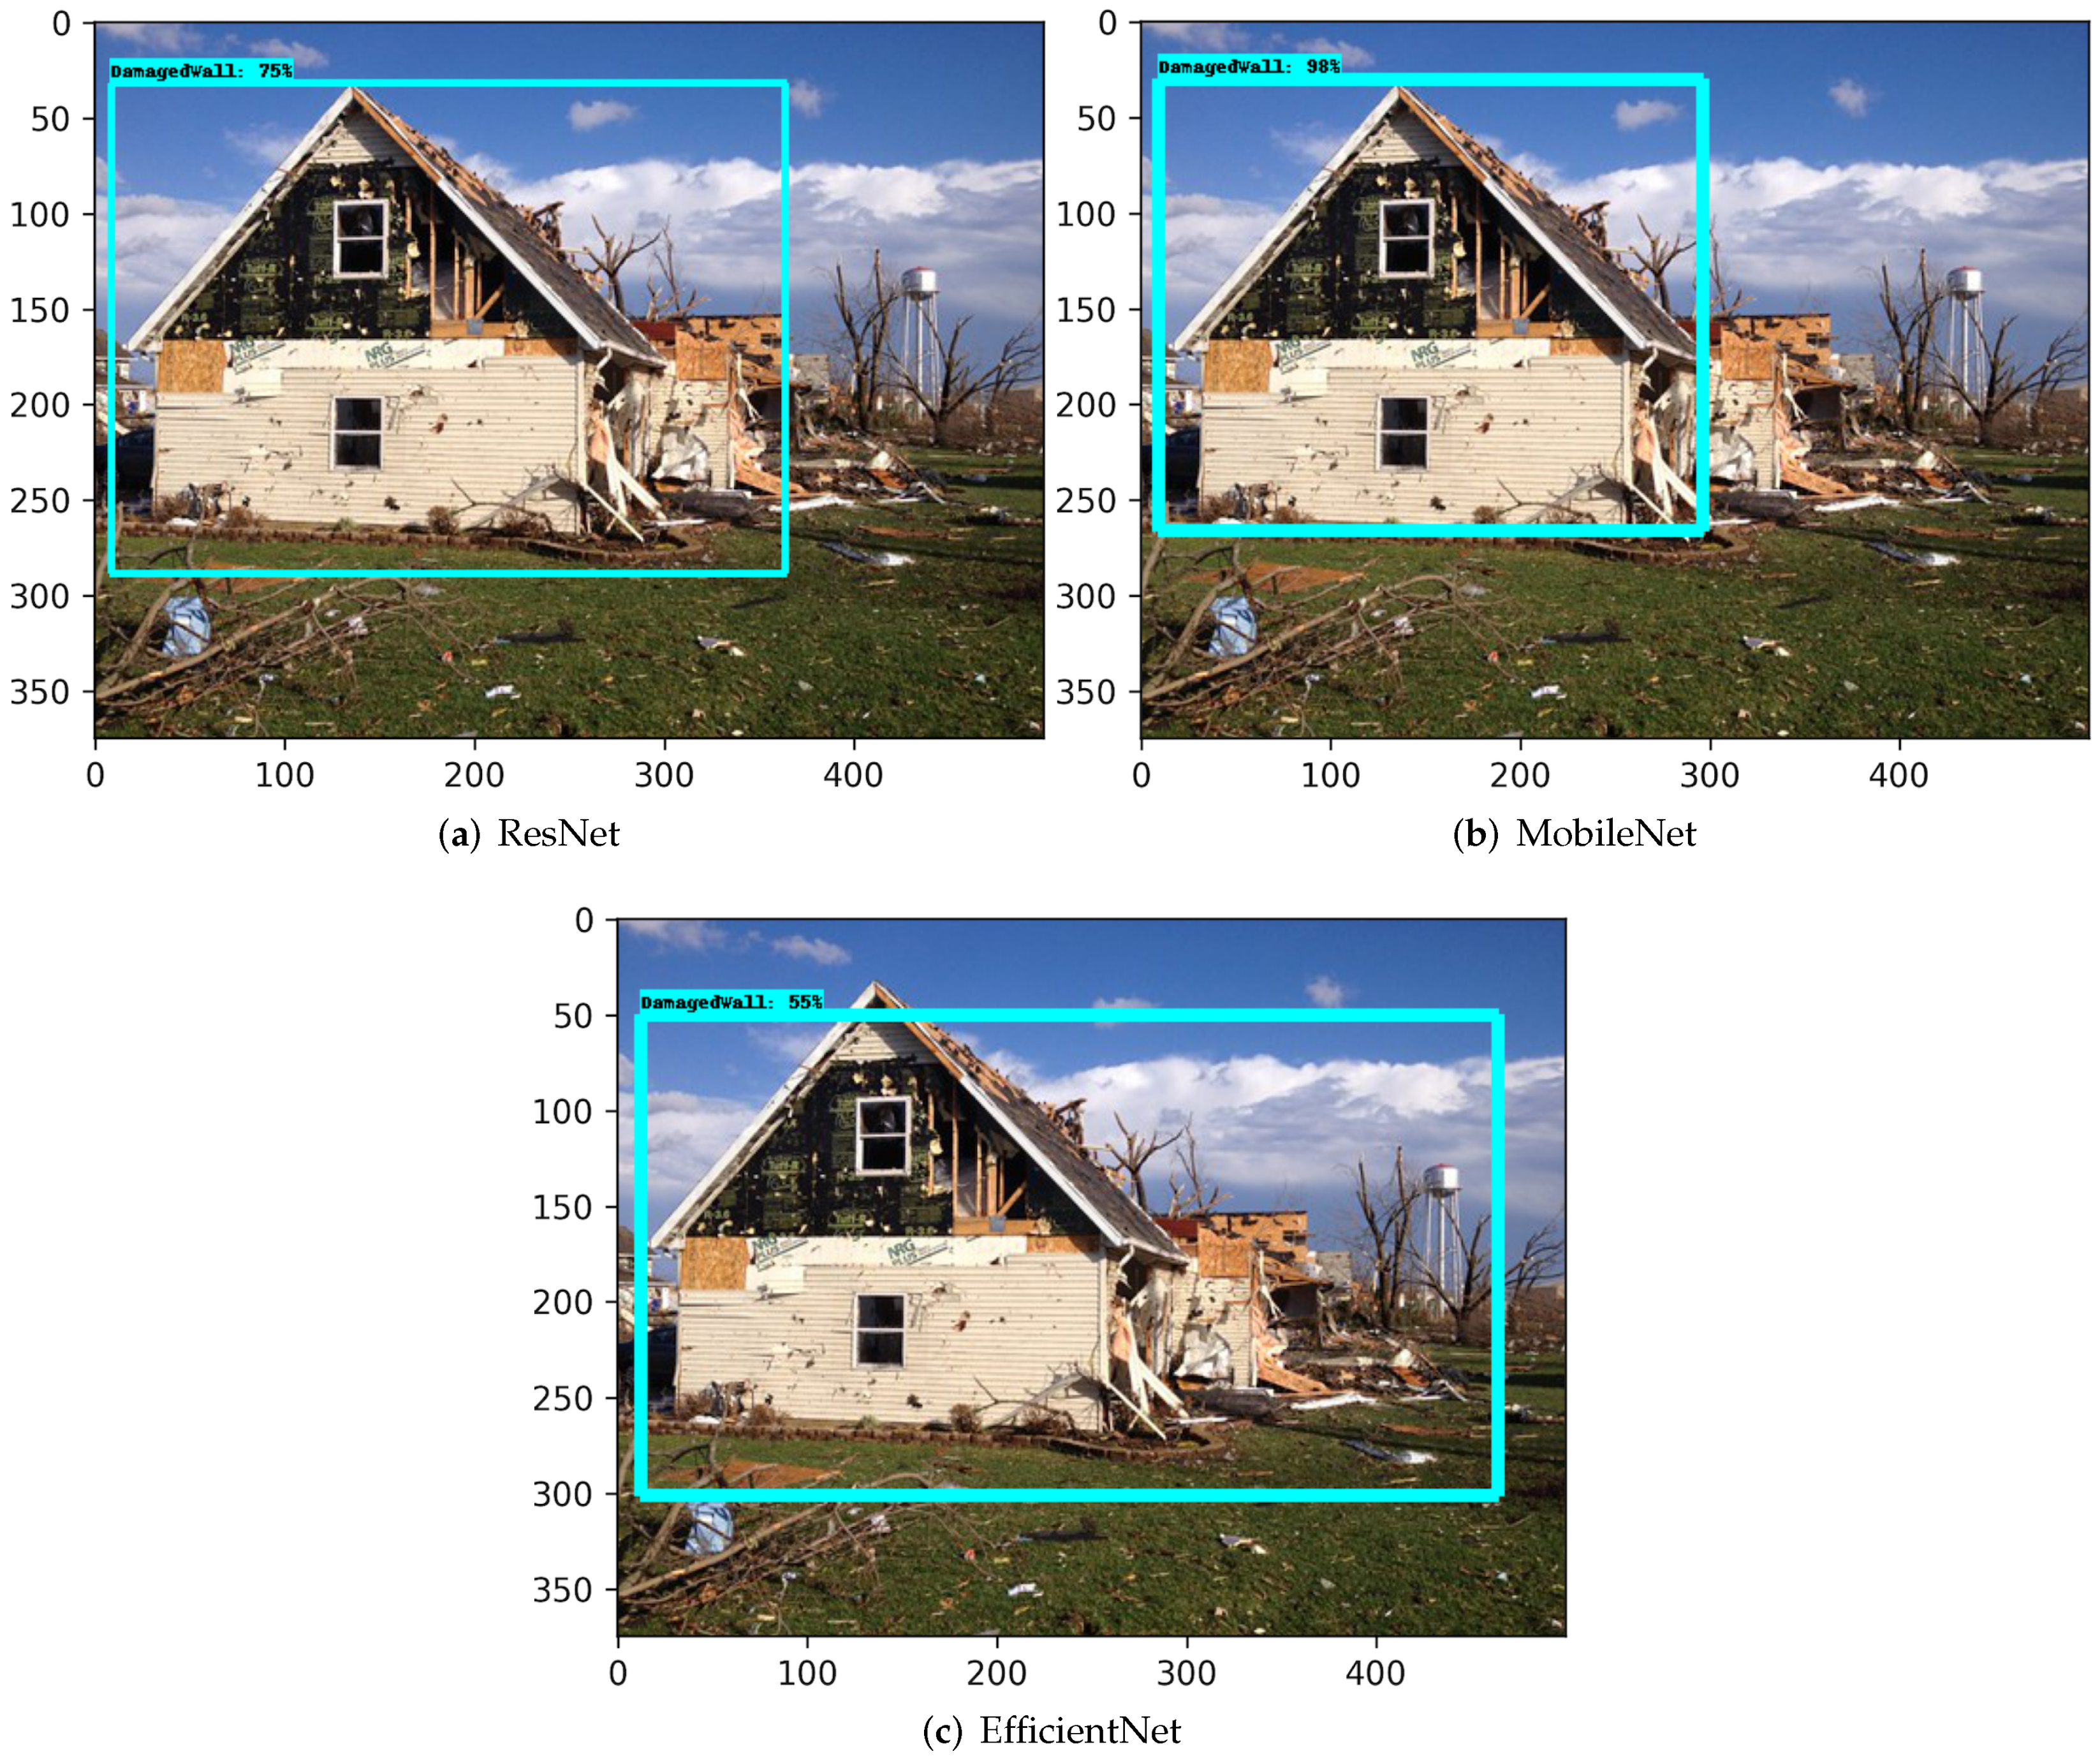
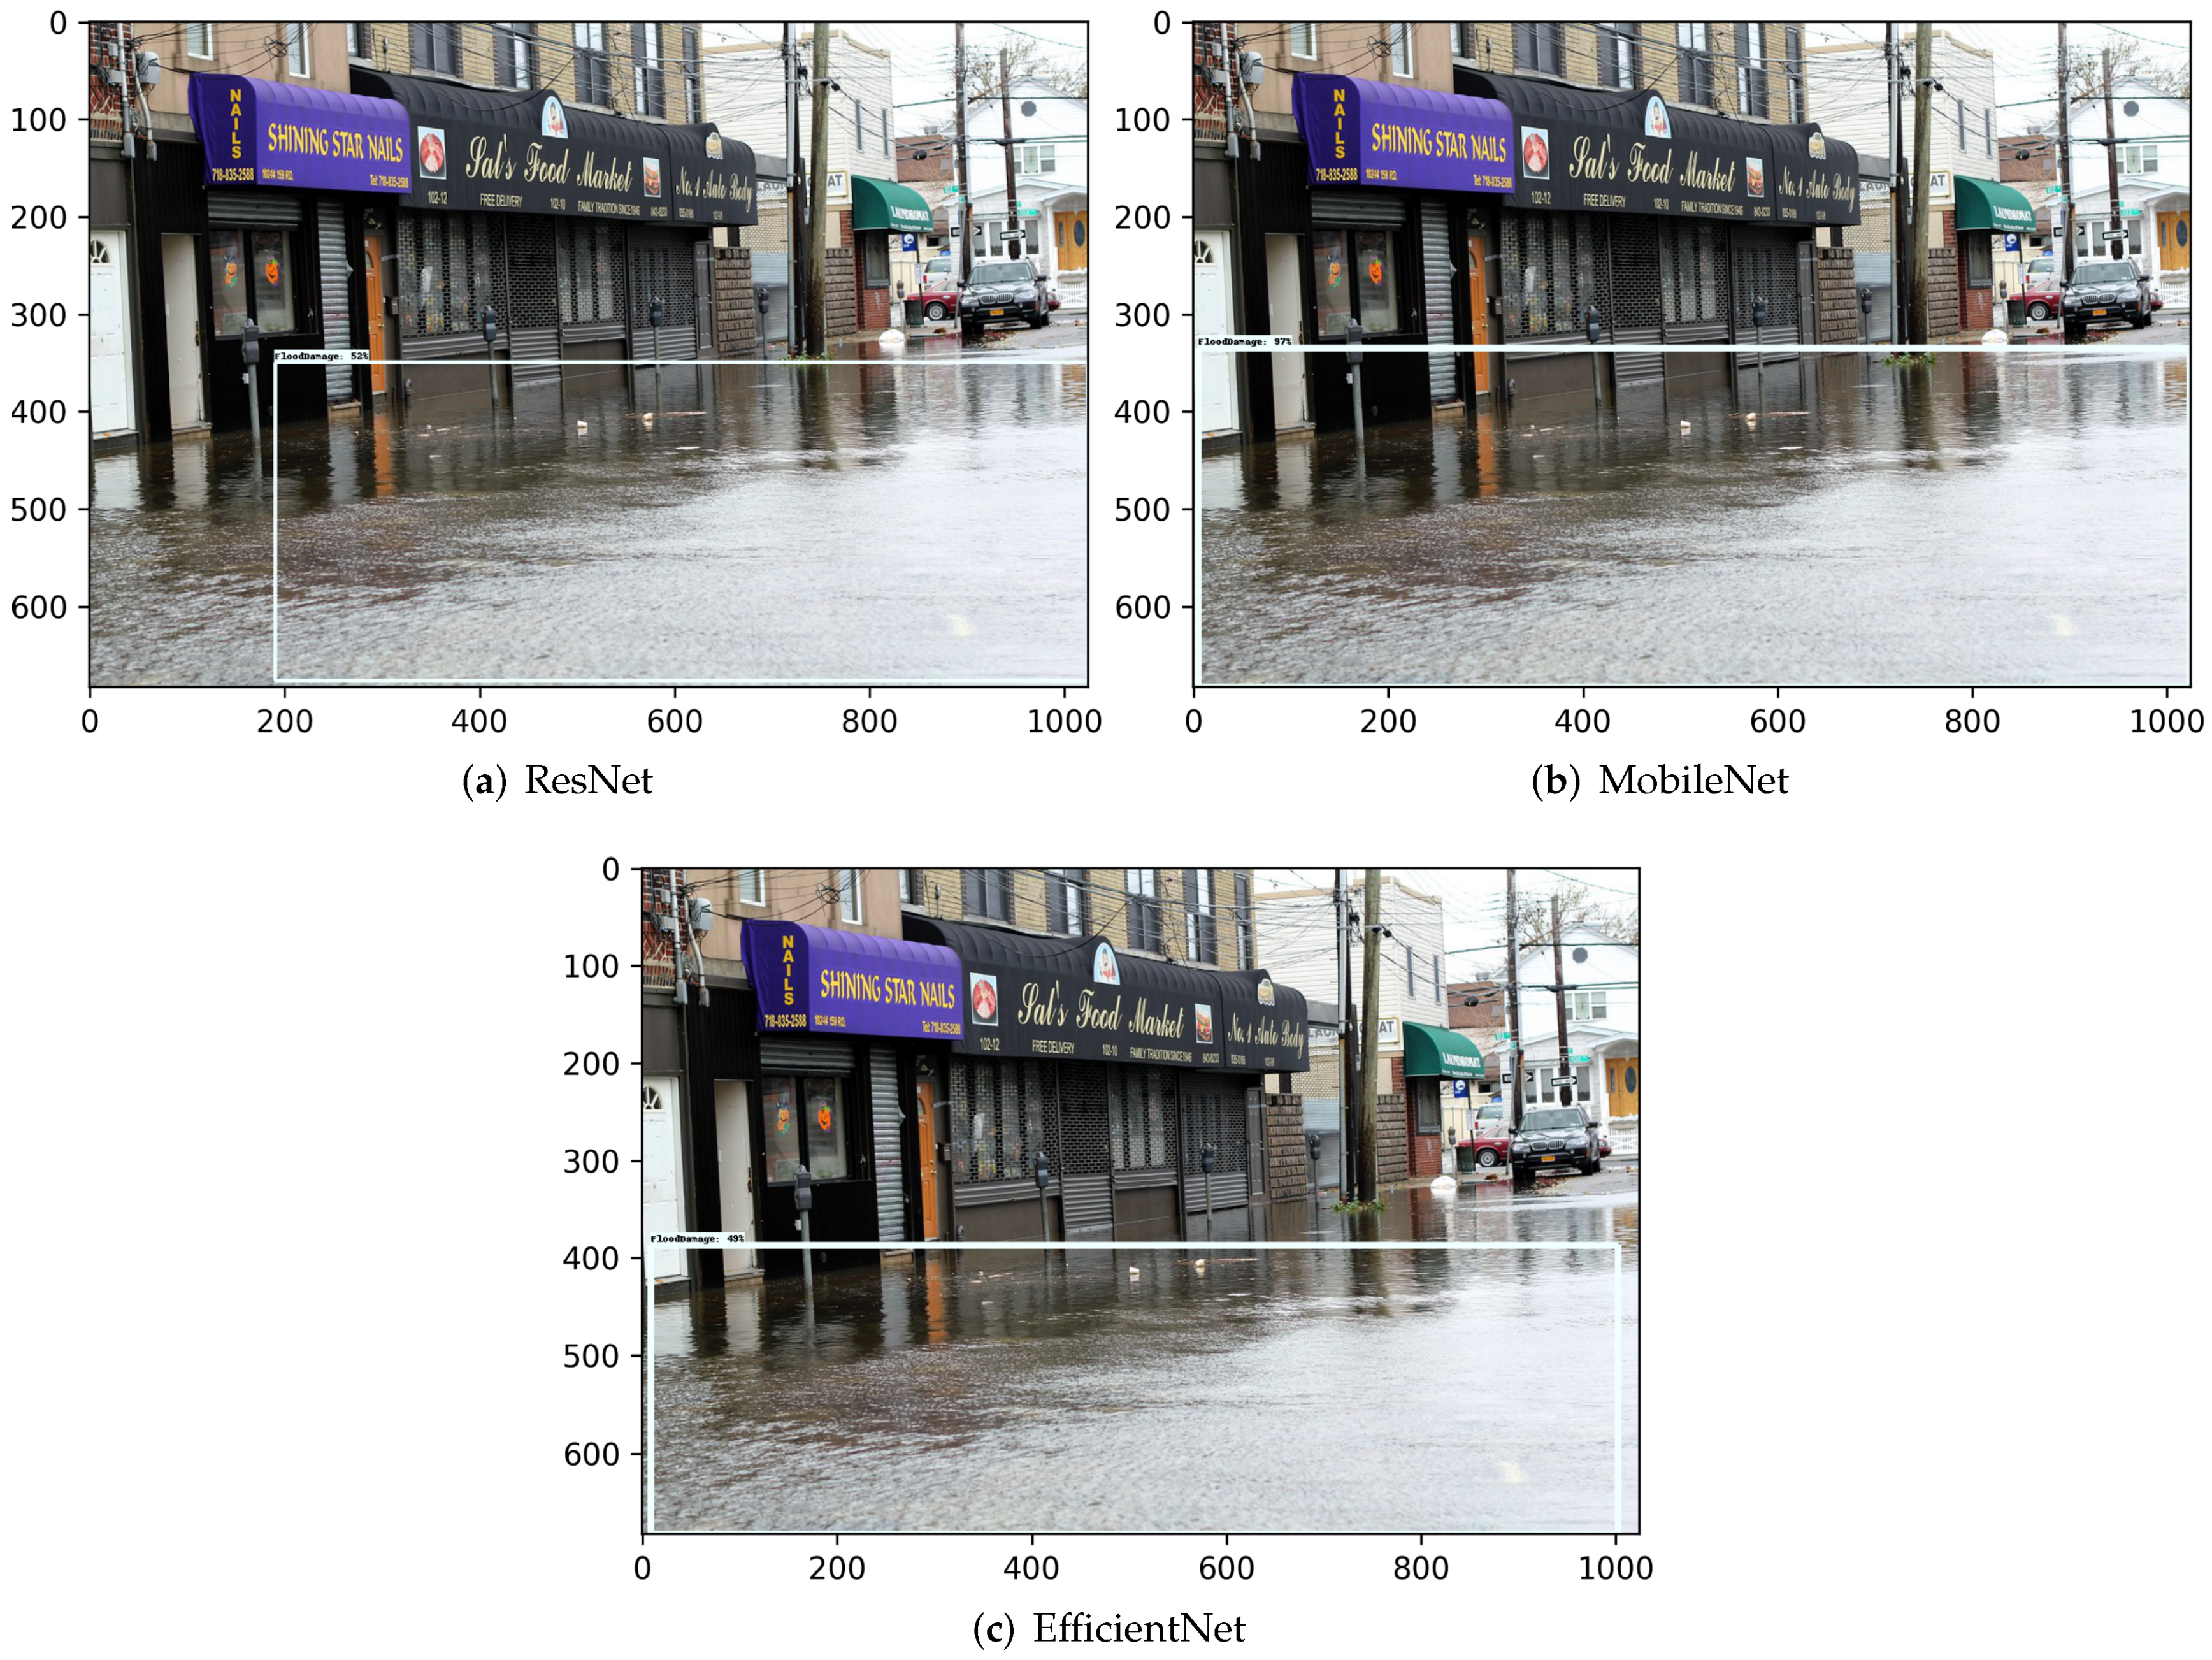
  • The transfer-learning-based damage detection models were developed using ResNet, MobileNet, and EfficientNet. Four damage types were captured in four object classes: damaged roof, damaged wall, flood damage, and structural damage. Two methods were primarily used to evaluate the performance of the transfer learning models for damage detection. The top three confidence scores and associated object class were tabulated for each model, showing that each model was capable of predicting the correct object class in the image; the MobileNet model consistently achieved the highest confidence score and proved to be the more accurate model in detecting hurricane damage. Then, the images of each type of damage were displayed with the top bounding box prediction for each model. Likewise, MobileNet consistently achieved the most accurate localizations of the detected damage in each image. Therefore, this study showed that various types of damage from hurricanes can be accurately detected using artificial intelligence models developed through transfer learning to further advance machine learning applications in computer vision.
From creating our in-house damage assessment framework, we were able to show that a significant level of accuracy for damage classification can be achieved using transfer learning techniques on a pre-trained neural network. Given the relatively small and broad range of images used for the input data set, our classification model displayed a high degree of versatility that could be used during a spectrum of hurricane and other coastal hazard events. The object detection results highlight the model’s ability to successfully identify damaged areas of buildings and structures from test data in a time span of seconds, which is necessary for more efficient damage assessment.
Our work can be improved with further research into applying transfer learning techniques to create classification and object detection models trained on post-disaster imagery. Using these machine learning models would significantly reduce the time required for damage assessment. Therefore, relief plans created in the wake of a future coastal hazard would save hours to days of time required to determine the total damage incurred. As a result, impacted coastal communities would be able to receive more reliable and prompt relief from direct implementation of artificial intelligence technology such as our classification and object detection models.

Author Contributions

L.C.: methodology, software, validation, formal analysis, investigation, resources, data curation, writing—original draft, writing—review and editing, and visualization. Z.W.: conceptualization, methodology, software, validation, formal analysis, investigation, resources, data curation, writing—original draft, writing—review and editing, and visualization. All authors have read and agreed to the published version of the manuscript.

Funding

This research was partly supported by the research momentum fund and the faculty start-up fund provided by the University of North Carolina Wilmington.

Data Availability Statement

The data presented in this study are available for download at https://doi.org/10.15139/S3/DPNPBM.

Acknowledgments

All test images used in this article were openly licensed and public domain works obtained from the Creative Commons Search tool (https://search.creativecommons.org/ (accessed on 28 July 2021)).

Conflicts of Interest

The authors declare no conflict of interest.

References

  1. Cooper, R. Hurricane Florence Recovery Recommendations. 2018. Available online: https://www.osbm.nc.gov/media/824/open (accessed on 15 March 2021).
  2. Guikema, S. Artificial Intelligence for Natural Hazards Risk Analysis: Potential, Challenges, and Research Needs. Risk Anal. 2020, 40, 1117–1123. [Google Scholar] [CrossRef] [PubMed]
  3. Massarra, C.C. Hurricane Damage Assessment Process for Residential Buildings. Master’s Thesis, Louisiana State University, Baton Rouge, LA, USA, 2012. [Google Scholar]
  4. FEMA. FEMA Preliminary Damage Assessment Guide; FEMA: Washington, DC, USA, 2020.
  5. Lam, D.; Kuzma, R.; McGee, K.; Dooley, S.; Laielli, M.; Klaric, M.; Bulatov, Y.; McCord, B. xview: Objects in context in overhead imagery. arXiv 2018, arXiv:1802.07856. [Google Scholar]
  6. Gupta, R.; Hosfelt, R.; Sajeev, S.; Patel, N.; Goodman, B.; Doshi, J.; Heim, E.; Choset, H.; Gaston, M. xbd: A dataset for assessing building damage from satellite imagery. arXiv 2019, arXiv:1911.09296. [Google Scholar]
  7. Roueche, D.B.; Lombardo, F.T.; Krupar, R.; Smith, D.J. Collection of Perishable Data on Wind-and Surge-Induced Residential Building Damage During Hurricane Harvey (TX); DesignSafe-CI: Austin, TX, USA, 2018. [Google Scholar]
  8. Weber, E.; Kané, H. Building disaster damage assessment in satellite imagery with multi-temporal fusion. arXiv 2020, arXiv:2004.05525. [Google Scholar]
  9. He, K.; Gkioxari, G.; Dollár, P.; Girshick, R. Mask r-cnn. In Proceedings of the IEEE International Conference on Computer Vision, Venice, Italy, 27–29 October 2017; pp. 2961–2969. [Google Scholar]
  10. Hao, H.; Baireddy, S.; Bartusiak, E.R.; Konz, L.; LaTourette, K.; Gribbons, M.; Chan, M.; Comer, M.L.; Delp, E.J. An attention-based system for damage assessment using satellite imagery. arXiv 2020, arXiv:2004.06643. [Google Scholar]
  11. Gupta, R.; Goodman, B.; Patel, N.; Hosfelt, R.; Sajeev, S.; Heim, E.; Doshi, J.; Lucas, K.; Choset, H.; Gaston, M. Creating xBD: A dataset for assessing building damage from satellite imagery. In Proceedings of the IEEE/CVF Conference on Computer Vision and Pattern Recognition Workshops, Long Beach, CA, USA, 16–17 June 2019; pp. 10–17. [Google Scholar]
  12. Cheng, C.S.; Behzadan, A.H.; Noshadravan, A. Deep learning for post-hurricane aerial damage assessment of buildings. Comput.-Aided Civ. Infrastruct. Eng. 2021, 36, 695–710. [Google Scholar] [CrossRef]
  13. Hao, H.; Wang, Y. Leveraging multimodal social media data for rapid disaster damage assessment. Int. J. Disaster Risk Reduct. 2020, 51, 101760. [Google Scholar] [CrossRef]
  14. Imran, M.; Alam, F.; Qazi, U.; Peterson, S.; Ofli, F. Rapid Damage Assessment Using Social Media Images by Combining Human and Machine Intelligence. arXiv 2020, arXiv:2004.06675. [Google Scholar]
  15. Zhang, Y.; Zong, R.; Wang, D. A Hybrid Transfer Learning Approach to Migratable Disaster Assessment in Social Media Sensing. In Proceedings of the 2020 IEEE/ACM International Conference on Advances in Social Networks Analysis and Mining (ASONAM), The Hague, The Netherlands, 7–10 December 2020; pp. 131–138. [Google Scholar] [CrossRef]
  16. Hao, H.; Wang, Y. Hurricane damage assessment with multi-, crowd-sourced image data: A case study of Hurricane Irma in the city of Miami. In Proceedings of the 17th International Conference on Information System for Crisis Response and Management (ISCRAM), Valencia, Spain, 19–22 May 2019. [Google Scholar]
  17. Li, Y.; Hu, W.; Dong, H.; Zhang, X. Building Damage Detection from Post-Event Aerial Imagery Using Single Shot Multibox Detector. Appl. Sci. 2019, 9, 1128. [Google Scholar] [CrossRef] [Green Version]
  18. Presa-Reyes, M.; Chen, S.C. Assessing Building Damage by Learning the Deep Feature Correspondence of before and after Aerial Images. In Proceedings of the 2020 IEEE Conference on Multimedia Information Processing and Retrieval (MIPR), Shenzhen, China, 6–8 August 2020; pp. 43–48. [Google Scholar] [CrossRef]
  19. Pi, Y.; Nath, N.D.; Behzadan, A.H. Convolutional neural networks for object detection in aerial imagery for disaster response and recovery. Adv. Eng. Inform. 2020, 43, 101009. [Google Scholar] [CrossRef]
  20. Pi, Y.; Nath, N.D.; Behzadan, A.H. Disaster impact information retrieval using deep learning object detection in crowdsourced drone footage. In Proceedings of the International Workshop on Intelligent Computing in Engineering, Berlin, Germany, 1–4 July 2020; pp. 134–143. [Google Scholar]
  21. Liao, Y.; Mohammadi, M.E.; Wood, R.L. Deep Learning Classification of 2D Orthomosaic Images and 3D Point Clouds for Post-Event Structural Damage Assessment. Drones 2020, 4, 24. [Google Scholar] [CrossRef]
  22. Wang, X.; Li, Y.; Lin, C.; Liu, Y.; Geng, S. Building damage detection based on multi-source adversarial domain adaptation. J. Appl. Remote Sens. 2021, 15, 036503. [Google Scholar] [CrossRef]
  23. Li, Y.; Hu, W.; Li, H.; Dong, H.; Zhang, B.; Tian, Q. Aligning Discriminative and Representative Features: An Unsupervised Domain Adaptation Method for Building Damage Assessment. IEEE Trans. Image Process. 2020, 29, 6110–6122. [Google Scholar] [CrossRef] [PubMed]
  24. Valentijn, T.; Margutti, J.; van den Homberg, M.; Laaksonen, J. Multi-Hazard and Spatial Transferability of a CNN for Automated Building Damage Assessment. Remote Sens. 2020, 12, 2839. [Google Scholar] [CrossRef]
  25. Howard, A.G.; Zhu, M.; Chen, B.; Kalenichenko, D.; Wang, W.; Weyand, T.; Andreetto, M.; Adam, H. MobileNets: Efficient Convolutional Neural Networks for Mobile Vision Applications. arXiv 2017, arXiv:1704.04861. [Google Scholar]
  26. He, K.; Zhang, X.; Ren, S.; Sun, J. Deep residual learning for image recognition. In Proceedings of the IEEE Conference on Computer Vision and Pattern Recognition, Las Vegas, NV, USA, 27–30 June 2016; pp. 770–778. [Google Scholar]
  27. Tan, M.; Pang, R.; Le, Q.V. EfficientDet: Scalable and Efficient Object Detection. In Proceedings of the IEEE/CVF Conference on Computer Vision and Pattern Recognition, Seattle, WA, USA, 13–19 June 2020. [Google Scholar]
  28. Tzutalin. LabelImg. 2015. Available online: https://github.com/tzutalin/labelImg (accessed on 15 March 2021).
  29. Deng, J.; Dong, W.; Socher, R.; Li, L.J.; Li, K.; Li, F.-F. Imagenet: A large-scale hierarchical image database. In Proceedings of the 2009 IEEE Conference on Computer Vision and Pattern Recognition, Miami, FL, USA, 20–25 June 2009; pp. 248–255. [Google Scholar]
  30. Lin, T.; Maire, M.; Belongie, S.J.; Bourdev, L.D.; Girshick, R.B.; Hays, J.; Perona, P.; Ramanan, D.; Dollár, P.; Zitnick, C.L. Microsoft COCO: Common Objects in Context. arXiv 2014, arXiv:1405.0312. [Google Scholar]
  31. Chollet, F. Deep Learning with Python; Simon and Schuster: New York, NY, USA, 2017. [Google Scholar]
  32. Tan, M.; Le, Q.V. EfficientNet: Rethinking Model Scaling for Convolutional Neural Networks. arXiv 2019, arXiv:1905.11946. [Google Scholar]
  33. Parmar, R. Common loss functions in machine learning. Available online: https://towardsdatascience.com/common-loss-functions-in-machine-learning-46af0ffc4d23 (accessed on 22 January 2022).
  34. Jiang, S.; Qin, H.; Zhang, B.; Zheng, J. Optimized Loss Functions for Object detection: A Case Study on Nighttime Vehicle Detection. arXiv 2020, arXiv:2011.05523. [Google Scholar]
  35. Wu, Y.; Chen, Y.; Yuan, L.; Liu, Z.; Wang, L.; Li, H.; Fu, Y. Rethinking Classification and Localization in R-CNN. arXiv 2019, arXiv:1904.06493. [Google Scholar]
  36. Zhang, W.; Deng, L.; Wu, D. Overcoming Negative Transfer: A Survey. arXiv 2020, arXiv:2009.00909. [Google Scholar]
  37. Wang, Z.; Dai, Z.; Póczos, B.; Carbonell, J.G. Characterizing and Avoiding Negative Transfer. arXiv 2018, arXiv:1811.09751. [Google Scholar]
Figure 1. The transfer learning workflow for binary classification into floods and non-floods by using pre-trained ResNet and MobileNet.
Applsci 12 01466 g001
Figure 2. The transfer learning workflow for object detection of four object categories by using pre-trained ResNet, MobileNet, and EfficientNet.
Applsci 12 01466 g002
Figure 3. The training and validation cross-entropy loss and accuracy for the flood damage classification using ResNet and MobileNet.
Applsci 12 01466 g003
Figure 4. The training metrics for damage detection using classification loss, localization loss, regularization loss, and total loss up to the twenty-thousandth (20 k) epoch.
Applsci 12 01466 g004
Figure 5. The confusion matrix for flood damage classification using (a) ResNet and (b) MobileNet. The locations of four possible predictions are: TN (top left), FP (top right), FN (lower left), and TP (lower right).
Applsci 12 01466 g005
Figure 6. Inference carried out on the image of a damaged roof for each of the three models. The green bounding boxes correspond to the correct predictions of a damaged roof, and the grey bounding box corresponds to the incorrect prediction of structural damage from the first row of Table 4.
Applsci 12 01466 g006
Figure 7. Inference carried out on the image of a damaged wall for each of the three models. The blue bounding boxes correspond to the correct prediction of a damaged wall from the first row of Table 5.
Applsci 12 01466 g007
Figure 8. Inference carried out on the image of flood damage for each of the three models. The white bounding boxes correspond to the correct predictions of flood damage from the first row of Table 6.
Applsci 12 01466 g008
Figure 9. Inference carried out on the image of structural damage for each of the three models. The tan colored bounding boxes correspond to the correct predictions of structural damage from the first row of Table 7.
Applsci 12 01466 g009
Table 1. Summary of images for the flood damage classification task. The selected 1000 images were divided into two categories for binary classification.
Damage Classification Types# of SamplesPercentage
floods46346.3%
non-floods53753.7%
Table 2. Summary of images for the building damage detection task. The selected 800 images were divided into four categories to characterize damage inflicted upon different kinds of objects or structures by historical hurricanes. The total number of object samples of 958 is larger than the number of images (i.e., 800) due to the fact that an individual image can include multiple damaged objects.
Damage Detection Types# of SamplesPercentage
damaged roof36545.625%
damaged wall28135.125%
flood damage16720.875%
structural damage14518.125%
Table 3. Summary of flood damage classification using transfer learning on the basics of ResNet and MobileNet.
ResNetMobileNet
PrecisionRecallF1-scorePrecisionRecallF1-score
0.750.850.790.870.890.88
Table 4. Summary of confidence scores and associated object categories for the top three predictions made on the image of a damaged roof for each of the three models.
ResNetMobileNetEfficientNet
ScoreTypeScoreTypeScoreType
#128.12%structural damage90.93%damaged roof62.85%damaged roof
#221.99%structural damage32.73%damaged roof47.72%damaged roof
#312.47%flood damage21.75%damaged roof15.97%structural damage
Table 5. Summary of confidence scores and associated object categories for the top three predictions made on the image of a damaged wall for each of the three models.
ResNetMobileNetEfficientNet
ScoreTypeScoreTypeScoreType
#175.00%damaged wall97.58%damaged wall55.22%damaged wall
#223.44%structural damage15.07%structural damage18.41%damaged wall
#320.54%damaged roof11.56%structural damage13.46%damaged wall
Table 6. Summary of confidence scores and associated object categories for the top three predictions made on the image of flood damage for each of the three models.
ResNetMobileNetEfficientNet
ScoreTypeScoreTypeScoreType
#152.46%flood damage97.45%flood damage48.79%flood damage
#218.73%damaged wall24.39%damaged wall10.45%structural damage
#312.63%damaged roof6.14%damaged roof10.30%flood damage
Table 7. Summary of confidence scores and associated object categories for the top three predictions made on the image of structural damage for each of the three models.
ResNetMobileNetEfficientNet
ScoreTypeScoreTypeScoreType
#168.11%structural damage42.85%structural damage67.96%structural damage
#213.43%damaged wall11.74%damaged roof25.56%structural damage
#312.26%structural damage6.30%damaged roof18.86%flood damage
Publisher’s Note: MDPI stays neutral with regard to jurisdictional claims in published maps and institutional affiliations.

