Article

A Comparison of the Validity of Three Exercise Tests for Estimating Maximal Oxygen Uptake in Korean Adults Aged 19–64 Years

Department of Sport Culture, Dongguk University, 30 Pildong-ro 1-gil, Jung-gu, Seoul 04620, Korea
*
Author to whom correspondence should be addressed.
Appl. Sci. 2022, 12(3), 1371; https://doi.org/10.3390/app12031371
Submission received: 6 December 2021 / Revised: 24 January 2022 / Accepted: 25 January 2022 / Published: 27 January 2022
(This article belongs to the Special Issue Effect of Exercise on Cardiovascular System)

Abstract

:
The purpose of this study was to compare the validity of three submaximal exercise tests (SMETs) and develop practical predictive models for the VO2max in Korean adults. A total of 541 (287 males and 254 females) adults participated in this study. Their ages ranged from 19 to 64. The VO2max was measured using the maximal-graded exercise treadmill test. The SMETs were performed by a treadmill test, the YMCA step test, and the PACER test. Regression analysis was conducted to compare the validity of the VO2max predictive equations using SMETs. The validity of the predictive models was evaluated using explanatory power, standard error of estimate (SEE), and Bland-Altman analysis. The explanatory power between the measured VO2max and the predicted VO2max was 58.0% (<0.001), 59.2% (<0.001), and 71.7% (<0.001), respectively. The SEEs were 4.545, 4.478, and 3.732 (mL/kg/min). The models were significant predictors of VO2max and had acceptable validity in a large sample of Korean adults. Especially, among the predictive models, PACER had the highest acceptable effectiveness. Therefore, the equations developed in this study are recommended to better evaluate the cardiovascular endurance of Korean adults.

1. Introduction

Cardiovascular endurance is the ability to indicate how effectively the circulatory and respiratory systems use oxygen and has been reported to influence mortality and chronic disease incidence [1]. Therefore, accurately assessing cardiovascular endurance and performing exercises to improve it is helpful for disease prevention and health promotion [2]. Maximal oxygen intake (VO2max), which is the criterion for cardiovascular endurance, can be evaluated through graded exercise testing, which collects and analyzes exhaled gas in the process of performing maximal exercise by gradually increasing the exercise load using a treadmill or cycle ergometer [3,4].
The graded exercise test (GXT) can be divided into maximal exercise and submaximal exercise tests [5]. The maximal exercise test is analyzed by measuring oxygen uptake using a respiratory gas analyzer when the examiner reaches an all-out state [6]. Therefore, the maximal exercise test is the most accurate and ideal way to directly measure the VO2max, but the respiratory gas analyzer that measures the VO2max is expensive and requires a lot of time and cost to maintain and manage [7]. Furthermore, it is difficult to perform maximal effort during GXT by older people [8]. For this reason, the method of indirectly estimating the VO2max using other graded exercise tests rather than directly measuring the VO2max is widely used in the field. The submaximal exercise test measures cardiovascular endurance while performing submaximal exercise [9]. It estimates maximal oxygen uptake based on the assumption that changes in physiological variables that increase during exercise have a linear relationship with oxygen intake. Typical submaximal exercise tests include the step test [10], the treadmill test [11], and the 20-m shuttle run test [12].
The step test is a widely used submaximal exercise test because it is simple and does not occupy a lot of space. The step test repeats ascending and descending stairs and cardiovascular endurance is evaluated mainly by the heart rate during the recovery period after performing for a certain period of time [13]. In the step test, there are several tests depending upon the height and speed of the stairs [14]. This is because the results may vary depending upon race and physical characteristics such as sex, age, height, and weight [15,16], so an estimation formula should be developed considering these characteristics.
The treadmill test, which estimates the maximal oxygen intake using a treadmill without measuring the actual maximal intake, can be placed in various spaces such as laboratories and fitness centers. The test is easy to manage and exercise intensity can be controlled according to speed and inclination, so it measures and evaluates cardiovascular endurance. Most previous studies that estimated the VO2max using a treadmill developed an estimation formula that included speed and heart rate as major explanatory variables during walking or running on a treadmill [17,18].
The progressive aerobic cardiovascular endurance run (PACER) 20-m multistage shuttle run test, which is performed by running a distance of 20 m back and forth, can estimate VO2max using only the individual’s physical information and the number of round trips without measuring heart rate [19,20]. In addition, multiple people can be measured at the same time, and the occurrence of safety accidents can be minimized because it is not boring, and participants automatically drop out according to ability [21]. Therefore, a formula for estimating the VO2max using the PACER test has been developed through several previous studies. Rugger and Lambert first developed an estimation equation using the PACER test in 1988 and showed a high correlation (0.84) with the maximal exercise test [19].
Unlike the maximal exercise test, these submaximal exercise tests are a relatively safe method for estimating exercise capacity using exercise intensity, heart rate, and the physiological response up to the point when the subject is comfortable exercising [22]. However, the accuracy of cardiovascular endurance evaluation is poor [23,24]. Therefore, it is important to use an appropriate submaximal exercise test method to accurately measure the VO2max and the efficient test time [25,26]. Moreover, as there are still conflicting opinions regarding racial differences in the estimation of VO2max, it is necessary to compare and verify the validity of VO2max estimates through various submaximal exercise tests in Koreans [27].
The VO2max estimation should be accurate, easy to use, have on-site availability, and provide the basis for a scientific exercise test. The purpose of this study was to compare the validity of three different submaximal tests (i.e., treadmill test, step test, and PACER test) and develop an estimation equation by measuring the VO2max, targeting healthy Korean adults.

2. Materials and Methods

2.1. Subjects

The subjects in our study were 665 adults between 19 and 65 years of age from Seoul city. This study was approved by the Institutional Review Board at the related institution. Before beginning the study, we explained the planned measurements to the participants and received their written consent. For the accuracy of our data, we excluded the data on people with diseases in the past six months (cardiac disease, pulmonary disease, any anti-hypertensive medication record, and orthopedic disease) as these could interfere with physical activity. At the first visit, a physical examination was performed. The participants were asked about their health-related habits and daily lifestyles and basic health checkups were conducted. Their height and weight were measured, and body mass index (BMI) was calculated based on these measurements. At the next visit, we conducted three cardiovascular endurance tests separately. Due to the exclusion criteria and invalid measurements, 124 participants (eight with heart disease, 18 taking medication, 18 with invalid VO2max measurements, seven with less than nine minutes on the treadmill test, 20 with invalid PACER results, and 53 with invalid heart rate measurements) were excluded from the analyses. This resulted in a final dataset consisting of 541 adults (287 males and 254 females). The required sample size was calculated using the G-power program (version 3.1 for window) based on the effect size of 0.15, the power value of 0.95, and 5 predictors in multiple regression analysis. The results indicated that 138 participants were required for our study. The physical characteristics of the participants are shown in Table 1.

2.2. Procedures

A total of three cardiovascular endurance tests were conducted in this study, the GXT performed by the Bruce protocol, the Young Men’s Christian Association (YMCA) step test, and the PACER test. A portion of the maximal GXT was used as a method for the submaximal exercise treadmill tests. This was a research design that seeks maximum efficiency, and the GXT, a standard cardiovascular endurance test, was performed to determine the feasibility of the other tests. To minimize the impact between each test, the GXT, YMCA step test, and the PACER test were conducted on different days randomly. All participants took a break of two days or more after each test to minimize the impact of one test on the other. To minimize errors between each measurement, the participants were instructed to refrain from excessive physical activity, smoking, and alcohol consumption the day before visiting the laboratory, and not drink stimulant-containing beverages during testing.

2.3. Measurement of VO2max and Maximal GXT

The VO2max was measured applying a maximal GXT using a treadmill. The subjects wore a wireless heart rate monitor (S610i; Polar Electro Oy, Kempele, Finland) and rested for at least 10 min before the measurement. The VO2max was measured using an expired gas analyzer (K4b2; Cosmed, Rome, Italy) during the test. The maximal GXT was conducted using the Bruce protocol designed for adults [28]. This protocol is the most common protocol among the maximal GXT using a treadmill. It has been reported to produce reliable VO2max values regardless of age, gender, or fitness level [29]. For the safety of the subjects, their condition was continuously monitored during the test using a Borg RPE 10-scale and heart rate monitor. For a precise measurement of VO2max, the subjects were considered to have terminated the test when they met two of the following three criteria: heart rate approaching 95% of the predicted maximal heart rate (220—age), oxygen consumption leveling-off despite an increasing exercise load, or a change in the respiratory ratio (VCO2/VO2) of at least 1.10 [30].

2.4. Treadmill Test

The submaximal exercise (treadmill) test for estimating maximal oxygen uptake used heart rates during the three (stage 1), six (stage 2), and nine-minute (stage 3) treadmill exercises of the maximal GXT. During the treadmill test, the average heart rate for the last 10 s of each stage was recorded, and when the error in each heart rate for 10 s exceeded ±5 beats per minute (bpm), the median value was recorded.

2.5. YMCA Step Test

The submaximal exercise (step) test for estimating maximal oxygen uptake was conducted using the YMCA step test. The participant walked up and down for 3 min on a 30.5-cm high step box at a speed of 96 steps per minute [31]. Before the test, the participants were fitted with a wireless heart rate monitor (S610i; Polar Electro Oy, Kempele, Finland). After the test, the participants were immediately seated on chairs, and the recovery heart rate was measured in the radial artery for 1 min using the palpation method. Metronomes were used to maintain a steady speed for 3 min. In the participants who had difficulty maintaining a steady speed, the tester guided them to maintain an accurate pace. All subjects completed the YMCA step test without withdrawal.

2.6. PACER Test

The PACER test was conducted according to a previous study [21]. The subjects ran from one marker to another marker set 20 m apart, while keeping pace with a prerecorded signal. The signal was set to increase every minute. The initial speed was 8.5 km/h and the speed was increased to 0.5 km/h per minute. The subjects were instructed to keep up with the signal for as long as possible. The test was completed when a subject failed to reach the set marker in the set time twice or could no longer maintain the pace. The number of laps completed was recorded.

2.7. Statistical Analysis

The data collected in this study were analyzed using the SPSS 25.0 statistical program (SPSS, Inc., Chicago, IL, USA). The mean and standard deviation (SD) of the measured variables were calculated and presented. The significance level of all statistical tests was set to 0.05. Multiple regression analysis was performed to develop a VO2max predictive equation using each test value. Consistency between the measured and predicted values was evaluated using intraclass correlation coefficient (ICC) and coefficient of variation (CV). Simple regression analysis was used to examine the accuracy of the VO2max values predicted by the three tests against the criterion-measured VO2max. Bland-Altman analysis was performed to verify the correspondence between the directly measured results and the predicted results to confirm the consistency of the developed estimation equation [32].

3. Results

3.1. Results of Measured Values in Three Submaximal Exercise Tests

Table 2 shows the results of the measured values in the maximal GXT, treadmill test, YMCA step test, and PACER test in this study. The mean total VO2max value was 39.01 mL/kg/min using the maximal GXT, while it was 42.63 mL/kg/min in the male group and 34.90 mL/kg/min in the female group. During the maximal GXT, the total mean heart rate at the time of the third stage was 163.16 bpm, the male group was 157.18 bpm, and the female group was 169.91 bpm. In the case of the YMCA step test, the total mean recovery heart rate was 103.29 bpm, the male group was 99.64 bpm, and the female group was 107.46 bpm. The total mean counts in the PACER test were 40.38, the male group was 50.65 and the female group was 28.78.

3.2. Results of Multiple Regression Model to Estimate VO2max in Three Submaximal Exercise Tests

Table 3 shows the results of multiple regression analysis to estimate the VO2max. As a result of calculating the VO2max regression model for the treadmill test, YMCA step test, and PACER test, the multiple correlation coefficients were 0.762, 0.770, and 0.847, and the explanatory power of the model was 58.0%, 59.2%, and 71.7%, respectively. The standard errors of the estimation were 4.545, 4.478, and 3.732 (mL/kg/min), respectively. Table 4 shows the formula for estimating the results of the VO2max treadmill test, YMCA step test, and PACER test.

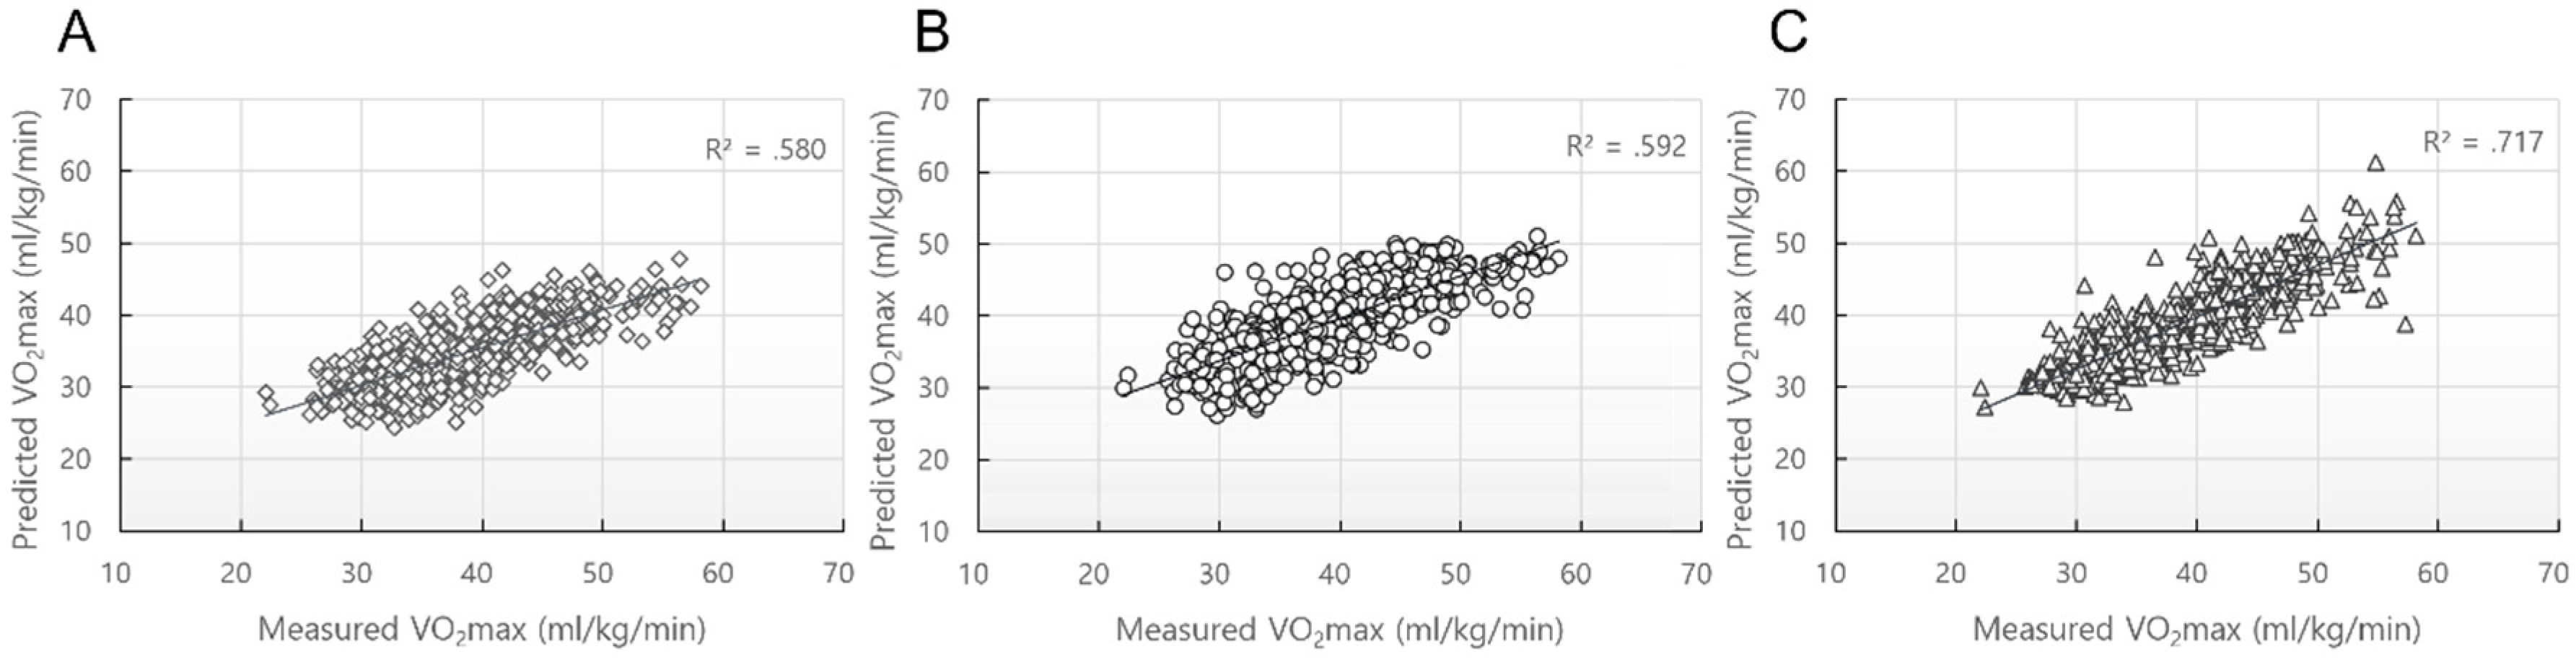
3.3. Comparison of the Validity of the Three Submaximal Exercise Tests

The differences between the measured VO2max and the predicted VO2max were 0.108 ± 4.52, 0.020 ± 4.45, and −0.010 ± 3.71 mL/kg/min for the treadmill test, YMCA step test, and PACER test, respectively (Table 5). The ICC between the measured VO2max and the predicted VO2max in the treadmill test, YMCA step test, and PACER test was 0.847, 0.853, and 0.910, respectively. The CV values were 13.68%, 13.78%, and 15.17%, respectively. Figure 1 shows the correlation analysis between the measured and predicted VO2max values in the three submaximal exercise tests. The simple regression analysis results indicated significant relationships between the criterion-measured and predicted VO2max in the three submaximal exercise tests. The R2 was 0.580, 0.592, and 0.717 for the treadmill test, YMCA step test, and PACER test, and the SEE was 4.528, 4.461, and 3.718, respectively (Table 6). Figure 2 shows the Bland-Altman limit of agreement between the predicted and measured VO2max values in the three submaximal exercise tests.

4. Discussion

The purpose of this study was to evaluate the validity of VO2max estimation equations developed using the treadmill test, YMCA step test, and PACER test in the same subjects to more accurately evaluate cardiovascular endurance in healthy Korean adults aged 19–64. The models were significant predictors of VO2max and had acceptable validity in a large sample of Korean adults. Especially, among the predictive models, PACER had the highest acceptable validity.
In a previous study on estimation equations using the heart rate response during the treadmill test [9], a VO2max estimation equation was developed using heart rates during treadmill exercises in 400 adult men and women aged from 18 to 40 years (r = 0.91). George et al., (2007) developed a formula for estimating VO2max during treadmill exercises for 100 subjects aged 18 to 65 years [30]. In a previous study, the multiple correlation coefficient was 0.94, showing highly significant results, but a maximal exercise test was conducted, and the predictors included speed (mph) and the grade (%) of the treadmill test. In our previous study, as a result of developing VO2max estimation equations as variables for gender, age, height, body fat, and heart rate (stage 2) during treadmill exercise, the multiple correlation coefficient was 0.784, and the explanatory power of the model was 61.4% [33]. Previous studies showed a higher correlation than that in our study (r = 0.762). However, the subjects in the previous study were limited to relatively young adults [9], and it is difficult to use in the field by conducting the maximal exercise test during the treadmill test [30]. According to Lambrick et al. (2009), the exercise intensity showing the highest explanatory power in the VO2max estimation equation was 64–75% of the maximal heart rate [34]. In our study, in stage 3 treadmill exercises, the exercise intensity was 90% (163.16 bpm) of the maximal heart rate (178.87 bpm), which was higher than in previous studies.
A previous study conducted a YMCA step test on 97 Germans aged 22 to 77 and reported a high correlation (r = 0.828). Between the measured VO2max value and the predicted VO2max value estimated using age, gender, and recovery heart rate [35]. In our study, there was a correlation of 0.770 between the measured VO2max value and the predicted VO2max value, indicating a lower correlation than in the previous study. However, the previous study was conducted on Germans, and it is difficult to directly compare them with our studies with a different VO2max [36]. Meanwhile, another previous study of 30 Asians showed a correlation of 0.80 as a result of comparing with the actual measured VO2max using the previously developed VO2max prediction equation [37]. In this previous study, Bland-Altman analysis was performed, and the average difference between the measured VO2max value and the predicted VO2max value was 2.26 mL/kg/min, and the upper and lower lines were 7.73 mL/kg/min and −3.21 mL/kg/min. In our study, as a result of Bland-Altman analysis, the average difference between the measured VO2max value and the predicted VO2max value was 0.020 mL/kg/min, indicating a lower average. However, the upper and lower lines were 8.756 mL/kg/min and −8.716 mL/kg/min. This seems to be because more subjects were used than in the previous study. Moreover, the average age of the subjects in the previous studies was 25.7 years (±1.9), lower than that in our study (41.69 ± 12.66).
In our study, the predictors in the PACER estimation equation were age, gender, height, weight, and the number of PACER counts (r = 0.847, SEE = 3.732 mL/kg/min). Although the predictors were different from those in our study, a previous study conducted a validity study in Asian adults [38]. Previous validation studies on Asians were conducted with gender, age, BMI, and PACER counts as predictors (r = 0.88, SEE = 3.0 mL/kg/min). They showed a similar level of effectiveness as that in our study, but the range of age was limited to between 18 and 23 years. Our study was conducted on a wider range of ages. Moreover, in our study, the ICC between the measured and predicted VO2max in the PACER test was 0.910, the highest among the three submaximal exercise tests.
Among the three submaximal exercise tests, the treadmill test showed the lowest correlation in the multiple regression model (r = 0.762). It also showed the lowest correlation between the measured VO2max and the predicted VO2max by the estimation formula (ICC = 0.847; r = 0.762). In the Bland-Altman analysis results, the difference between the measured VO2max value and the predicted VO2max value on the treadmill test was −0.108 mL/kg/min. The upper and lower lines were 8.975 mL/kg/min and −8.795 mL/kg/min. In contrast, the PACER test showed the highest multiple correlation values (r = 0.847). As a result of Bland-Altman analysis, the PACER test showed the lowest difference between the measured VO2max and the predicted VO2max values (−0.010 mL/kg/min). The upper and lower lines of the PACER test were 7.272 mL/kg/min and −7.290 mL/kg/min. The YMCA step test values were 8.756 mL/kg/min and −8.716 mL/kg/min. In our previous study results, the multiple correlation coefficient was 0.784 when measured on the treadmill test, and the multiple correlation coefficient of the YMCA step test was 0.75 to 0.78, which was similar to that in our current study. These results were similar to the results in the current study, which analyzed multiple correlations between the three tests using the same variables and subjects.
The main result of this study was that a valid VO2max predictive model was developed and compared by applying the treadmill test, YMCA step test, and PACER test to the same subjects. The three exercise tests had significant validity as in previous studies. In particular, the PACER test showed the best validity among the three submaximal exercise tests. However, there were some limitations to this study. First, although the results of our study indicated that the equations were suitable for predicting cardiovascular endurance among healthy Korean adults aged 19–64 years, it remains doubtful whether the measured three submaximal exercise tests are useful to subjects of health condition, ages, races, and other risk factors. Three tests may not be appropriable for use in all populations. Second, the three equations developed for VO2max predictions were based on heart rate or PACER counts. Therefore, for subjects in whom heart rate does not respond typically or in unhealthy adults, the equations would not produce a valid VO2max prediction. Moreover, the three tests require reasonable physical fitness for accomplishment. Therefore, it may not be suitable for people in which orthopedic problems (such as knee or hip problems) or exercise is not appropriable. Finally, it is necessary to consider that predictors include height and weight in our study, but being overweight may affect predictive models [39]. Therefore, to develop an accurate estimation model, additional studies are needed considering variables such as body fat ratio and muscle mass.

5. Conclusions

We developed and validated a VO2max estimation formula using the maximal-graded exercise test and submaximal-graded exercise tests in 541 Korean adults aged 19 to 64 years. This study included a sufficient number of Korean adults and developed and validated the predictive model. Therefore, the equations developed in this study are recommended to better evaluate the cardiovascular endurance of Korean adults according to the appropriate circumstances. The three estimation formulas developed by this study may be helpful in physical fitness and cardiovascular management by easily estimating the VO2max and evaluating the aerobic capacity of Korean adults.

Author Contributions

Conceptualization, J.C.; methodology, J.C. and K.L. investigation, K.L.; data curation, K.L.; writing—original draft preparation, K.L.; writing—review and editing, J.C. and K.L.; visualization, K.L.; supervision, J.C.; project administration, J.C. All authors have read and agreed to the published version of the manuscript.

Funding

This study was conducted with the support of the Korea Institute of Sport Science.

Institutional Review Board Statement

The study was conducted in accordance with the Declaration of Helsinki, and approved by the Institutional Review Board of Korea Institute of Sport Science (KISS-201405-EFS-004 and 22 May 2014).

Informed Consent Statement

Informed consent was obtained from all subjects involved in the study.

Data Availability Statement

The data presented in this study are available on request from the corresponding author. Some data are not available due to the wishes of some participants.

Acknowledgments

We thank all subjects for participating in this study.

Conflicts of Interest

The authors declares no conflict of interest.

References

  1. Myers, J.; Kaykha, A.; George, S.; Abella, J.; Zaheer, N.; Lear, S.; Yamazaki, T.; Froelicher, V. Fitness versus physical activity patterns in predicting mortality in men. Am. J. Med. 2004, 117, 912–918. [Google Scholar] [CrossRef] [PubMed]
  2. Jurca, R.; Jackson, A.S.; LaMonte, M.J.; Morrow, J.R., Jr.; Blair, S.N.; Wareham, N.J.; Haskell, H.L.; van Mechelen, W.; Church, T.S.; Jakicic, J.M.; et al. Assessing cardiorespiratory fitness without performing exercise testing. Am. J. Prev. Med. 2005, 29, 185–193. [Google Scholar] [CrossRef] [PubMed]
  3. Weltman, A.; Snead, D.; Stein, P.; Seip, R.; Schurrer, R.; Rutt, R.; Weltman, J. Reliability and validity of a continuous incremental treadmill protocol for the determination of lactate threshold, fixed blood lactate concentrations, and VO2max. Int. J. Sports Med. 1990, 11, 26–32. [Google Scholar] [CrossRef] [PubMed]
  4. Lockwood, P.A.; Yoder, J.E.; Deuster, P.A. Comparison and cross-validation of cycle ergometry estimates of VO2max. Med. Sci. Sports Exerc. 1997, 29, 1513–1520. [Google Scholar] [CrossRef] [PubMed]
  5. Pollock, M.L.; Foster, C.; Schmidt, D.; Hellman, C.; Linnerud, A.C.; Ward, A. Comparative analysis of physiologic responses to three different maximal graded exercise test protocols in healthy women. Am. Heart J. 1982, 103, 363–373. [Google Scholar] [CrossRef]
  6. Andreacci, J.L.; Lemura, L.M.; Cohen, S.L.; Urbansky, E.A.; Chelland, S.A.; Duvillard, S.P.V. The effects of frequency of encouragement on performance during maximal exercise testing. J. Sports Sci. 2002, 20, 345–352. [Google Scholar] [CrossRef]
  7. Abut, F.; Akay, M.F. Machine learning and statistical methods for the prediction of maximal oxygen uptake: Recent advances. Med. Devices 2015, 8, 369. [Google Scholar]
  8. Huggett, D.L.; Connelly, D.M.; Overend, T.J. Maximal aerobic capacity testing of older adults: A critical review. J. Gerontol. Ser. A Biol. Sci. Med. Sci. 2005, 60, 57–66. [Google Scholar] [CrossRef]
  9. Vehrs, P.R.; George, J.D.; Fellingham, G.W.; Plowman, S.A.; Dustman-Allen, K. Submaximal treadmill exercise test to predict VO2max in fit adults. Meas. Phys. Educ. Exerc. Sci. 2007, 11, 61–72. [Google Scholar] [CrossRef]
  10. Bennett, H.; Parfitt, G.; Davison, K.; Eston, R. Validity of submaximal step tests to estimate maximal oxygen uptake in healthy adults. Sports Med. 2016, 46, 737–750. [Google Scholar] [CrossRef]
  11. Marsh, C.E. Evaluation of the American College of Sports Medicine submaximal treadmill running test for predicting VO2max. J. Strength Cond. Res. 2012, 26, 548–554. [Google Scholar] [CrossRef] [PubMed]
  12. Léger, L.A.; Lambert, J. A maximal multistage 20-m shuttle run test to predict VO2max. Eur. J. Appl. Physiol. 1982, 49, 1–12. [Google Scholar] [CrossRef] [PubMed]
  13. Santo, A.S.; Golding, L.A. Predicting maximum oxygen uptake from a modified 3-minute step test. Res. Q. Exerc. Sport 2003, 74, 110–115. [Google Scholar] [CrossRef] [PubMed]
  14. Shahnawaz, H. Influence of limb length on a stepping exercise. J. Appl. Physiol. 1978, 44, 346–349. [Google Scholar] [CrossRef] [PubMed]
  15. Ponthieux, N.A.; Barker, D.G. Relationships between race and physical fitness. Res. Q. 1965, 36, 468–472. [Google Scholar] [CrossRef] [PubMed]
  16. Swift, D.L.; Johannsen, N.M.; Lavie, C.J.; Earnest, C.P.; Johnson, W.D.; Blair, S.N.; Church, T.S.; Newton, R.L., Jr. Racial differences in the response of cardiorespiratory fitness to aerobic exercise training in Caucasian and African American postmenopausal women. J. Appl. Physiol. 2013, 114, 1375–1382. [Google Scholar] [CrossRef] [Green Version]
  17. Town, G.P.; Golding, L.A. Treadmill test to predict maximum aerobic capacity. J. Phys. Educ. 1977, 74, 6–8. [Google Scholar]
  18. Foster, C.; Crowe, A.J.; Daines, E.; Dumit, M.; Green, M.A.; Lettau, S.; Thompson, N.N.; Weymier, J. Predicting functional capacity during treadmill testing independent of exercise protocol. Med. Sci. Sports Exerc. 1996, 28, 752–756. [Google Scholar] [CrossRef]
  19. Léger, L.A.; Mercier, D.; Gadoury, C.; Lambert, J. The multistage 20 metre shuttle run test for aerobic fitness. J. Sports Sci. 1988, 6, 93–101. [Google Scholar] [CrossRef]
  20. Mahar, M.T.; Welk, G.J.; Rowe, D.A.; Crotts, D.J.; McIver, K.L. Development and validation of a regression model to estimate VO2peak from PACER 20-m shuttle run performance. J. Phys. Act. Health 2006, 3, S34–S46. [Google Scholar] [CrossRef] [Green Version]
  21. Lee, O.; Chung, J.W. Study on validation of 20 m progressive aerobic cardiovascular endurance run and estimation of maximal oxygen uptake in adolescents. Exerc. Sci. 2019, 28, 168–174. [Google Scholar] [CrossRef] [Green Version]
  22. Noonan, V.; Dean, E. Submaximal exercise testing: Clinical application and interpretation. Phys. Ther. 2000, 80, 782–807. [Google Scholar] [CrossRef] [PubMed]
  23. Howley, E.T.; Bassett, D.R.; Welch, H.G. Criteria for maximal oxygen uptake: Review and commentary. Med. Sci. Sports Exerc. 1995, 27, 1292. [Google Scholar] [CrossRef] [PubMed]
  24. Loudon, J.K.; Cagle, P.E.; Figoni, S.F.; Nau, K.L.; Klein, R.M. A submaximal all-extremity exercise test to predict maximal oxygen consumption. Med. Sci. Sports Exerc. 1998, 30, 1299–1303. [Google Scholar] [CrossRef] [PubMed]
  25. Zwiren, L.D.; Freedson, P.S.; Ward, A.; Wilke, S.; Rippe, J.M. Estimation of VO2max: A comparative analysis of five exercise tests. Res. Q. Exerc. Sport 1991, 62, 73–78. [Google Scholar] [CrossRef] [PubMed]
  26. Grant, J.A.; Joseph, A.N.; Campagna, P.D. The prediction of VO2max: A comparison of 7 indirect tests of aerobic power. J. Strength Cond. Res. 1999, 13, 346–352. [Google Scholar] [CrossRef]
  27. Sun, M.; Gower, B.A.; Nagy, T.R.; Trowbridge, C.A.; Dezenberg, C.; Goran, M.I. Total, resting, and activity-related energy expenditures are similar in Caucasian and African-American children. Am. J. Physiol. 1998, 274, E232–E237. [Google Scholar] [CrossRef]
  28. Bruce, R.A.; Blackmon, J.R.; Jones, J.W.; Strait, G. Exercising testing in adult normal subjects and cardiac patients. Pediatrics 1963, 32, 742–756. [Google Scholar] [CrossRef]
  29. Hamlin, M.; Draper, N.; Blackwell, G.; Shearman, J.; Kimber, N. Determination of maximal oxygen uptake using the bruce or a novel athlete-led protocol in a mixed population. J. Hum. Kinet. 2011, 31, 97–104. [Google Scholar] [CrossRef] [Green Version]
  30. George, J.D.; Bradshaw, D.I.; Hyde, A.; Vehrs, P.R.; Hager, R.L.; Yanowitz, F.G. A maximal graded exercise test to accurately predict VO2max in 18–65-year-old adults. Meas. Phys. Educ. Exerc. Sci. 2007, 11, 149–160. [Google Scholar] [CrossRef]
  31. Lawrence, A.; Coldin, G. YMCA Fitness Testing and Assessment Manual; Human Kinetics: Champaign, IL, USA, 2000. [Google Scholar]
  32. Bland, J.M.; Altman, D. Statistical methods for assessing agreement between two methods of clinical measurement. Lancet 1986, 327, 307–310. [Google Scholar] [CrossRef]
  33. Lee, O.; Lee, S.; Kang, M.; Mun, J.; Chung, J. Prediction of maximal oxygen consumption using the Young Men’s Christian Association-step test in Korean adults. Eur. J. Appl. Physiol. 2019, 119, 1245–1252. [Google Scholar] [CrossRef] [PubMed]
  34. Lambrick, D.M.; Faulkner, J.A.; Rowlands, A.V.; Eston, R.G. Prediction of maximal oxygen uptake from submaximal ratings of perceived exertion and heart rate during a continuous exercise test: The efficacy of RPE 13. Eur. J. Appl. Physiol. 2009, 107, 1–9. [Google Scholar] [CrossRef] [PubMed]
  35. Beutner, F.; Ubrich, R.; Zachariae, S.; Engel, C.; Sandri, M.; Teren, A.; Gielen, S. Validation of a brief step-test protocol for estimation of peak oxygen uptake. Eur. J. Prev. Cardiol. 2015, 22, 503–512. [Google Scholar] [CrossRef]
  36. McMurray, R.G.; Harrell, J.S.; Bradley, C.B.; Deng, S.H.I.B.I.N.G.; Bangdiwala, S.I. Predicted maximal aerobic power in youth is related to age, gender, and ethnicity. Med. Sci. Sports Exerc. 2002, 34, 145–151. [Google Scholar] [CrossRef]
  37. Van Kieu, N.T.; Jung, S.J.; Shin, S.W.; Jung, H.W.; Jung, E.S.; Won, Y.H.; Kim, Y.G.; Chae, S.W. The validity of the YMCA 3-minute step test for estimating maximal oxygen uptake in healthy Korean and Vietnamese adults. J. Lifestyle Med. 2020, 10, 21–29. [Google Scholar] [CrossRef]
  38. Matsuzaka, A.; Takahashi, Y.; Yamazoe, M.; Kumakura, N.; Ikeda, A.; Wilk, B.; Bar-Or, O. Validity of the multistage 20-m shuttle-run test for Japanese children, adolescents, and adults. Pediatr. Exerc. Sci. 2004, 16, 113–125. [Google Scholar] [CrossRef]
  39. Mahar, M.T.; Welk, G.J.; Rowe, D.A. Estimation of aerobic fitness from PACER performance with and without body mass index. Meas. Phys. Educ. Exerc. Sci. 2018, 22, 239–249. [Google Scholar] [CrossRef] [Green Version]
Figure 1. Correlation analysis of the predicted and measured VO2max values in the three submaximal exercise tests. (A): Treadmill test; (B): YMCA step test; (C): PACER: test.
Applsci 12 01371 g001
Figure 2. Bland-Altman plots between the predicted and measured VO2max values in the three submaximal exercise tests. (A): Treadmill test; (B): YMCA step test; (C): PACER: test. The mean line represents the mean difference (bias) between the measured and predicted VO2max values. The upper and lower lines are limits of agreement between the measured and predicted VO2max values.
Applsci 12 01371 g002
Table 1. Physical characteristics of the subjects.
Subgroup (n)Age (years)Height (cm)Weight (kg)BMI (kg/m2)
Males (287)19~24 (31)22.68 ± 1.49176.08 ± 6.6071.66 ± 8.7323.16 ± 2.63
25~29 (33)27.27 ± 1.38176.06 ± 4.5874.44 ± 10.3024.09 ± 3.24
30~34 (34)32.09 ± 1.29175.55 ± 5.9673.61 ± 10.6023.82 ± 3.14
35~39 (33)37.15 ± 1.28174.19 ± 6.4977.02 ± 10.9025.24 ± 2.96
40~44 (34)41.71 ± 1.34172.28 ± 5.4671.08 ± 8.0423.88 ± 2.23
45~49 (34)46.79 ± 1.32172.32 ± 4.7475.14 ± 10.0325.21 ± 2.99
50~54 (23)52.70 ± 1.52169.11 ± 5.9571.77 ± 9.3124.96 ± 2.14
55~59 (34)56.82 ± 1.64169.32 ± 5.4269.76 ± 8.0124.21 ± 2.19
60~64 (31)62.29 ± 1.42169.96 ± 6.2565.35 ± 12.5024.03 ± 2.48
Total (287)41.83 ± 12.83172.56 ± 6.4672.27 ± 10.3024.28 ± 2.76
Females (254)19~24 (29)22.14 ± 1.58162.69 ± 4.8154.65 ± 6.9320.86 ± 2.62
25~29 (26)27.46 ± 1.36163.42 ± 6.0254.41 ± 5.8120.38 ± 1.81
30~34 (26)31.77 ± 1.28162.34 ± 5.3656.64 ± 10.7021.35 ± 3.15
35~39 (36)36.81 ± 1.45162.35 ± 6.2457.31 ± 7.3921.81 ± 2.44
40~44 (31)42.10 ± 1.38161.04 ± 4.5159.97 ± 9.4022.97 ± 3.24
45~49 (26)47.04 ± 1.46160.79 ± 5.1557.42 ± 6.0422.00 ± 2.23
50~54 (32)52.66 ± 1.58158.10 ± 4.2155.51 ± 6.3022.19 ± 2.16
55~59 (27)56.89 ± 1.31157.73 ± 4.8557.57 ± 6.1723.04 ± 2.31
60~64 (21)61.62 ± 1.32154.43 ± 5.5656.86 ± 8.1723.81 ± 3.11
Total (254)41.54 ± 12.48160.50 ± 5.7756.75 ± 7.6422.01 ± 2.73
Total (541)41.69 ± 12.66166.89 ± 8.6064.98 ± 11.9923.21 ± 2.97
BMI: body mass index. Values are means and standard deviation.
Table 2. Maximal GXT, treadmill test, YMCA step test, and PACER test results.
Male (287)Female (254)Total (541)
Maximal GXT
VO2max (mL/kg/min)42.63 ± 6.2934.90 ± 5.2339.01 ± 6.98
Stable HR (bpm/min)73.44 ± 10.1077.22 ± 8.8875.21 ± 9.73
Maximal RER1.23 ± 0.081.24 ± 0.091.23 ± 0.08
Maximal HR (bpm/min)180.96 ± 13.15176.32 ± 13.08178.78 ± 13.31
Treadmill test
Stage 3 HR (bpm/min)157.18 ± 13.55169.91 ± 11.96163.16 ± 14.30
YMCA Step test
RHR (bpm/min)99.64 ± 16.24107.46 ± 15.03103.29 ± 16.14
PACER test
Counts (# laps)50.65 ± 18.4228.78 ± 11.9240.38 ± 19.13
GXT: graded exercise test; RER: respiratory exchange ratio; HR: heart rate; YMCA: Young Men’s Christian Association; RHR: recovery heart rate; PACER: progressive aerobic cardiovascular endurance run. Values are means and standard deviation.
Table 3. Multiple regression model to estimate VO2max using the treadmill test, YMCA step test, and PACER test.
Treadmill Test YMCA Step TestPACER Test
Intercept68.82860.40043.418
Sex8.4289.1385.114
Age (years)−0.249−0.229−0.094
Height (cm)0.0710.045−0.022
Weight (kg)−0.208−0.182−0.135
Stage 3 HR (beat/min)−0.137--
RHR (bpm/min)-−0.120-
Count (reps)--0.229
R0.7620.7700.847
R20.5800.5920.717
SEE4.5454.4783.732
F147.801155.466270.900
p0.0000.0000.000
Durbin-Watson1.9031.9001.819
YMCA: Young Men’s Christian Association; PACER: progressive aerobic cardiovascular endurance run; HR: heart rate; RHR: recovery heart rate.
Table 4. Regression equations for predicting VO2max using the treadmill test, YMCA step test, and PACER test.
N (541)Regression Equation
Treadmill
test
=68.828 + 8.428 (sex; male 1, female 0) − 0.249 (age) + 0.071 (height) − 0.208 (weight) − 0.137 (stage 3 HR)
YMCA
step test
=60.400 + 9.138 (sex; male 1, female 0) − 0.229 (age) + 0.045 (height) − 0.182 (weight) − 0.120 (RHR)
PACER
test
=43.418 + 5.114 (sex; male 1, female 0) − 0.094 (age) − 0.022 (height) − 0.135 (weight) + 0.229 (counts)
YMCA: Young Men’s Christian Association; PACER: progressive aerobic cardiovascular endurance run; HR: heart rate; RHR: recovery heart rate.
Table 5. ICC and CV of measured and predicted VO2max values in the three submaximal exercises.
Predicted
VO2max (mL/kg/min)
Measured-Predicted
VO2max (mL/kg/min)
ICC
(α)
CV
(%)
Treadmill
test
38.90 ± 5.320.108 ± 4.520.84713.68
YMCA
step test
38.97 ± 5.370.020 ± 4.450.85313.78
PACER
test
39.02 ± 5.92−0.010 ± 3.710.91015.17
YMCA: Young Men’s Christian Association; PACER: progressive aerobic cardiovascular endurance run; ICC: intraclass correlation coefficient; CV: coefficient of the variation. Values are means and standard deviation.
Table 6. Results of simple regression analysis of the treadmill test, YMCA step test, and PACER test results.
TestsBSEβ95% CIRR2SEE
LowerUpper
Treadmill test
Intercept0.1291.438 −2.6962.9540.7620.5804.528
Slope0.9990.0370.7620.9281.071
YMCA Step test
Intercept0.0171.406 −2.7462.7790.7700.5924.461
Slope1.0000.0360.7700.9301.070
PACER test
Intercept0.0471.067 −2.0522.139
Slope0.9990.0270.8470.9461.0520.8470.7173.718
Publisher’s Note: MDPI stays neutral with regard to jurisdictional claims in published maps and institutional affiliations.

