
Sort and Deep-SORT Based Multi-Object Tracking for Mobile Robotics: Evaluation with New Data Association Metrics


Abstract
:1. Introduction
- Eight new object tracking data association cost matrix formulations based on intersection over union, Euclidean distances, and bounding boxes ratio are proposed.
- The ISR Tracking dataset, presenting a mission performed by a mobile robot in a lab setting, represents the object conditions under which robotic platforms may navigate. It is a rearrangement of the ISR RGB-D dataset [28] with object tracking labels for multi-object tracking tasks.
- An evaluation, having in view navigation tasks for assistive mobile robot platforms, of two multi-object tracking by detection algorithms, SORT and Deep-SORT, is also presented. The proposed new data association cost matrices were integrated and evaluated on both tracking methods.
2. Related Work
2.1. Object Tracking
Tracking by Detection
2.2. Tracking Applied in Mobile Robots
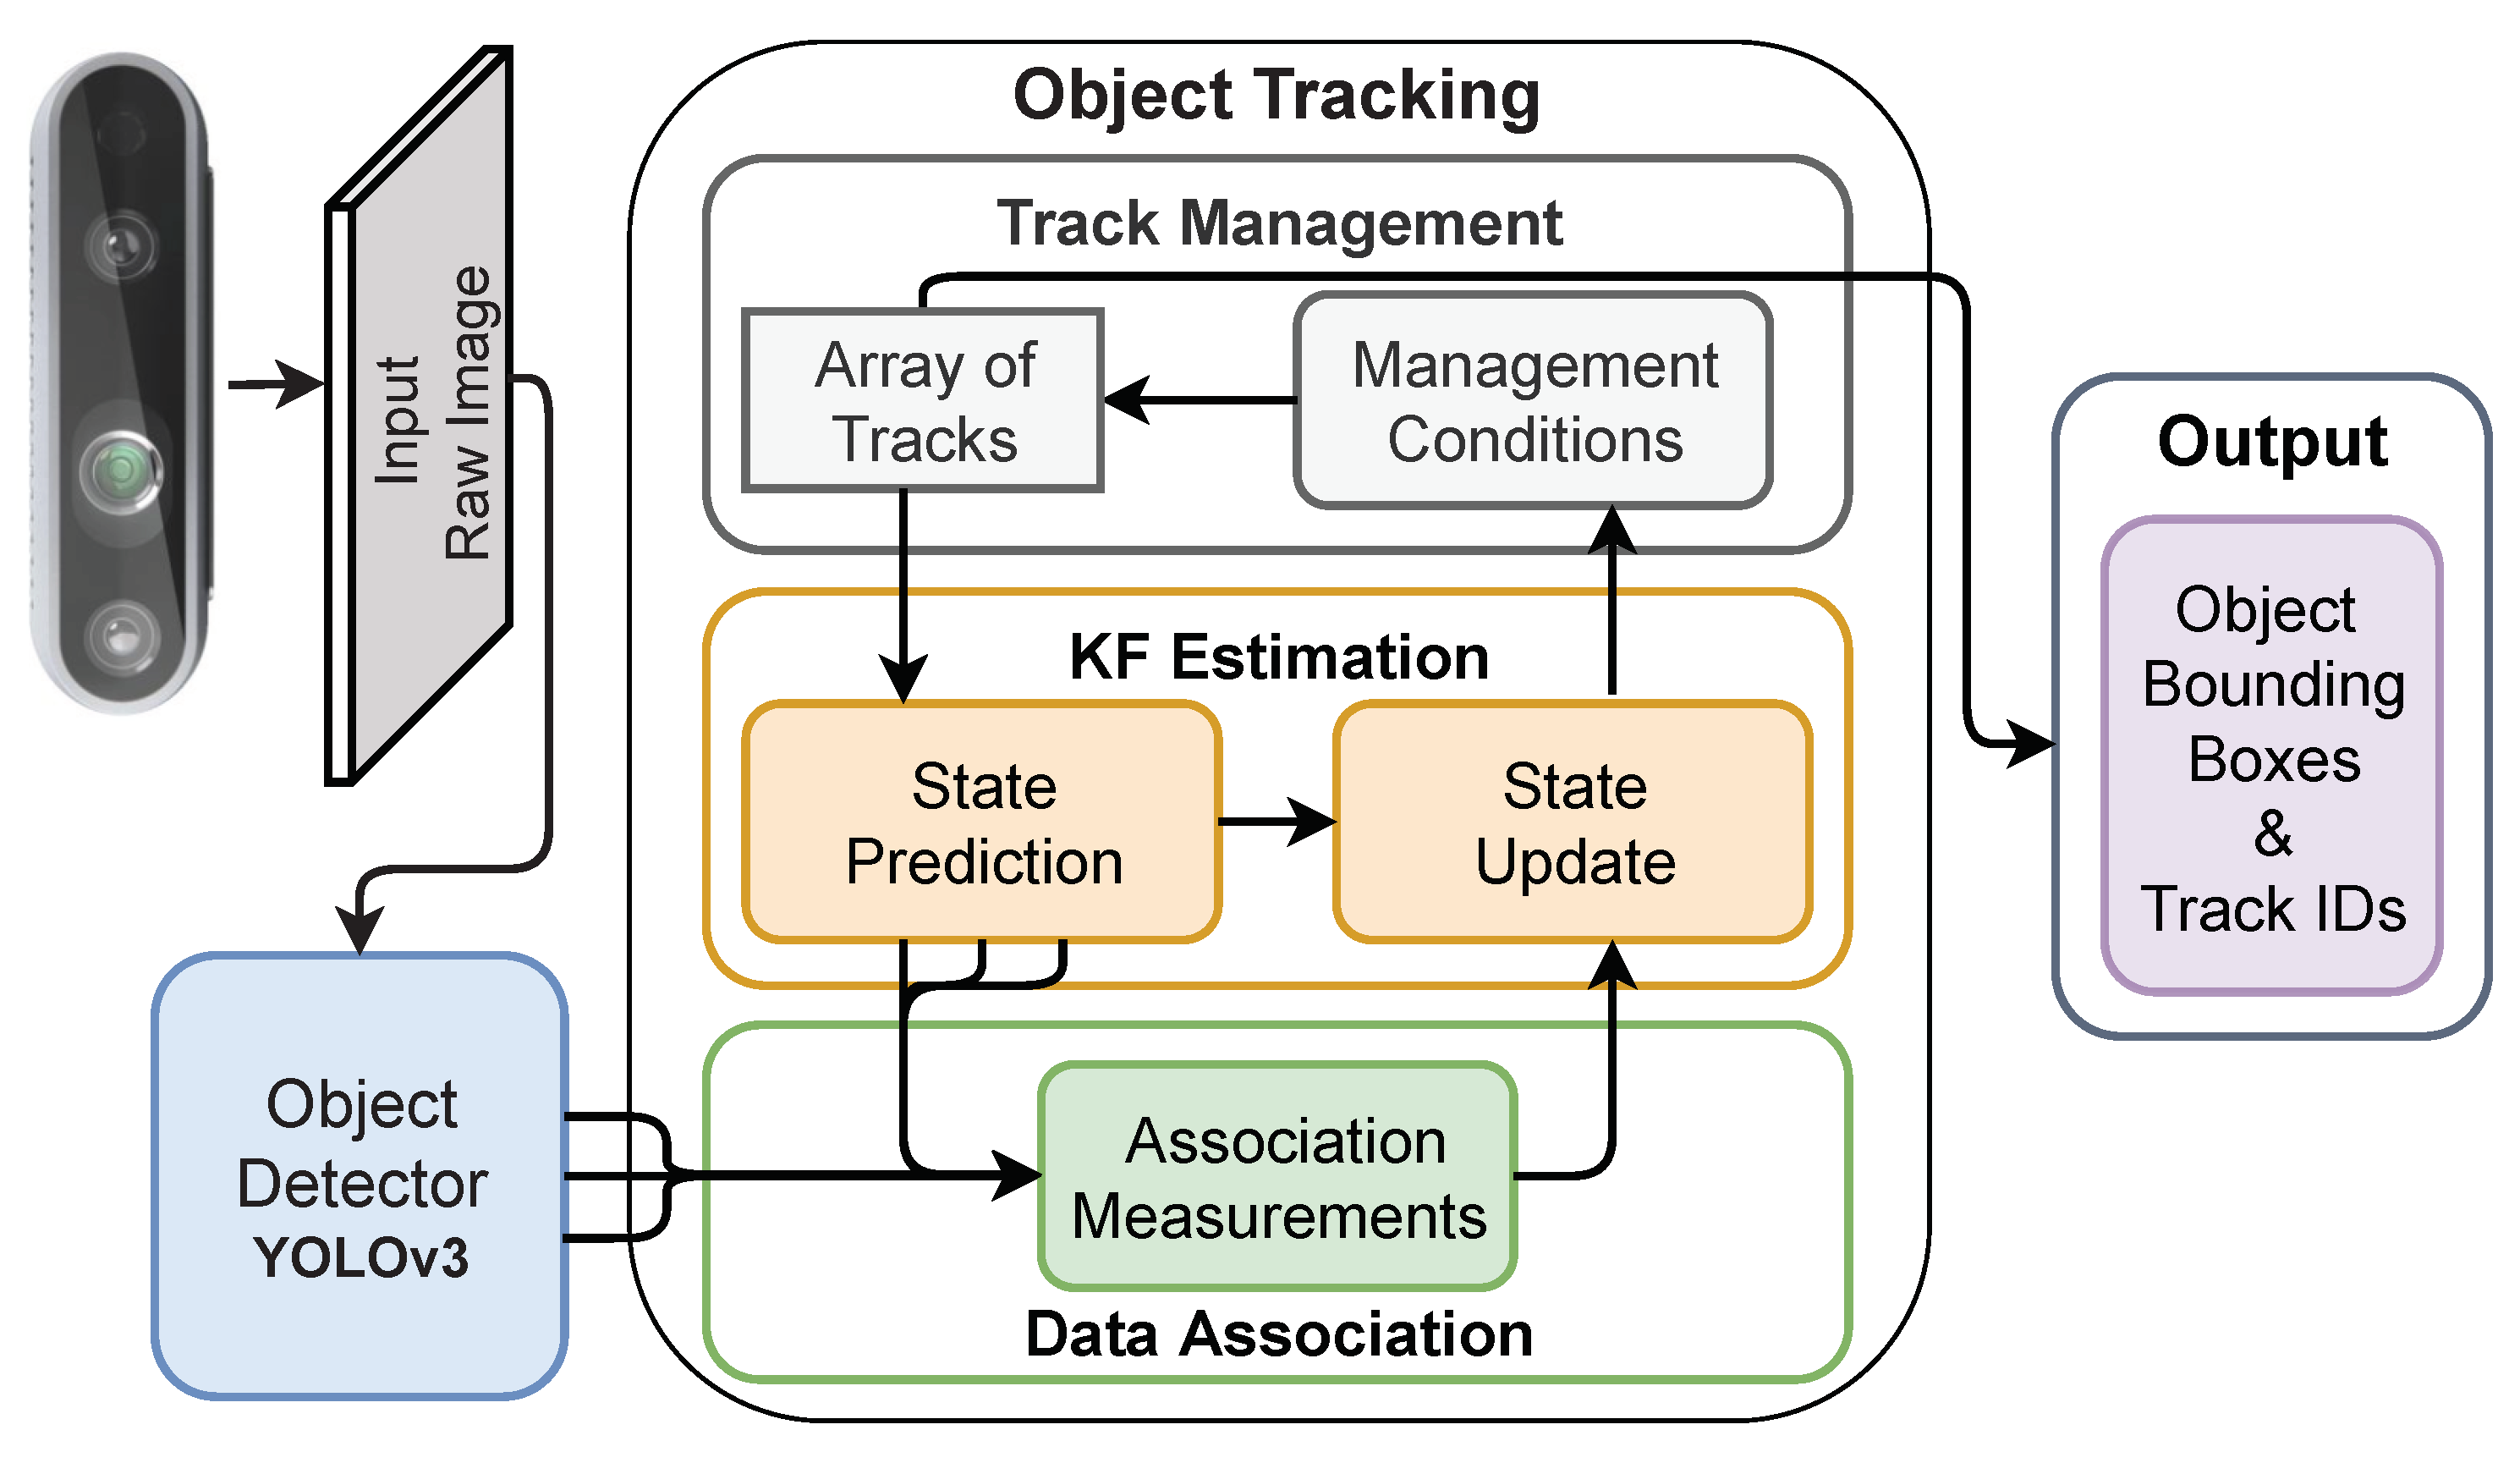
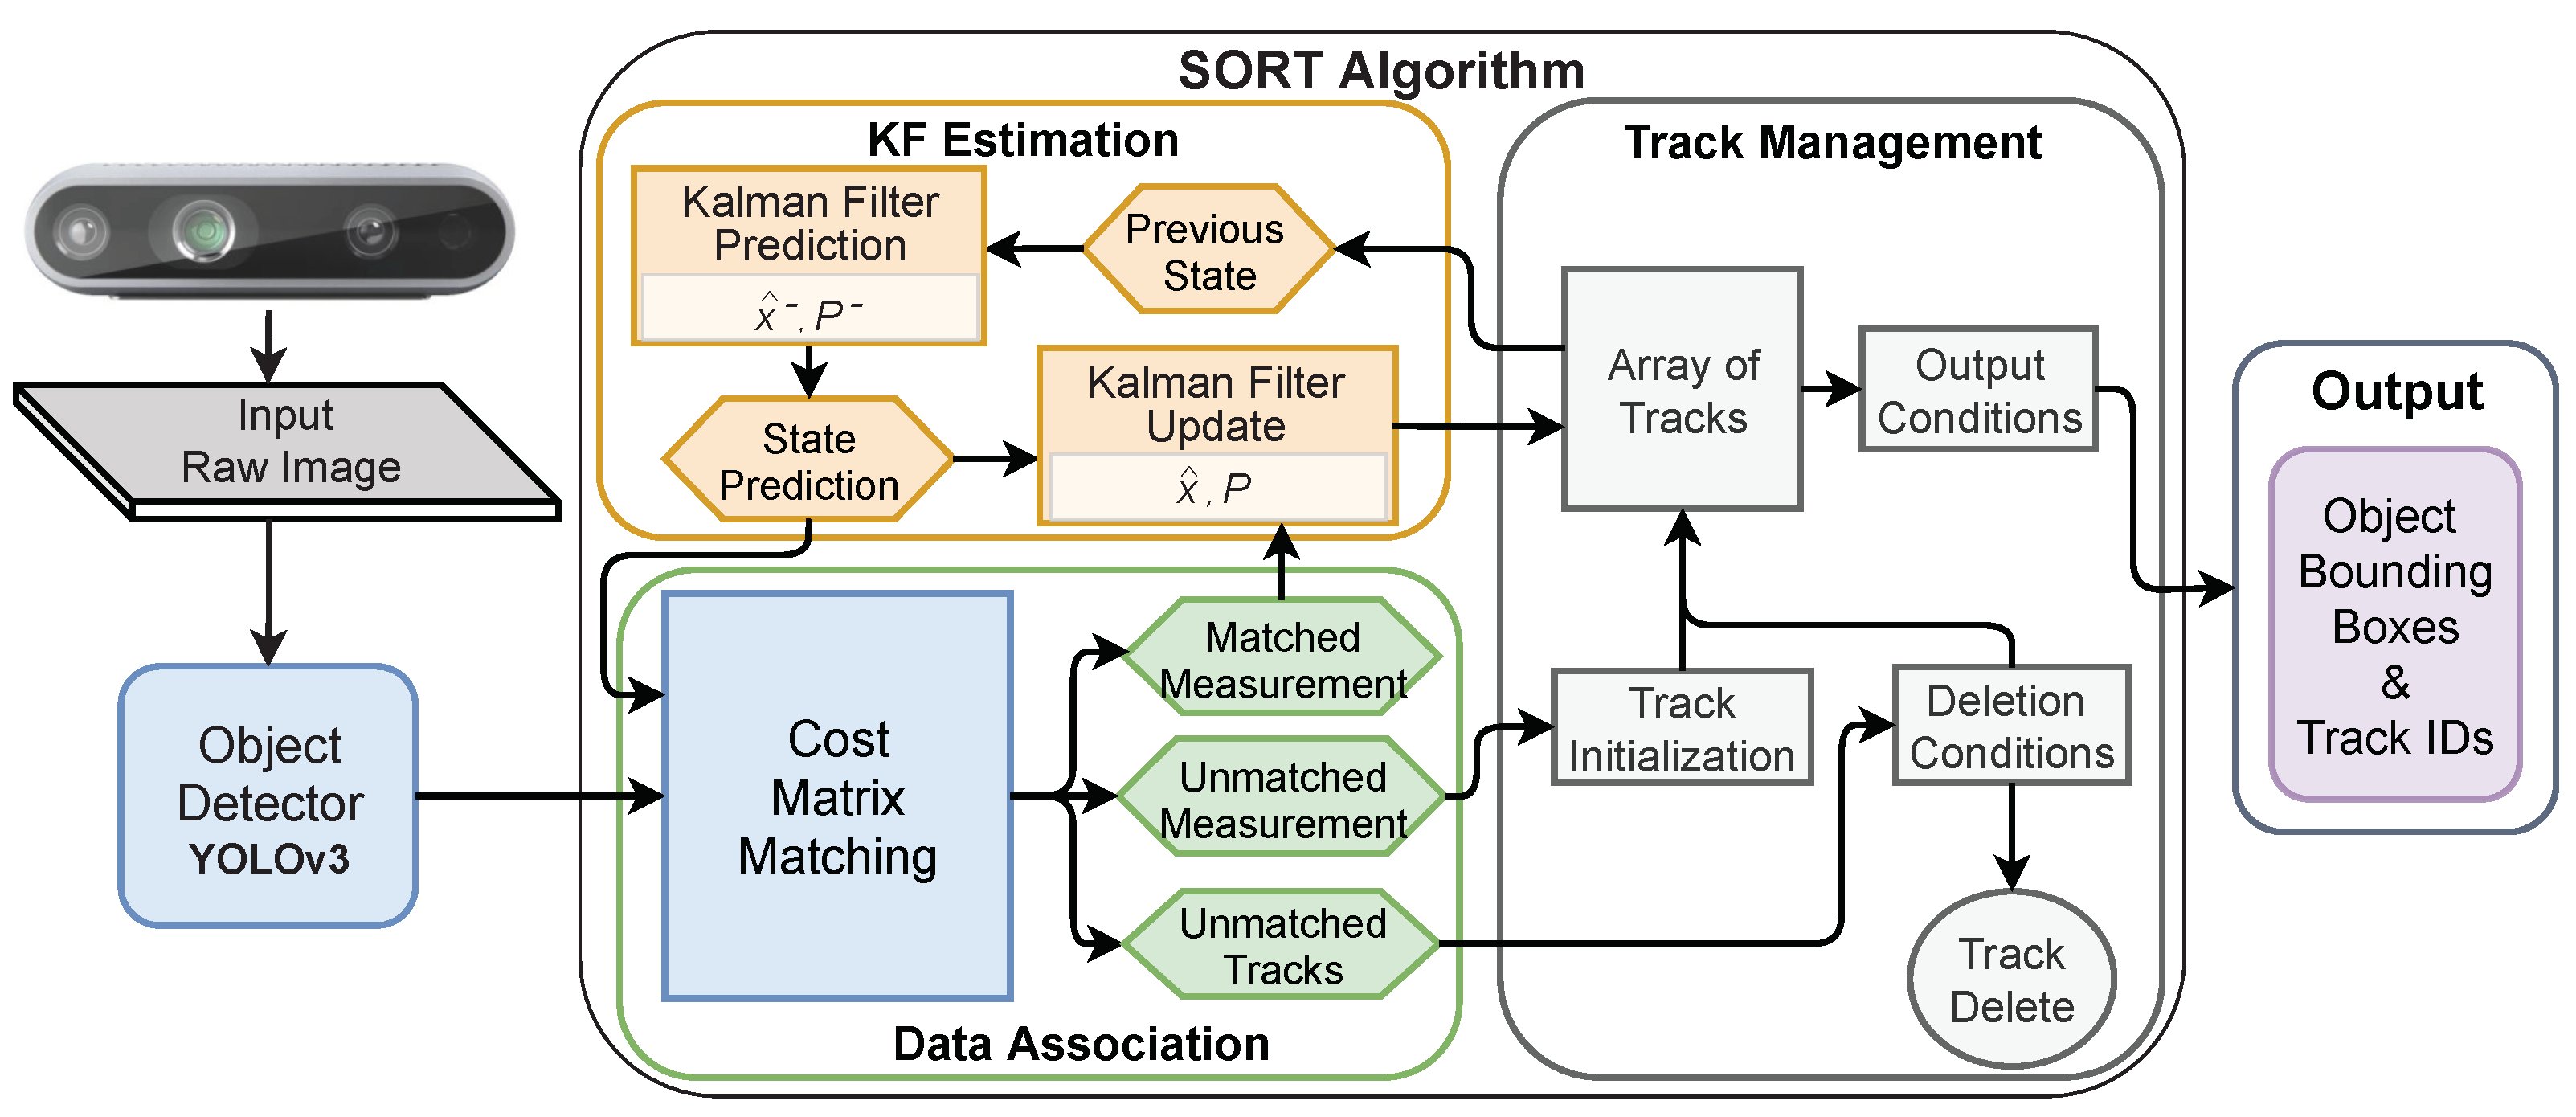
3. Methodology
3.1. SORT
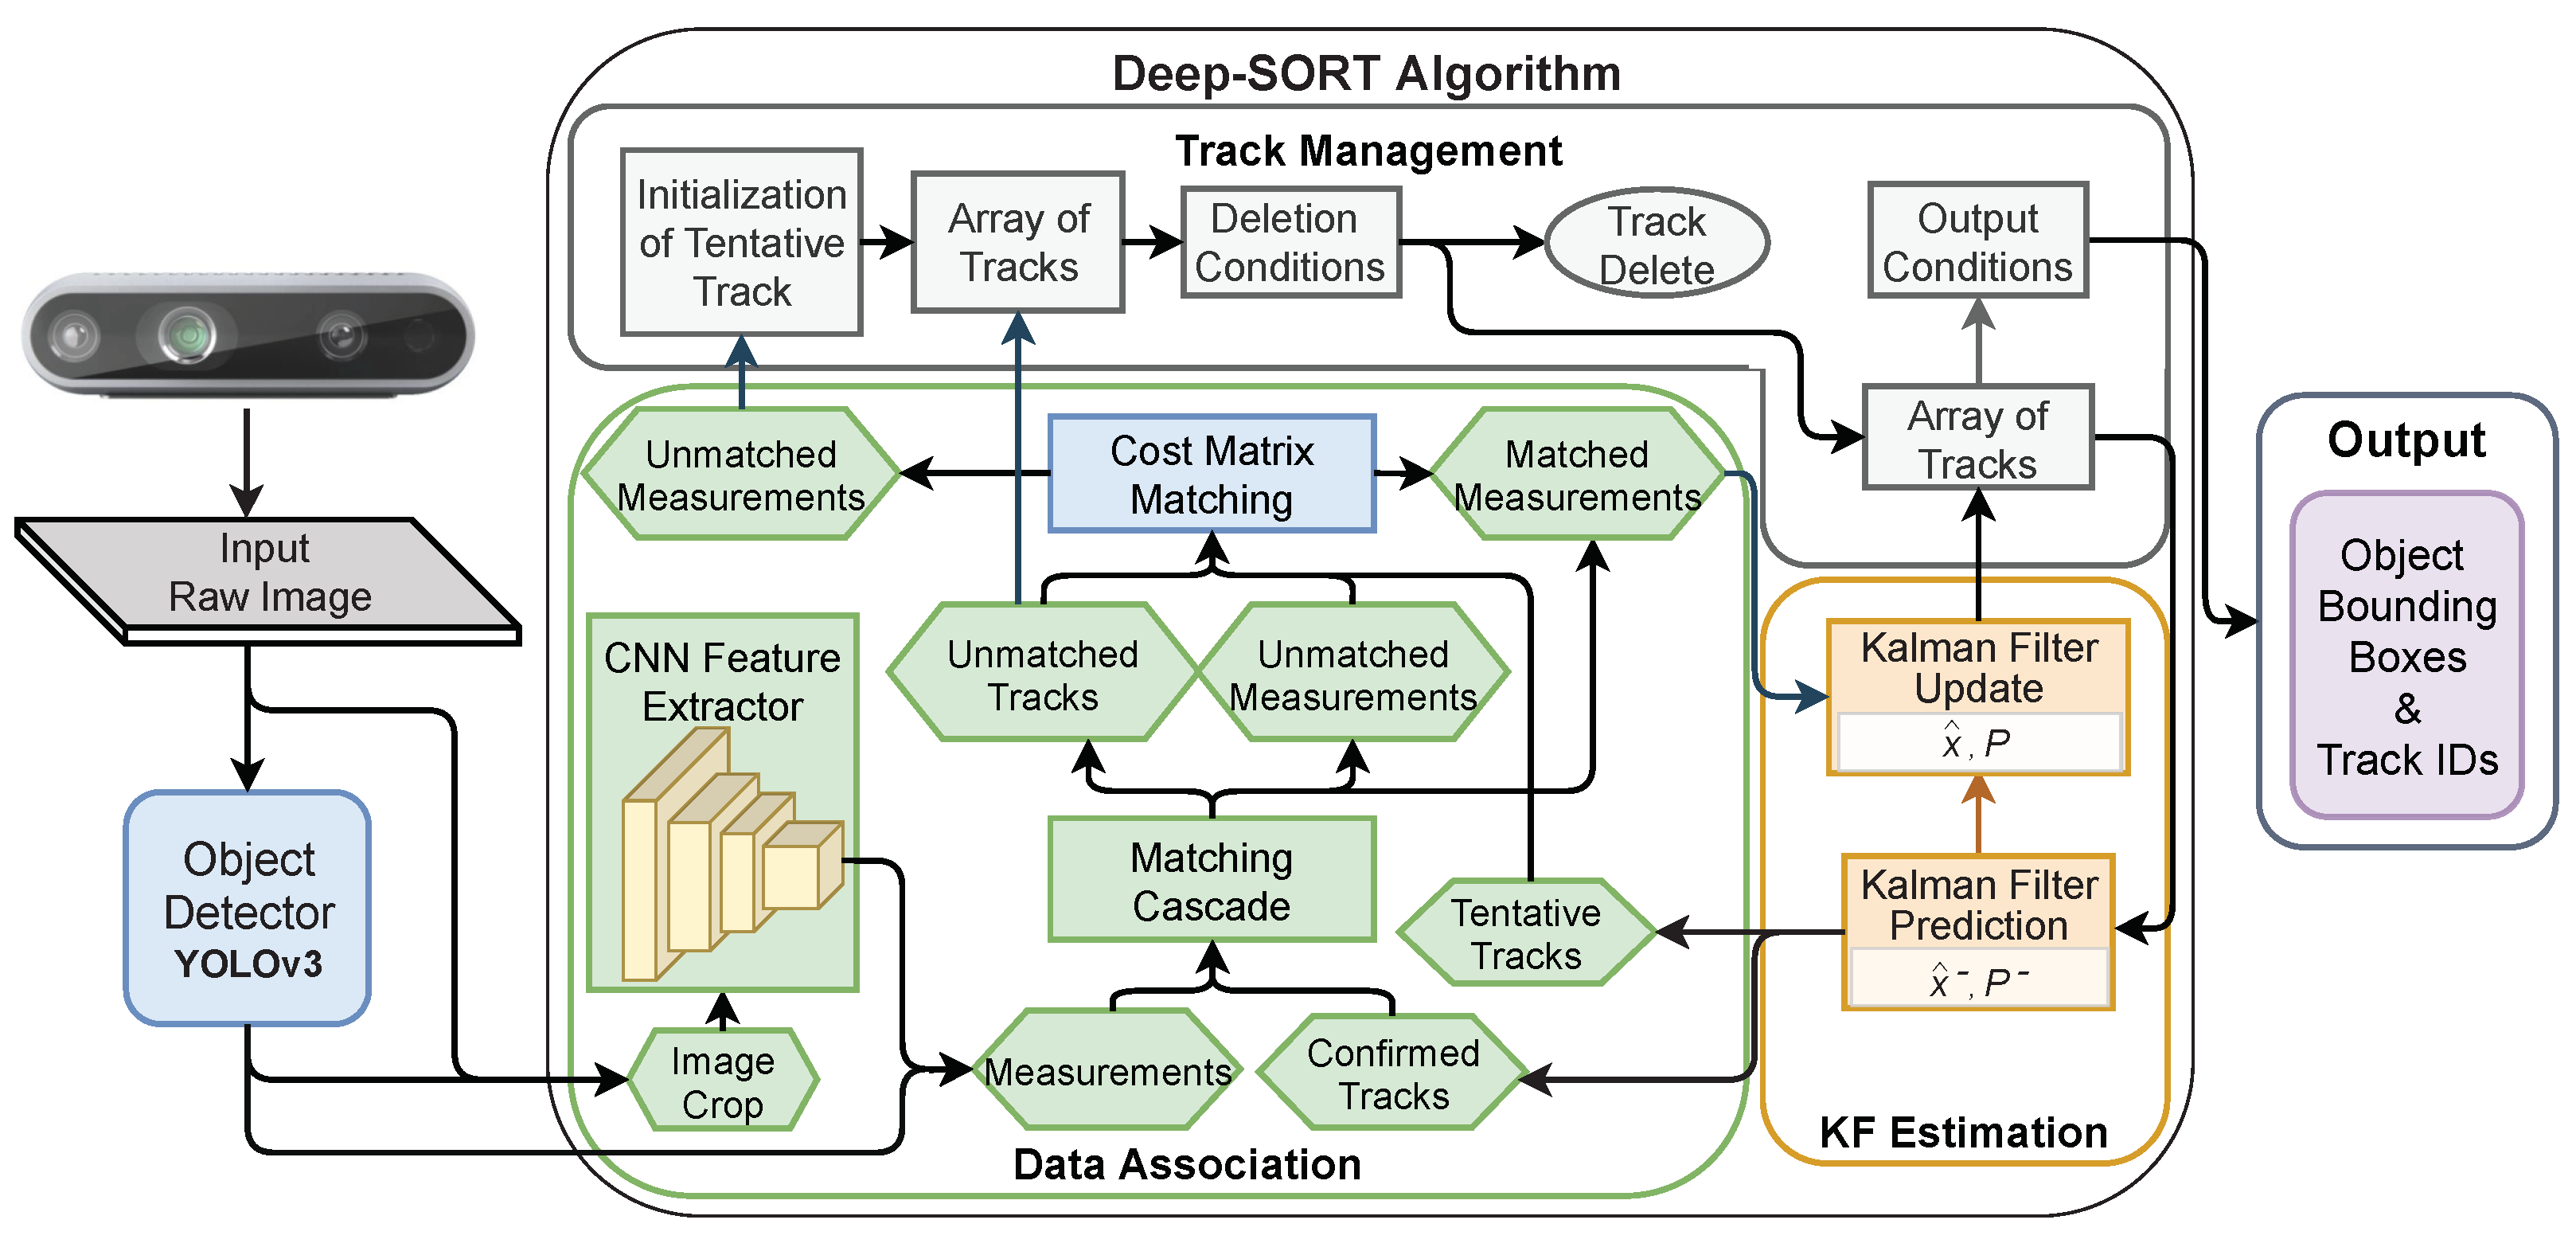
3.2. Deep-SORT
3.3. Data Association—Cost Matrix Matching
- Euclidean distance based cost matrix ():which represents the distance between bounding box central points normalized into half of the image dimension. To formulate the problem as a maximization problem, to be solved using the Hungarian algorithm, the distance is obtained by the difference between 1 and the normalized Euclidean distance, as follows:where (h,w) are the height and width of the input image, is a bounding box from the detection set, and is a bounding box from the prediction set.
- Bounding box ratio based cost matrix ()—implemented as a ratio between the product of each width and height:In addition, for boxes with similar shapes, this metric outcome with a value closer to 1 contrasts values close to 0 or much greater than 1 otherwise. For that reason, the minimum between the bounding box ratio and its inverse is applied, to get a value that is within the range.
- SORT’s IoU cost matrix combined with the Euclidean distance cost matrix:where ∘ represents the Hadamard product (element-wise product) between two matrices.
- SORT’s IoU cost matrix combined with the box ratio based cost matrix:
- Euclidean distance cost matrix combined with the box ratio based cost matrix:
- SORT’s IoU cost matrix combined with the Euclidean distance cost matrix and the box ratio based cost matrix:
- Element-wise average of every cost matrix (A(D, P)):
- Element-wise weighted mean of every cost matrix value:
3.4. ISR Tracking Dataset
4. Experiments
4.1. Datasets
4.2. Implementation Details
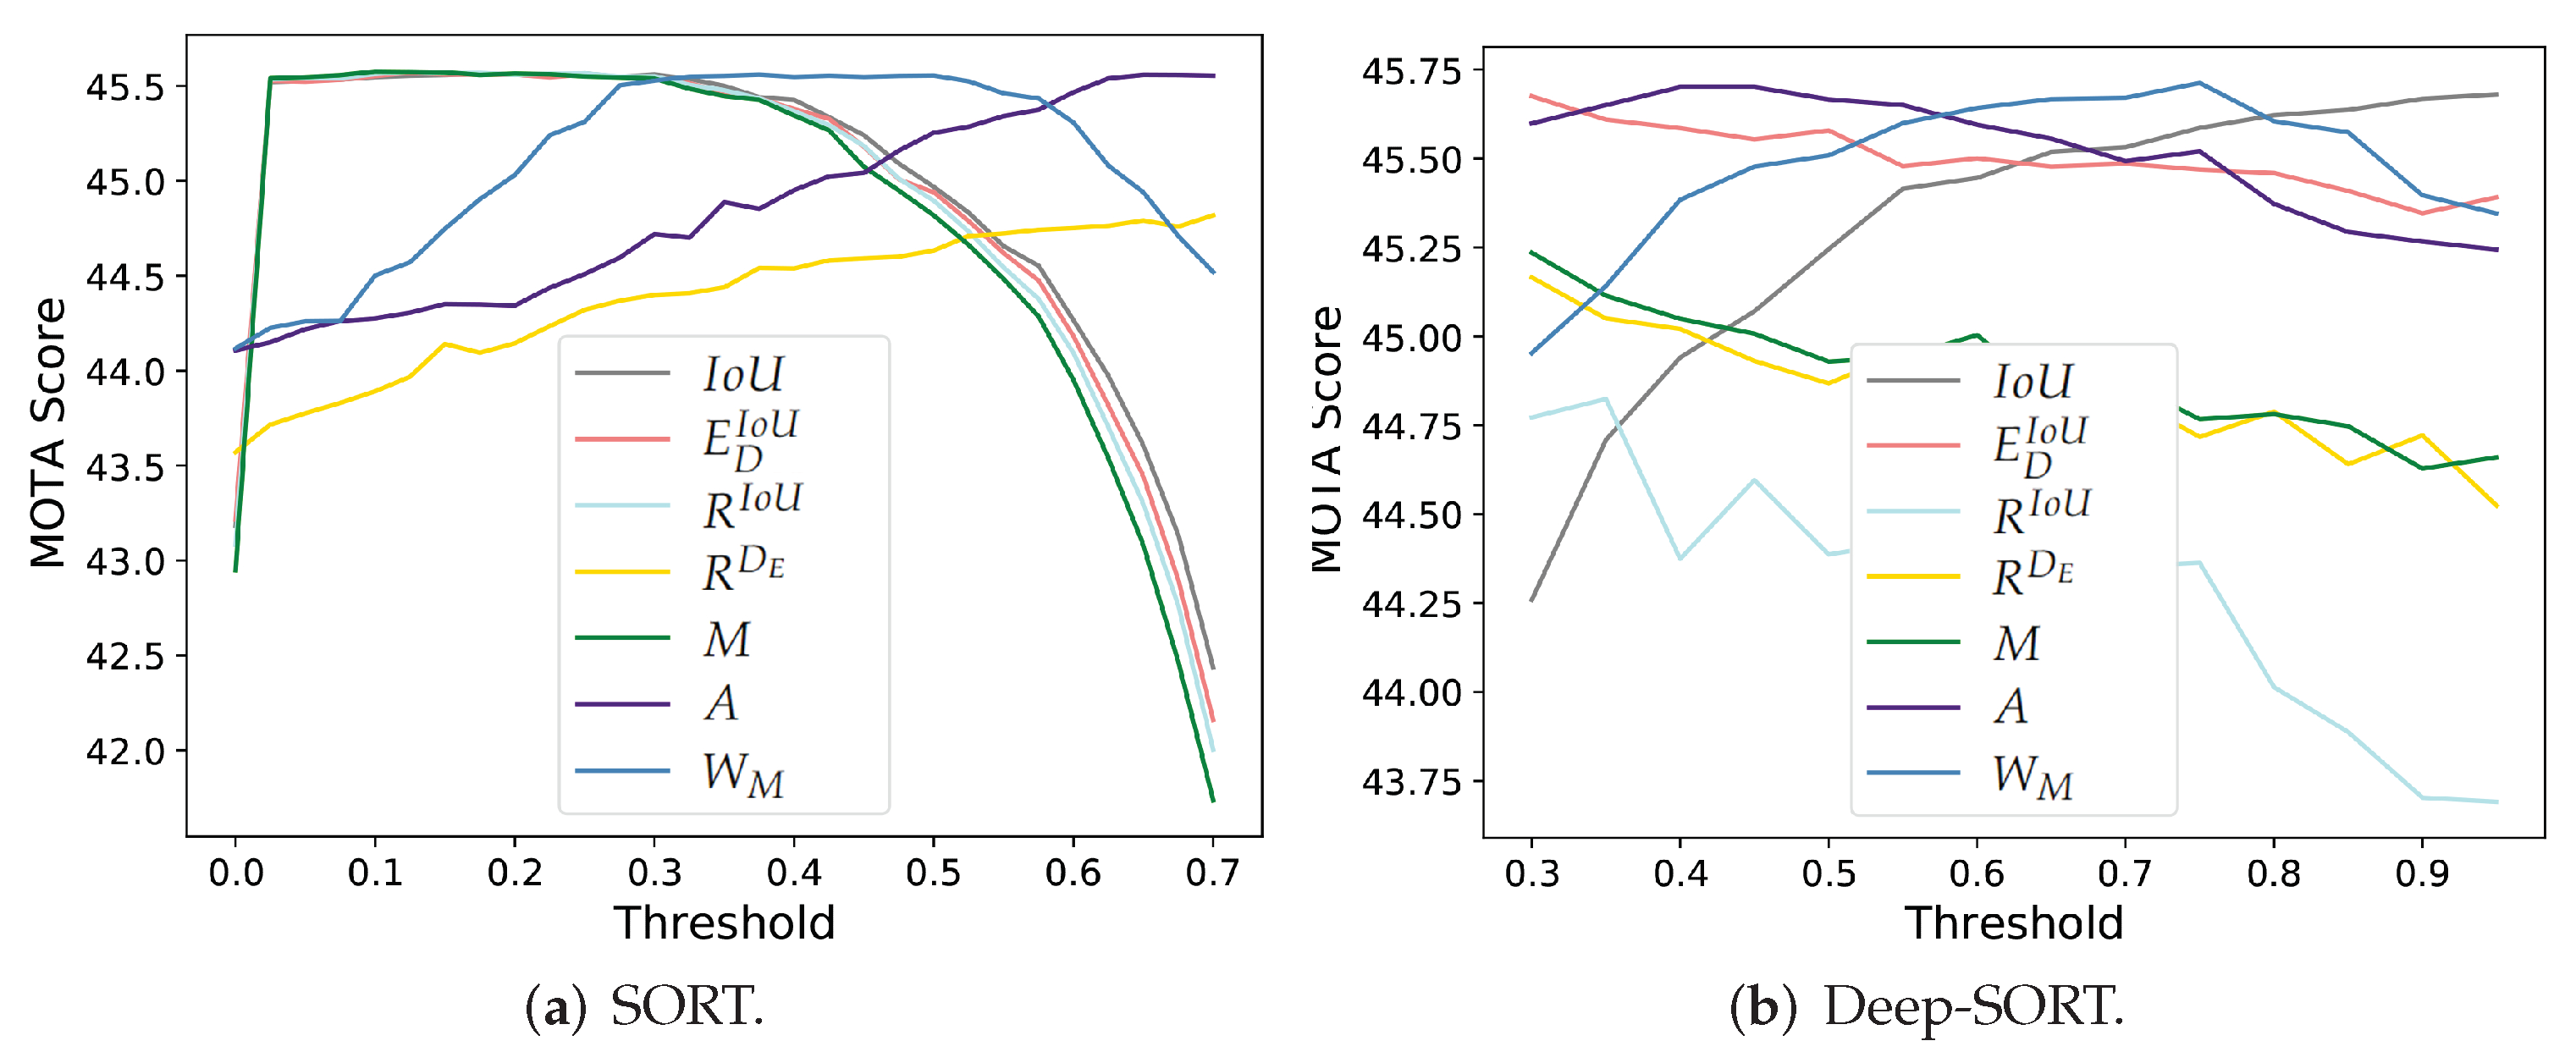
4.3. Results
4.3.1. SORT and Deep-SORT Evaluation
4.3.2. SORT and Deep-SORT on Skipped Frames
4.3.3. Detection-Based MOT Pipeline
5. Conclusions
Author Contributions
Funding
Institutional Review Board Statement
Informed Consent Statement
Data Availability Statement
Conflicts of Interest
References
- Ciaparrone, G.; Sánchez, F.L.; Tabik, S.; Troiano, L.; Tagliaferri, R.; Herrera, F. Deep learning in video multi-object tracking: A survey. Neurocomputing 2020, 381, 61–88. [Google Scholar] [CrossRef] [Green Version]
- Xu, Y.; Osep, A.; Ban, Y.; Horaud, R.; Leal-Taixe, L.; Alameda-Pineda, X. How To Train Your Deep Multi-Object Tracker. In Proceedings of the IEEE/CVF Conference on Computer Vision and Pattern Recognition (CVPR), Seattle, WA, USA, 14–19 June 2020. [Google Scholar]
- Kamal, R.; Chemmanam, A.J.; Jose, B.; Mathews, S.; Varghese, E. Construction Safety Surveillance Using Machine Learning. In Proceedings of the International Symposium on Networks, Computers and Communications (ISNCC), Montreal, QC, Canada, 20–22 October 2020. [Google Scholar]
- Behrendt, K.; Novak, L.; Botros, R. A Deep Learning Approach to Traffic Lights: Detection, Tracking, and Classification. In Proceedings of the IEEE International Conference on Robotics and Automation (ICRA), Singapore, 29 May–3 June 2017. [Google Scholar]
- Ess, A.; Schindler, K.; Leibe, B.; Gool, L.V. Object Detection and Tracking for Autonomous Navigation in Dynamic Environments. Int. J. Robot. Res. 2010, 29, 1707–1725. [Google Scholar] [CrossRef] [Green Version]
- Lo, S.; Yamane, K.; Sugiyama, K. Perception of Pedestrian Avoidance Strategies of a Self-Balancing Mobile Robot. In Proceedings of the IEEE/RSJ International Conference on Intelligent Robots and Systems (IROS), Macau, China, 4–8 November 2019. [Google Scholar]
- Islam, M.; Hong, J.; Sattar, J. Person-following by autonomous robots: A categorical overview. Int. J. Robot. Res. 2019, 38, 1581–1618. [Google Scholar] [CrossRef] [Green Version]
- Wang, Q.; Zhang, L.; Bertinetto, L.; Hu, W.; Torr, P.H. Fast Online Object Tracking and Segmentation: A Unifying Approach. In Proceedings of the IEEE/CVF Conference on Computer Vision and Pattern Recognition (CVPR), Long Beach, CA, USA, 16–20 June 2019. [Google Scholar]
- Liu, Q.; Liu, B.; Wu, Y.; Li, W.; Yu, N. Real-Time Online Multi-Object Tracking in Compressed Domain. IEEE Access 2019, 7, 76489–76499. [Google Scholar] [CrossRef]
- Bewley, A.; Ge, Z.; Ott, L.; Ramos, F.; Upcroft, B. Simple online and realtime tracking. In Proceedings of the IEEE International Conference on Image Processing (ICIP), Phoenix, AZ, USA, 25–28 September 2016. [Google Scholar]
- Wojke, N.; Bewley, A.; Paulus, D. Simple Online and Realtime Tracking with a Deep Association Metric. In Proceedings of the IEEE International Conference on Image Processing (ICIP), Beijing, China, 17–20 September 2017. [Google Scholar]
- Chen, L.; Ai, H.; Zhuang, Z.; Shang, C. Real-Time Multiple People Tracking with Deeply Learned Candidate Selection and Person Re-Identification. In Proceedings of the IEEE International Conference on Multimedia and Expo (ICME), San Diego, CA, USA, 23–27 July 2018. [Google Scholar]
- Pereira, R.; Gonçalves, N.; Garrote, L.; Barros, T.; Lopes, A.; Nunes, U.J. Deep-Learning based Global and Semantic Feature Fusion for Indoor Scene Classification. In Proceedings of the IEEE International Conference on Autonomous Robot Systems and Competitions (ICARSC), Ponta Delgada, Portugal, 15–17 April 2020. [Google Scholar]
- Pereira, R.; Garrote, L.; Barros, T.; Lopes, A.; Nunes, U.J. A Deep Learning-based Indoor Scene Classification Approach Enhanced with Inter-Object Distance Semantic Features. In Proceedings of the IEEE/RSJ International Conference on Intelligent Robots and Systems (IROS), Prague, Czech Republic, 27 September–1 October 2021. [Google Scholar]
- Tan, M.; Le, Q.V. EfficientNet: Rethinking Model Scaling for Convolutional Neural Networks. In Proceedings of the International Conference on Machine Learning, Long Beach, CA, USA, 9–15 June 2019. [Google Scholar]
- Redmon, J.; Farhadi, A. YOLOv3: An Incremental Improvement. arXiv 2018, arXiv:1804.02767. [Google Scholar]
- Zhang, Y.; Wang, C.; Wang, X.; Zenf, W.; Liu, W. A Simple Baseline for Multi-Object Tracking. arXiv 2020, arXiv:2004.01888. [Google Scholar]
- Bertinetto, L.; Valmadre, J.; Henriques, J.F.; Vedaldi, A.; Torr, P.H. Fully-convolutional siamese networks for object tracking. In Proceedings of the European Conference on Computer Vision, Amsterdam, The Netherlands, 11–14 October 2016. [Google Scholar]
- Wu, J.; Cao, J.; Song, L.; Wang, Y.; Yang, M.; Yuan, J. Track to Detect and Segment: An Online Multi-Object Tracker. In Proceedings of the IEEE/CVF Conference on Computer Vision and Pattern Recognition (CVPR), Nashville, TN, USA, 20–25 June 2021. [Google Scholar]
- Bergmann, P.; Meinhardt, T.; Leal-Taixé, L. Tracking without bells and whistles. In Proceedings of the IEEE/CVF Conference on Computer Vision and Pattern Recognition (CVPR), Long Beach, CA, USA, 16–20 June 2019. [Google Scholar]
- Lopes, A.; Rodrigues, J.; Perdigao, J.; Pires, G.; Nunes, U.J. A New Hybrid Motion Planner: Applied in a Brain-Actuated Robotic Wheelchair. IEEE Robot. Autom. Mag. 2016, 23, 82–93. [Google Scholar] [CrossRef]
- Iturrate, I.; Antelis, J.M.; Kubler, A.; Minguez, J. A Noninvasive Brain-Actuated Wheelchair Based on a P300 Neurophysiological Protocol and Automated Navigation. IEEE Trans. Robot. 2009, 25, 614–627. [Google Scholar] [CrossRef] [Green Version]
- Cruz, A.; Pires, G.; Lopes, A.; Carona, C.; Nunes, U.J. A Self-Paced BCI With a Collaborative Controller for Highly Reliable Wheelchair Driving: Experimental Tests with Physically Disabled Individuals. IEEE Trans. Hum. Mach. Syst. 2021, 51, 109–119. [Google Scholar] [CrossRef]
- Lopes, A.; Pires, G.; Nunes, U.J. Assisted navigation for a brain-actuated intelligent wheelchair. Robot. Auton. Syst. 2013, 61, 245–258. [Google Scholar] [CrossRef]
- Sinyukov, D.A.; Padir, T. A Novel Shared Position Control Method for Robot Navigation Via Low Throughput Human-Machine Interfaces. In Proceedings of the IEEE/RSJ International Conference on Intelligent Robots and Systems (IROS), Madrid, Spain, 1–5 October 2018. [Google Scholar]
- Carvalho, G. Kalman Filter-Based Object Tracking Techniques for Indoor Robotic Applications. Master’s Dissertation, University of Coimbra, Coimbra, Portugal, 2021. [Google Scholar]
- Milan, A.; Leal-Taixé, L.; Reid, I.D.; Roth, S.; Schindler, K. MOT16: A benchmark for multi-object tracking. arXiv 2016, arXiv:1603.00831. [Google Scholar]
- Pereira, R.; Garrote, L.; Barros, T.; Lopes, A.; Nunes, U.J. An Experimental Study of the Accuracy vs Inference Speed of RGB-D Object Recognition. In Proceedings of the IEEE International Conference on Robot and Human Interactive Communication (RO-MAN), Naples, Italy, 31 August–4 September 2020. [Google Scholar]
- Fiaz, M.; Mahmood, A.; Javed, S.; Jung, S.K. Handcrafted and Deep Trackers: Recent Visual Object Tracking Approaches and Trends. ACM Comput. Surv. 2019, 52, 1–44. [Google Scholar] [CrossRef]
- Zhang, X.; Wang, X.; Gu, C. Online multi-object tracking with pedestrian re-identification and occlusion processing. Vis. Comput. 2021, 37, 1089–1099. [Google Scholar] [CrossRef]
- Guo, Q.; Feng, W.; Zhou, C.; Huang, R.; Wan, L.; Wang, S. Learning Dynamic Siamese Network for Visual Object Tracking. In Proceedings of the IEEE International Conference on Computer Vision (ICCV), Venice, Italy, 22–29 October 2017. [Google Scholar]
- Reid, D. An algorithm for tracking multiple targets. IEEE Trans. Autom. Control. 1979, 24, 843–854. [Google Scholar] [CrossRef]
- He, J.; Huang, Z.; Wang, N.; Zhang, Z. Learnable Graph Matching: Incorporating Graph Partitioning with Deep Feature Learning for Multiple Object Tracking. In Proceedings of the IEEE/CVF Conference on Computer Vision and Pattern Recognition (CVPR), Nashville, TN, USA, 20–25 June 2021. [Google Scholar]
- Kuhn, H.W. The Hungarian method for the assignment problem. Nav. Res. Logist. Q. 1955, 2, 83–97. [Google Scholar] [CrossRef] [Green Version]
- Lee, S.; Kim, E. Multiple Object Tracking via Feature Pyramid Siamese Networks. IEEE Access 2019, 7, 8181–8194. [Google Scholar] [CrossRef]
- Lin, T.; Dollár, P.; Girshick, R.B.; He, K.; Hariharan, B.; Belongie, S. Feature Pyramid Networks for Object Detection. In Proceedings of the IEEE/CVF Conference on Computer Vision and Pattern Recognition (CVPR), Honolulu, HI, USA, 21–26 July 2017. [Google Scholar]
- Jin, J.; Li, X.; Li, X.; Guan, S. Online Multi-object Tracking with Siamese Network and Optical Flow. In Proceedings of the IEEE 5th International Conference on Image, Vision and Computing (ICIVC), Beijing, China, 10–12 July 2020. [Google Scholar]
- Lucas, B.; Kanade, T. An Iterative Image Registration Technique with an Application to Stereo Vision. In Proceedings of the 7th International Joint Conference on Artificial Intelligence (IJCAI), Vancouver, BC, Canada, 24–28 August 1981. [Google Scholar]
- Xiao, H.; Li, Z.; Yang, C.; Yuan, W.; Wang, L. RGB-D Sensor-based Visual Target Detection and Tracking for an Intelligent Wheelchair Robot in Indoors Environments. Int. J. Control Autom. Syst. 2015, 13, 521–529. [Google Scholar] [CrossRef]
- Lecrosnier, L.; Khemmar, R.; Ragot, N.; Decoux, B.; Rossi, R.; Kefi, N.; Ertaud, J.Y. Deep Learning-Based Object Detection, Localisation and Tracking for Smart Wheelchair Healthcare Mobility. Int. J. Environ. Res. Public Health 2021, 18, 91. [Google Scholar] [CrossRef] [PubMed]
- Zheng, L.; Bie, Z.; Sun, Y.; Wang, J.; Su, C.; Wang, S.; Tian, Q. MARS: A Video Benchmark for Large-Scale Person Re-identification. In Proceedings of the European Conference on Computer Vision (ECCV), Amsterdam, The Netherlands, 11–14 October 2016. [Google Scholar]
- Wojke, N.; Bewley, A. Deep Cosine Metric Learning for Person Re-identification. In Proceedings of the IEEE Winter Conference on Applications of Computer Vision (WACV), Lake Tahoe, NV, USA, 12–15 March 2018. [Google Scholar]
- Cruz, R.; Garrote, L.; Lopes, A.; Nunes, U.J. Modular software architecture for human-robot interaction applied to the InterBot mobile robot. In Proceedings of the IEEE International Conference on Autonomous Robot Systems and Competitions (ICARSC), Torres Vedras, Portugal, 25–27 April 2018. [Google Scholar]


| Method | Year | DL | KF | Description |
|---|---|---|---|---|
| SORT [10] | 2016 | × | Simple and fast KF-based algorithm that associates objects based on their bounding box appearance. | |
| Deep-SORT [11] | 2017 | × | × | KF-based algorithm, associates objects based on their appearance description extracted by a CNN re-identification network. |
| MOTDT [12] | 2018 | × | × | Deep-SORT related algorithm that uses predicted bounding boxes as candidates for association, in an attempt to solve the occlusion problem. |
| GMT-CT [33] | 2021 | × | × | Deep-SORT related algorithm that solves association problems using graph partitioning based on appearance features. |
| DROP [30] | 2020 | × | × | Associates objects using a confidence-based cost to construct the Hungarian algorithm solver. Furthermore, it uses appearance features to determine occlusions in the environment. |
| FPSN-MOT [35] | 2019 | × | It uses Siamese and Feature Pyramid-based Networks addressing appearance and motion features in the association stage. | |
| Jiating Jin et al. [37] | 2020 | × | × | Deep-SORT related algorithm that uses Siamese network to process association tasks and also introduce optical flow information to the motion model, in order to improve accuracy. |
| Weights | Evaluation Metrics | ||||||||||
|---|---|---|---|---|---|---|---|---|---|---|---|
| %MOTA↑ | %MOTP↑ | TP↑ | FP↓ | FN↓ | IDs↓ | %MT↑ | %ML↓ | FM↓ | |||
| 44.93 | 87.84 | 56,677 | 6223 | 54,772 | 848 | 12.3 | 33.0 | 946 | |||
| 44.99 | 87.84 | 56,713 | 6196 | 54,757 | 827 | 12.3 | 33.3 | 932 | |||
| 44.85 | 87.76 | 56,688 | 6323 | 54,776 | 833 | 13.0 | 32.8 | 953 | |||
| 44.64 | 87.71 | 56,613 | 6479 | 54,832 | 852 | 12.8 | 33.0 | 948 | |||
| 44.58 | 87.70 | 56,558 | 6492 | 54,858 | 881 | 12.8 | 33.0 | 967 | |||
| 44.75 | 87.75 | 56,627 | 6379 | 54,793 | 877 | 12.6 | 33.3 | 961 | |||
| 45.25 | 87.90 | 56,803 | 5984 | 54,695 | 799 | 12.1 | 33.0 | 912 | |||
| 45.25 | 87.92 | 56,801 | 5990 | 54,705 | 791 | 12.1 | 33.0 | 907 | |||
| 45.53 | 88.09 | 56,552 | 5426 | 54,996 | 749 | 12.6 | 33.5 | 853 | |||
| Cost Matrix | Evaluation Metrics | |||||||||
|---|---|---|---|---|---|---|---|---|---|---|
| % MOTA↑ | % MOTP↑ | TP↑ | FP↓ | FN↓ | IDs↓ | % MT↑ | % ML↓ | FM↓ | FPS↑ | |
| SORT | ||||||||||
| 45.56 | 88.19 | 56,298 | 5136 | 55,281 | 718 | 11.5 | 35.3 | 798 | 516 | |
| 41.24 | 86.99 | 54,292 | 7977 | 56,271 | 1734 | 7.9 | 33.7 | 1915 | 500 | |
| R | 14.15 | 83.06 | 37,236 | 21,351 | 70,281 | 4780 | 4.9 | 37.5 | 4730 | 510 |
| 45.55 | 88.20 | 56,275 | 5126 | 55,305 | 717 | 11.5 | 35.3 | 799 | 486 | |
| 45.55 | 88.21 | 56,263 | 5111 | 55,324 | 710 | 11.5 | 35.5 | 797 | 499 | |
| 44.40 | 87.79 | 56,329 | 6470 | 55,028 | 940 | 11.7 | 32.4 | 1090 | 480 | |
| M | 45.54 | 88.21 | 56,245 | 5107 | 55,344 | 708 | 11.5 | 35.7 | 797 | 469 |
| A | 44.72 | 87.72 | 56,636 | 6417 | 54,811 | 850 | 13.0 | 33.0 | 958 | 472 |
| 45.53 | 88.09 | 56,552 | 5426 | 54,996 | 749 | 12.6 | 33.5 | 853 | 473 | |
| Deep-SORT | ||||||||||
| 45.53 | 88.26 | 55,641 | 4510 | 56,187 | 469 | 13.0 | 35.7 | 666 | 57 | |
| 45.49 | 88.13 | 55,768 | 4689 | 55,988 | 541 | 13.6 | 34.6 | 736 | 57 | |
| R | 42.20 | 87.76 | 53,722 | 6334 | 57,604 | 971 | 9.7 | 37.2 | 1126 | 57 |
| 45.49 | 88.12 | 55,781 | 4702 | 55,995 | 521 | 13.9 | 34.2 | 724 | 57 | |
| 44.35 | 88.06 | 55,106 | 5300 | 56,532 | 659 | 12.6 | 35.3 | 845 | 57 | |
| 44.83 | 87.99 | 55,383 | 5038 | 56,278 | 636 | 12.3 | 34.4 | 821 | 57 | |
| M | 44.87 | 87.97 | 55,408 | 5019 | 56,263 | 626 | 12.6 | 34.4 | 814 | 57 |
| A | 45.49 | 88.15 | 55,788 | 4701 | 56,001 | 508 | 13.9 | 34.6 | 712 | 57 |
| 45.67 | 88.23 | 55,834 | 4547 | 55,991 | 472 | 13.9 | 34.8 | 667 | 57 | |
| Cost Matrix | Evaluation Metrics | |||||||||
|---|---|---|---|---|---|---|---|---|---|---|
| % MOTA↑ | % MOTP↑ | TP↑ | FP↓ | FN↓ | IDs↓ | % MT↑ | % ML↓ | FM↓ | FPS↑ | |
| SORT | ||||||||||
| 90.57 | 92.21 | 29,589 | 31 | 2932 | 114 | 60.5 | 1.5 | 556 | 1368 | |
| 88.85 | 91.48 | 29,307 | 310 | 3031 | 297 | 59.0 | 0.9 | 618 | 1389 | |
| R | 68.23 | 88.45 | 25,015 | 2748 | 5550 | 2070 | 30.7 | 3.6 | 1179 | 1380 |
| 90.44 | 92.27 | 29,538 | 22 | 2974 | 123 | 59.0 | 1.5 | 561 | 1317 | |
| 90.34 | 92.30 | 29,491 | 9 | 3008 | 136 | 58.7 | 1.8 | 566 | 1377 | |
| 90.77 | 92.00 | 29,713 | 91 | 2827 | 95 | 65.0 | 0.9 | 562 | 1368 | |
| M | 90.21 | 92.35 | 29,445 | 5 | 3053 | 137 | 57.4 | 1.8 | 564 | 1311 |
| A | 90.87 | 91.96 | 29,756 | 101 | 2799 | 80 | 67.5 | 1.2 | 558 | 1288 |
| 90.90 | 92.10 | 29,715 | 50 | 2832 | 88 | 64.4 | 1.2 | 558 | 1298 | |
| SORT with Class Gate Metric | ||||||||||
| 90.63 | 92.20 | 29,611 | 33 | 2926 | 98 | 61.7 | 1.5 | 550 | 1404 | |
| 90.82 | 92.00 | 29,739 | 100 | 2830 | 66 | 66.9 | 1.2 | 566 | 1408 | |
| R | 87.74 | 91.56 | 29,134 | 500 | 3216 | 285 | 63.2 | 1.2 | 642 | 1425 |
| 90.49 | 92.27 | 29,553 | 22 | 2969 | 113 | 59.6 | 1.5 | 556 | 1337 | |
| 90.36 | 92.32 | 29,497 | 8 | 3015 | 123 | 59.3 | 1.8 | 559 | 1392 | |
| 90.98 | 92.05 | 29,767 | 77 | 2813 | 55 | 68.1 | 0.9 | 555 | 1375 | |
| M | 90.24 | 92.36 | 29,456 | 5 | 3050 | 129 | 58.1 | 1.8 | 559 | 1307 |
| A | 91.02 | 92.02 | 29,785 | 81 | 2799 | 51 | 69.3 | 1.2 | 554 | 1292 |
| 90.93 | 92.10 | 29,727 | 53 | 2837 | 71 | 65.3 | 1.2 | 552 | 1305 | |
| Deep-SORT with Class Gate Metric | ||||||||||
| 90.80 | 89.66 | 30,989 | 1357 | 1447 | 199 | 72.3 | 0.3 | 142 | 163 | |
| 91.09 | 89.53 | 31,100 | 1372 | 1367 | 168 | 76.3 | 0.3 | 131 | 167 | |
| R | 89.12 | 90.27 | 30,467 | 1384 | 1783 | 385 | 62.3 | 0.3 | 292 | 166 |
| 91.15 | 89.52 | 31,124 | 1376 | 1350 | 161 | 78.4 | 0.3 | 130 | 165 | |
| 90.90 | 89.86 | 30,994 | 1328 | 1401 | 240 | 75.7 | 0.3 | 160 | 166 | |
| 91.07 | 89.54 | 31,087 | 1367 | 1381 | 167 | 76.3 | 0.6 | 134 | 169 | |
| M | 91.15 | 89.55 | 31,116 | 1370 | 1354 | 165 | 77.8 | 0.6 | 125 | 163 |
| A | 91.23 | 89.55 | 31,123 | 1350 | 1350 | 162 | 78.7 | 0.3 | 126 | 168 |
| 91.09 | 89.56 | 31,103 | 1376 | 1363 | 169 | 76.6 | 0.3 | 119 | 166 | |
| Gap | Tracking Method | Evaluation Metrics | |||||||||
|---|---|---|---|---|---|---|---|---|---|---|---|
| % MOTA↑ | % MOTP↑ | TP↑ | FP↓ | FN↓ | IDs↓ | % MT↑ | % ML↓ | FM↓ | FPS↑ | ||
| 1 | SORT | 84.92 | 88.89 | 13,514 | 47 | 2247 | 97 | 48.3 | 9.2 | 178 | 1444 |
| SORT | 86.43 | 88.20 | 13,819 | 113 | 2012 | 27 | 58.2 | 8.3 | 160 | 1375 | |
| SORT | 86.11 | 88.43 | 13,732 | 77 | 2073 | 53 | 53.2 | 8.9 | 154 | 1426 | |
| Deep-SORT | 81.28 | 86.02 | 13,893 | 1003 | 1761 | 204 | 48.9 | 5.8 | 128 | 155 | |
| Deep-SORT | 82.02 | 85.56 | 14,077 | 1070 | 1590 | 191 | 55.7 | 4.0 | 111 | 158 | |
| Deep-SORT | 82.49 | 85.61 | 14,109 | 1027 | 1587 | 162 | 57.2 | 4.6 | 103 | 158 | |
| 2 | SORT | 79.73 | 87.75 | 8718 | 53 | 2022 | 128 | 35.8 | 12.3 | 151 | 1407 |
| SORT | 83.37 | 86.09 | 9239 | 178 | 1593 | 36 | 49.4 | 8.6 | 130 | 1413 | |
| SORT | 83.08 | 86.61 | 9117 | 88 | 1674 | 77 | 43.5 | 9.0 | 127 | 1480 | |
| Deep-SORT | 75.28 | 84.16 | 8975 | 794 | 1697 | 196 | 38.0 | 8.3 | 126 | 152 | |
| Deep-SORT | 78.65 | 82.86 | 9414 | 866 | 1317 | 137 | 51.2 | 4.0 | 89 | 153 | |
| Deep-SORT | 79.41 | 82.98 | 9470 | 840 | 1279 | 119 | 51.9 | 4.9 | 83 | 153 | |
| 3 | SORT | 75.50 | 87.23 | 6406 | 38 | 1897 | 131 | 23.4 | 13.1 | 84 | 1272 |
| SORT | 81.02 | 84.52 | 7094 | 261 | 1292 | 48 | 39.9 | 6.2 | 43 | 1338 | |
| SORT | 81.28 | 85.44 | 6941 | 86 | 1414 | 79 | 33.0 | 8.4 | 39 | 1355 | |
| Deep-SORT | 69.24 | 83.37 | 6528 | 688 | 1722 | 184 | 31.5 | 10.0 | 107 | 138 | |
| Deep-SORT | 73.88 | 82.33 | 6947 | 716 | 1295 | 192 | 34.0 | 4.0 | 104 | 145 | |
| Deep-SORT | 75.71 | 80.90 | 7185 | 800 | 1192 | 57 | 52.0 | 3.4 | 53 | 148 | |
| YOLO | Tracking Method | Evaluation Metrics | |||||||||
|---|---|---|---|---|---|---|---|---|---|---|---|
| % MOTA↑ | % MOTP↑ | TP↑ | FP↓ | FN↓ | IDs↓ | % MT↑ | % ML↓ | FM↓ | FPS↑ | ||
| SORT | 23.30 | 78.65 | 13,345 | 9665 | 1373 | 1078 | 42.6 | 6.6 | 167 | 47 | |
| SORT | 22.39 | 78.61 | 13,384 | 9847 | 1350 | 1062 | 44.6 | 6.6 | 168 | 48 | |
| SORT | 22.66 | 78.61 | 13,358 | 9778 | 1348 | 1090 | 44.6 | 6.6 | 166 | 49 | |
| Deep-SORT | −2.27 | 78.12 | 13,029 | 13,387 | 1338 | 1429 | 39.1 | 7.0 | 157 | 27 | |
| Deep-SORT | −10.16 | 78.08 | 13,090 | 14,695 | 1236 | 1470 | 40.3 | 7.4 | 109 | 28 | |
| Deep-SORT | −10.66 | 78.20 | 13,100 | 14,784 | 1218 | 1478 | 43.0 | 7.0 | 114 | 28 | |
| SORT | 41.93 | 81.03 | 14,191 | 7567 | 926 | 679 | 58.9 | 3.9 | 123 | 49 | |
| SORT | 41.59 | 80.99 | 14,222 | 7652 | 895 | 679 | 58.5 | 3.9 | 114 | 49 | |
| SORT | 41.54 | 81.00 | 14,203 | 7642 | 906 | 687 | 58.9 | 3.9 | 120 | 49 | |
| Deep-SORT | 21.50 | 81.14 | 13,942 | 10,546 | 991 | 863 | 55.8 | 4.3 | 124 | 28 | |
| Deep-SORT | 14.90 | 81.04 | 14,043 | 11,689 | 899 | 854 | 55.8 | 4.7 | 81 | 28 | |
| Deep-SORT | 15.65 | 81.20 | 14,032 | 11,560 | 917 | 847 | 56.6 | 4.3 | 87 | 28 | |
| SORT | 65.43 | 81.64 | 14,623 | 4288 | 858 | 315 | 66.7 | 5.4 | 64 | 50 | |
| SORT | 65.21 | 81.64 | 14,633 | 4333 | 833 | 330 | 66.7 | 5.4 | 71 | 50 | |
| SORT | 65.40 | 81.64 | 14,644 | 4313 | 835 | 317 | 66.3 | 5.4 | 63 | 50 | |
| Deep-SORT | 53.75 | 80.33 | 14,406 | 5916 | 975 | 415 | 61.2 | 5.8 | 101 | 30 | |
| Deep-SORT | 49.28 | 80.32 | 14,430 | 6646 | 897 | 469 | 60.5 | 6.2 | 83 | 30 | |
| Deep-SORT | 50.01 | 80.44 | 14,450 | 6551 | 890 | 456 | 62.4 | 6.2 | 75 | 30 | |
| SORT | 73.86 | 83.41 | 14,446 | 2779 | 1141 | 209 | 64.7 | 5.0 | 84 | 51 | |
| SORT | 73.75 | 83.39 | 14,455 | 2806 | 1132 | 209 | 65.9 | 4.7 | 86 | 51 | |
| SORT | 73.83 | 83.42 | 14,456 | 2794 | 1132 | 208 | 65.1 | 5.0 | 80 | 51 | |
| Deep-SORT | 65.86 | 81.64 | 14,287 | 3884 | 1205 | 304 | 60.5 | 5.8 | 104 | 31 | |
| Deep-SORT | 64.32 | 81.62 | 14,392 | 4232 | 1133 | 271 | 64.3 | 5.8 | 90 | 31 | |
| Deep-SORT | 64.69 | 81.61 | 14,404 | 4186 | 1133 | 259 | 65.5 | 5.4 | 90 | 31 | |
| YOLO | Tracking Method | Evaluation Metrics | |||||||||
|---|---|---|---|---|---|---|---|---|---|---|---|
| % MOTA↑ | % MOTP↑ | TP↑ | FP↓ | FN↓ | IDs↓ | % MT↑ | % ML↓ | FM↓ | FPS↑ | ||
| SORT | 24.86 | 78.88 | 12,485 | 8798 | 1288 | 1056 | 38.3 | 2.3 | 156 | 50 | |
| SORT | 23.68 | 78.82 | 12,497 | 8986 | 1255 | 1077 | 40.0 | 2.3 | 163 | 49 | |
| SORT | 24.30 | 78.82 | 12,495 | 8891 | 1253 | 1081 | 39.4 | 2.3 | 153 | 49 | |
| Deep-SORT | −0.45 | 78.33 | 12,266 | 12,332 | 1178 | 1385 | 33.1 | 2.9 | 173 | 28 | |
| Deep-SORT | −8.75 | 78.31 | 12,334 | 13,631 | 1093 | 1402 | 38.9 | 2.3 | 125 | 28 | |
| Deep-SORT | −8.15 | 78.38 | 12,364 | 13,573 | 1060 | 1405 | 41.1 | 2.3 | 122 | 28 | |
| SORT | 43.49 | 81.20 | 13,242 | 6793 | 1001 | 586 | 53.1 | 2.9 | 108 | 50 | |
| SORT | 43.16 | 81.19 | 13,250 | 6850 | 986 | 593 | 54.3 | 2.9 | 102 | 50 | |
| SORT | 43.30 | 81.19 | 13,252 | 6831 | 980 | 597 | 54.9 | 2.9 | 104 | 50 | |
| Deep-SORT | 23.61 | 81.36 | 13,041 | 9540 | 976 | 812 | 49.7 | 2.9 | 124 | 28 | |
| Deep-SORT | 16.07 | 81.32 | 13,147 | 10,764 | 870 | 812 | 56.6 | 2.9 | 93 | 29 | |
| Deep-SORT | 15.49 | 81.40 | 13,099 | 10,802 | 896 | 834 | 56.0 | 2.9 | 95 | 29 | |
| SORT | 65.25 | 81.34 | 13,637 | 3961 | 912 | 280 | 64.0 | 2.3 | 72 | 51 | |
| SORT | 65.03 | 81.32 | 13,653 | 4009 | 887 | 289 | 63.4 | 2.3 | 76 | 51 | |
| SORT | 65.20 | 81.33 | 13,652 | 3983 | 896 | 281 | 64.0 | 2.3 | 71 | 51 | |
| Deep-SORT | 53.11 | 80.02 | 13,525 | 5649 | 932 | 372 | 58.9 | 1.1 | 124 | 30 | |
| Deep-SORT | 49.77 | 80.01 | 13,628 | 6248 | 815 | 386 | 64.0 | 1.1 | 99 | 30 | |
| Deep-SORT | 49.91 | 80.06 | 13,605 | 6204 | 825 | 399 | 66.3 | 1.1 | 109 | 30 | |
| SORT | 75.28 | 83.54 | 13,570 | 2406 | 1068 | 191 | 56.6 | 3.4 | 70 | 52 | |
| SORT | 75.30 | 83.54 | 13,584 | 2418 | 1058 | 187 | 57.1 | 2.9 | 69 | 51 | |
| SORT | 75.34 | 83.54 | 13,585 | 2413 | 1057 | 187 | 57.1 | 3.4 | 68 | 51 | |
| Deep-SORT | 68.70 | 81.62 | 13,543 | 3355 | 1024 | 262 | 58.3 | 1.7 | 107 | 31 | |
| Deep-SORT | 66.95 | 81.56 | 13,629 | 3701 | 950 | 250 | 66.9 | 2.3 | 93 | 31 | |
| Deep-SORT | 66.82 | 81.58 | 13,629 | 3721 | 948 | 252 | 67.4 | 1.1 | 95 | 31 | |
Publisher’s Note: MDPI stays neutral with regard to jurisdictional claims in published maps and institutional affiliations. |
© 2022 by the authors. Licensee MDPI, Basel, Switzerland. This article is an open access article distributed under the terms and conditions of the Creative Commons Attribution (CC BY) license (https://creativecommons.org/licenses/by/4.0/).
Share and Cite
Pereira, R.; Carvalho, G.; Garrote, L.; Nunes, U.J. Sort and Deep-SORT Based Multi-Object Tracking for Mobile Robotics: Evaluation with New Data Association Metrics. Appl. Sci. 2022, 12, 1319. https://doi.org/10.3390/app12031319
Pereira R, Carvalho G, Garrote L, Nunes UJ. Sort and Deep-SORT Based Multi-Object Tracking for Mobile Robotics: Evaluation with New Data Association Metrics. Applied Sciences. 2022; 12(3):1319. https://doi.org/10.3390/app12031319
Chicago/Turabian StylePereira, Ricardo, Guilherme Carvalho, Luís Garrote, and Urbano J. Nunes. 2022. "Sort and Deep-SORT Based Multi-Object Tracking for Mobile Robotics: Evaluation with New Data Association Metrics" Applied Sciences 12, no. 3: 1319. https://doi.org/10.3390/app12031319
APA StylePereira, R., Carvalho, G., Garrote, L., & Nunes, U. J. (2022). Sort and Deep-SORT Based Multi-Object Tracking for Mobile Robotics: Evaluation with New Data Association Metrics. Applied Sciences, 12(3), 1319. https://doi.org/10.3390/app12031319