Article

Intact, Commercial Lithium-Polymer Batteries: Spatially Resolved Grating-Based Interferometry Imaging, Bragg Edge Imaging, and Neutron Diffraction

1
Department of Chemistry, Louisiana State University, Baton Rouge, LA 70803, USA
2
National Institute of Standards and Technology, 100 Bureau Dr., Mail Stop 8461, Gaithersburg, MD 20899-8461, USA
3
Center for Advanced Microstructures and Devices, Louisiana State University, Baton Rouge, LA 70806, USA
4
Helmholtz-Zentrum Berlin fur Materialien und Energie, 14109 Berlin, Germany
*
Author to whom correspondence should be addressed.
Appl. Sci. 2022, 12(3), 1281; https://doi.org/10.3390/app12031281
Submission received: 16 December 2021 / Revised: 15 January 2022 / Accepted: 19 January 2022 / Published: 25 January 2022
(This article belongs to the Special Issue Neutron Dark-Field Imaging and Grating Interferometry)

Abstract

:
We survey several neutron imaging and diffraction methods for non-destructive testing and evaluation of intact, commercial lithium-ion batteries. Specifically, far-field interferometry was explored as an option to probe a wide range of autocorrelation lengths within the batteries via neutron imaging. The dark-field interferometry images change remarkably from fresh to worn batteries, and from charged to discharged batteries. When attempting to search for visual evidence of battery degradation, neutron Talbot-Lau grating interferometry exposed battery layering and particle scattering through dark-field imaging. Bragg edge imaging also reveals battery wear and state of charge. Neutron diffraction observed chemical changes between fresh and worn, charged and discharged batteries. However, the utility of these methods, for commercial batteries, is dependent upon battery size and shape, with 19 to 43 mAh prismatic batteries proving most convenient for these experimental methods. This study reports some of the first spatially resolved, small angle scattering (dark-field) images showing battery degradation.

1. Introduction

Understanding commercial lithium battery functionality and performance is key towards advancing energy storage options for the future. When observing small (nanometer to micrometer sized) particles, determining the role of lithium in a battery’s cell can lead to optimized battery construction. Challenges of battery manufacturing and characterization include short-circuiting from lithium dendrites, crack formation, particle fracture, and a loss of contact from volume expansion during lithium intercalation/de-intercalation [1,2,3]. While many X-ray diffraction, bulk neutron diffraction, and nuclear magnetic resonance (NMR) studies have provided many valuable insights [4], there is still need for additional methods that can provide insight into in-situ, cell-level degradation of a commercial battery. Recent work has explored this need by describing the challenges and benefits of many neutron and X-ray techniques for the use of battery characterization [5]. In order to non-destructively observe battery degradation, there is a pressing need for exploration of new non-destructive testing (NDT) techniques geared towards battery characterization and visualization.
In search of these NDT methods, recent publications have provided valuable insight into the offerings of both X-ray and neutron techniques [5,6]. Specifically, neutron diffraction has proven valuable and often used [7,8]. Liang et al. performed neutron powder diffraction experiments on single layer, prismatic, cylindrical, and confined batteries highlighting neutron diffraction for phase and crystal structure evolution [9]. Other in-situ and in-operando neutron diffraction experiments of non-commercial batteries show formation of several intermediate components during the charging and discharging processes [10,11,12,13,14,15,16,17]. Bobrikov et al. used time-of-flight neutron diffraction to study a commercial 18,650-type battery with nominal capacity of 3100 mAh over 0.10 nm to 0.35 nm d-spacing, probing an extremely wide and useful diffraction range [18]. Other battery diffraction experiments observed a substitution of Mn for Mg in LiMgSiO 4 cathode components and spatial observation of Fe/NaCl and cylindrical Li-ion 18,650 cells [19,20,21]. While neutron diffraction is a useful tool for battery characterization, it is not usually performed to reveal spatial information of where battery failure can occur. Line profiles across a large, 15 Ah, battery were performed by Cai et al. revealing inhomogenous degradation near the battery edges.
Bragg edge imaging is another method to visualize and characterize the crystallographic changes within a battery [22,23,24]. Using a monochromator, a series of images are collected at differing wavelengths (either X-rays or neutrons) to observe phase changes in the material. If there is a phase change, the transmission signal increases greatly once a crystallographic plane is no longer probed. This is based upon Bragg’s law, λ = 2 d h k l s i n θ , where neutrons with DeBroglie wavelength, λ , are scattered coherently at angles of 2 θ (where θ is the Bragg angle) relative to the incident neutron direction from lattice planes at certain plane spacings, d h k l . In the case of neutron Bragg edge imaging of lithium batteries, transmission images and spectra showed the appearance and disappearance of peaks as a battery is converted from discharged to fully charged [22].
In comparison to diffraction and Bragg edge imaging, X-ray and neutron imaging have gained recent traction despite the challenges of in-situ imaging an intact, commercially-produced Li-ion battery. The main challenges of X-ray imaging batteries include the extraction of relevant information from large datasets and designing cells to fit in X-ray system setups, however X-ray systems tend to have higher resolution than neutron imaging setups [5]. On the other hand, neutrons are less intrusive than X-rays and have isotopes, which can be quite important for differentiating between Li6 and Li7 [5]. Previous in operando neutron attenuation imaging of a lithium pouch cell showed the possibility of time-resolved tomography as a battery undergoes charging/discharging [25]. Campillo-Robles et al. provided the first neutron radiography images of lead-acid batteries sharing the challenges behind observing changes in eletrolytic concentrations due to a lack of sufficient contrast [26]. Several significant works have used neutron imaging to observe lithium concentrations and mobilities [27,28], lithium hydride and hydrolysis products [29], and lithium transport in battery fuel cells with sintered electrodes [30]. In the case of X-ray imaging, porosity within cylindrical cells has been observed and characterized using imaging and scanning electron microscopy (SEM) [31]. The combination of X-ray and neutron tomography during the discharge of two similar batteries enabled study of lithium diffusion as well as high resolution assessment of mechanical degradation [32].
Despite the success of traditional X-ray and neutron imaging, there is a need for newer, alternative battery imaging methods. Grating-based interferometry imaging provides a new alternative imaging method with the production of three datasets: absorption/attenuation, differential phase contrast, and dark-field [33]. At periodic distances downstream from the gratings, moiré fringes are generated from single-shot interferometry or stepping of the gratings [34]. When a sample is inserted into the beam path, alterations to the neutron or X-ray wavefront can reveal information regarding composition, phase, and size. In the case of lithium-ion battery imaging, the combination of neutron grating-based interferometry with new optical techniques can show the benefits of neutrons for different battery components. Herein, we discuss our experiences with traditional neutron battery imaging, speculate upon the future of grating-based interferometry imaging, and explore the combination of unique NDT techniques like neutron diffraction with Bragg edge imaging. In this study, we show some of the first spatially resolved scattering (dark-field) images of batteries.

2. Materials and Methods

The following sections describes Li-ion and Li-po battery characteristics, experimental setups, and results obtained from a series of diffraction and imaging experiments. After describing the commercial Li-po batteries, a series of neutron diffraction, neutron Talbot-Lau interferometry, neutron Bragg edge imaging, and neutron far-field interferometer imaging experiments are presented.

2.1. Batteries

One Li-ion (360 mAh) and four sets of Li-po batteries of varying capacity and thickness were commercially purchased (https://www.powerstream.com/thin-lithium-ion.htm, accessed on 5 December 2021) for use in the following experiments: PGEB 0054018 (15 mAh, 0.5 mm × 40 mm × 18 mm), GMB 201030 (43 mAh, 2 mm × 10 mm × 30 mm), PGEB 0054338 (50 mAh, 0.5 mm × 43 mm × 38 mm), and GMB 161652 (90 mAh, 1.6 mm × 16 mm × 52 mm). Li-po batteries were specifically purchased due to a polymer electrolyte rather than a liquid electrolyte. Certain trade names and company products are mentioned in the text or identified in an illustration in order to adequately specify the experimental procedure and equipment used. In no case does such identification imply recommendation or endorsement by the National Institute of Standards and Technology, nor does it imply that the products are necessarily the best available for the purpose. Limited information is available for the chemical composition or material properties of the commercial batteries purchased for this study. For the nominal 43 mAh batteries, one fresh (1 charge/discharge cycle), one slightly worn (125 cycles), and one worn (1790 cycles) battery were afixed to a sample stage and connected in situ to an 8 channel battery analyzer ranging in current from (6–3000 mA) and charged to 4.2 V. (http://www.mtixtl.com/8ChannelsBatteryAnalyzer-BST8-3.aspx, accessed on 5 December 2021). After 20 min of rest, imaging was performed for the charged batteries. Upon completion of charged imaging, the batteries were then discharged to 2.7 V at a rate of 0.93 C (40 mA/h for a 43 mAh battery) and allowed to rest for 20 min. After the first discharged imaging was performed, a second set of discharged images was obtained two hours later to observe any differences in battery quality. A similar charge/discharge cycling was used for the 300 mAh battery used for the neutron diffraction study.

2.2. Imaging Background

Traditional X-ray and neutron imaging produce absorption/attenuation images. The addition of grating-based interferometry to an imaging setup produces three image sets: absorption/attenuation, differential phase contrast (DPC), and dark-field (synonymous with small-angle scattering).
The intensity of the camera recorded fringe pattern, I, can be fitted with a cosine function [35] or its linear expansion [36]:
I ( x g ) = A + B cos 2 π x g p g + ϕ
I ( x g ) = A + sin 2 π x g p g B c o s   cos ϕ + cos 2 π x g p g B s i n   sin ϕ
with   B = B c o s 2 + B s i n 2
where ϕ is the phase of the beam, x g is the stepping motion of the grating, and p g is the period of the phase grating. The offset, A, and amplitude, B, of Equation (1) are used to define the fringe visibility as visibility = B / A . The image modality called dark-field (DF) is the ratio of fringe visibility with the sample in the beam versus out of the beam:
dark - field = visibility s a m p l e visibility r e f e r e n c e = B s a m p l e / A s a m p l e B r e f e r e n c e / A r e f e r e n c e
In the dilute, non-interacting sphere model, the autocorrelation length, ξ , can be thought of as the diameter of the particle size causing scattering in the DF images. In the case of the Helmholtz-Zentrum Berlin (HZB) Talbot-Lau interferometer, the autocorrelation length is set at a fixed autocorrelation length whereas the far-field interferometer is able to probe a wide range of autocorrelation lengths. The autocorrelation length for the HZB Talbot-Lau interferometer was 1.97 μ m for the sample upstream of the G1 grating and is computed by:
ξ ( z ) = λ z p g
z = ( L 1 + L 2 z ) L 2 L 1
where the source to G1 distance, L 1 = 4.5 m, the G2 to detector distance, L 2 = 22.7 mm, the period of the phase grating, p g = 4.0 μ m, the wavelength, λ = 0.35 nm, and the sample to detector distance, z = 66 mm.
The autocorrelation length for the NIST far-field interferometer ranged from 0.60 μ m to 1.99 μ m and is computed by:
ξ ( z ) = λ z D ( L 1 + D + L 2 ) p g
where the distances are defined in Figure 1 and have values of L 1 = 2.3 m, L 2 = 2.3 m, D = 26 mm, p g 1 = p g 2 = p g = 2.4 μ m, λ = 0.54 nm, and z ranged from 0.477 m to 1.537 m.

2.3. Neutron Far-Field Interferometry Imaging at NIST

In the first application of neutron far-field interferometry to batteries, neutron grating-based interferometry imaging was done at the NG6 cold neutron imaging beamline using the same set of Li-po batteries (NCNR NIST, Gaithersburg) [35]. Batteries were charged, imaged, discharged, and imaged as described in Section 2.1.
The phase gratings, G1 and G2, were fabricated at the NIST Center for Nanoscale Science and Technology on 0.5 mm thick, 10 cm diameter Si wafers. The linear features of the phase gratings (a rectangular cross-section with a duty cycle 50%) were fabricated with a period of 2.4 μ m, corresponding to a neutron phase shift of π / 2 at a wavelength of 0.54 nm. The intergrating distance, (D), between the G2 and G1 gratings was varied between 7 mm and 35 mm with a linear translation stage. The G2-to-detector distance ( L 2 ) was 4.355 m as was the sum of the slit-to-G1 distance ( L 1 ) and intergrating distance (D), hence the interferometer was in a symmetric geometry (Figure 1). The interferometer was operated in D-scan mode, where a fixed sample position was used and the G1–G2 distance was varied in 1 mm increments. The autocorrelation lengths, ξ , probed for this neutron experiment were 788 nm to 3.94 μ m based on ( λ = 0.54 nm), D ranging from 7 mm to 35 mm, and z / ( L 1 + D + L 2 ) 1/2. The beam defining slits were set to approximately 0.5 mm horizontal and 50 mm vertical which resulted in the images being blurred primarily along the vertical direction. To reduce sharp vertical guide features, a pellet of silicon powder, 6 mm thick, was placed directly downstream of the aperture. The interferometry image sharpness, as defined by the geometric L / D ratio, is excellent along the horizontal direction with ( L 1 + D + L 2 ) / ( slit horizontal ) 17,000 while only 170 along the vertical direction. Recently, deep learning methods have been evaluated to improve image resolution [37].
The sample was mounted on a rotation stage and positioned 5 cm downstream of G2. This position yields an optical magnification ≈ 2. A 150 μ m thick 6 LiF/ZnS scintillator was imaged with an Andor NEO sCMOS detector optically coupled with Nikkor 50 mm lens (F-stop set to 1.2). The detector was 2560 pixels × 2160 pixels and each pixel was 6.5 μ m × 6.5 μ m; the lens had a reproduction ratio approximately 7.9 giving effective 51.4 μ m pixels. A geometric magnification of 2 gives an effective pixel size of 25.7 μ m pixels. Median (radius of 2 pixels) and mean (radius of 3 pixels) filtering were used to remove gamma streaks from the images.
The interferometer was operated in stepped-grating mode, typically with 9 or 12 step positions evenly spaced over 3 μ m. Two software packages were used for reduction of the interferograms to attenuation, differential phase contrast, and dark-field projections. The NIH software was used for initial processing at the beamline [38]. The LSU software was used for production work off-line [36,39]. The small angle scattering signal was extracted from the dark-field images as a function of the D-scans and analyzed for the autocorrelation lengths, ξ .

2.4. Neutron Talbot-Lau Grating Interferometry at HZB

Talbot-Lau neutron interferometry experiments were performed at the HZB-CONRAD2 beamline using polychromatic beam at an interferometry design wavelength of 0.35 nm [40,41]. The L 1 distance was 4.78 m and the intergrating distance (D) was 2.27 cm. The G2-detector ( L 2 ) was 4 mm. The source grating, G0, had a period of 790 μ m with 20 μ m Gd thickness, the phase grating, G1, a period, ( p g 1 ), of 7.96 μ m with 38 μ m thick Si for a π -phase shift at 0.35 nm, and the analyzer grating, G2, a period of 4 μ m with 10 μ m thick Gd. The instrument operated in the first order Talbot distance with a p g 1 = 7.97 μ m, z = 5.0 cm, and D = 2.27 cm, yielding ξ = 1.97 μ m.
Batteries were charged, imaged, discharged, and imaged as described in Section 2.1. Li-po batteries of differing capacities (15 mAh, 43 mAh, 50 mAh, and 90 mAh) were attached to an aluminum plate. Batteries were first imaged at their initial resting voltage (around 3.7 V) with 20 s exposures at three different angles (0 , 10 , and 20 ) with 14 steps over 1.2 mm, slightly above the 0.8 mm period of the grating. The 15 mAh batteries were charged up to 4.2 V at 15 mA and left to rest for 20 min, following by “charged” imaging. After imaging, the batteries were discharged at 15 mA to 2.7 V and left to rest for 20 min. At this point, “discharged” imaging took place.

2.5. Neutron Bragg Edge Imaging at HZB

Neutron Bragg edge imaging was performed at the HZB CONRAD2 beamline on a fresh and worn 43 mAh Li-po battery. The beamline was equipped with a double crystal graphite monochromator downstream of a liquid hydrogen moderator with peak neutron flux at a wavelength of 0.25 nm. Imaging was performed at exposure times of 120 s for neutron wavelengths ranging from 0.30 nm to 0.42 nm in steps of 0.002 nm. The beam was defined by a circular aperture of 3 cm providing a neutron fluence rate of 2.4 × 10 7 cm 2 s 1 at the detector (5 m, a geometric blurring L / D value of 167). A 100 μ m thick 6 LiF/ZnS scintillator was used to convert neutron fluence into visible light. An Andor Ikon L-936 camera (2048 pixels × 2048 pixels) was used for imaging. The monochromator bandpass was Δ E / E 3 % .

2.6. Neutron Diffraction at SNS VULCAN

To understand the chemical changes in a battery, neutron diffraction experiments were performed at the Oak Ridge National Laboratory (ORNL) VULCAN beamline. In previous studies by Cai et al., diffraction peaks from a fresh and worn large Li-ion cell (15,000 mAh, 200 mm × 120 mm × 5 mm) showed inhomogeneous cell degradation at the edge of the batteries [14]. However, problems with this diffraction experiment included limited d-spacings of 0.16 nm to 0.20 nm and 0.21 nm to 0.24 nm. Spatially resolved neutron diffraction of Fe/NaCl by Hofmann et al. and cylindrical Li-ion 18,650 cells by Senyshyn et al. have shown promise in the search for non-destructive testing of complex batteries [20,21]. The previous experiments were volume averaged measurements rather than imaging experiments. In the experiments performed here, it was anticipated that probing with wavelengths from 0.2 nm to 0.5 nm with imaging would reveal more cathode/anode diffraction peaks from within the batteries.
Neutron time-of-flight (TOF) diffraction experiments were performed on 300 mAh Li-ion batteries at the SNS Engineering Materials Diffractometer (Oak Ridge National Laboratory, VULCAN). The VULCAN instrument was set up with a 5 mm × 10 mm × 5 mm sample volume, a peak neutron flux at 0.2 nm, and 30 Hz pulse repetition rate. The beamline length is 43.8 m and the two-theta angle is 47.7 . Once a TOF spectrum is obtained for the sample, peaks are removed by using a sample TOF vanadium spectrum.
The points are fitted to a normalized cubic spline interpolation and compared to a CeO 2 diffraction plot from VULCAN based on the Inorganic Crystal Structure Database (ICSD 165720). The diffraction plot, with CeO 2 used as a wavelength standard, is generated with the raw counts versus flight time data using the beamline length and effective two-theta.

3. Results and Discussion

The discussion below explains how a new interferometry setup called far-field interferometry was initiated with fresh and worn Li-po batteries to determine the size of the scattering features in the neutron dark-field images. Neutron Talbot-Lau interferometry and Bragg edge imaging were then explored to visually observe battery degradation. Finally, neutron diffraction of a fresh and worn battery led to an understanding of the changes occurring on a chemical sense within the battery. Table 1 summarizes the experiments, facilities, battery capacities, and key results.

3.1. Far-Field Neutron Imaging at NIST

This section and the following section describe neutron grating interferometry experiments. Since neutron imaging is more sensitive than X-rays to lighter atomic elements like Li, neutron interferometry was anticipated to reveal unique battery component degradation for a lithium-based battery. For the neutron experiments, the Talbot-Lau interferometer gives good spatial resolution, but at a fixed interferometer autocorrelation length. The far-field interferometer has poor spatial resolution, but scans a wide range of autocorrelation lengths.
Thicker batteries (larger than 1 mm) resulted in high amounts of scattering with the far-field neutron interferometer. The 43 mAh and 90 mAh batteries exhibited the largest changes between charged and discharged, fresh and worn samples. The highest capacity batteries of 90 mAh are shown first. While these batteries are not the thickest of the group of four battery sets (1.6 mm), it was anticipated that the multiple electrode layers would provide a strong scattering signal. The worn battery had 1780 charge/discharge cycles while the fresh battery had one previous cycle to build up the solid electrolyte interface. In Figure 2 we observe a large difference in the scattering signal between a fresh and worn battery at various autocorrelation lengths.
The dark-field signal in the worn battery averages around 0.40 while the fresh battery is homogeneous around 0.80 when ξ = 1.12 μ m. With air having a value of 0.0 and a highly scattering material having a value of 1.0, this indicates a higher amount of scattering in the fresh battery versus the worn battery. Of interest in the worn battery is the left edge, which has a high scattering signal of 0.75. With this region not in the folds of the battery (located at the top and bottom of each battery), it is important to observe that the scattering signal is high on just one side of the battery. When ξ is increased from 1.12 μ m to 1.69 μ m, the scattering signal increases for both batteries. Upon increasing the autocorrelation length to 2.25 μ m, the worn battery appears to gain uniformity across the right side of the sample while the fresh battery remains homogeneous (Figure 2 top). When the autocorrelation length is increased to 2.81 μ m, the highly intense scattering centers in the worn battery diminish (Figure 2 middle row).
The fresh battery also has a small reduction in signal, however it is not as noticeable as in the worn battery. One possible explanation for this decrease in signal is that 2.81 μ m sized particles are more prevalent in the fresh battery than the worn battery. While this could be related to battery degradation within the cell of smaller components, it is challenging to specify which component would cause this phenomenon without known particle size or porosity information in these commercially available batteries.
The dark-field signal is shown in Figure 2 as a function of ξ . When focused on the worn battery, a major difference can be observed in the dark-field signal between the left and right regions (Figure 2 bottom right). The left region behaves as if there are many particles up to 2.5 μ m in size while the right region appears to have a more even distribution of particles yielding scattering for autocorrelation lengths in the range from 788 nm to 3.0 μ m. This could be indicative of the right half of the battery becoming less involved in the worn battery chemistry where lithium is less able to intercalate in graphite, thus leaving only the left side of the battery active.
In the 43 mAh batteries, large differences in the mean scattering values across the batteries were observed. Figure 3 exhibits the drastic change in scattering as a function of state of charge. Here, the fresh battery has undergone a single cycle to generate the solid-electrolyte interface. The slightly worn battery still has the initial capacity. The worn battery after 1790 cycles still has a capacity of 38.6 mAh, close to its advertised capacity of 43 mAh.
The first sign of deterioration in the discharged batteries is when ξ = 2.59 μ m, where the worn battery begins showing inhomogeneous scattering across the battery image. The slightly worn battery shows small regions that change between the edges and center while the fresh battery still exhibits a homogeneous scattering image.
Similar to the case of the 2 mm thick 90 mAh batteries, we observe a large difference in the scattering between charged and discharged 43 mAh batteries at larger autocorrelation lengths. In the charged batteries, the worn battery has low scattering values similar to air, the slightly worn battery has higher signal along the edges, and the fresh battery is still near homogeneous. The worn battery still possesses scattering along the edge, however the middle area of the battery now has scattering values similar to air. In comparing the mean scattering values for charged and discharged cycles, we observe the lower plots in Figure 3.
Of interest in the scattering images is how the dark-field signal increases up to ξ = 2.36 μ m for the fresh battery, ξ = 1.80 μ m for the slightly worn battery, and ξ = 1.69 μ m for the worn battery before decreasing. This could indicate that the fresh battery has particles of larger size in comparison to the worn battery. As a battery undergoes degradation from its original capacity, larger particles within the battery are breaking down into smaller particles. The difficult challenge is determining whether the degradation is occurring on the solid electrolyte interface or the lithium cobalt oxide or graphite electrodes.
Thin batteries (15 mAh and 50 mAh, 0.5 mm thick) had limited scattering value differences between charged and discharged cycles in comparison to the 1.5 mm thick batteries. There is limited difference in the scattering signal between the charged and discharged states at ξ of 1.12 μ m. One explanation is that the 0.5 mm batteries did not have as much electrolytic material at the 2 mm thick batteries to cause as much scattering of the neutrons. Although the signal is not changing between charged and discharged states, there is a large spatial difference in the dark-field signal when the autocorrelation length is changed. When ξ = 1.35 μ m, the fresh battery has a higher scattering signal on the left side of the battery. However, when the autocorrelation length is increased up to 2.81 μ m, the higher scattering signal is located on the opposite, right side of the battery. This is indicative of smaller sized features (up to 1.12 μ m) on the left side of the battery compared to larger sized features around 2.81 μ m on the right side.
One challenge with these experiments is that the battery imaging is face-on. This means that both the cathode and anode material is included in the attenuation and dark-field values. Ideally, the battery is separated into cathode and anode components for far-field interferometry to understand which electrode the battery degradation is occurring. While these experiments are able to spatially locate where particle sizes are changing within the Li-po batteries, the chemical mechanisms causing these changes need further understanding.

3.2. Neutron Talbot-Lau Interferometry at HZB

Neutron Talbot-Lau interferometry at HZB showed a slight difference in the dark-field images (autocorrelation length ξ near 1.97 μ m) between charged and discharged, 0.5 mm thick 15 mAh Li-po batteries (Figure 4).
When both the fresh and worn batteries are charged, there are only a few regions where the scattering signal changes within the samples. The major difference occurs at the top of the fresh battery, where the higher scattering values (around 0.65) are associated with electrolytic material. Also of note are the vertical scattering features in both batteries, specifically in the middle and edges of the sample. When the battery is discharged, the scattering values increase to 0.29 for the fresh battery and 0.27 for the worn battery.

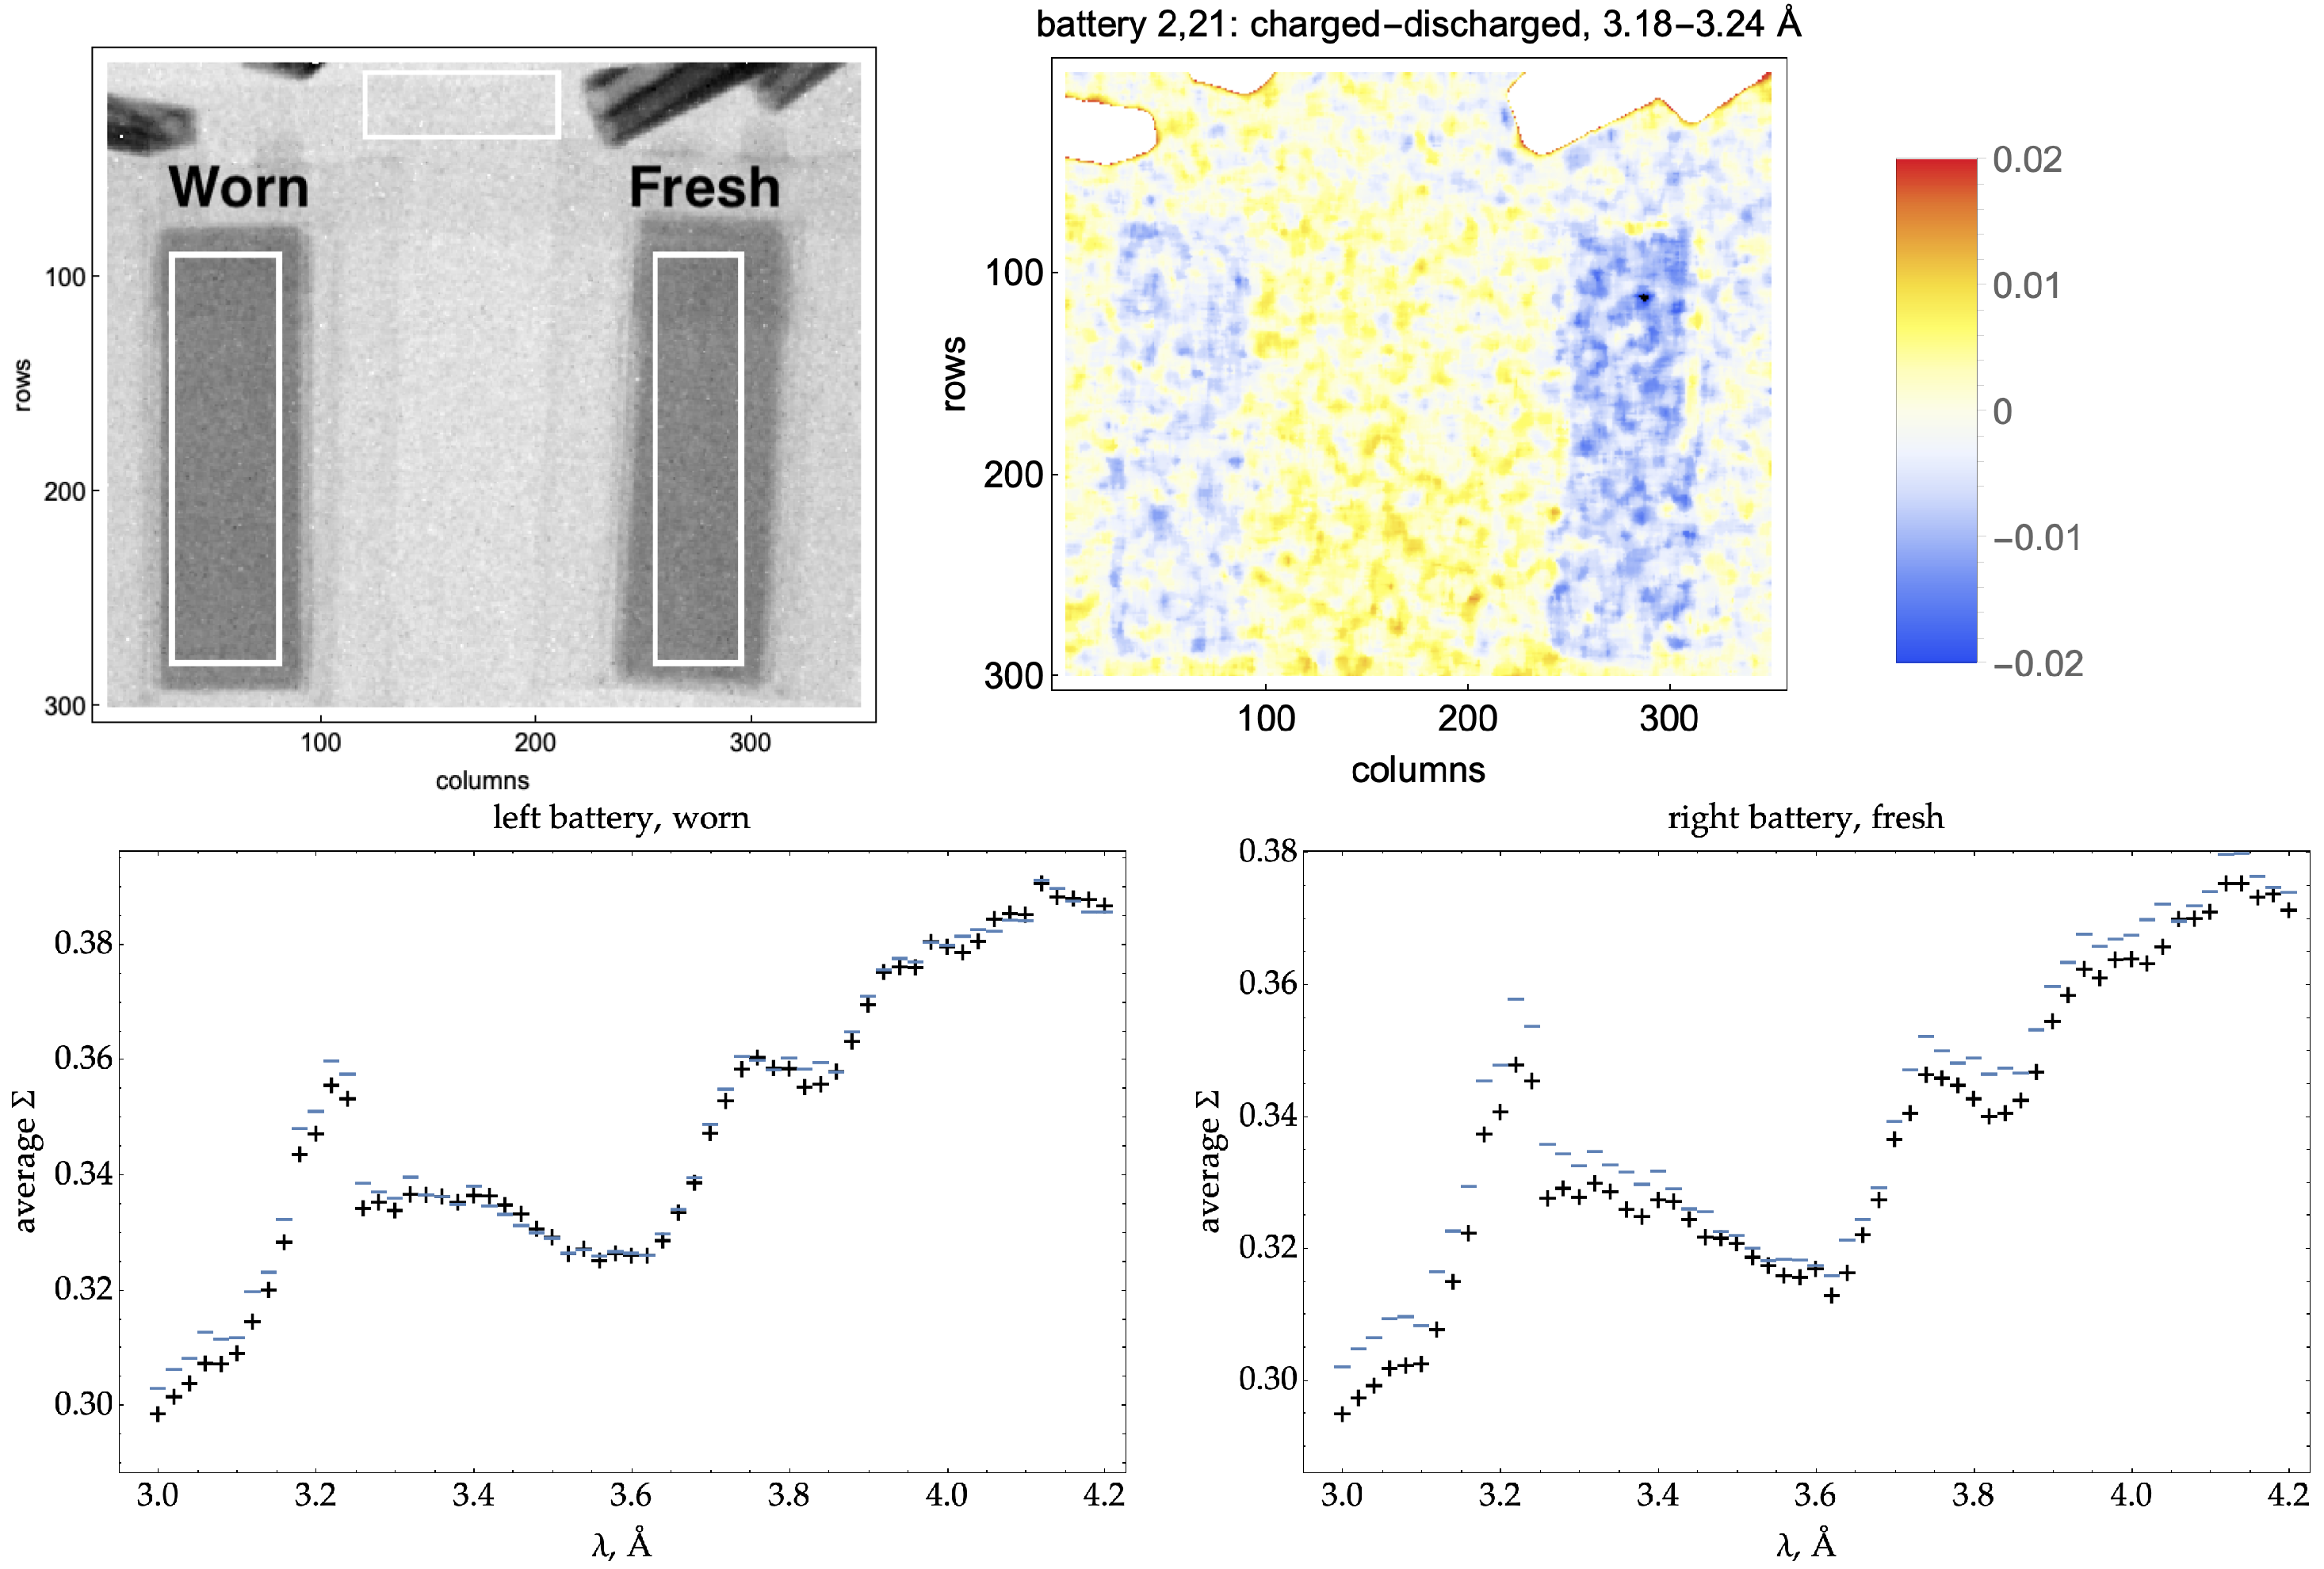
3.3. Neutron Bragg Edge Imaging at HZB

Neutron Bragg edge imaging of fresh and worn, charged and discharged batteries revealed several interesting features. In comparison to the neutron diffraction results in Section 3.4, this method combines imaging with spectral information. The spectral plots of the macroscopic attenuation cross section, Σ , versus wavelength are generated from
Σ = ln open   beam closed   beam sample closed   beam
but an additional correction was needed to account for a change in reactor power between measurement of the open beam and the sample measurement. A reference area was chosen in the images and a correction applied to the discharged data as
Σ ( discharged ) = Σ ( discharged ) + Σ ( charged ( reference ) ) Σ ( discharged ( reference ) )
The attenuation signal through the batteries was always higher for the discharged battery versus the charged battery except for the region near 0.34 nm. The strongest peak around 0.32 nm is likely a result of Li x CoO 2 , where x = 1 for a charged battery and x = 0.5 for a discharged battery [42]. If the lithium is becoming inactive in the chemical process, this could explain the large difference between charged and discharged states. There are two possible explanations as to why the signal is mostly higher in the fresh battery than the worn battery. First, with inactive Li not getting involved in migration from one electrode to another, this results in a larger difference between the charged and discharged states. Second, a remaining graphite, LiC x , or LiCoO 2 Bragg peak above 0.42 nm is also possible as the samples become opaque at very large wavelengths. The feature from 0.36–0.38 nm in the worn battery was expected due to LiC 6 depletion as the battery is worn [25]. A strong LiC 6 peak from the 111 plane is located at 0.365 nm and in combination with peaks from large carbon compounds like C 60 at 0.377 nm, there is overlap from several Bragg edges (Figure 5).

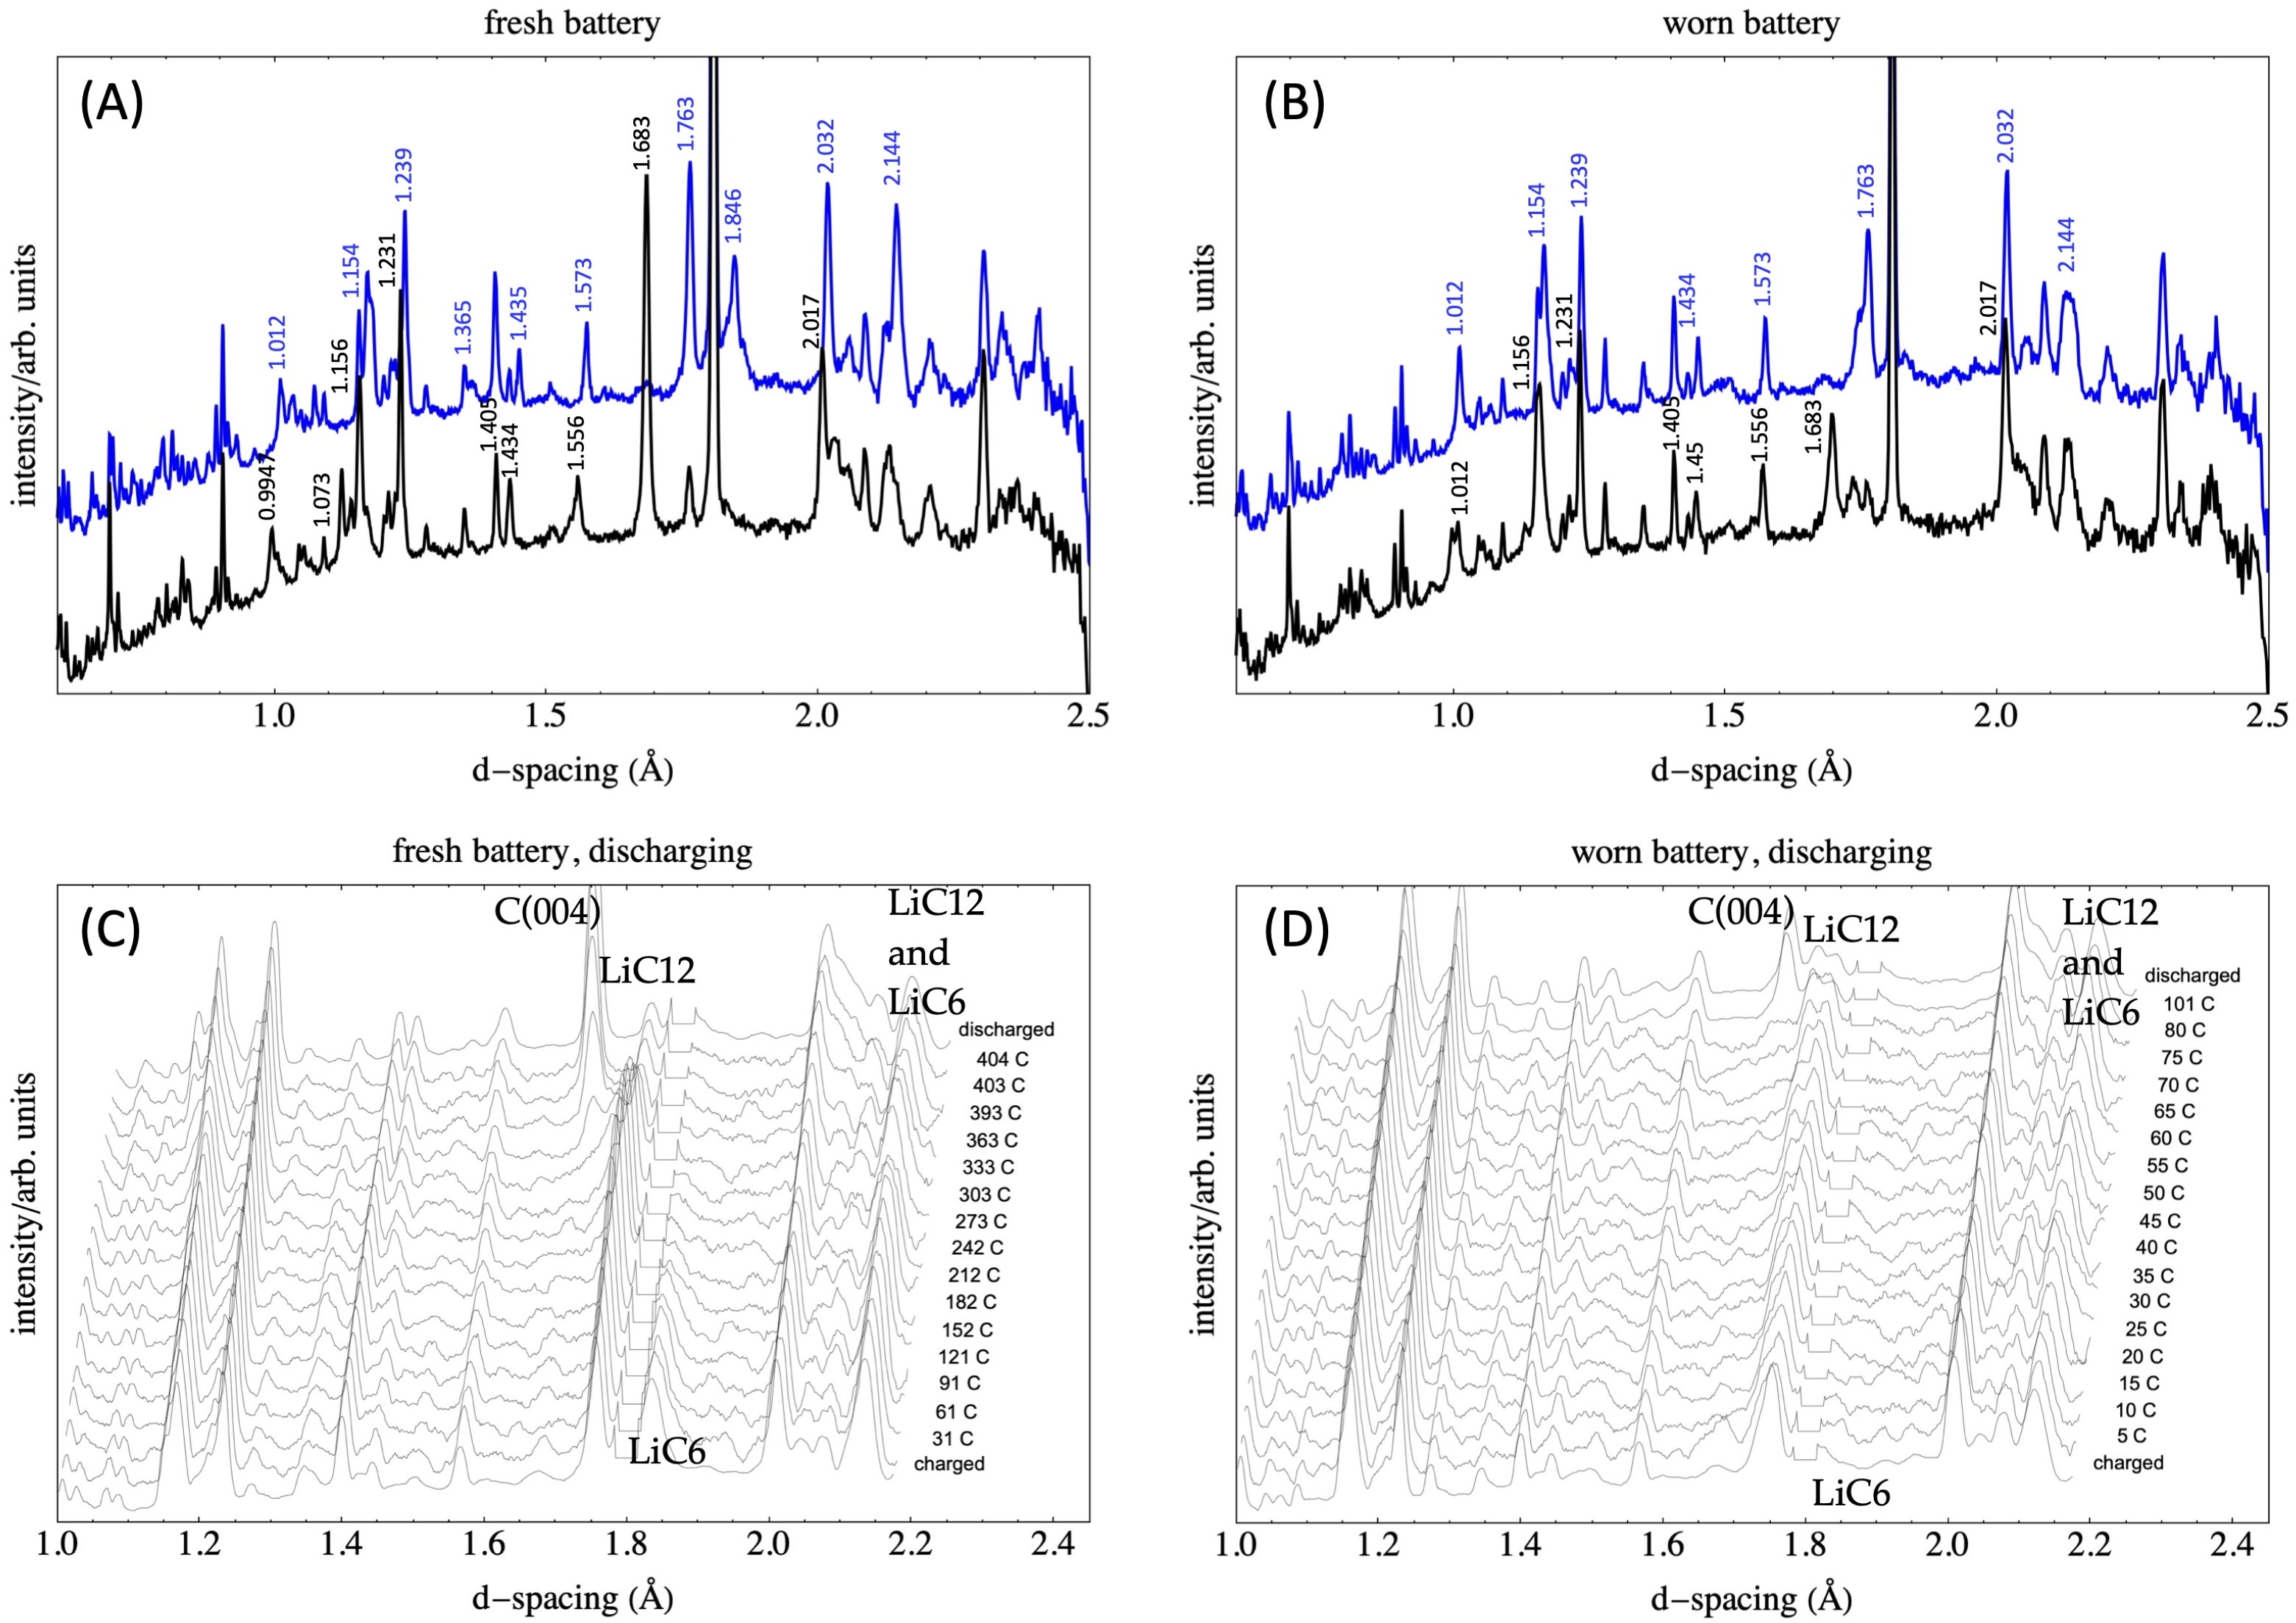
3.4. Neutron Diffraction Analysis

Neutron diffraction can reveal h k l planes within a polycrystalline material. In the case of a Li-ion/Li-po battery, this becomes more complex due to the wide range of materials used for anode, cathode, electrolytic, and separator material. Figure 6 shows the neutron diffraction spectra of a charged and discharged, fresh and worn Li-ion battery taken from 0.05–0.25 nm at the VULCAN instrument (ORNL, SNS).
This neutron diffraction experiment was expected to show qualitatively how the components within a Li-ion battery can change during the cycling process. In all spectra, the largest peak at 0.181 nm corresponds to a Cu (002) peak that is not changing in the battery, hence the high intensity for both the charged and discharged states. For the fresh battery, the most observable peak differences can be observed at 0.157 nm, 0.168 nm, 0.176 nm, 0.185 nm, and 0.214 nm. At 0.157 nm, the Li 0.5 CoO 2 (112) peak appears for the charged state in both the fresh and the worn battery. The peaks at 0.185 nm and 0.214 nm are related to Li 0.75 CoO 2 (015) and Li x C 6 (110), respectively. When the battery is charged (blue spectrum), both peaks are prevalent and when the battery is discharged (black spectrum), the peaks are no longer present, indicative of lithium de-intercalation. The peaks at 0.168 nm and 0.176 nm represent graphite (004) and LiC 12 (004), respectively. At 0.176 nm, when the battery is charged, smaller lithium intercalated components such as LiC 12 exist. When the battery is discharged, lithium de-intercalates within the graphite and thus the peak at 0.168 nm appears.
In comparing the fresh battery to the worn battery spectra, several changes can be observed. First, at 0.157 nm, the 112 peak for Li 0.5 CoO 2 is present in both the charged and discharged states. This implies that the lithium is still intercalated in the CoO 2 structure despite the battery being discharged. The Li 0.75 CoO 2 015 peak at 0.185 nm and the Li x C 6 110 peak at 0.215 nm are no longer present. Although the battery can still undergo charging/discharging, this suggests that lithium is not moving within the battery as it once did. Lithium can be trapped in a non-electrochemically or non-crystalline active phase within the battery such that lithium intercalation cannot be fully achieved as in the first charge/discharge cycle. Also observable is the absence of the graphite 004 peak at 0.168 nm and the increase in LiC 12 004 signal at 0.176 nm for the discharged battery.

4. Conclusions

The first spatially resolved scattering images for 19 mAh to 93 mAh Li-po batteries are shown using neutron Talbot-Lau and far-field interferometry. This is one of the first applications of neutron far-field interferometry to battery chemistry, and the first for a set of commercial batteries. In the 43 mAh batteries, neutron attenuation and dark-field images clearly show differences between charged and discharged states, and between fresh and worn batteries. Moreover, wear induces inhomogeneities in the 2D images, obtained with high resolution—25.7 μ m effective pixel size—along one dimension.
Relative to Talbot-Lau, the far-field interferometry is able to scan a wide range of autocorrelation lengths, which enables tuning the imaging experiment to features within the battery most sensitive to state of charge and wear. When the same battery was imaged at a charged and a discharged state, the dark-field image was found to evolve unevenly, with significant differences at the edges of the batteries.
On the basis of the range of batteries sizes studied, from 19 mAh to 300 mAh, and the various neutron imaging and diffraction experiments performed, we suggest the combination of far-field imaging and neutron diffraction as a productive path for the characterization of small, commercial batteries.

Author Contributions

Conceptualization, A.J.B., D.S.H., D.L.J., N.K., L.G.B.; methodology, A.J.B., D.S.H., K.H., I.M., N.K., L.G.B.; software, A.J.B., D.S.H., K.H., N.K., L.G.B.; validation, D.S.H., D.L.J. and L.G.B.; formal analysis, D.S.H., K.H., L.G.B.; investigation, A.J.B., K.H., N.K., L.G.B.; resources, D.S.H., K.H., D.L.J., I.M., N.K.; data curation, I.M., L.G.B.; writing—original draft preparation, A.J.B.; writing—review and editing, K.H., D.L.J., L.G.B.; visualization, A.J.B., L.G.B.; supervision, L.G.B.; project administration, D.L.J., I.M., L.G.B.; funding acquisition, D.S.H., D.L.J., I.M., N.K., L.G.B. All authors have read and agreed to the published version of the manuscript.

Funding

The lithium battery neutron imaging and spectroscopy research at LSU was supported by the U.S. Department of Energy (DOE) under EPSCoR Grant No. DE-SC0012432 with additional support from the Louisiana Board of Regents. A.J.B. also thanks the Charles E. Coates Memorial Fund for research travel support. We acknowledge the support of the National Institute of Standards and Technology, U.S. Department of Commerce, in providing the neutron research facilities used in this work. Measurements were carried out at the CONRAD-2 beamline operated by the Helmholtz-Zentrum Berlin fur Materialien und Energie. A portion of this research used resources at the Spallation Neutron Source a DOE Office of Science User Facility operated by the Oak Ridge National Laboratory. We gratefully acknowledge the support of Ke An, lead instrument scientist at the VULCAN beamline. Certain trade names and company products are mentioned in the text or identified in an illustration in order to adequately specify the experimental procedure and equipment used. In no case does such identification imply recommendation or endorsement by the National Institute of Standards and Technology, nor does it imply that the products are necessarily the best available for the purpose.

Data Availability Statement

The data presented in this study are available on request from the corresponding author.

Conflicts of Interest

The authors declare no conflict of interest.

References

  1. Liu, K.; Zhuo, D.; Lee, H.W.; Liu, W.; Lin, D.; Lu, Y.; Cui, Y. Extending the Life of Lithium-Based Rechargeable Batteries by Reaction of Lithium Dendrites with a Novel Silica Nanoparticle Sandwiched Separator. Adv. Mater. 2017, 29, 1603987. [Google Scholar] [CrossRef] [PubMed]
  2. Chen, C.Y.; Sawamura, A.; Tsuda, T.; Uchida, S.; Ishikawa, M.; Kuwabata, S. Visualization of Si Anode Reactions in Coin-Type Cells via Operando Scanning Electron Microscopy. ACS Appl. Mater. Interfaces 2017, 9, 35511–35515. [Google Scholar] [CrossRef] [PubMed]
  3. Li, Y.; Wang, S.; Lee, P.K.; He, J.; Yu, D.Y. Crack-resistant polyimide coating for high-capacity battery anodes. J. Power Sources 2017, 366, 226–232. [Google Scholar] [CrossRef]
  4. Liu, D.; Shadike, Z.; Lin, R.; Qian, K.; Li, H.; Li, K.; Wang, S.; Yu, Q.; Liu, M.; Ganapathy, S.; et al. Review of recent development of in situ/operando characterization techniques for lithium battery research. Adv. Mater. 2019, 31, 1806620. [Google Scholar] [CrossRef] [PubMed]
  5. Atkins, D.; Capria, E.; Edström, K.; Famprikis, T.; Grimaud, A.; Jacquet, Q.; Johnson, M.; Matic, A.; Norby, P.; Reichert, H.; et al. Accelerating Battery Characterization Using Neutron and Synchrotron Techniques: Toward a Multi-Modal and Multi-Scale Standardized Experimental Workflow. Adv. Energy Mater. 2021. [Google Scholar] [CrossRef]
  6. Wu, L.; Zhang, Y.; Yang, X.; Santodonato, L.; Bilheux, H.; Zhang, J. Neutron imaging of lithium concentration in LiNi0.33Mn0.33Co0.33O2 cathode. J. Neutron Res. 2020, 22, 43–48. [Google Scholar] [CrossRef]
  7. Singh, H.; Hayat, M.; Huang, S.; Sui, Y.; Cao, P. An In situ neutron diffraction study of phase formation during Ti-Si3N4 powder sintering. Adv. Powder Mater. 2021. [Google Scholar] [CrossRef]
  8. Vitoux, L.; Reichardt, M.; Sallard, S.; Novák, P.; Sheptyakov, D.; Villevieille, C. A Cylindrical Cell for Operando Neutron Diffraction of Li-Ion Battery Electrode Materials. Front. Energy Res. 2018, 6, 76. [Google Scholar] [CrossRef]
  9. Liang, G.; Didier, C.; Guo, Z.; Pang, W.K.; Peterson, V.K. Understanding Rechargeable Battery Function Using In Operando Neutron Powder Diffraction. Adv. Mater. 2020, 32, e1904528. [Google Scholar] [CrossRef]
  10. Zhao, E.; Zhang, Z.G.; Li, X.; He, L.; Yu, X.; Li, H.; Wang, F. Neutron-based characterization techniques for lithium-ion battery research. Chin. Phys. B 2020, 29, 018201. [Google Scholar] [CrossRef]
  11. Wu, X.; Song, B.; Chien, P.H.; Everett, S.M.; Zhao, K.; Liu, J.; Du, Z. Structural Evolution and Transition Dynamics in Lithium Ion Battery under Fast Charging: An Operando Neutron Diffraction Investigation. Adv. Sci. 2021, 8, 2102318. [Google Scholar] [CrossRef] [PubMed]
  12. Sørensen, D.R.; Heere, M.; Zhu, J.; Darma, M.S.D.; Zimnik, S.M.; Mühlbauer, M.J.; Mereacre, L.; Baran, V.; Senyshyn, A.; Knapp, M.; et al. Fatigue in High-Energy Commercial Li Batteries while Cycling at Standard Conditions: An In Situ Neutron Powder Diffraction Study. ACS Appl. Energy Mater. 2020, 3, 6611–6622. [Google Scholar] [CrossRef]
  13. Wang, X.L.; An, K.; Cai, L.; Feng, Z.; Nagler, S.E.; Daniel, C.; Rhodes, K.J.; Stoica, A.D.; Skorpenske, H.D.; Liang, C.; et al. Visualizing the chemistry and structure dynamics in lithium-ion batteries by in-situ neutron diffraction. Sci. Rep. 2012, 2, 1–7. [Google Scholar] [CrossRef] [PubMed]
  14. Cai, L.; An, K.; Feng, Z.; Liang, C.; Harris, S.J. In-situ observation of inhomogeneous degradation in large format Li-ion cells by neutron diffraction. J. Power Sources 2013, 236, 163–168. [Google Scholar] [CrossRef]
  15. Liu, H.; Liu, H.; Lapidus, S.H.; Meng, Y.S.; Chupas, P.J.; Chapman, K.W. Sensitivity and limitations of structures from X-ray and neutron-based diffraction analyses of transition metal oxide lithium-battery electrodes. J. Electrochem. Soc. 2017, 164, A1802. [Google Scholar] [CrossRef]
  16. Yang, S.; Fan, Q.; Shi, Z.; Liu, L.; Liu, J.; Ke, X.; Liu, J.; Hong, C.; Yang, Y.; Guo, Z. Superior stability secured by a four-phase cathode electrolyte interface on a Ni-rich cathode for lithium ion batteries. ACS Appl. Mater. Interfaces 2019, 11, 36742–36750. [Google Scholar] [CrossRef]
  17. Fan, Q.; Yang, S.; Liu, J.; Liu, H.; Lin, K.; Liu, R.; Hong, C.; Liu, L.; Chen, Y.; An, K.; et al. Mixed-conducting interlayer boosting the electrochemical performance of Ni-rich layered oxide cathode materials for lithium ion batteries. J. Power Sources 2019, 421, 91–99. [Google Scholar] [CrossRef]
  18. Bobrikov, I.A.; Samoylova, N.Y.; Sumnikov, S.V.; Ivanshina, O.Y.; Vasin, R.N.; Beskrovnyi, A.I.; Balagurov, A.M. In-situ time-of-flight neutron diffraction study of the structure evolution of electrode materials in a commercial battery with LiNi0.8Co0.15Al0.05O2 cathode. J. Power Sources 2017, 372, 74–81. [Google Scholar] [CrossRef]
  19. Gummow, R.J.; Sharma, N.; Peterson, V.K.; He, Y. Synthesis, structure, and electrochemical performance of magnesium-substituted lithium manganese orthosilicate cathode materials for lithium-ion batteries. J. Power Sources 2012, 197, 231–237. [Google Scholar] [CrossRef] [Green Version]
  20. Hofmann, M.; Gilles, R.; Gao, Y.; Rijssenbeek, J.T.; Muehlbauer, M.J. Spatially resolved phase analysis in sodium metal halide batteries: Neutron diffraction and tomography. J. Electrochem. Soc. 2012, 159, A1827–A1833. [Google Scholar] [CrossRef]
  21. Senyshyn, A.; Muehlbauer, M.J.; Dolotko, O.; Hofmann, M.; Pirling, T.; Ehrenberg, H. Spatially resolved in operando neutron scattering studies on Li-ion batteries. J. Power Sources 2014, 245, 678–683. [Google Scholar] [CrossRef]
  22. Kino, K.; Yonemura, M.; Ishikawa, Y.; Kamiyama, T. Two-dimensional imaging of charge/discharge by Bragg edge analysis of electrode materials for pulsed neutron-beam transmission spectra of a Li-ion battery. Solid State Ionics 2016, 288, 257–261. [Google Scholar] [CrossRef]
  23. Kamiyama, T.; Narita, Y.; Sato, H.; Ohnuma, M.; Kiyanagi, Y. Structural change of carbon anode in a lithium-ion battery product associated with charging process observed by neutron transmission Bragg-edge imaging. Phys. Procedia 2017, 88, 27–33. [Google Scholar] [CrossRef]
  24. Ziesche, R.F.; Tremsin, A.S.; Huang, C.; Tan, C.; Grant, P.S.; Storm, M.; Brett, D.J.; Shearing, P.R.; Kockelmann, W. 4D Bragg Edge Tomography of Directional Ice Templated Graphite Electrodes. J. Imaging 2020, 6, 136. [Google Scholar] [CrossRef] [PubMed]
  25. Butler, L.G.; Schillinger, B.; Ham, K.; Dobbins, T.A.; Liu, P.; Vajo, J.J. Neutron imaging of a commercial Li-ion battery during discharge: Application of monochromatic imaging and polychromatic dynamic tomography. Nucl. Instrum. Methods Phys. Res. Sect. A 2011, 651, 320–328. [Google Scholar] [CrossRef]
  26. Campillo-Robles, J.M.; Goonetilleke, D.; Soler, D.; Sharma, N.; Martín Rodríguez, D.; Bücherl, T.; Makowska, M.; Türkilmaz, P.; Karahan, V. Monitoring lead-acid battery function using operando neutron radiography. J. Power Sources 2019, 438, 226976. [Google Scholar] [CrossRef]
  27. Sun, F.; Markötter, H.; Manke, I.; Hilger, A.; Alrwashdeh, S.S.; Kardjilov, N.; Banhart, J. Complementary X-ray and neutron radiography study of the initial lithiation process in lithium-ion batteries containing silicon electrodes. Appl. Surf. Sci. 2017, 399, 359–366. [Google Scholar] [CrossRef] [Green Version]
  28. Siegel, J.B.; Lin, X.; Stefanopoulou, A.G.; Hussey, D.S.; Jacobson, D.L.; Gorsich, D. Neutron Imaging of Lithium Concentration in LFP Pouch Cell Battery. J. Electrochem. Soc. 2011, 158, A523–A529. [Google Scholar] [CrossRef]
  29. Garlea, E.; King, M.O.; Galloway, E.C.; Boyd, T.L.; Smyrl, N.R.; Bilheux, H.Z.; Santodonato, L.J.; Morrell, J.S.; Leckey, J.H. Identification of lithium hydride and its hydrolysis products with neutron imaging. J. Nucl. Mater. 2017, 485, 147–153. [Google Scholar] [CrossRef] [Green Version]
  30. Nie, Z.; Ong, S.; Hussey, D.S.; LaManna, J.M.; Jacobson, D.L.; Koenig, G.M. Probing transport limitations in thick sintered battery electrodes with neutron imaging. Mol. Syst. Des. Eng. 2020, 5, 245–256. [Google Scholar] [CrossRef]
  31. Gelb, J.; Finegan, D.P.; Brett, D.J.; Shearing, P.R. Multi-scale 3D investigations of a commercial 18,650 Li-ion battery with correlative electron- and X-ray microscopy. J. Power Sources 2017, 357, 77–86. [Google Scholar] [CrossRef] [Green Version]
  32. Ziesche, R.F.; Arlt, T.; Finegan, D.P.; Heenan, T.M.; Tengattini, A.; Baum, D.; Kardjilov, N.; Markötter, H.; Manke, I.; Kockelmann, W.; et al. 4D imaging of lithium-batteries using correlative neutron and X-ray tomography with a virtual unrolling technique. Nat. Commun. 2020, 11, 1–11. [Google Scholar] [CrossRef] [PubMed] [Green Version]
  33. Pfeiffer, F.; Grunzweig, C.; Bunk, O.; Frei, G.; Lehmann, E.; David, C. Neutron phase imaging and tomography. Phys. Rev. Lett. 2006, 96, 215505. [Google Scholar] [CrossRef] [PubMed] [Green Version]
  34. Miao, H.; Panna, A.; Gomella, A.A.; Bennett, E.E.; Znati, S.; Chen, L.; Wen, H. A universal moire effect and application in X-ray phase-contrast imaging. Nat. Phys. 2016, 12, 830–834. [Google Scholar] [CrossRef] [Green Version]
  35. Pushin, D.A.; Sarenac, D.; Hussey, D.S.; Miao, H.; Arif, M.; Cory, D.G.; Huber, M.G.; Jacobson, D.L.; LaManna, J.M.; Parker, J.D.; et al. Far-field interference of a neutron white beam and the applications to noninvasive phase contrast imaging. Phys. Rev. A 2017, 95, 043637. [Google Scholar] [CrossRef] [Green Version]
  36. Marathe, S.; Assoufid, L.; Xiao, X.; Ham, K.; Johnson, W.W.; Butler, L.G. Improved algorithm for processing grating-based phase contrast interferometry image sets. Rev. Sci. Instrum. 2014, 85, 013704. [Google Scholar] [CrossRef]
  37. Lee, S.; Oh, O.; Kim, Y.; Kim, D.; Hussey, D.S.; Wang, G.; Lee, S.W. Deep learning for high-resolution and high-sensitivity interferometric phase contrast imaging. Sci. Rep. 2020, 10, 1–12. [Google Scholar] [CrossRef]
  38. Wen, H.; Bennett, E.E.; Hegedus, M.M.; Rapacchi, S. Fourier X-ray scattering radiography yields bone structural information. Radiology 2009, 251, 910–918. [Google Scholar] [CrossRef] [Green Version]
  39. Grizolli, W.; Shi, W.; Assoufid, L.; Butler, L.G. wavepy—Python package for X-ray grating interferometry with applications in imaging and wavefront characterization. AIP Conf. Proc. 2018; in press. [Google Scholar]
  40. Kardjilov, N.; Hilger, A.; Manke, I.; Griesche, A.; Banhart, J. Imaging with Cold Neutrons at the CONRAD-2 Facility. Phys. Procedia 2015, 69, 60–66. [Google Scholar] [CrossRef] [Green Version]
  41. Kardjilov, N.; Hilger, A.; Manke, I.; Woracek, R.; Banhart, J. CONRAD-2: The new neutron imaging instrument at the Helmholtz-Zentrum Berlin. J. Appl. Crystallogr. 2016, 49, 195–202. [Google Scholar] [CrossRef]
  42. Kino, K.; Yonemura, M.; Kiyanagi, Y.; Ishikawa, Y.; Parker, J.D.; Tanimori, T.; Kamiyama, T. First Imaging Experiment of a Lithium Ion Battery by a Pulsed Neutron Beam at J-PARC/MLF/BL09. Phys. Procedia 2015, 69, 612–618. [Google Scholar] [CrossRef] [Green Version]
Figure 1. Experimental setup for the neutron far-field interferometer at NIST. The neutron single source slit is pictured on the left, the battery in the middle, and the detector on the right. The total distance L was 8.71 m, the distance from the source to the first phase grating L 1 and the second phase grating to the detector L 2 were 4.36 m, an inter-grating distance D ranged from 7 mm to 35 mm, corresponding to ξ values of 788 nm to 3.94 μ m.
Applsci 12 01281 g001
Figure 2. Neutron scattering images of charged and discharged, fresh and worn 90 mAh batteries. In the top row images, ξ = 2.25 μ m. In the middle row images, ξ = 2.81 μ m. At the bottom, plots show scattering values across the batteries. The color bar represents the dark-field signal acquired through each battery. The reported uncertainty is the one-sigma root mean square uncertainty of the nonlinear least squares fit.
Applsci 12 01281 g002
Figure 3. Neutron images of a worn, fresh, and slightly worn 43 mAh battery. The autocorrelation length corresponds to ξ = 2.59 μ m for the top images and ξ = 2.92 μ m for the middle images. On the bottom is a plot of the mean scattering values across the charged and discharged batteries. The color bar represents the dark-field signal acquired through each battery. The reported uncertainty is the one-sigma root mean square uncertainty of the nonlinear least squares fit.
Applsci 12 01281 g003
Figure 4. Dark-field images of charged (left) and discharged (right) 15 mAh Li-po batteries. In each image, the battery on the left is the fresh battery and the battery on the right is the worn battery. The autocorrelation length ξ = 1.97 μ m and λ = 0.35 nm. The color bar represents the dark-field signal acquired through each battery.
Applsci 12 01281 g004
Figure 5. The top left image shows a diffraction plot of a worn and fresh battery at 0.318 nm. The top right image shows the difference image of charged—discharge state a 0.318 to 0.324 nm. Bottom images are Bragg edge plots from 0.30 nm to 0.44 nm of the worn (left) and fresh (right) batteries. The (+) symbol represents when the battery is charged while the (−) symbol represents the discharged battery.
Applsci 12 01281 g005
Figure 6. Time-of-flight neutron diffraction plots for fresh (left) and worn, 25% of original capacity (right) 300 mAh Li-ion batteries where the blue trace (with vertical offset) indicates charged battery and the black trace is for the discharged battery. A few diffraction peaks are tentatively assigned in (C). The Cu (002) diffraction peak is cropped from figures (C,D).
Applsci 12 01281 g006
Table 1. Overview of Neutron Imaging and Diffraction Experiments.
Expt.FacilityCapacity/mAhSummary of Results
Far-FieldNIST43, 90wear: 43 mAh may be optimum size for battery capacity and imaging
Talbot-LauHZB15wear: 15 mAh is too small
Bragg-EdgeHZB15wear: 15 mAh is too small
DiffractionSNS300chemistry: 300 mAh may be optimum size
Publisher’s Note: MDPI stays neutral with regard to jurisdictional claims in published maps and institutional affiliations.

