
Seismic Strengthening of R/C Buildings Retrofitted by New Window-Type System Using Non-Buckling Slit Dampers Examined via Pseudo-Dynamic Testing and Nonlinear Dynamic Analysis


Abstract
:1. Introduction
- Add to the overall weight of buildings. Given the weak foundations of domestic RC buildings with non-seismic details, the application of such methods may require foundation reinforcement work to support the weight increase.
- Difficult to secure enough workspace during the retrofitting process.
- Among the most widely used retrofitting methods, steel-plate reinforcement involves difficulties in material transport and pressing work due to the weight of used steel plates. When steel plates are pressured against affected structures, in particular, it is difficult to determine if the substrate and steel plates have properly adhered to each other. In some cases, such a reinforcement rather negatively affects the building with the reinforced steel plates being suspended from the substrate, instead of supporting it.
- Require construction precision.
- Require pretreatment to treat rough surfaces.
- Involve reinforcement anisotropy, where the degree of reinforcement varies depending on the directions in which fibers are aligned.
- Allow limited workspace, especially for construction work in a narrow space.
2. Overview of the Seismic Retrofitting Method Using the NBSD-Based WSCS
3. Material Testing of Window-Type NBSDs and the Results
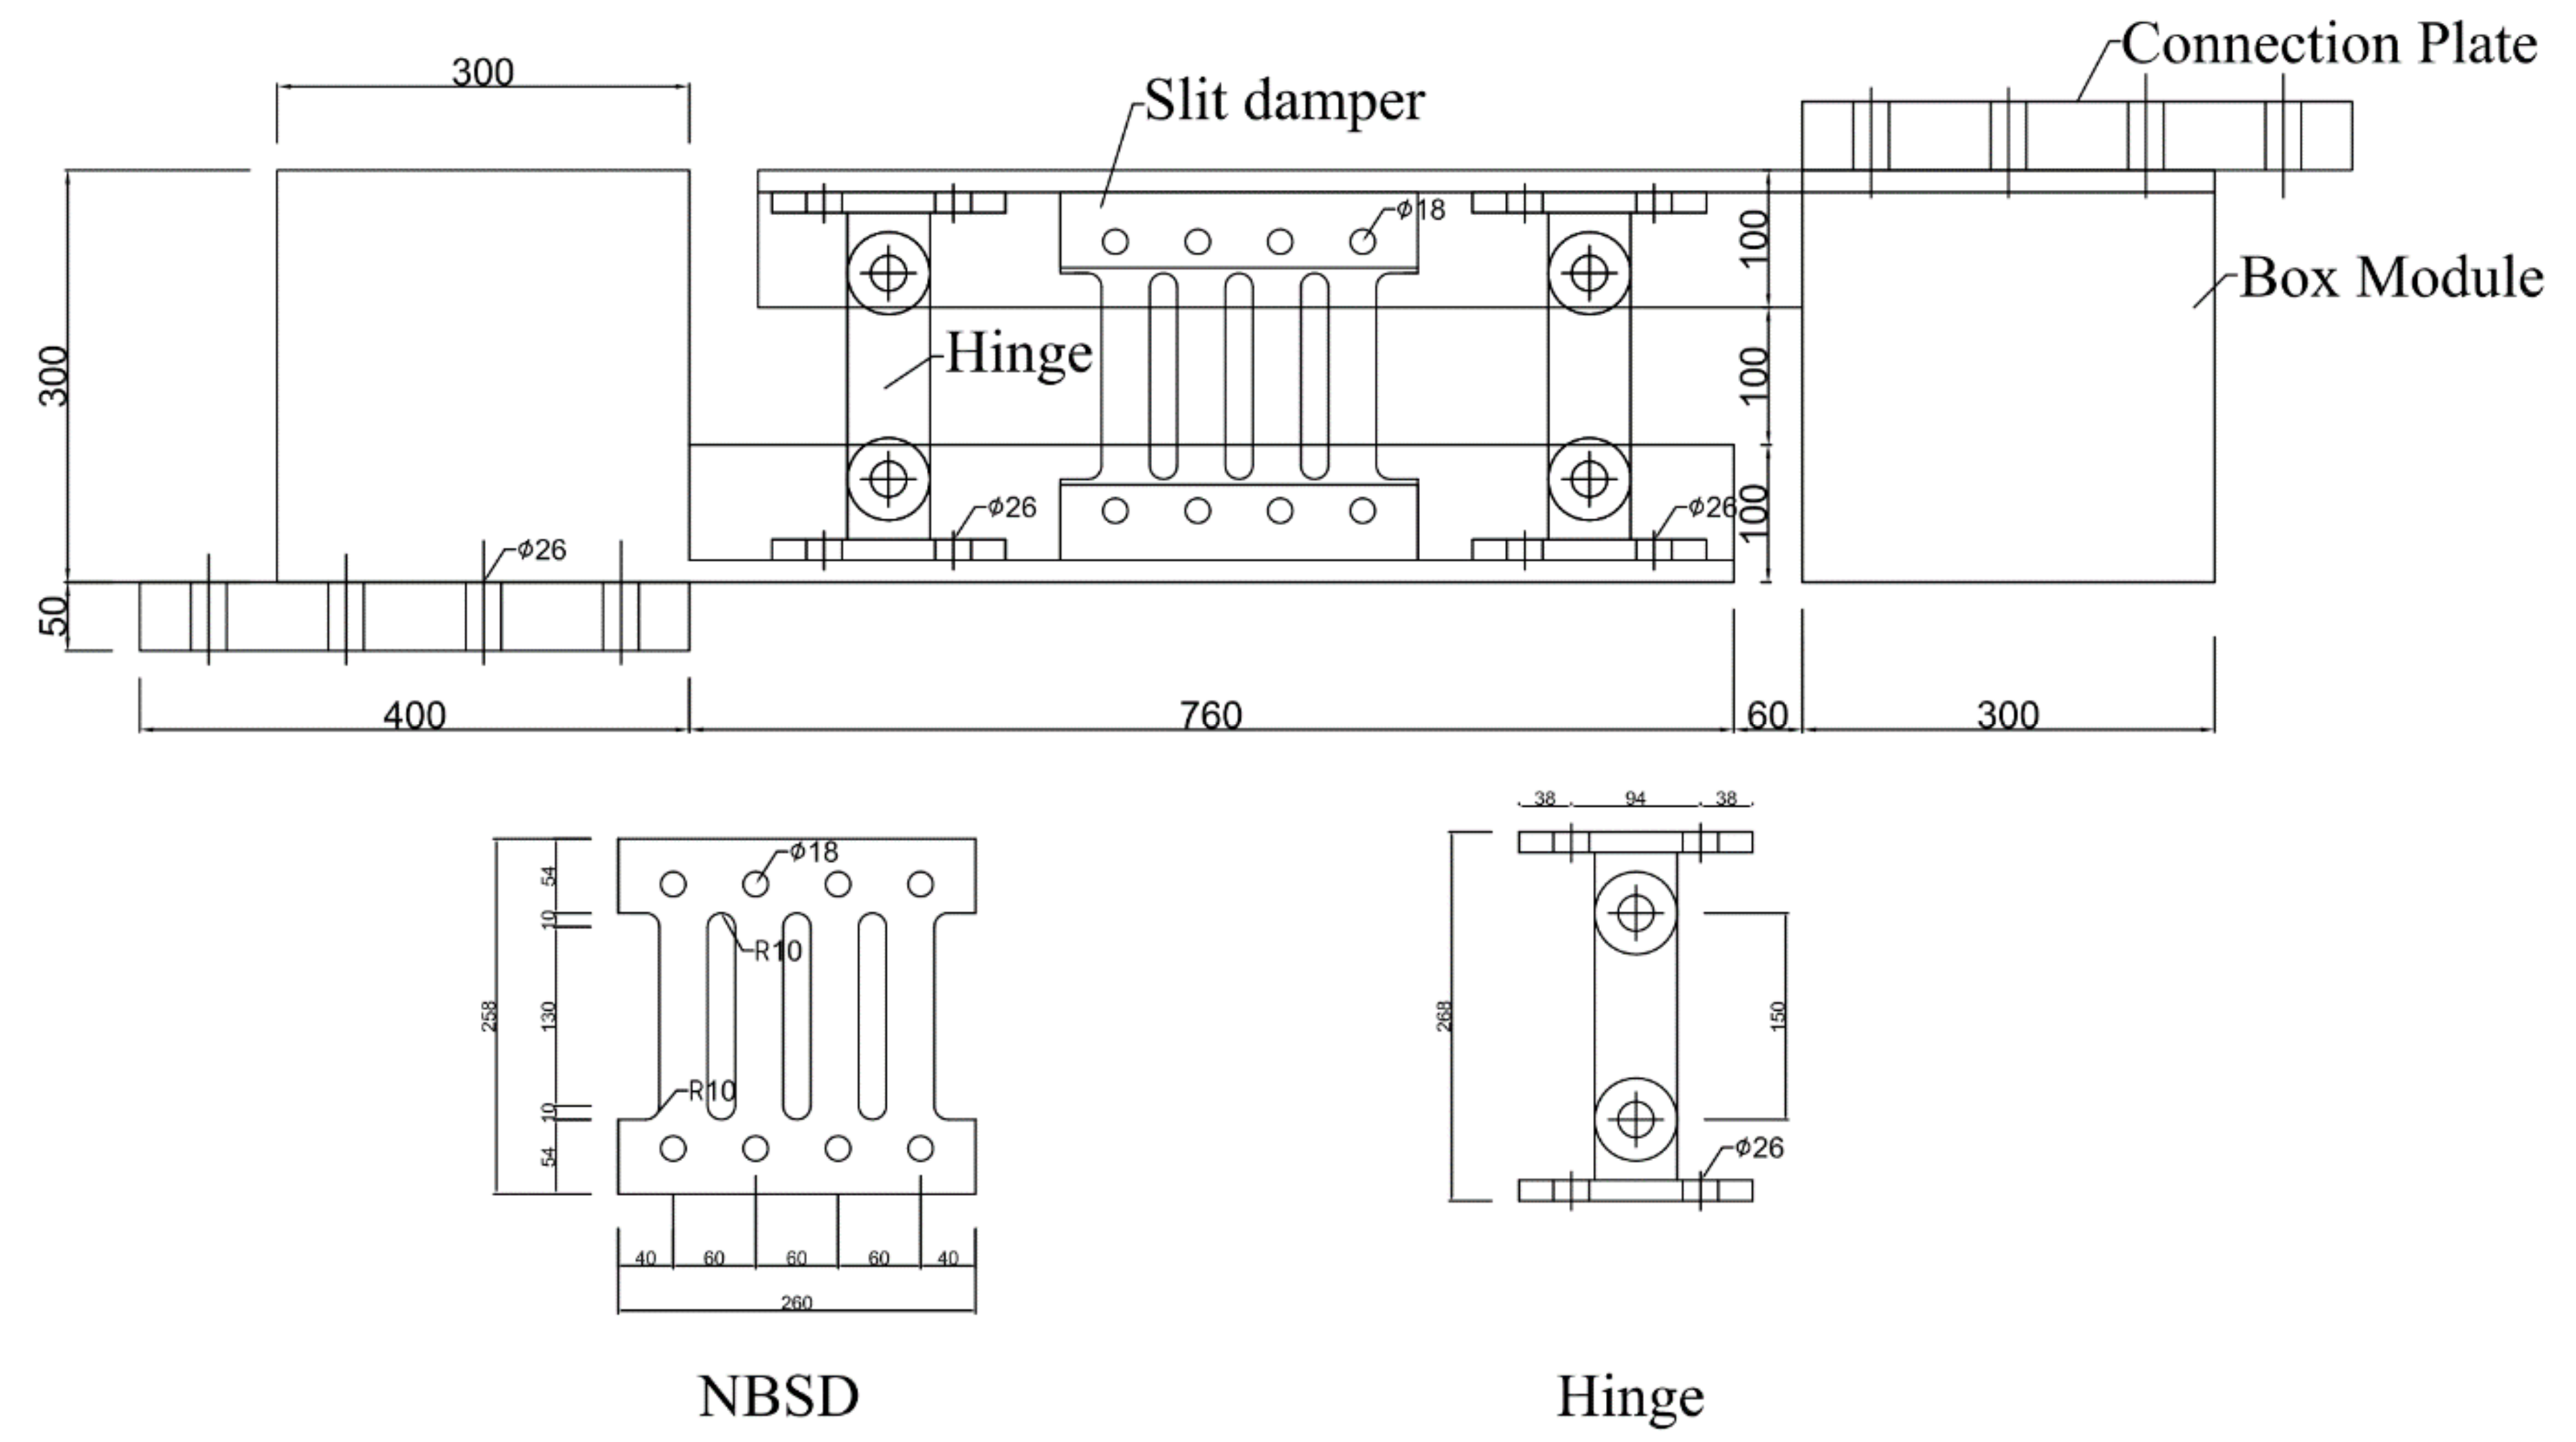
3.1. Material Test Plans for NBSDs and Their Mechanical Properties
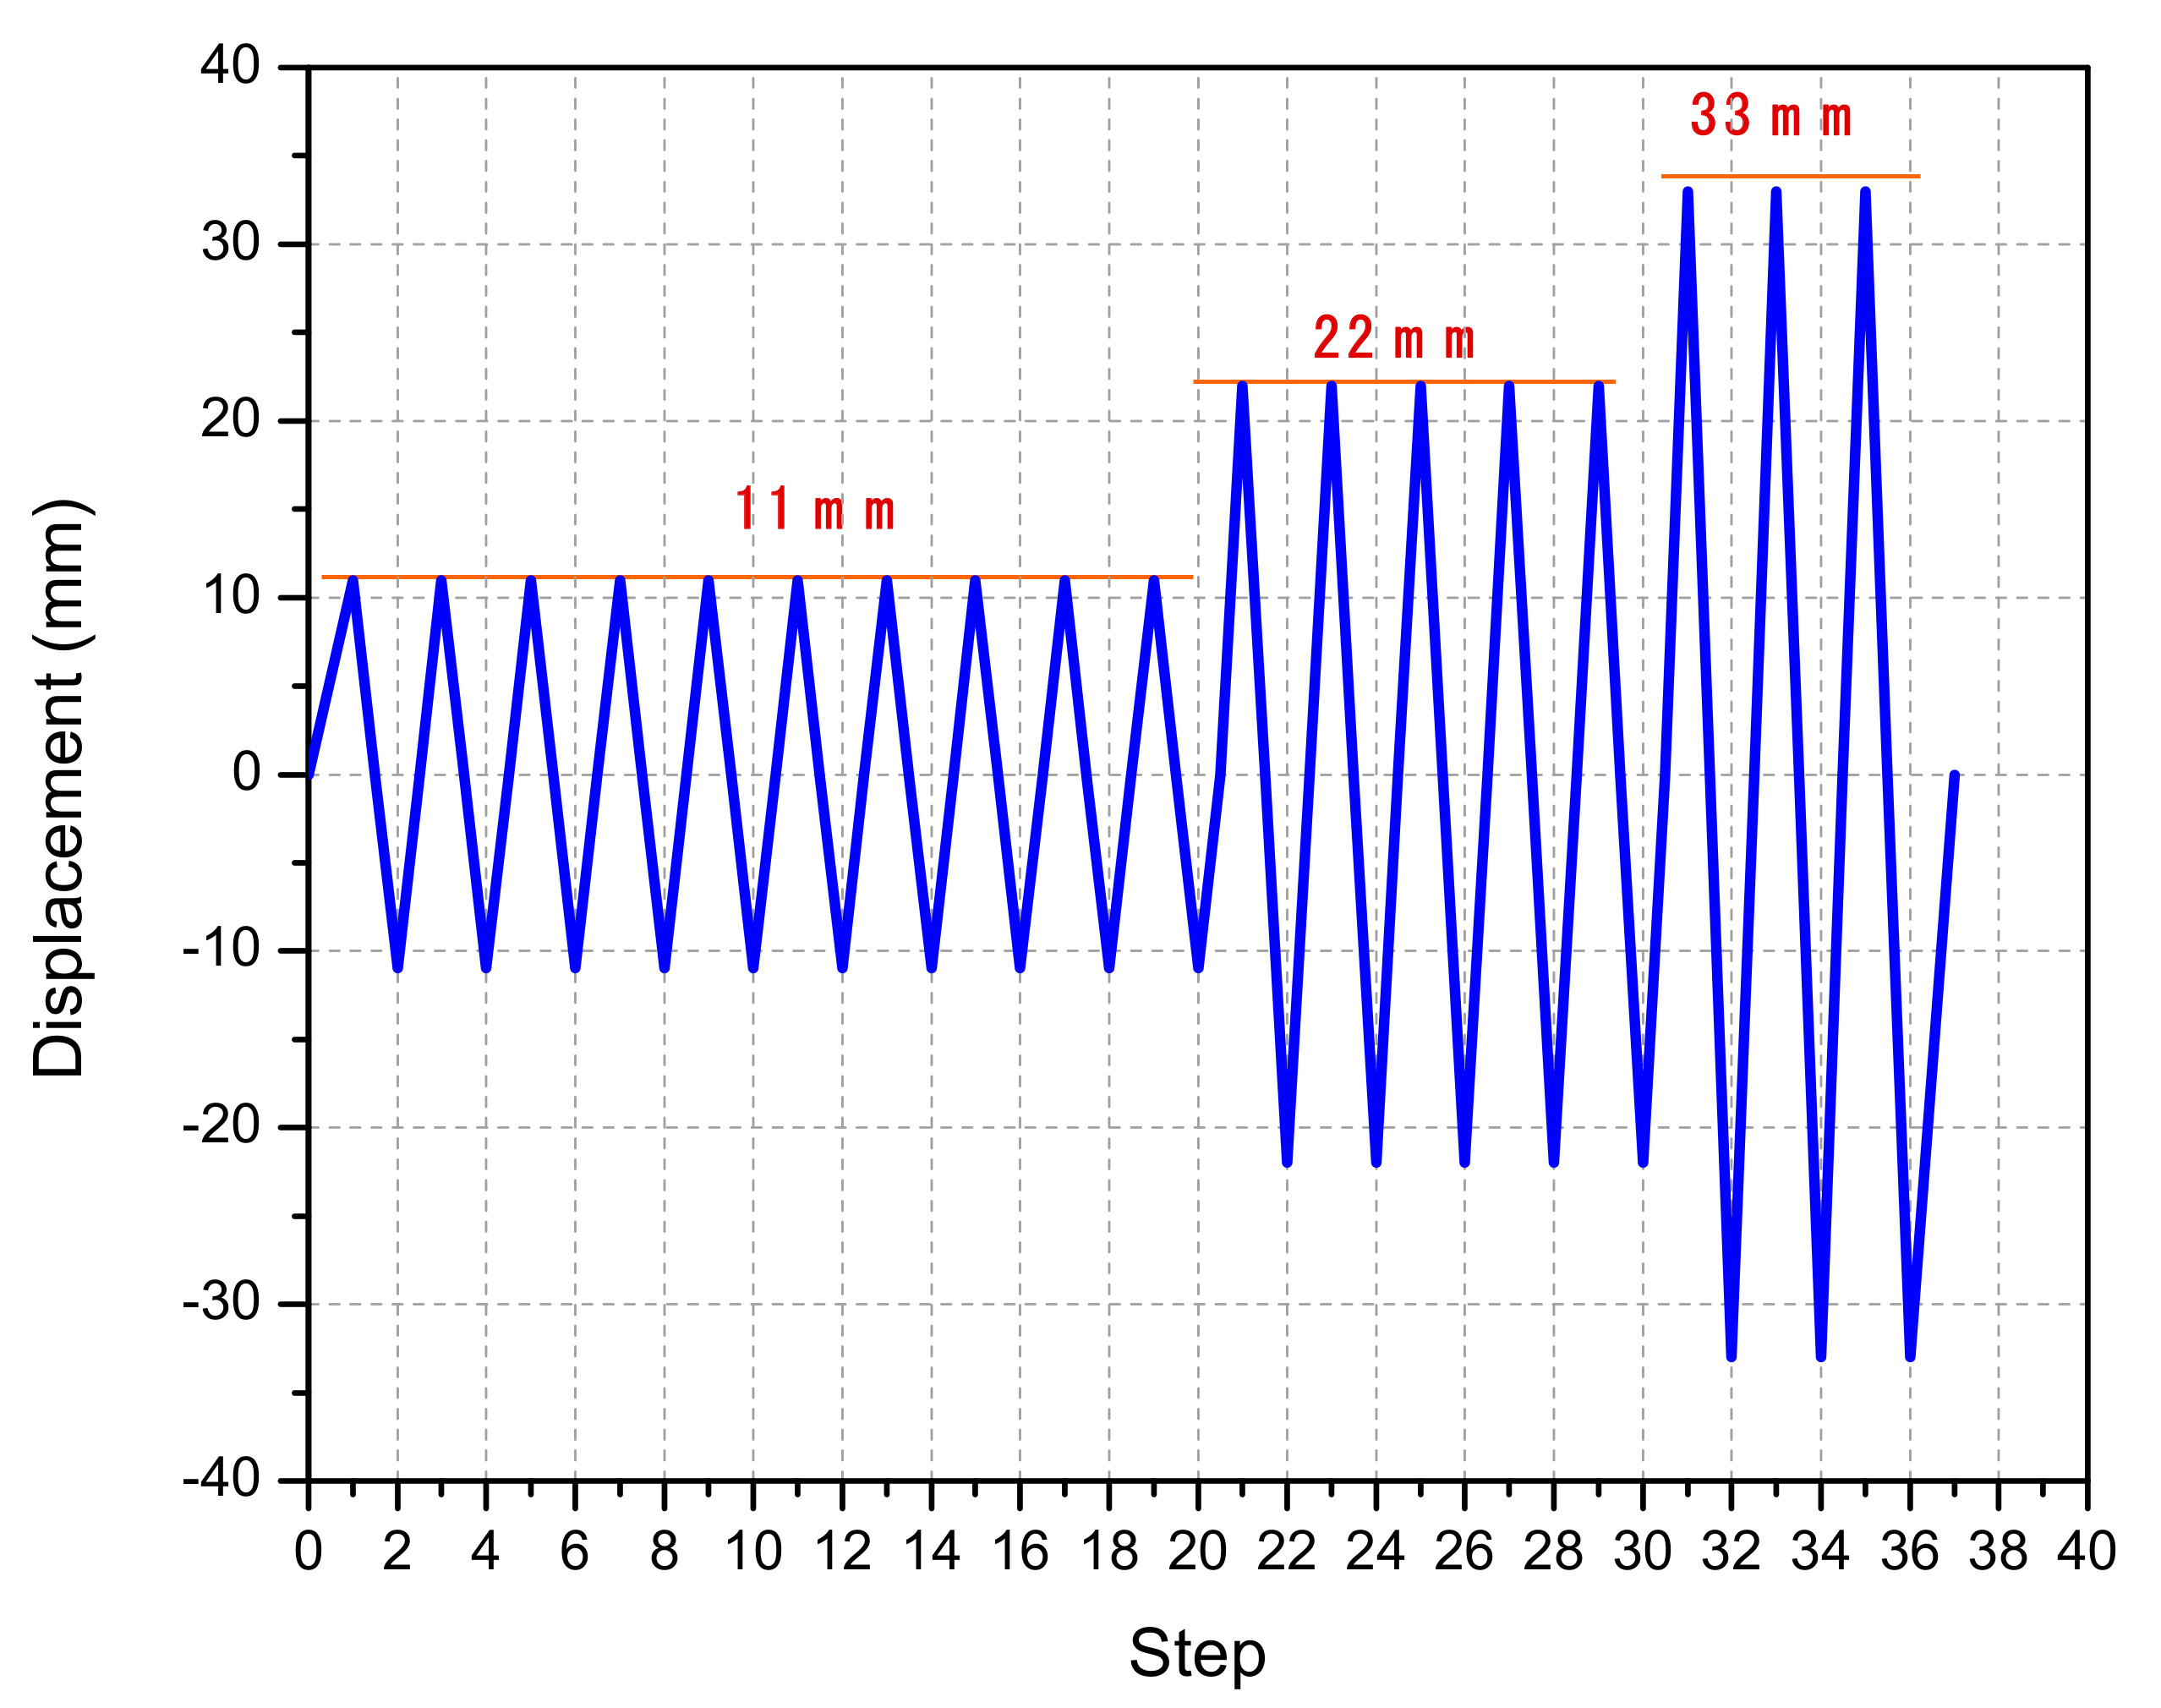
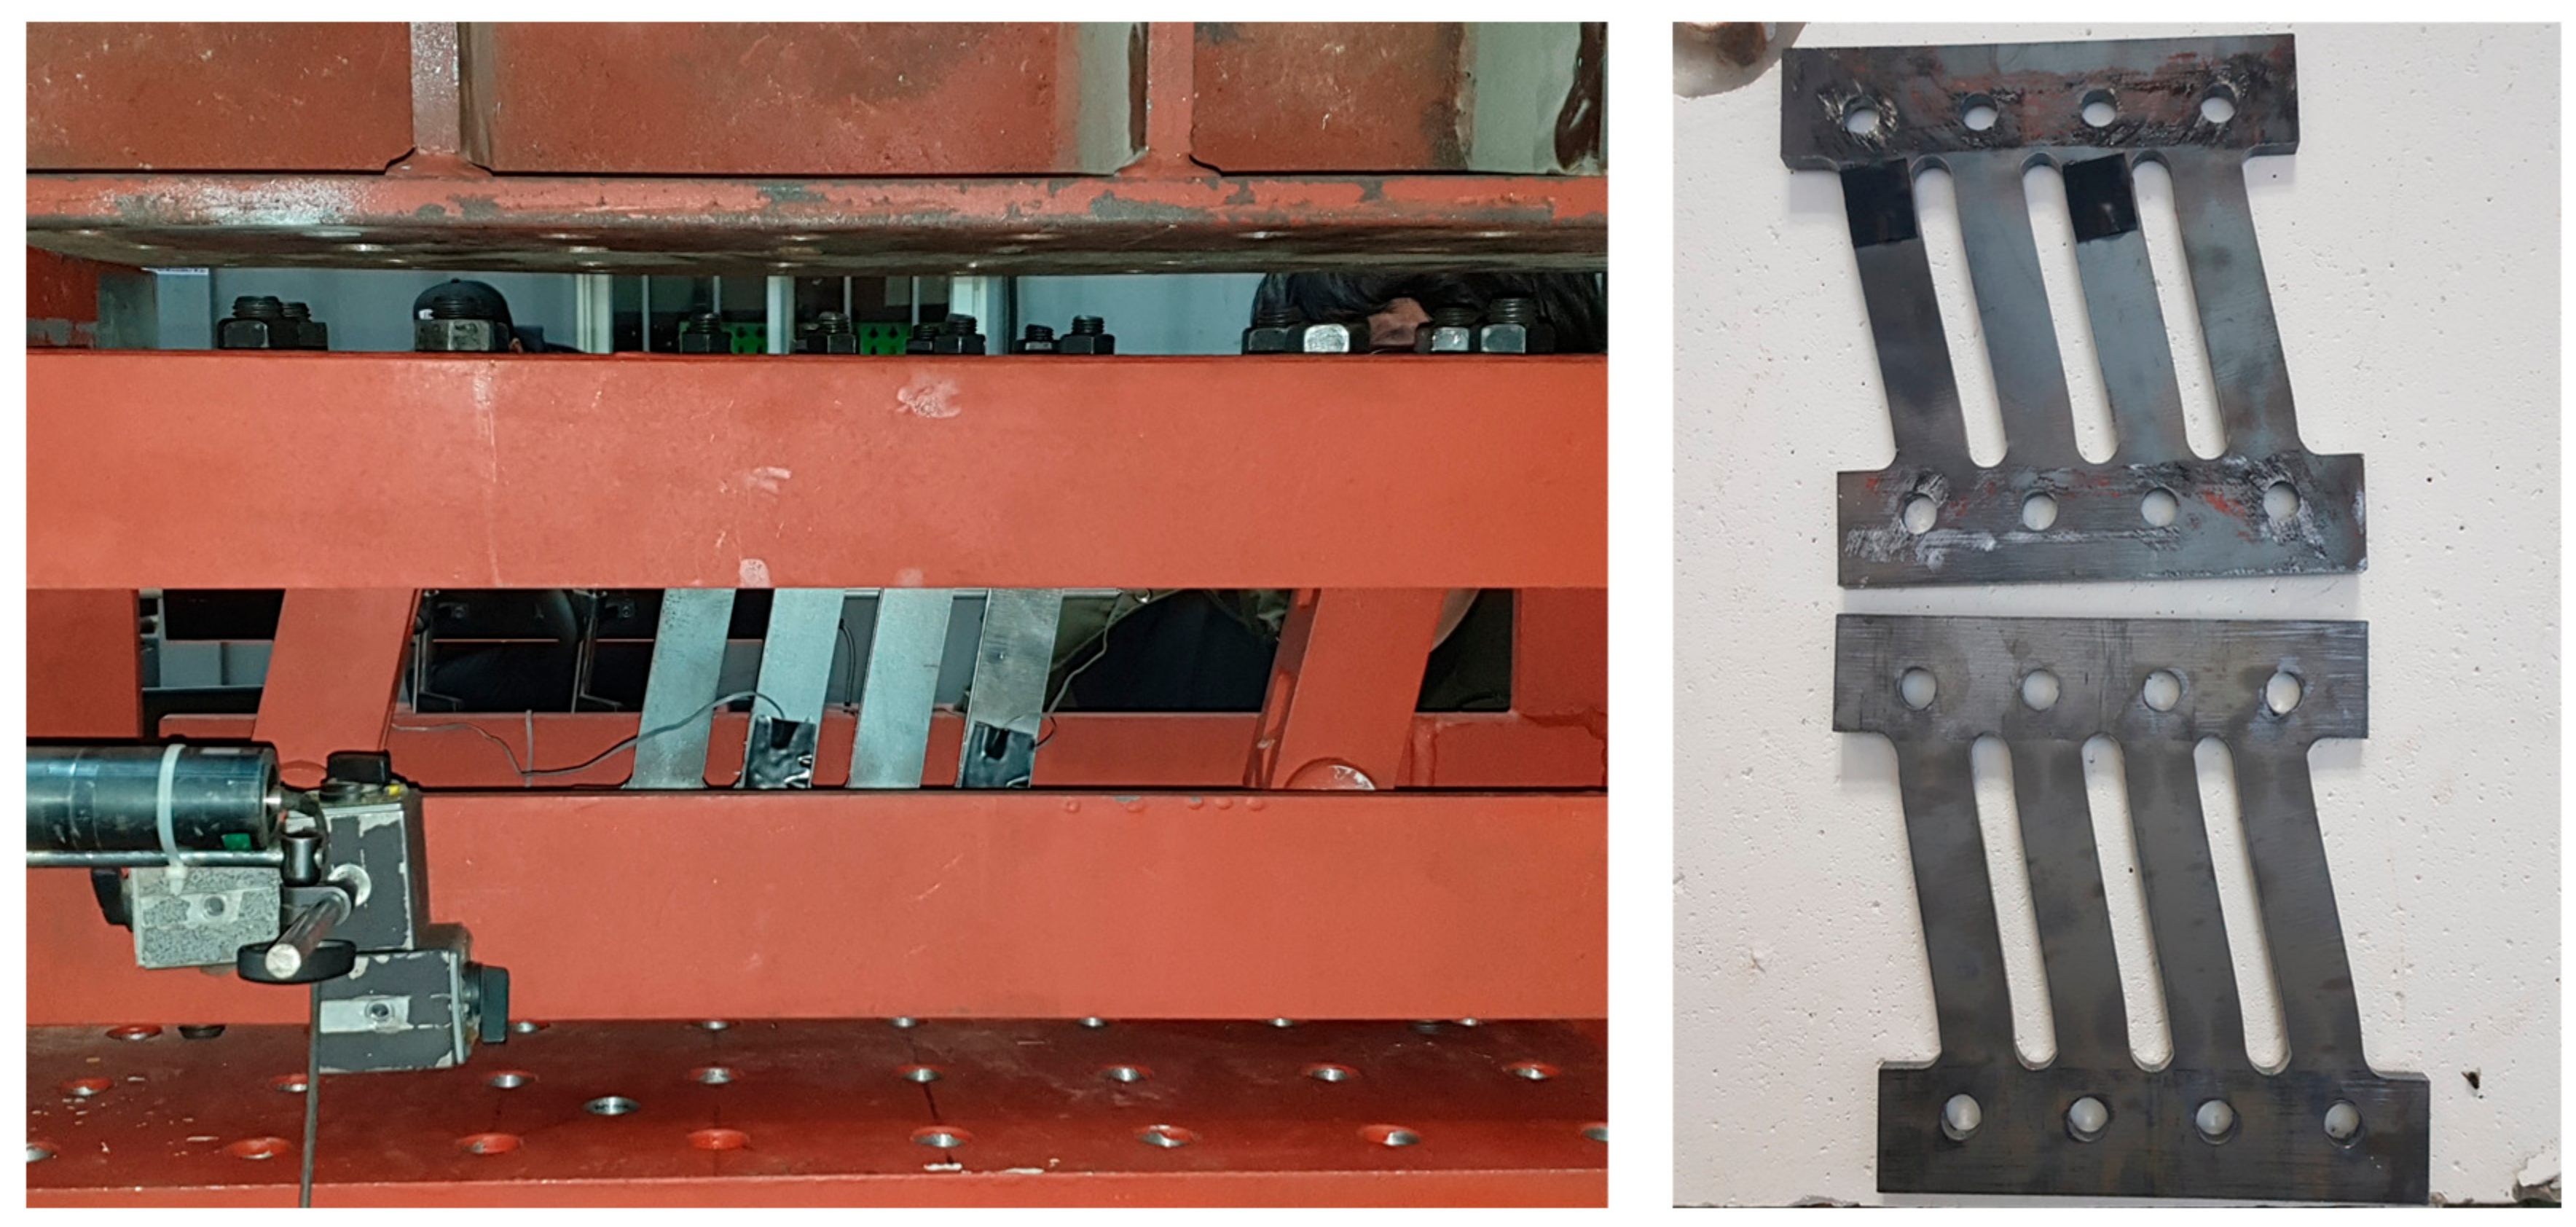
3.2. NBSD Material Test Loading and Measurement Methods
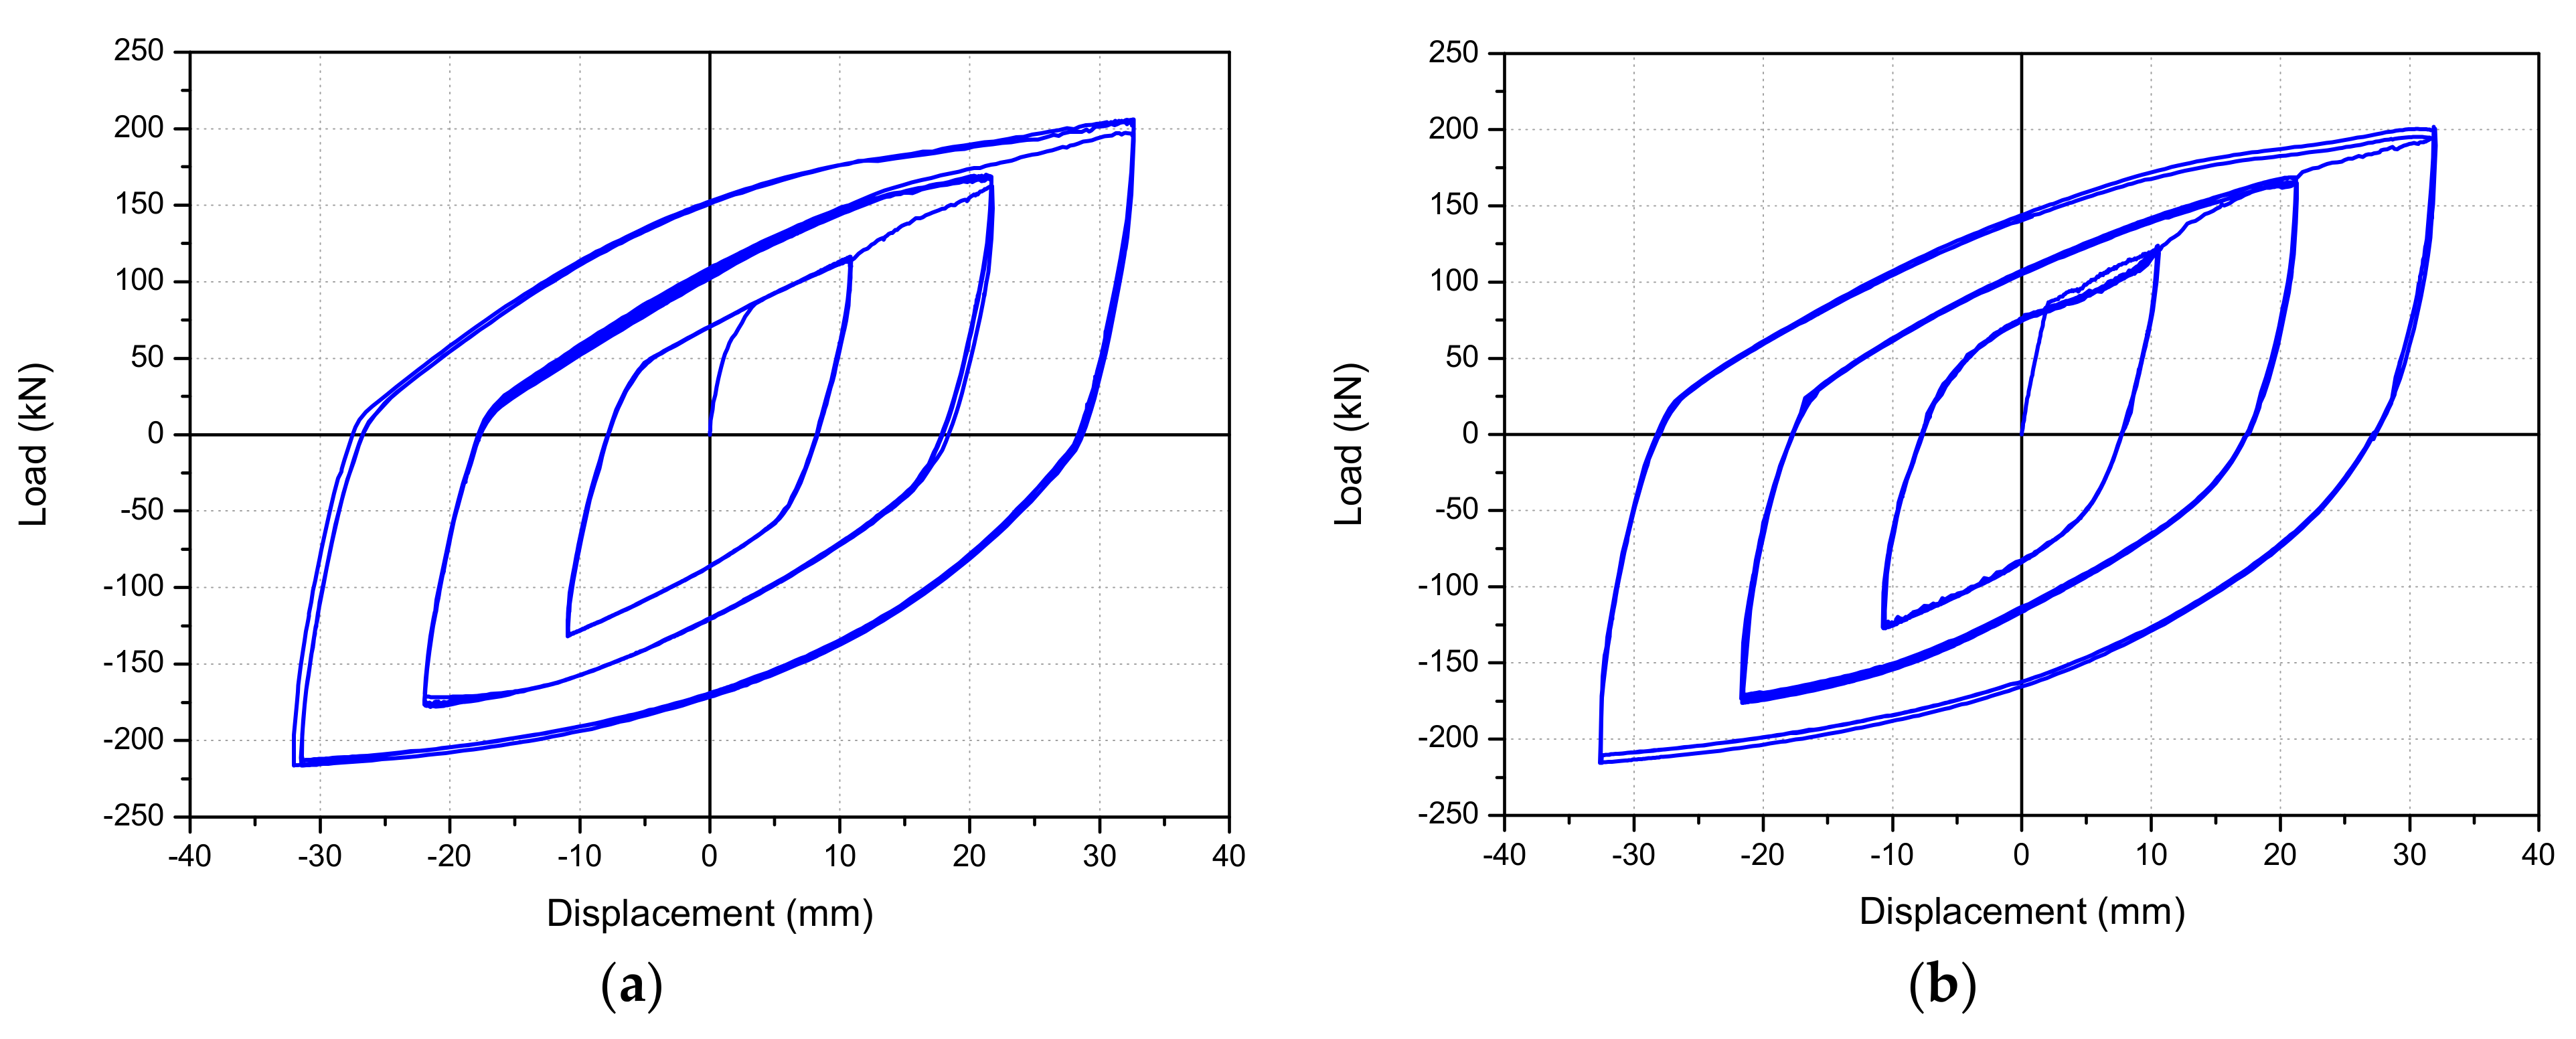
3.3. NBSD Material Test Results and Analysis
- (1)
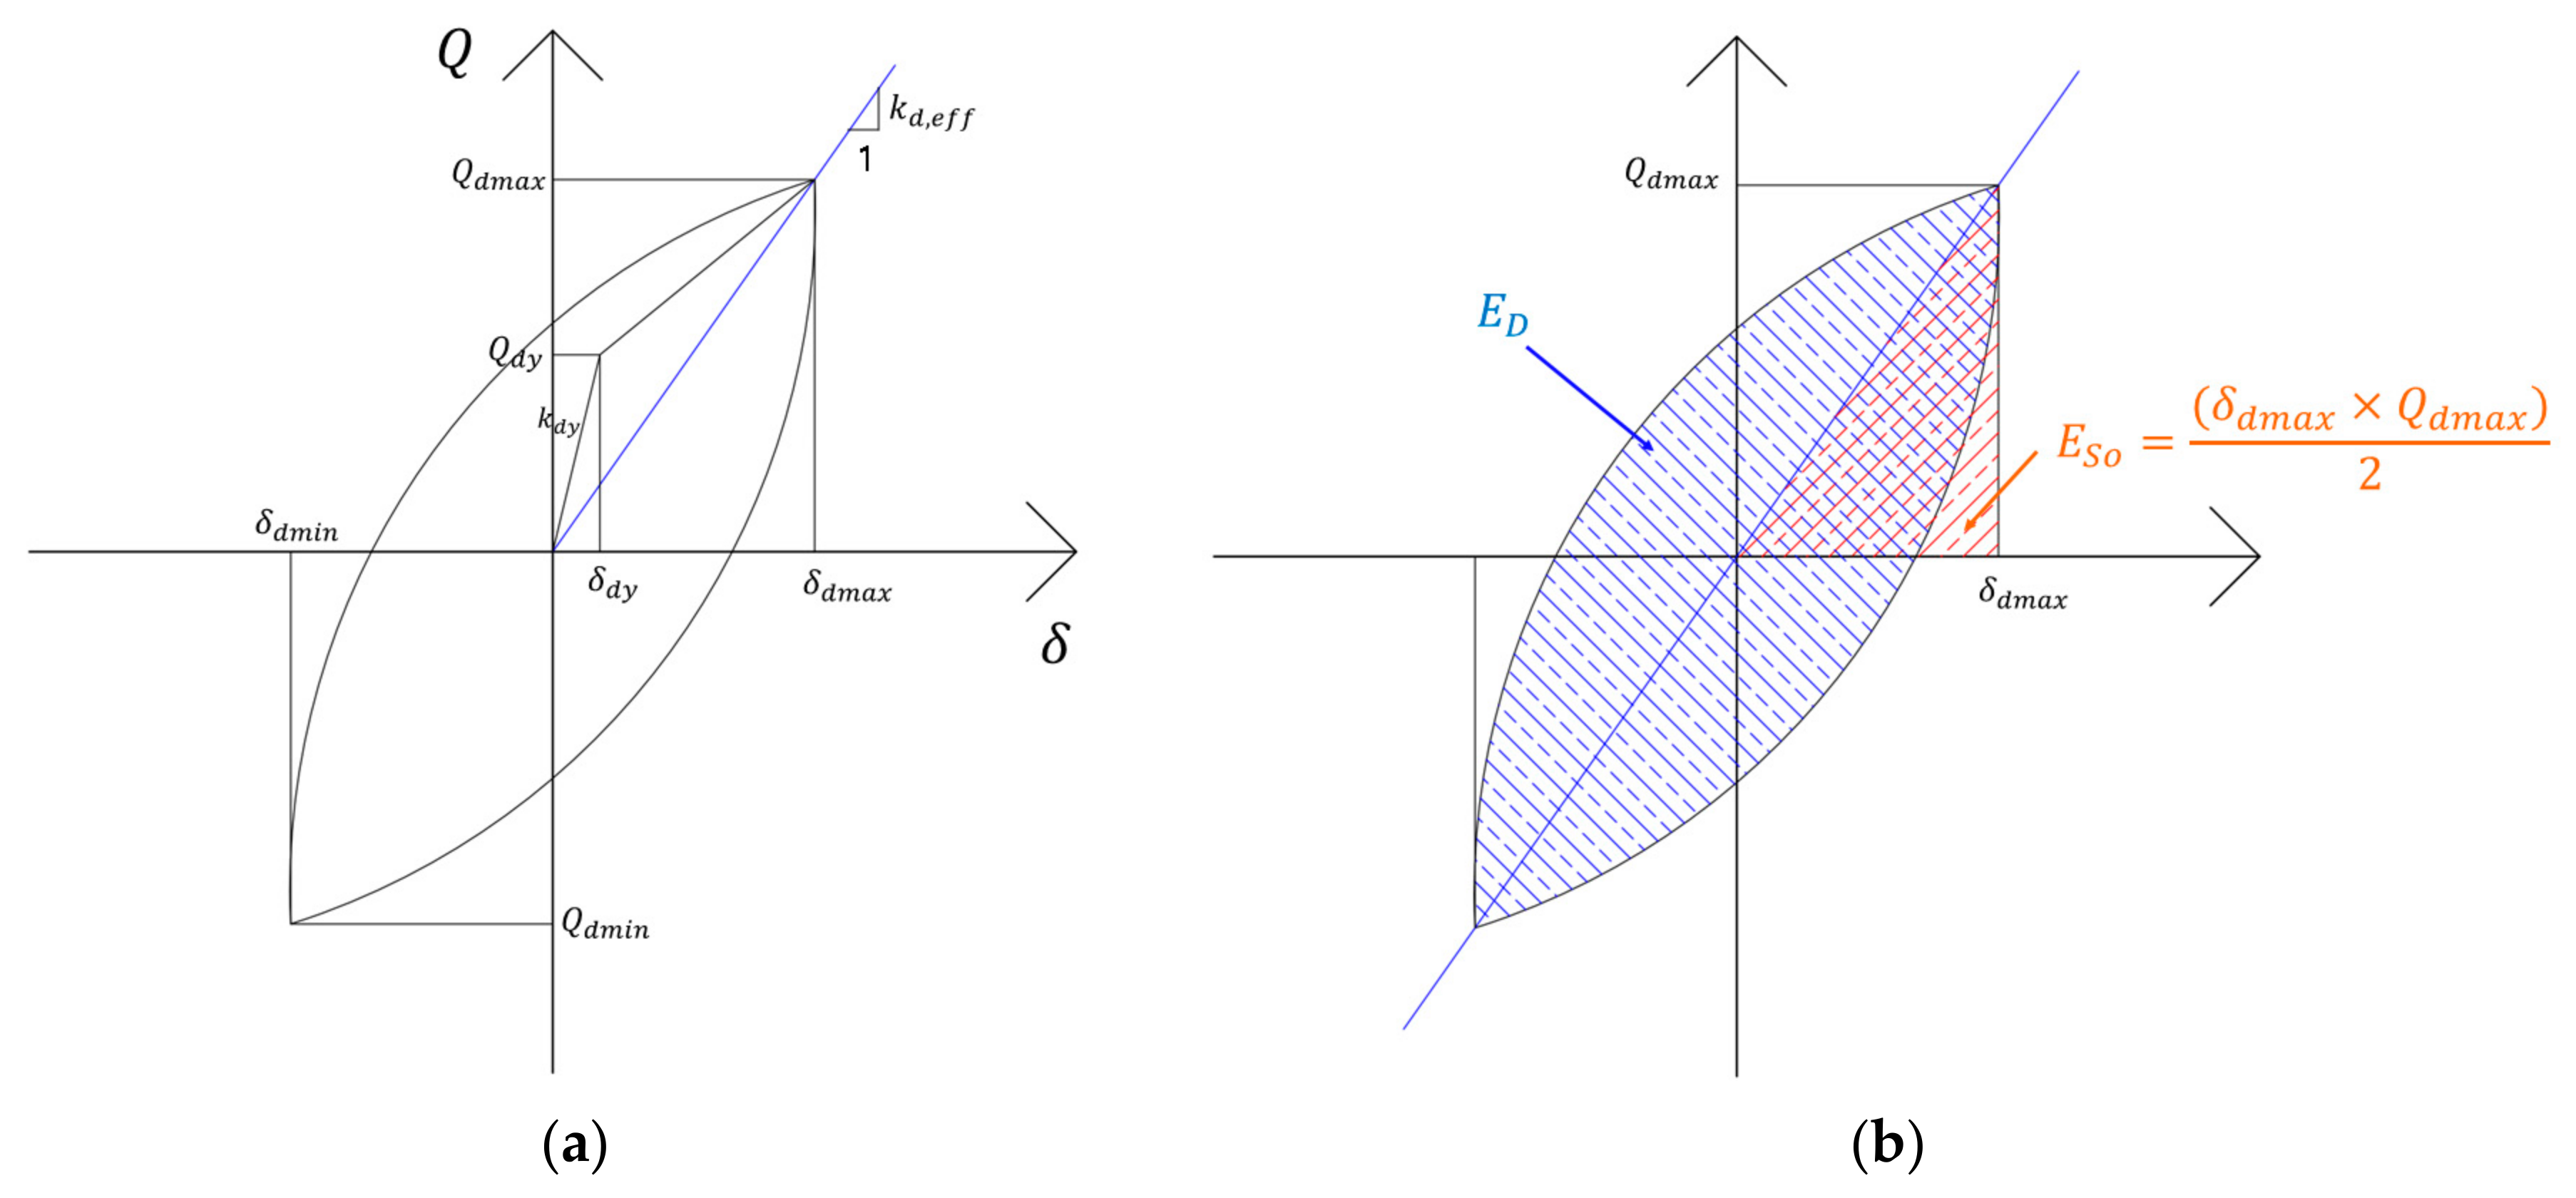
- Load-displacement curves
- (2)
- Equivalent damping ratios and energy dissipation
- (3)
- Performance criteria for the NBSD-based seismic control system
4. Overview of Pseudo-Dynamic Testing and Result Analysis
4.1. Overview of Existing Seismic Test Methods
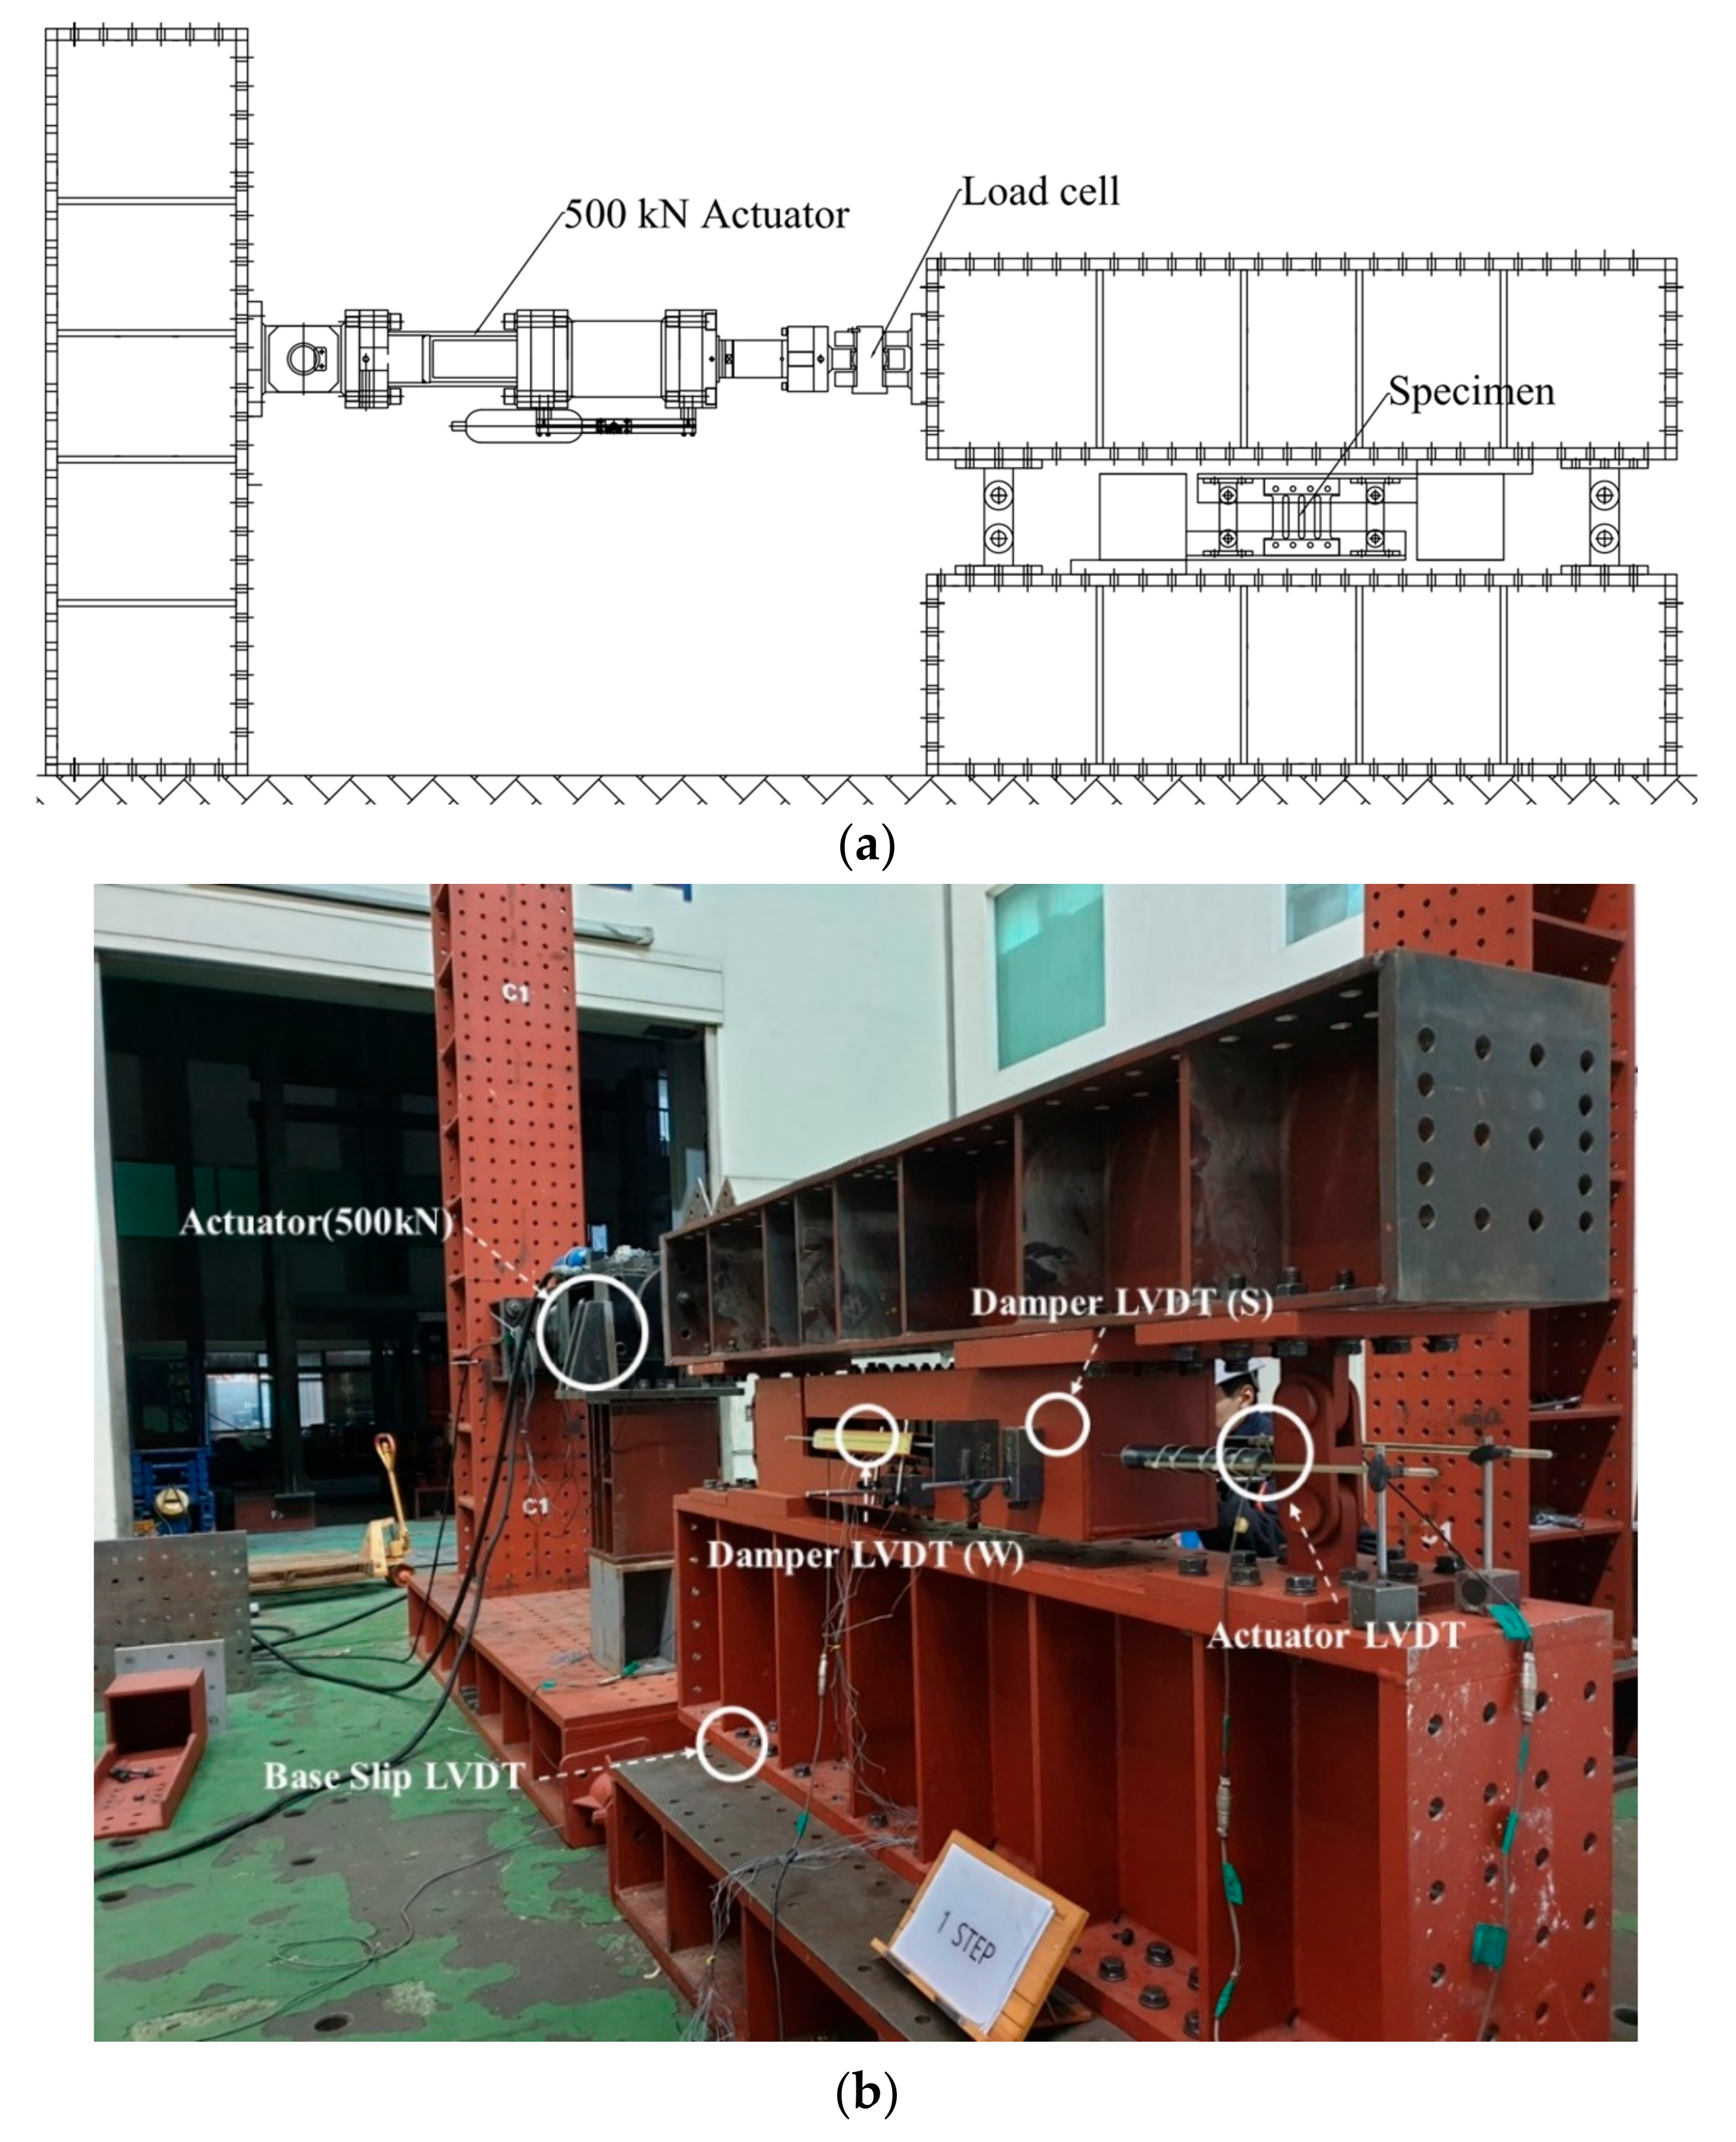
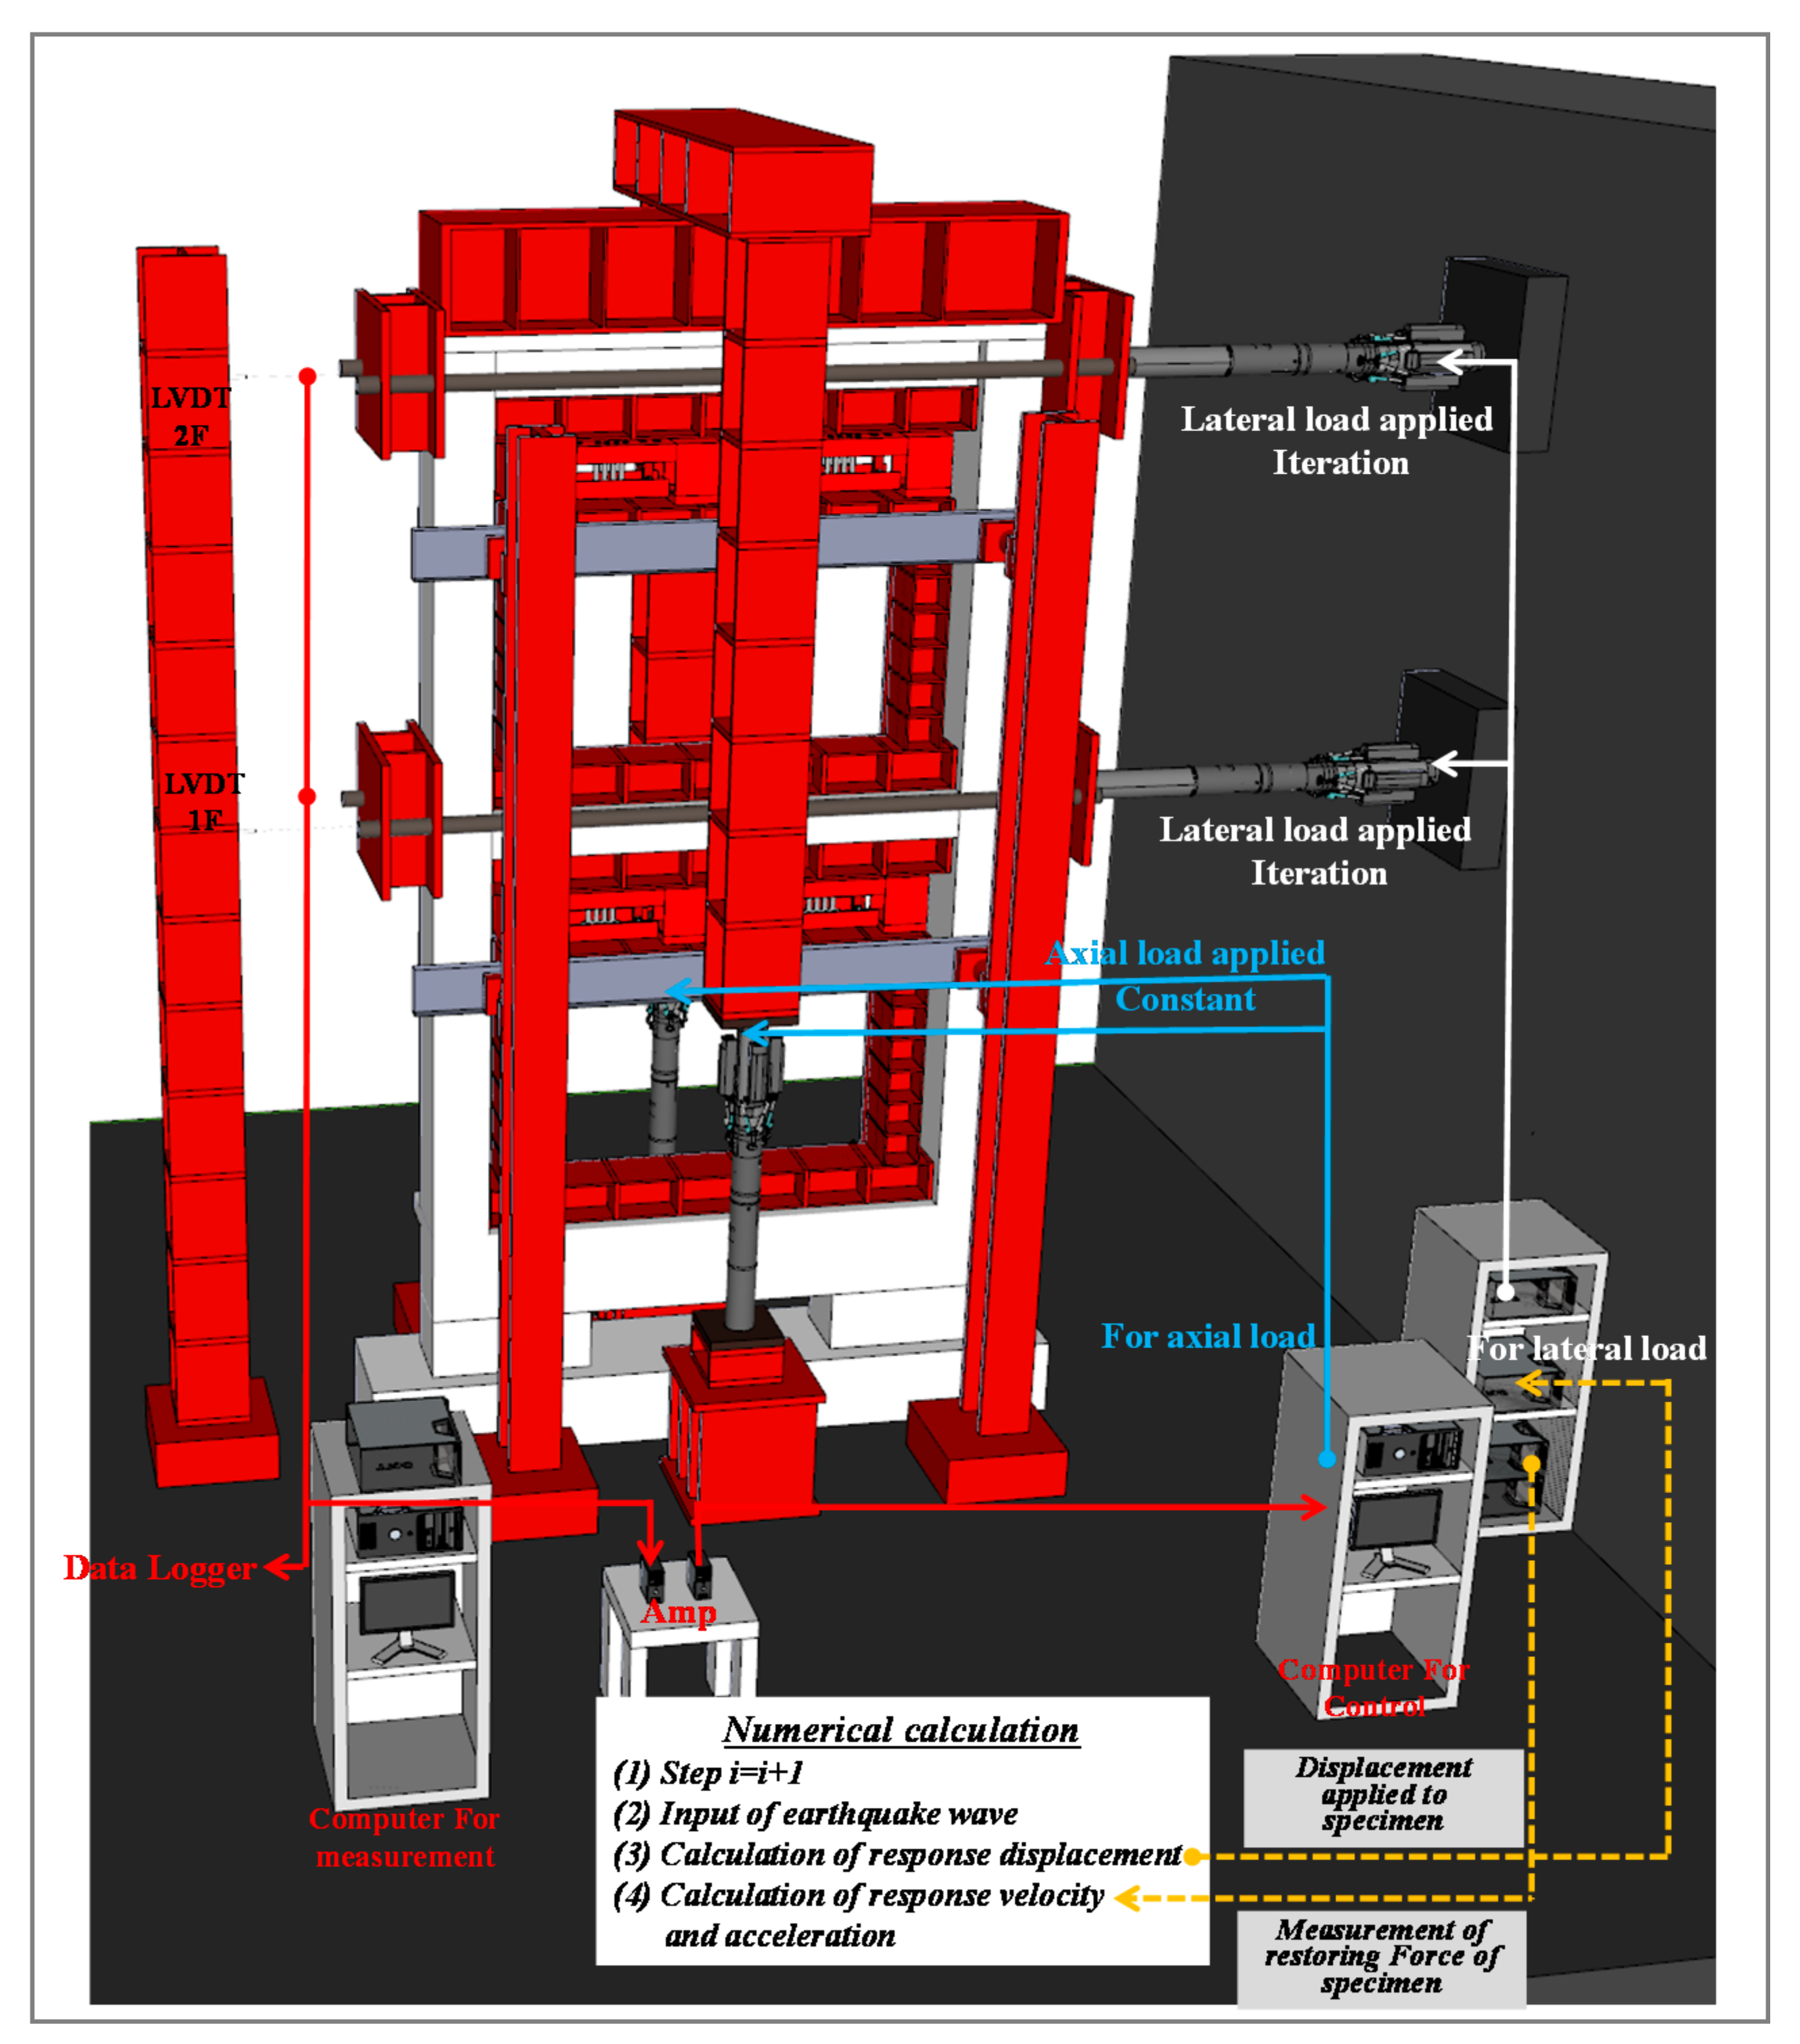
4.2. Pseudo-Dynamic Testing System and Test Methods
4.3. Used Materials and Their Properties
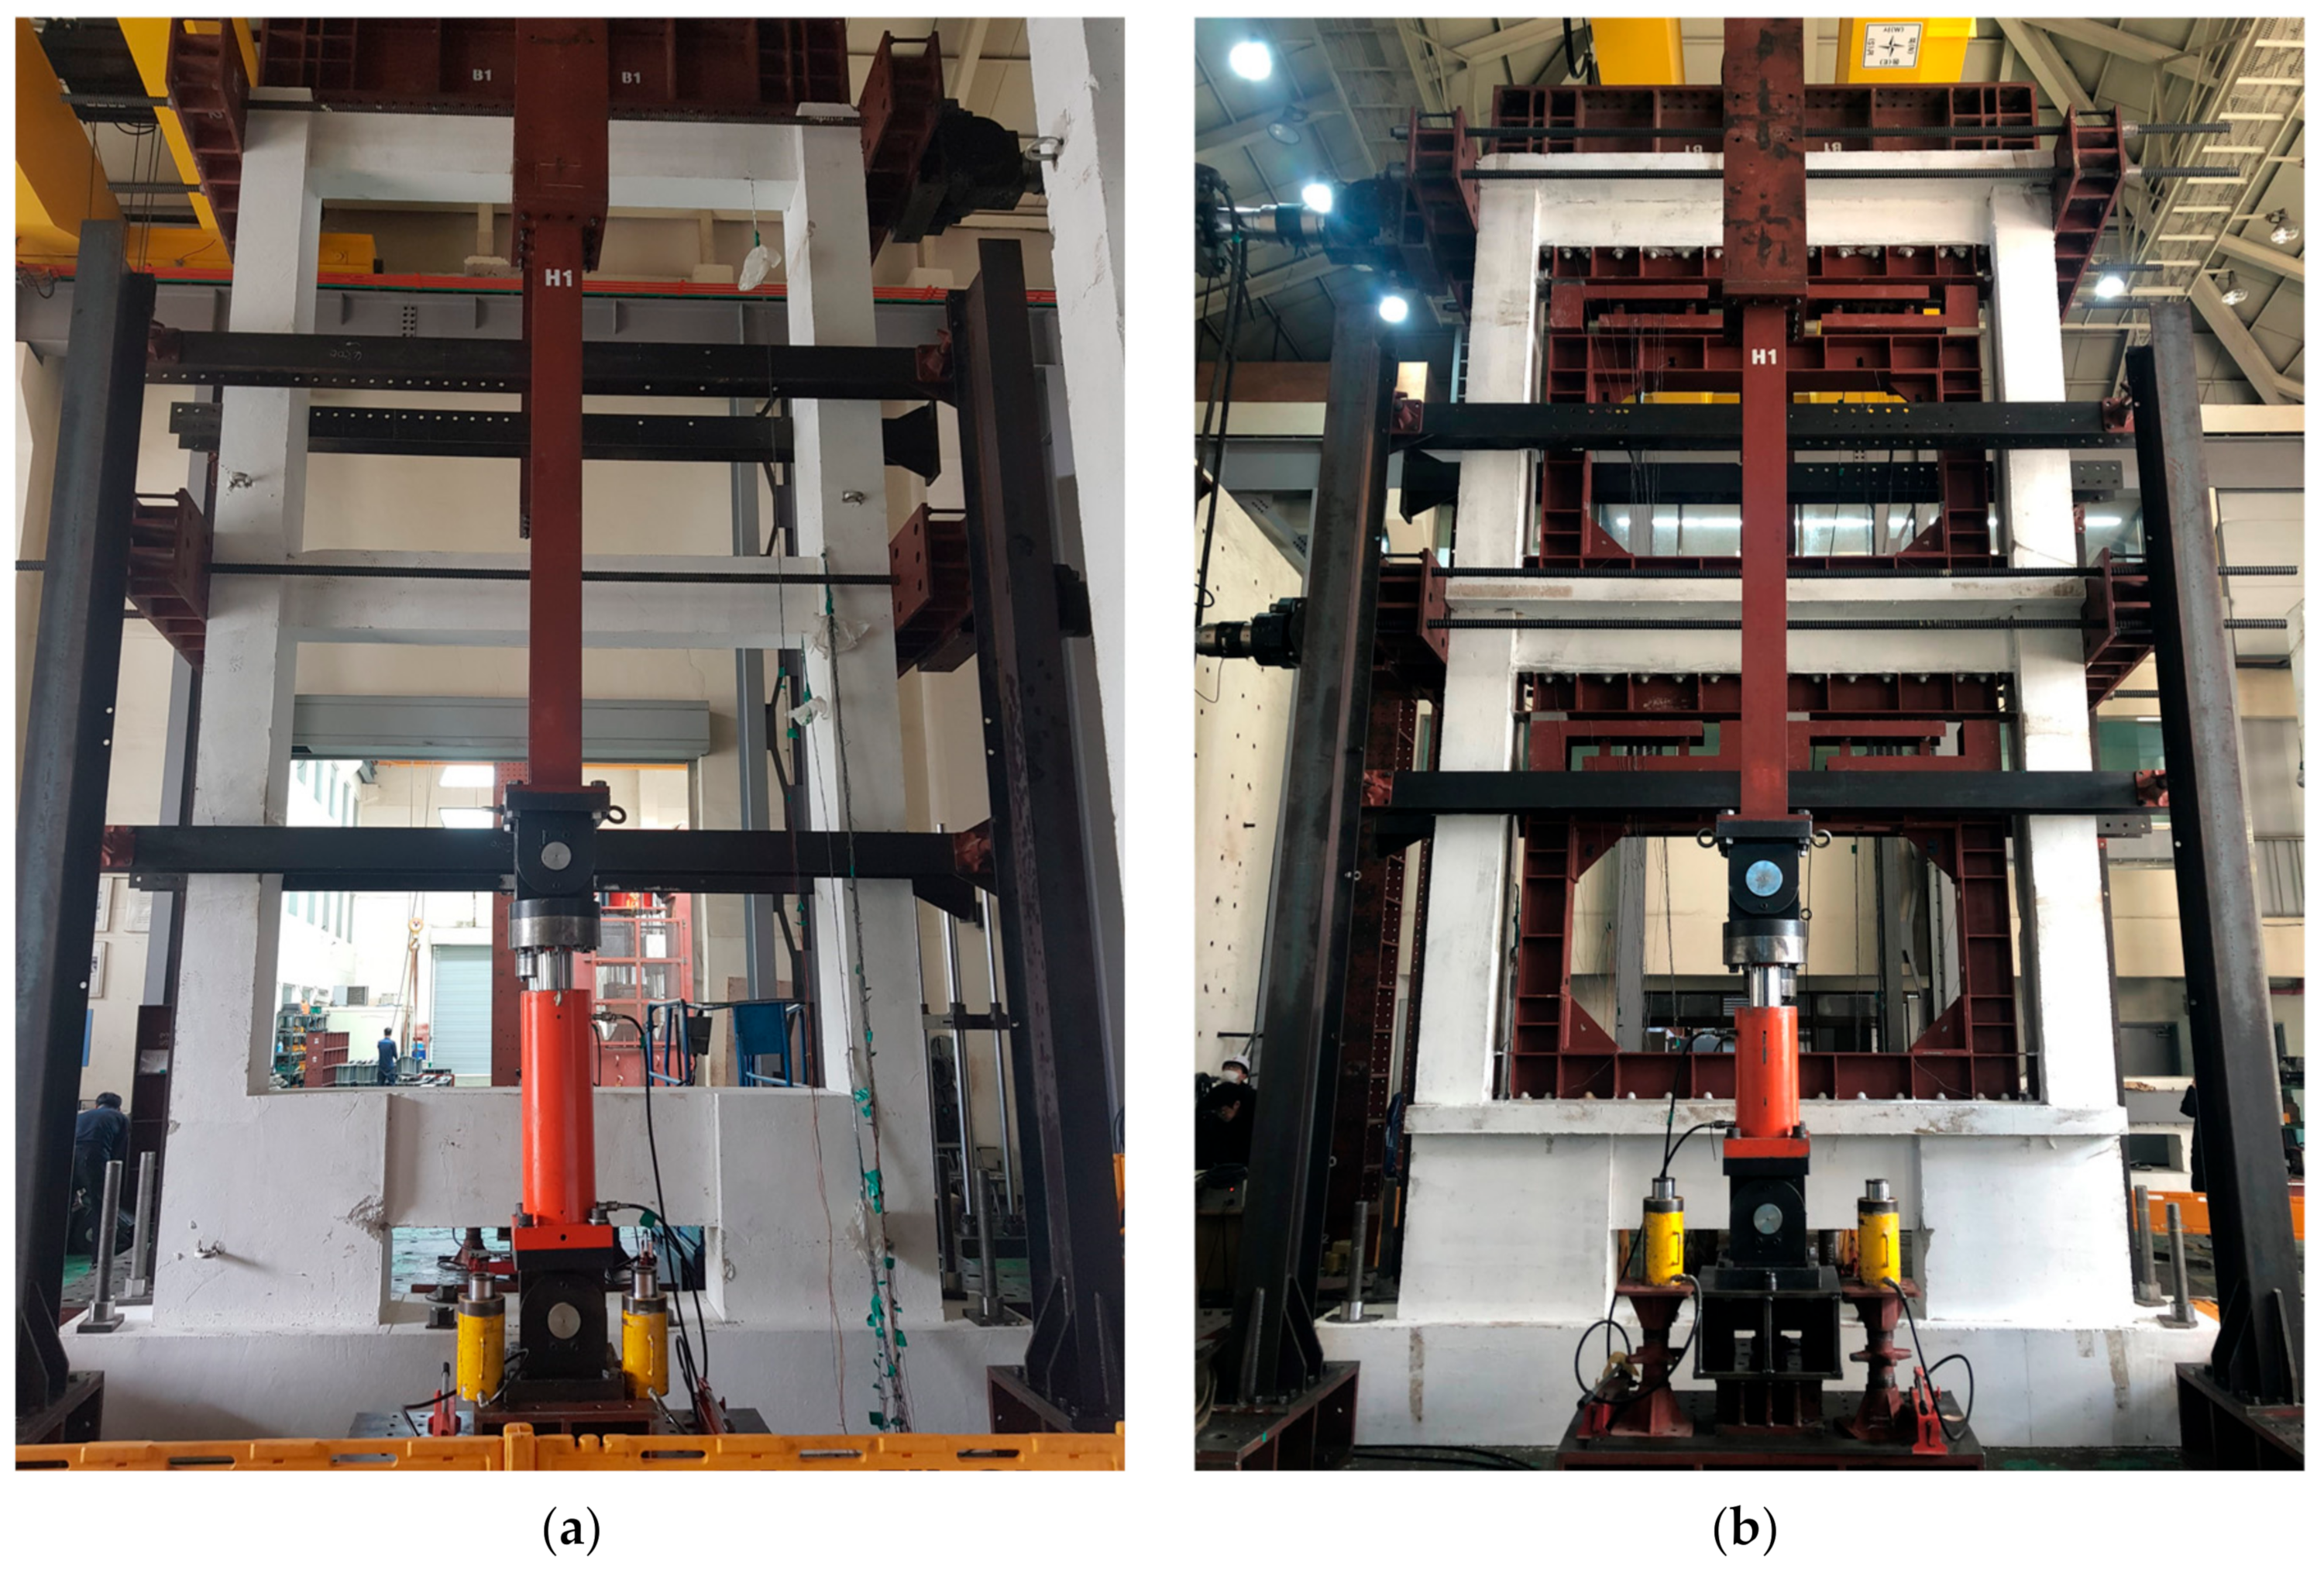
4.4. Specimen Preparation and Parameters
4.5. Experimental Results and Analysis
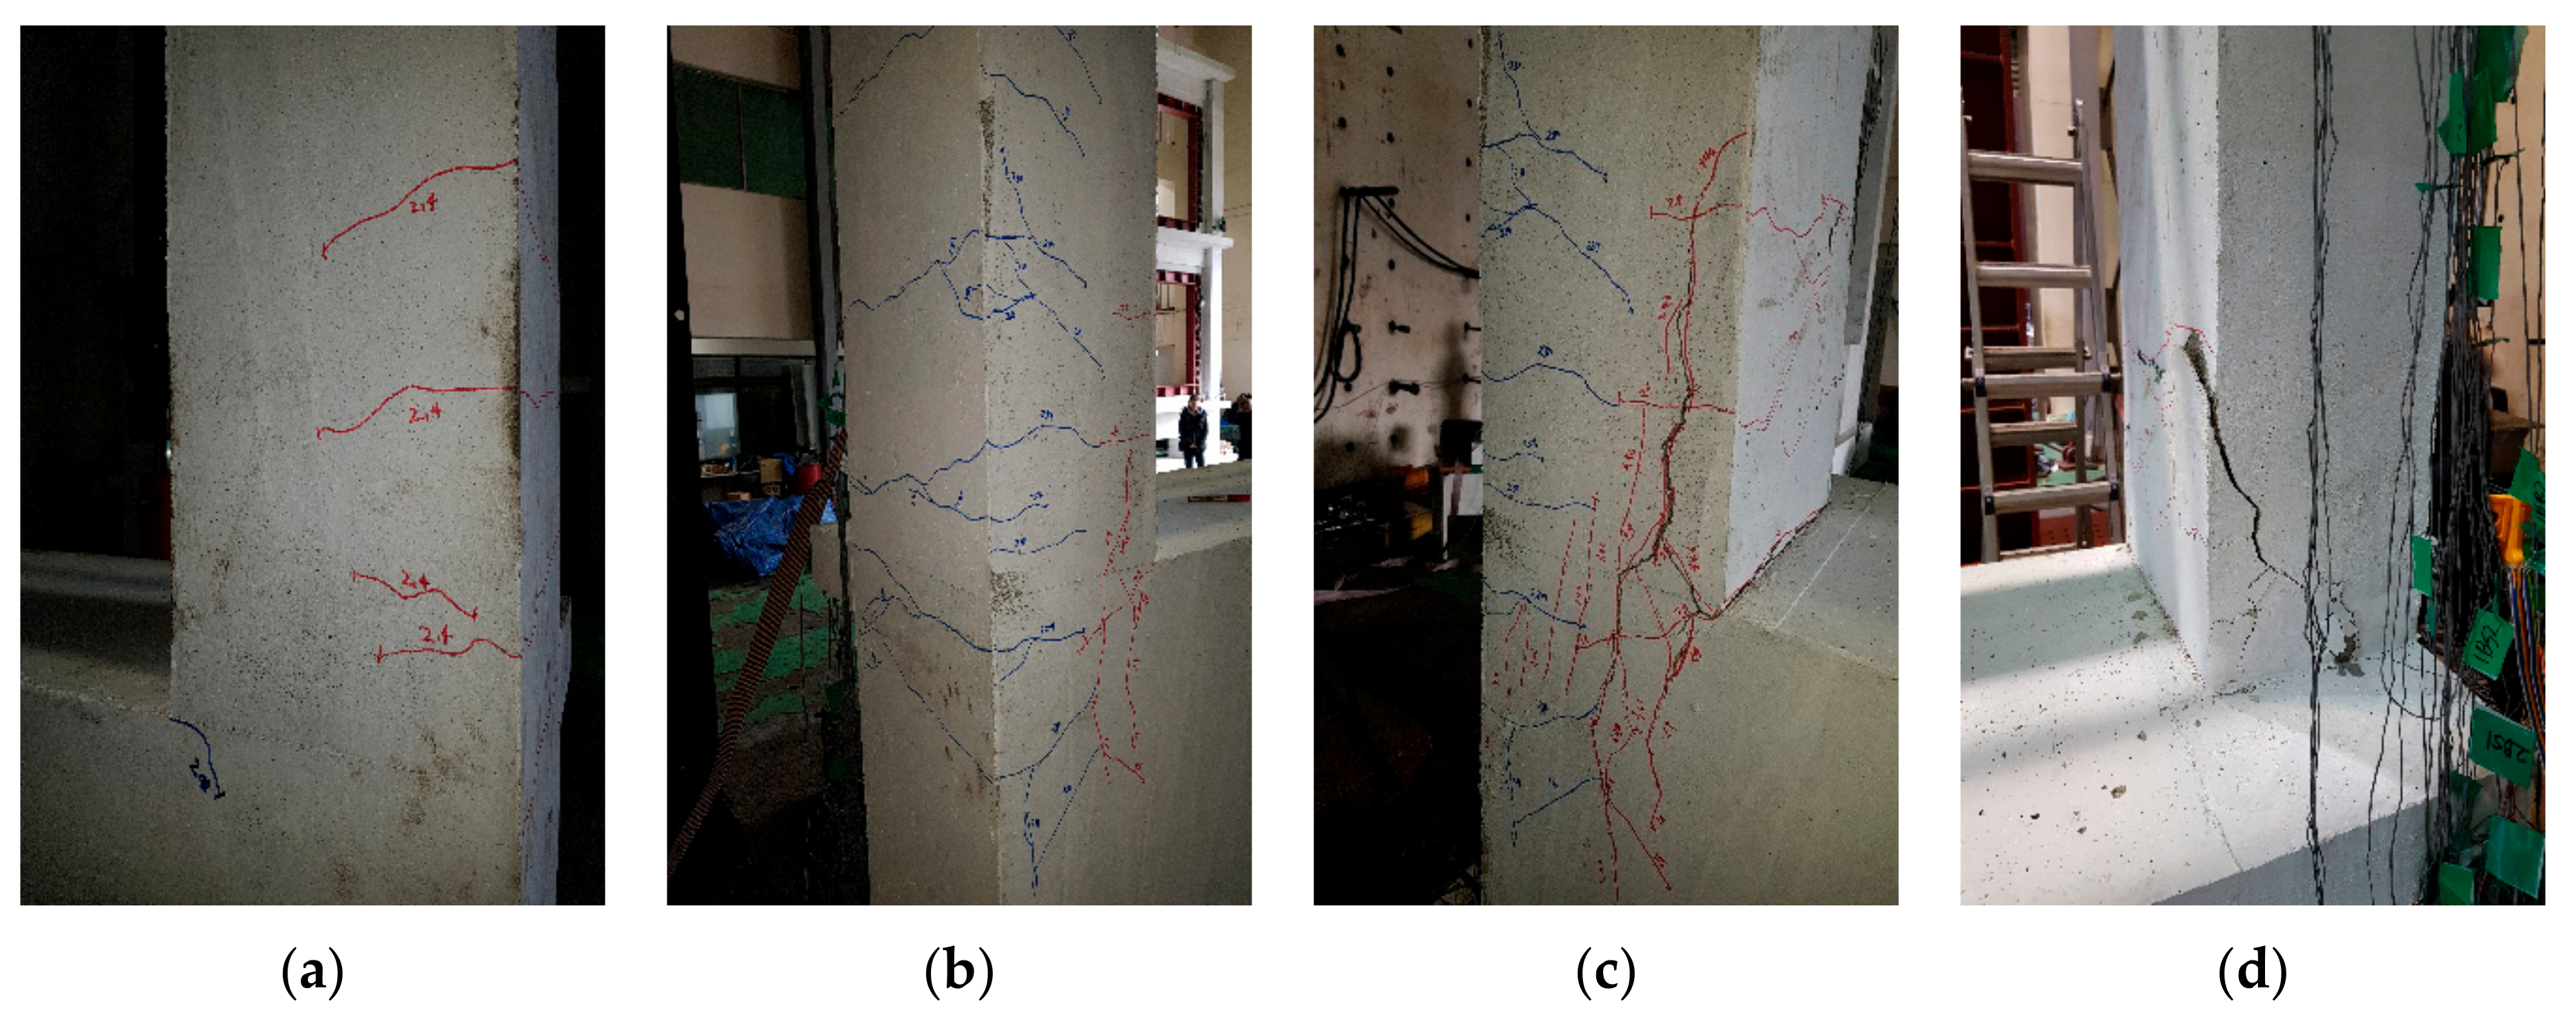
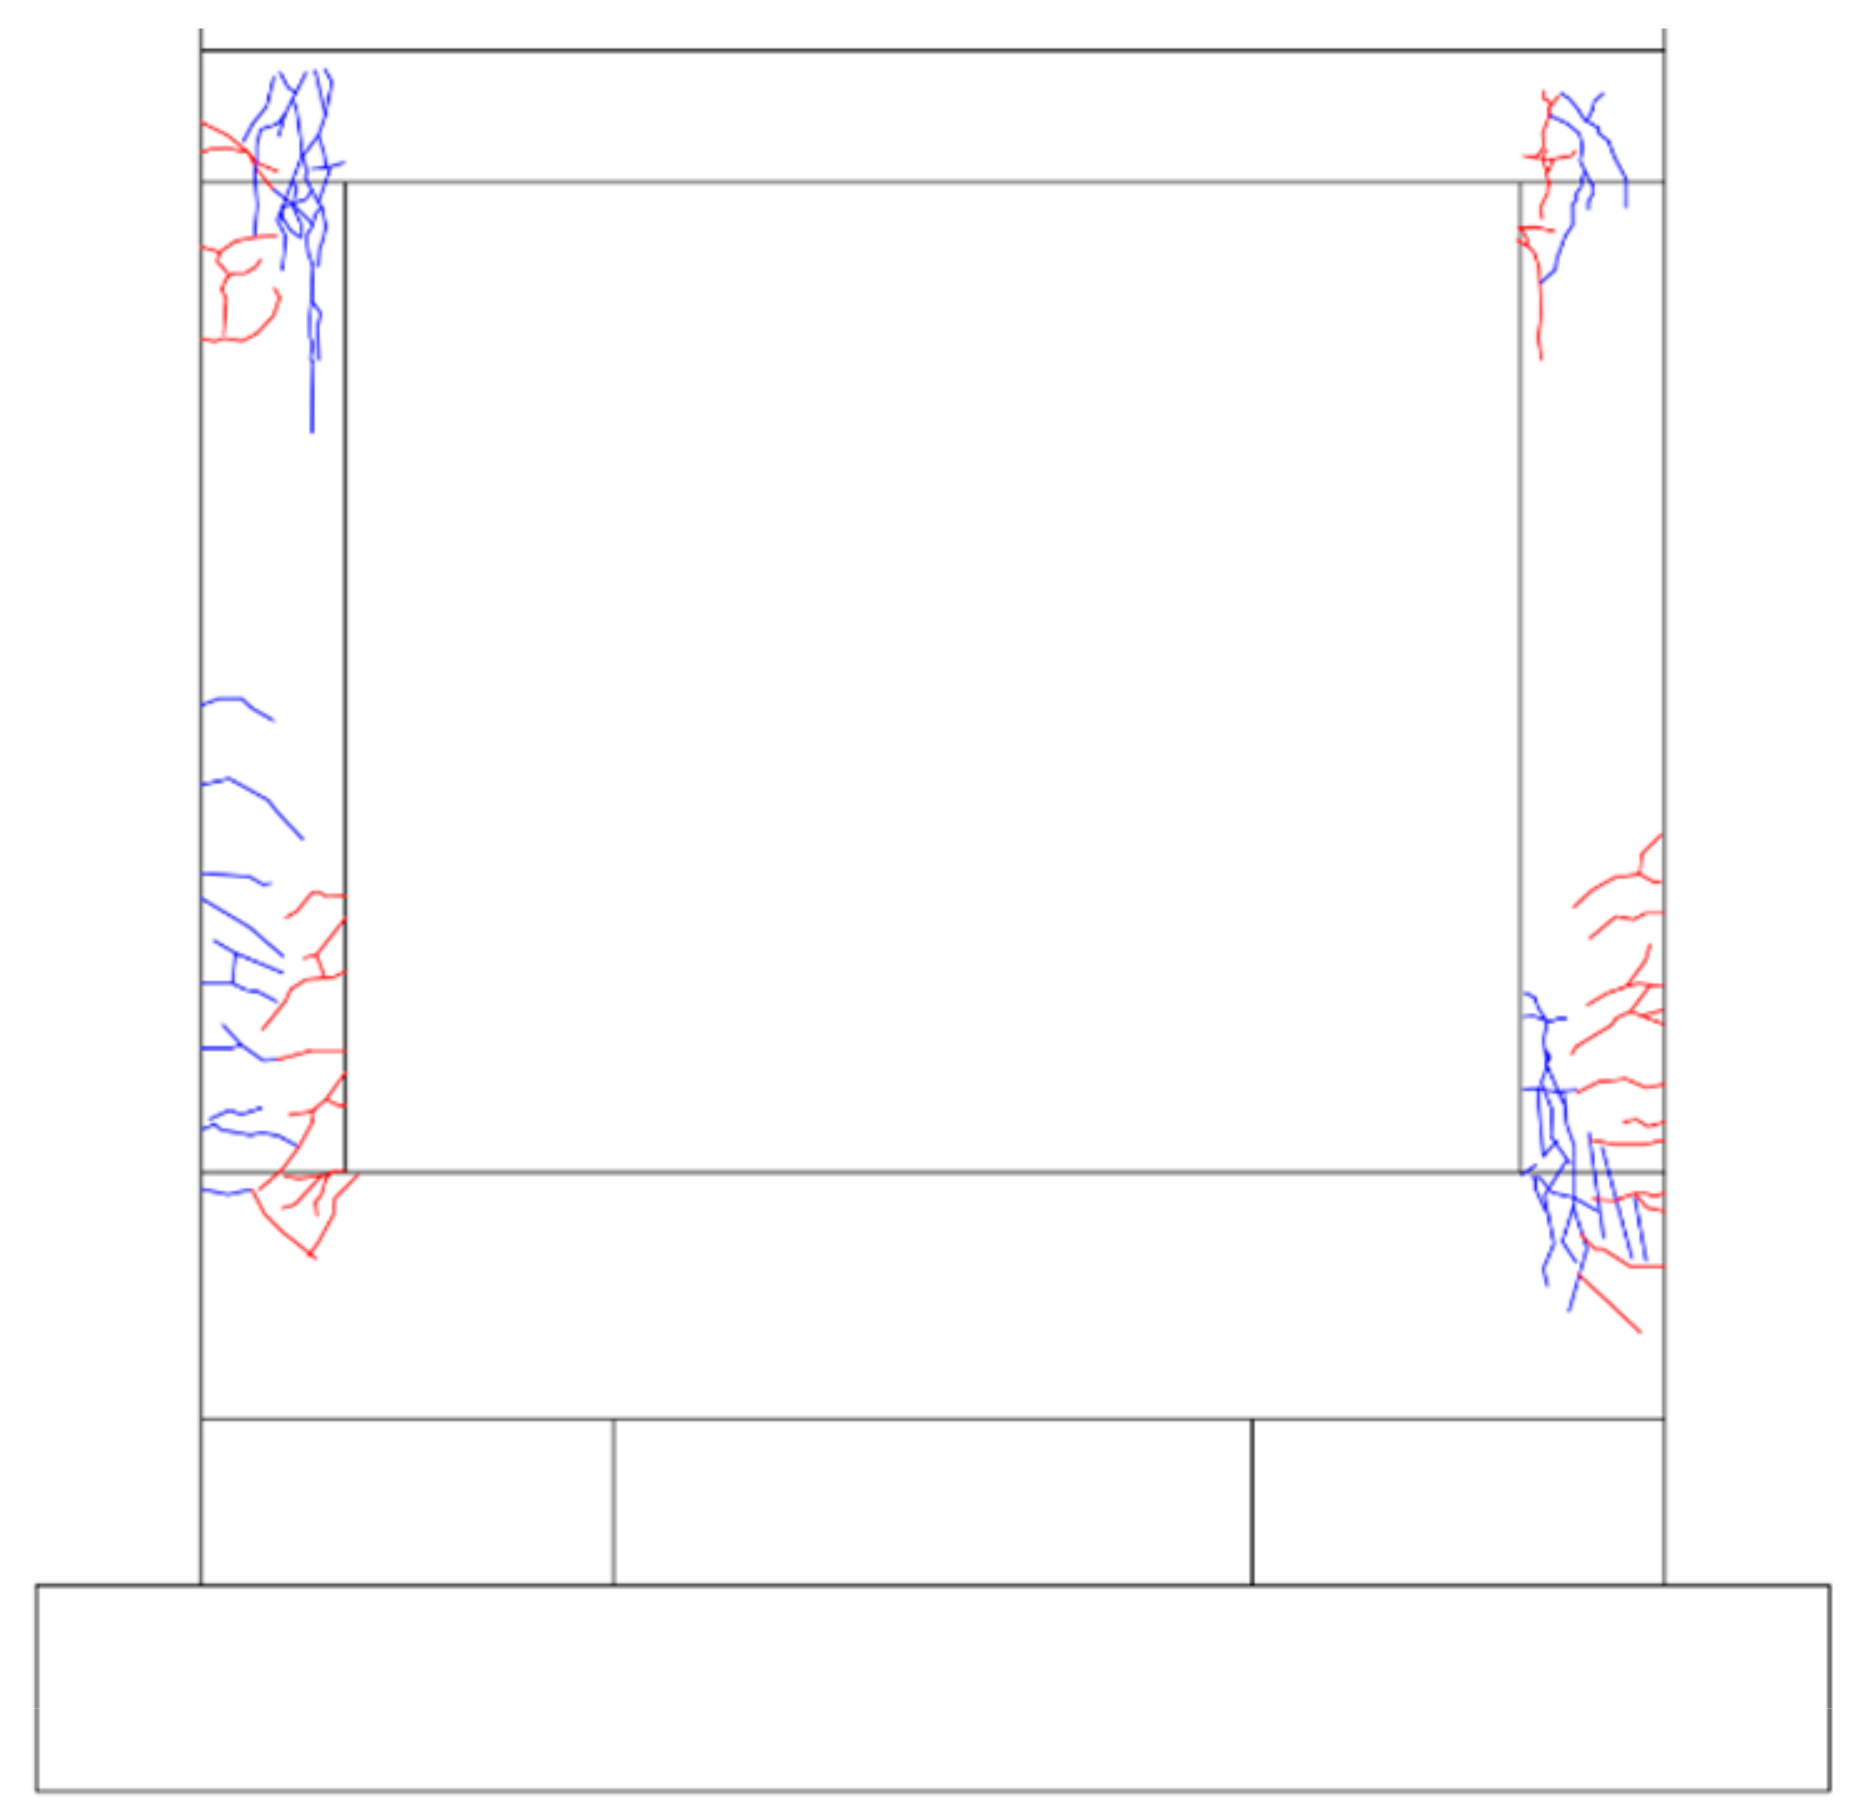
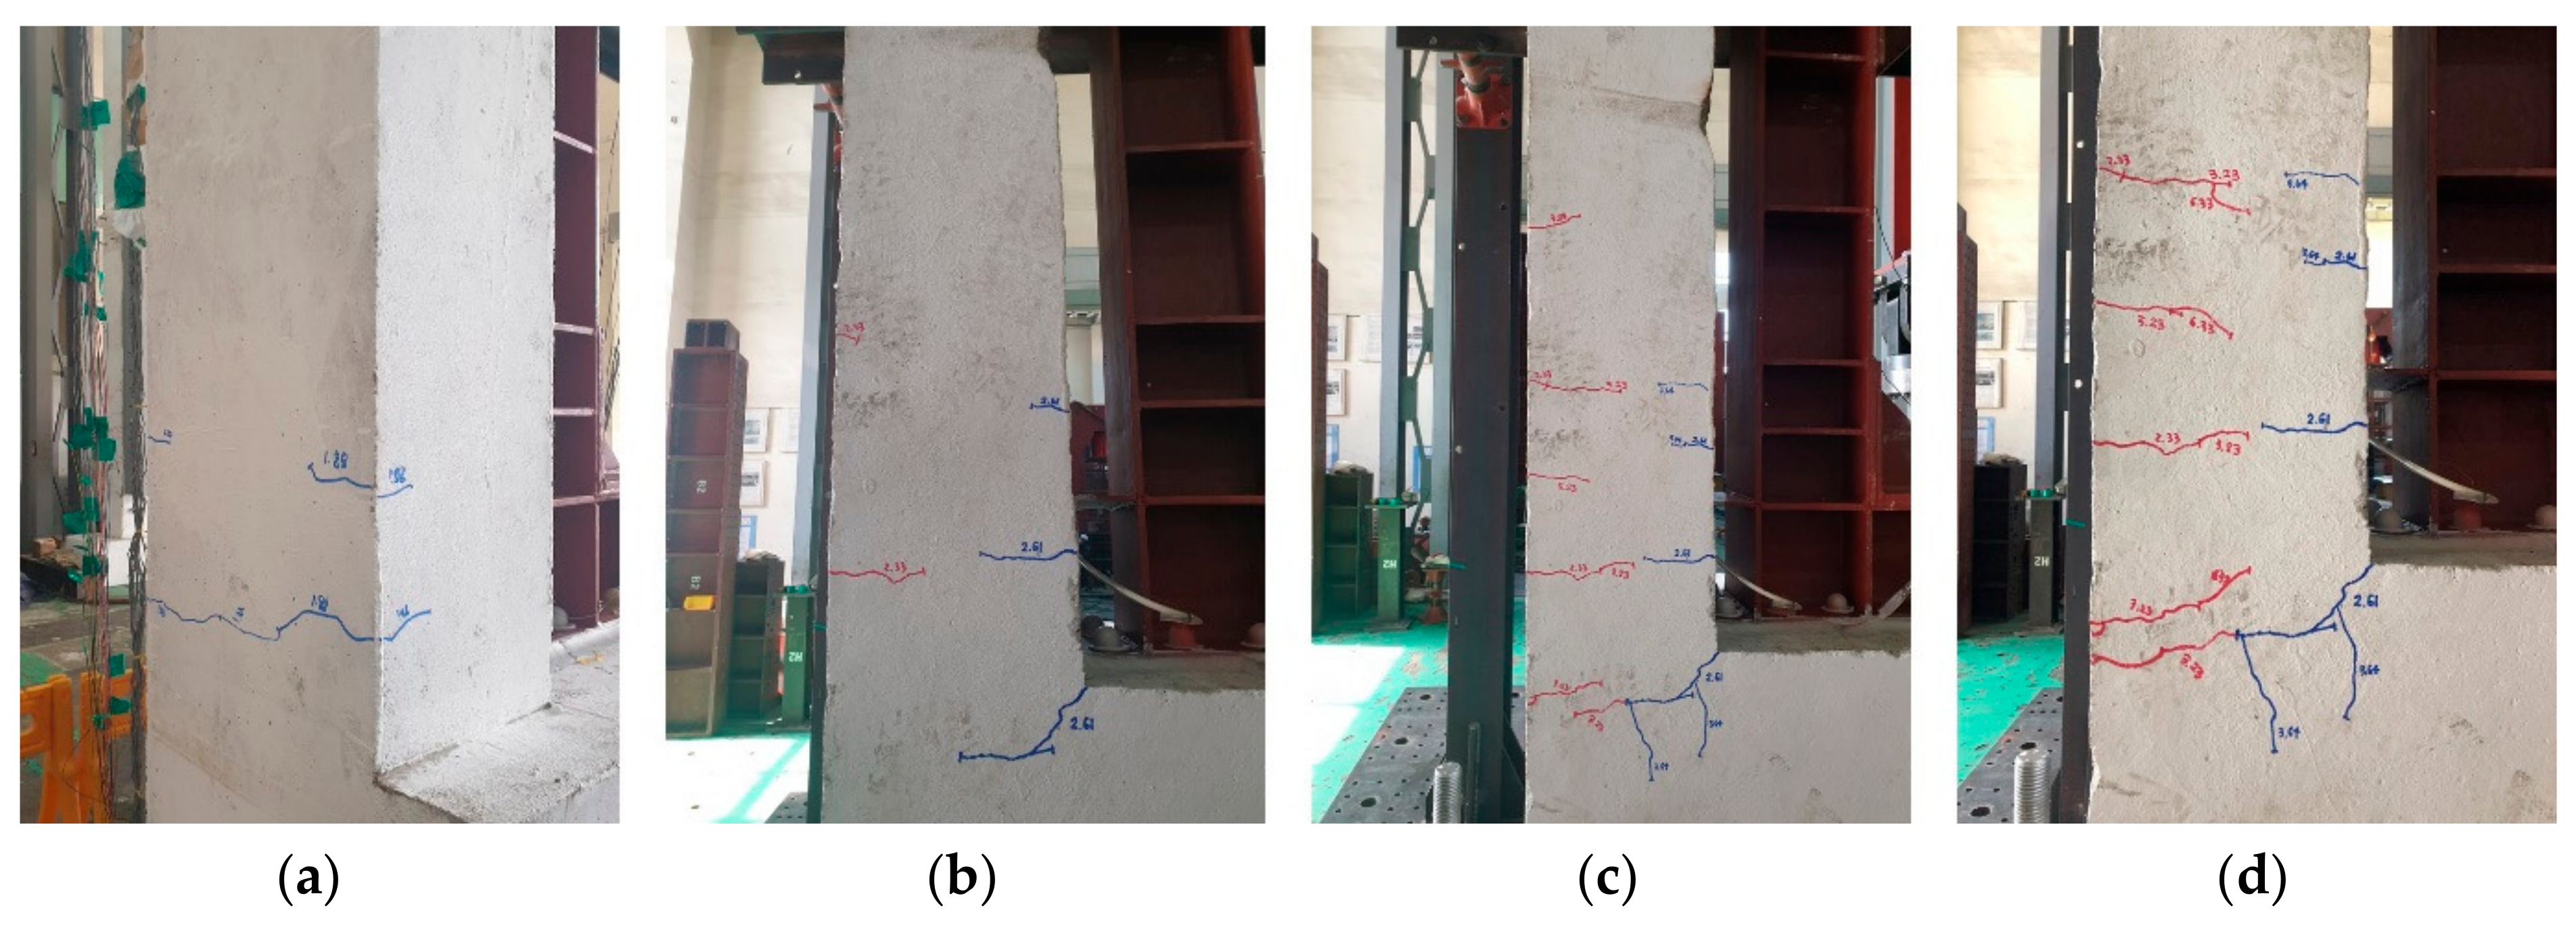
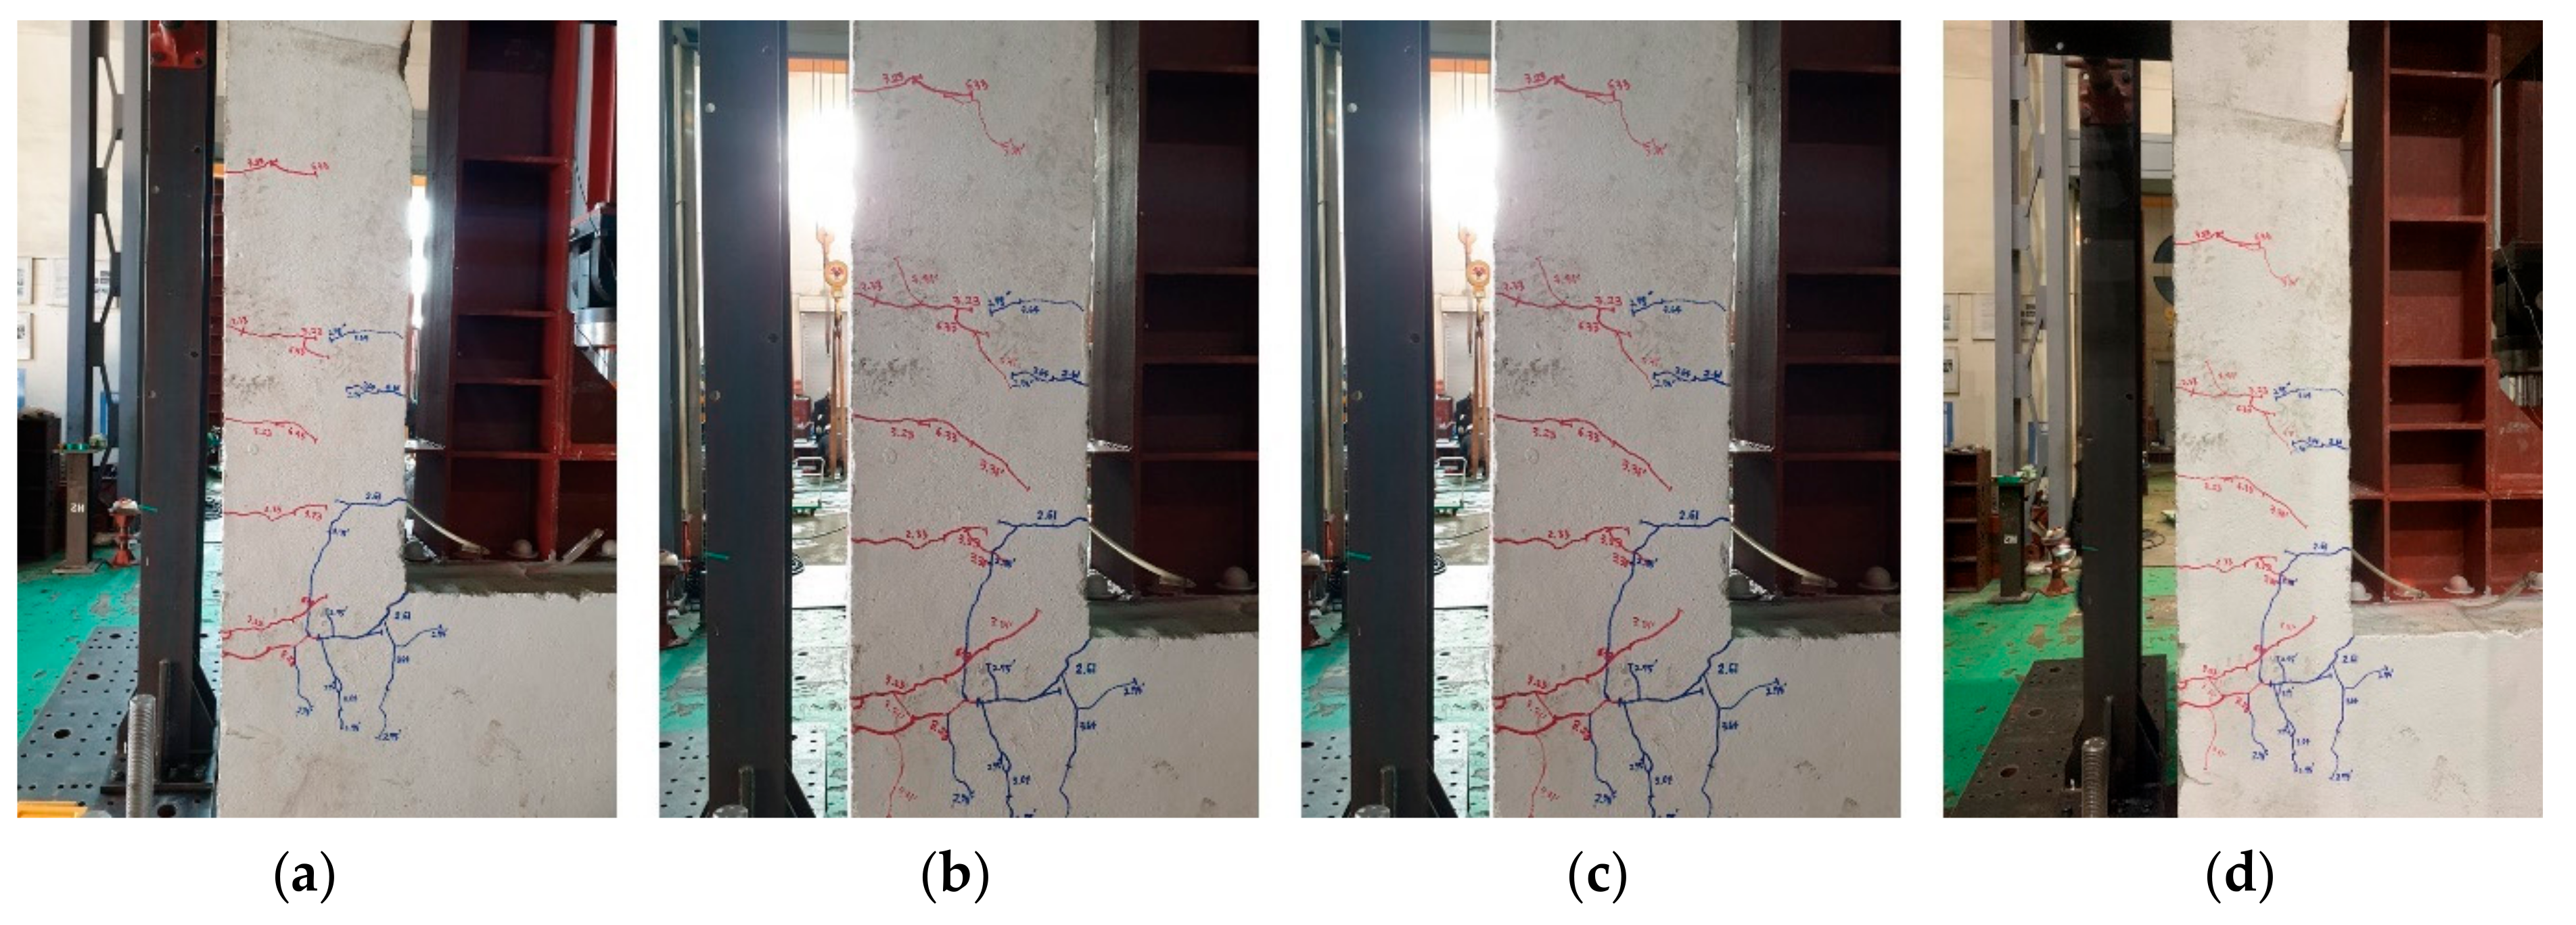
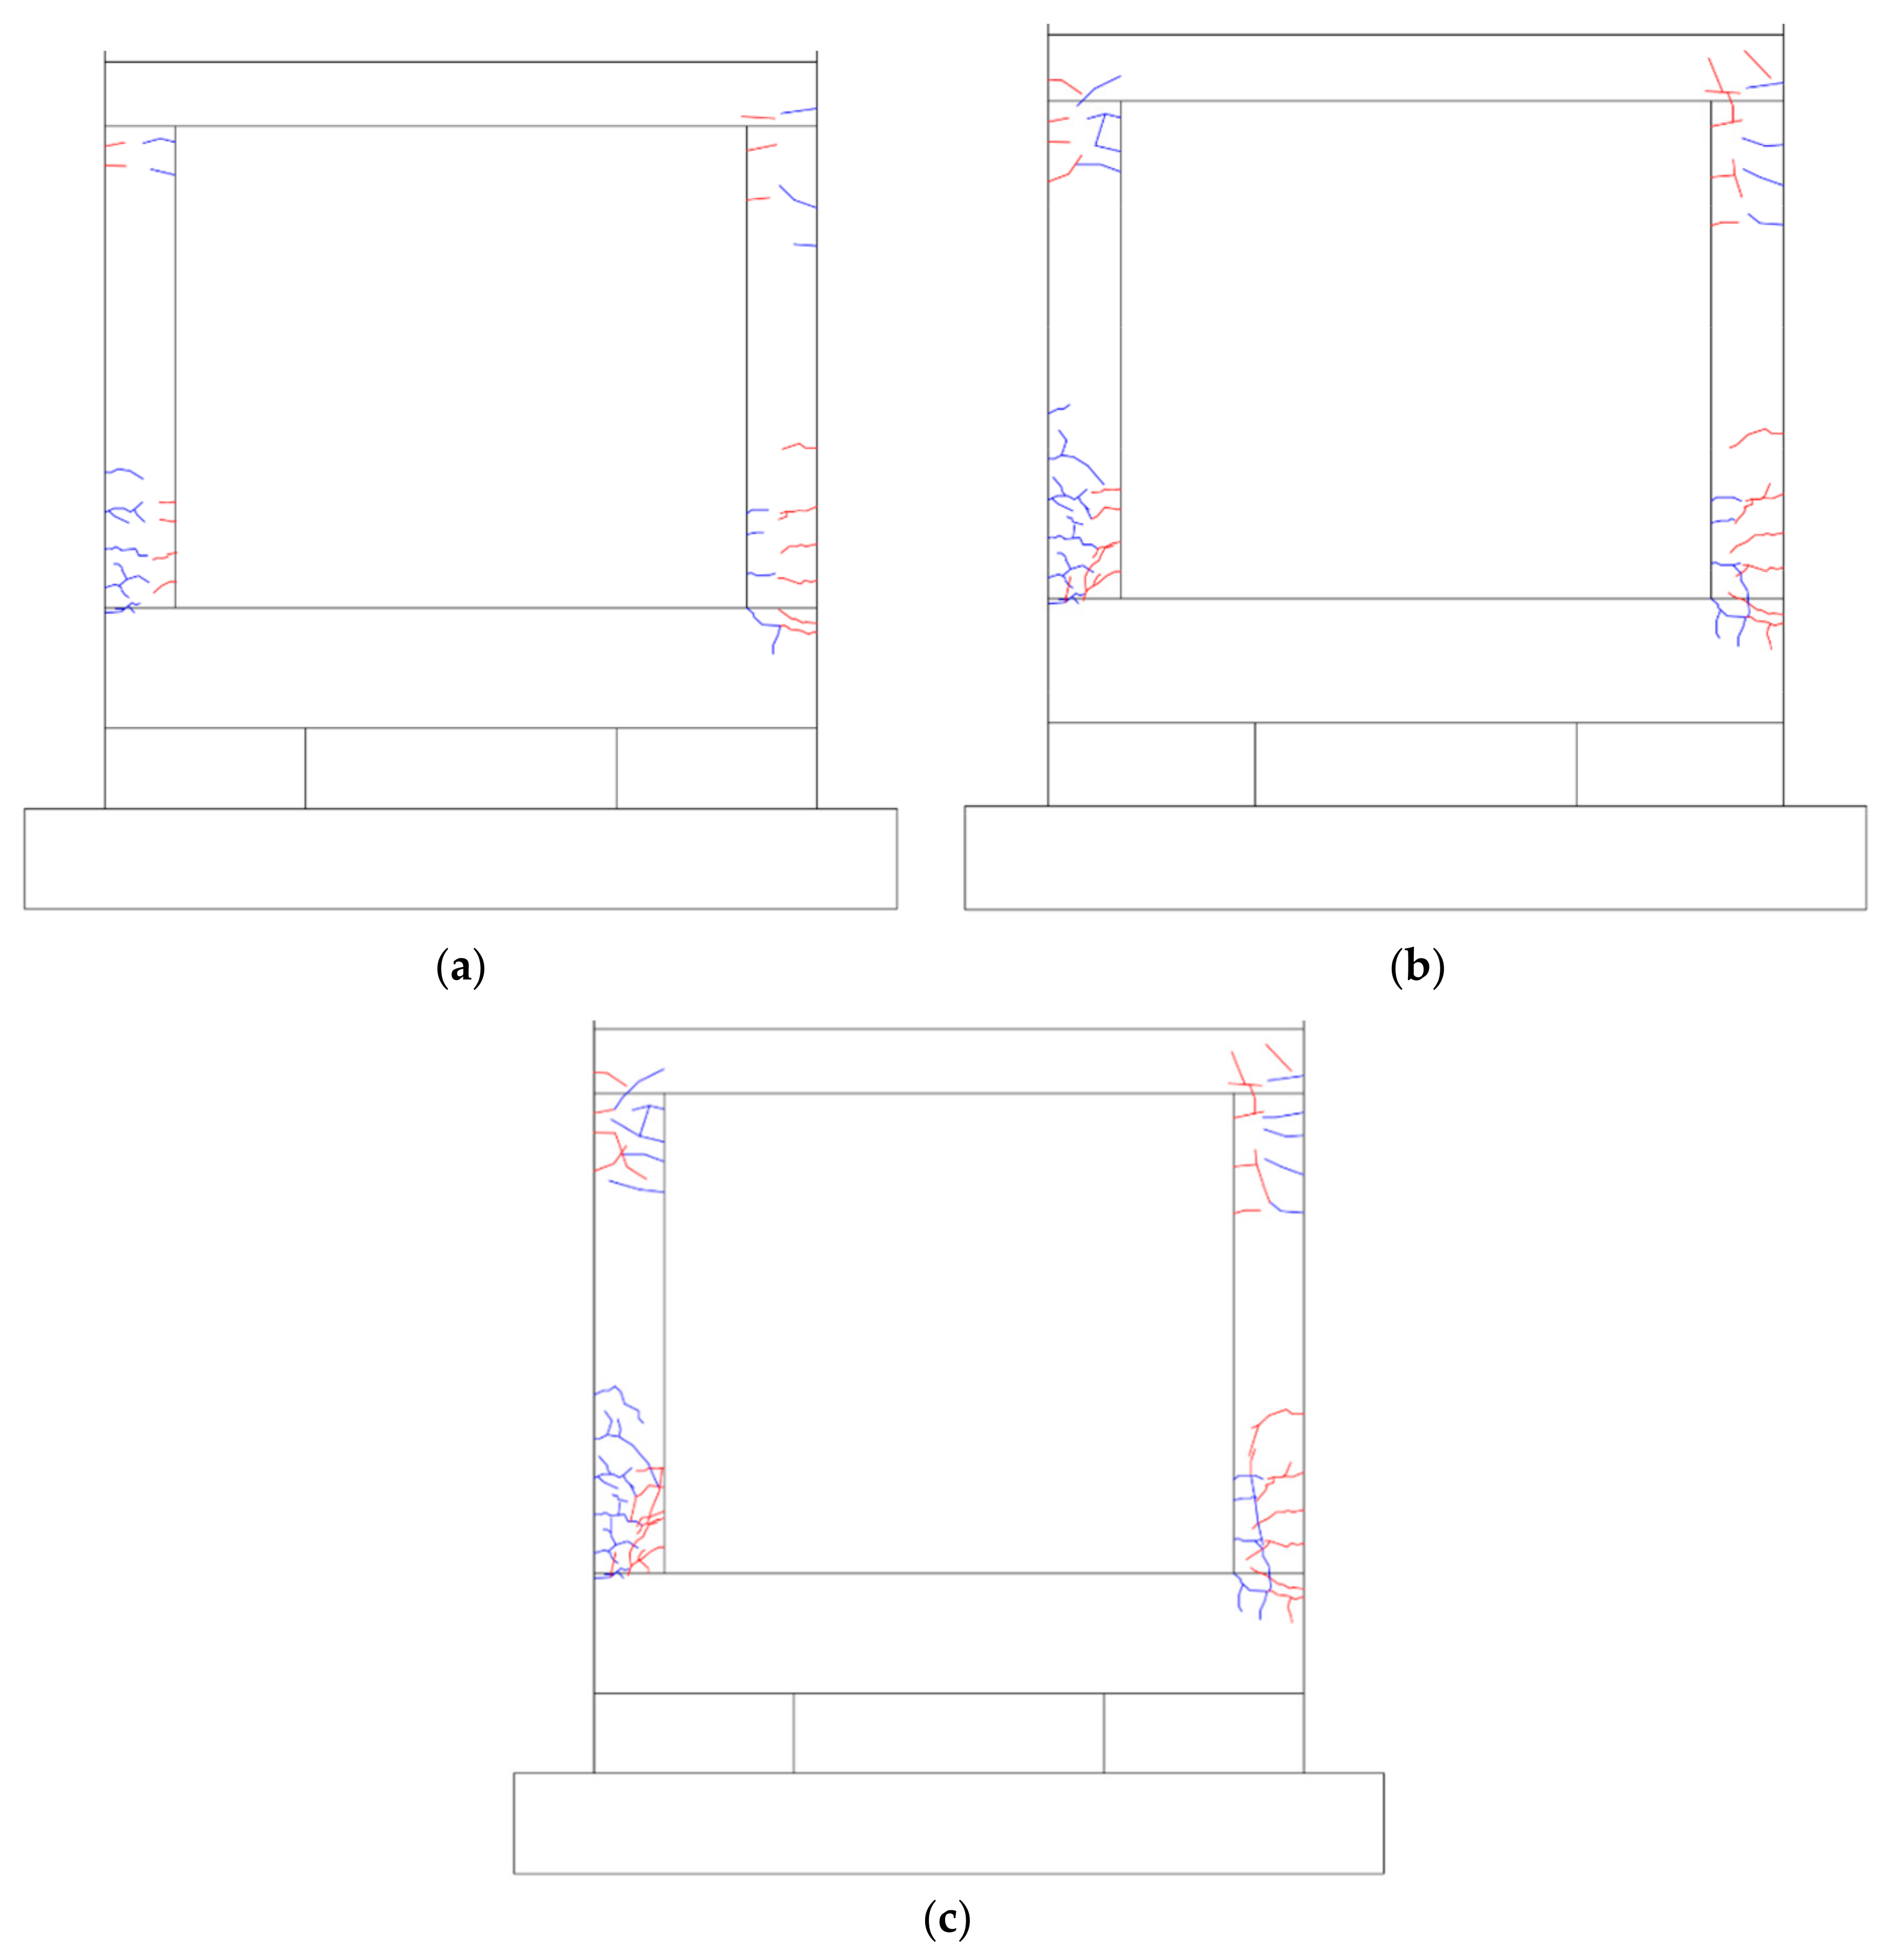
4.5.1. Crack and Failure Morphology
- (1)
- PD-FR (with no reinforcement applied)
- (2)
- PD-NBSD-WSCS (retrofitted with NBSD)
4.5.2. Maximum Seismic Response Load and Displacement
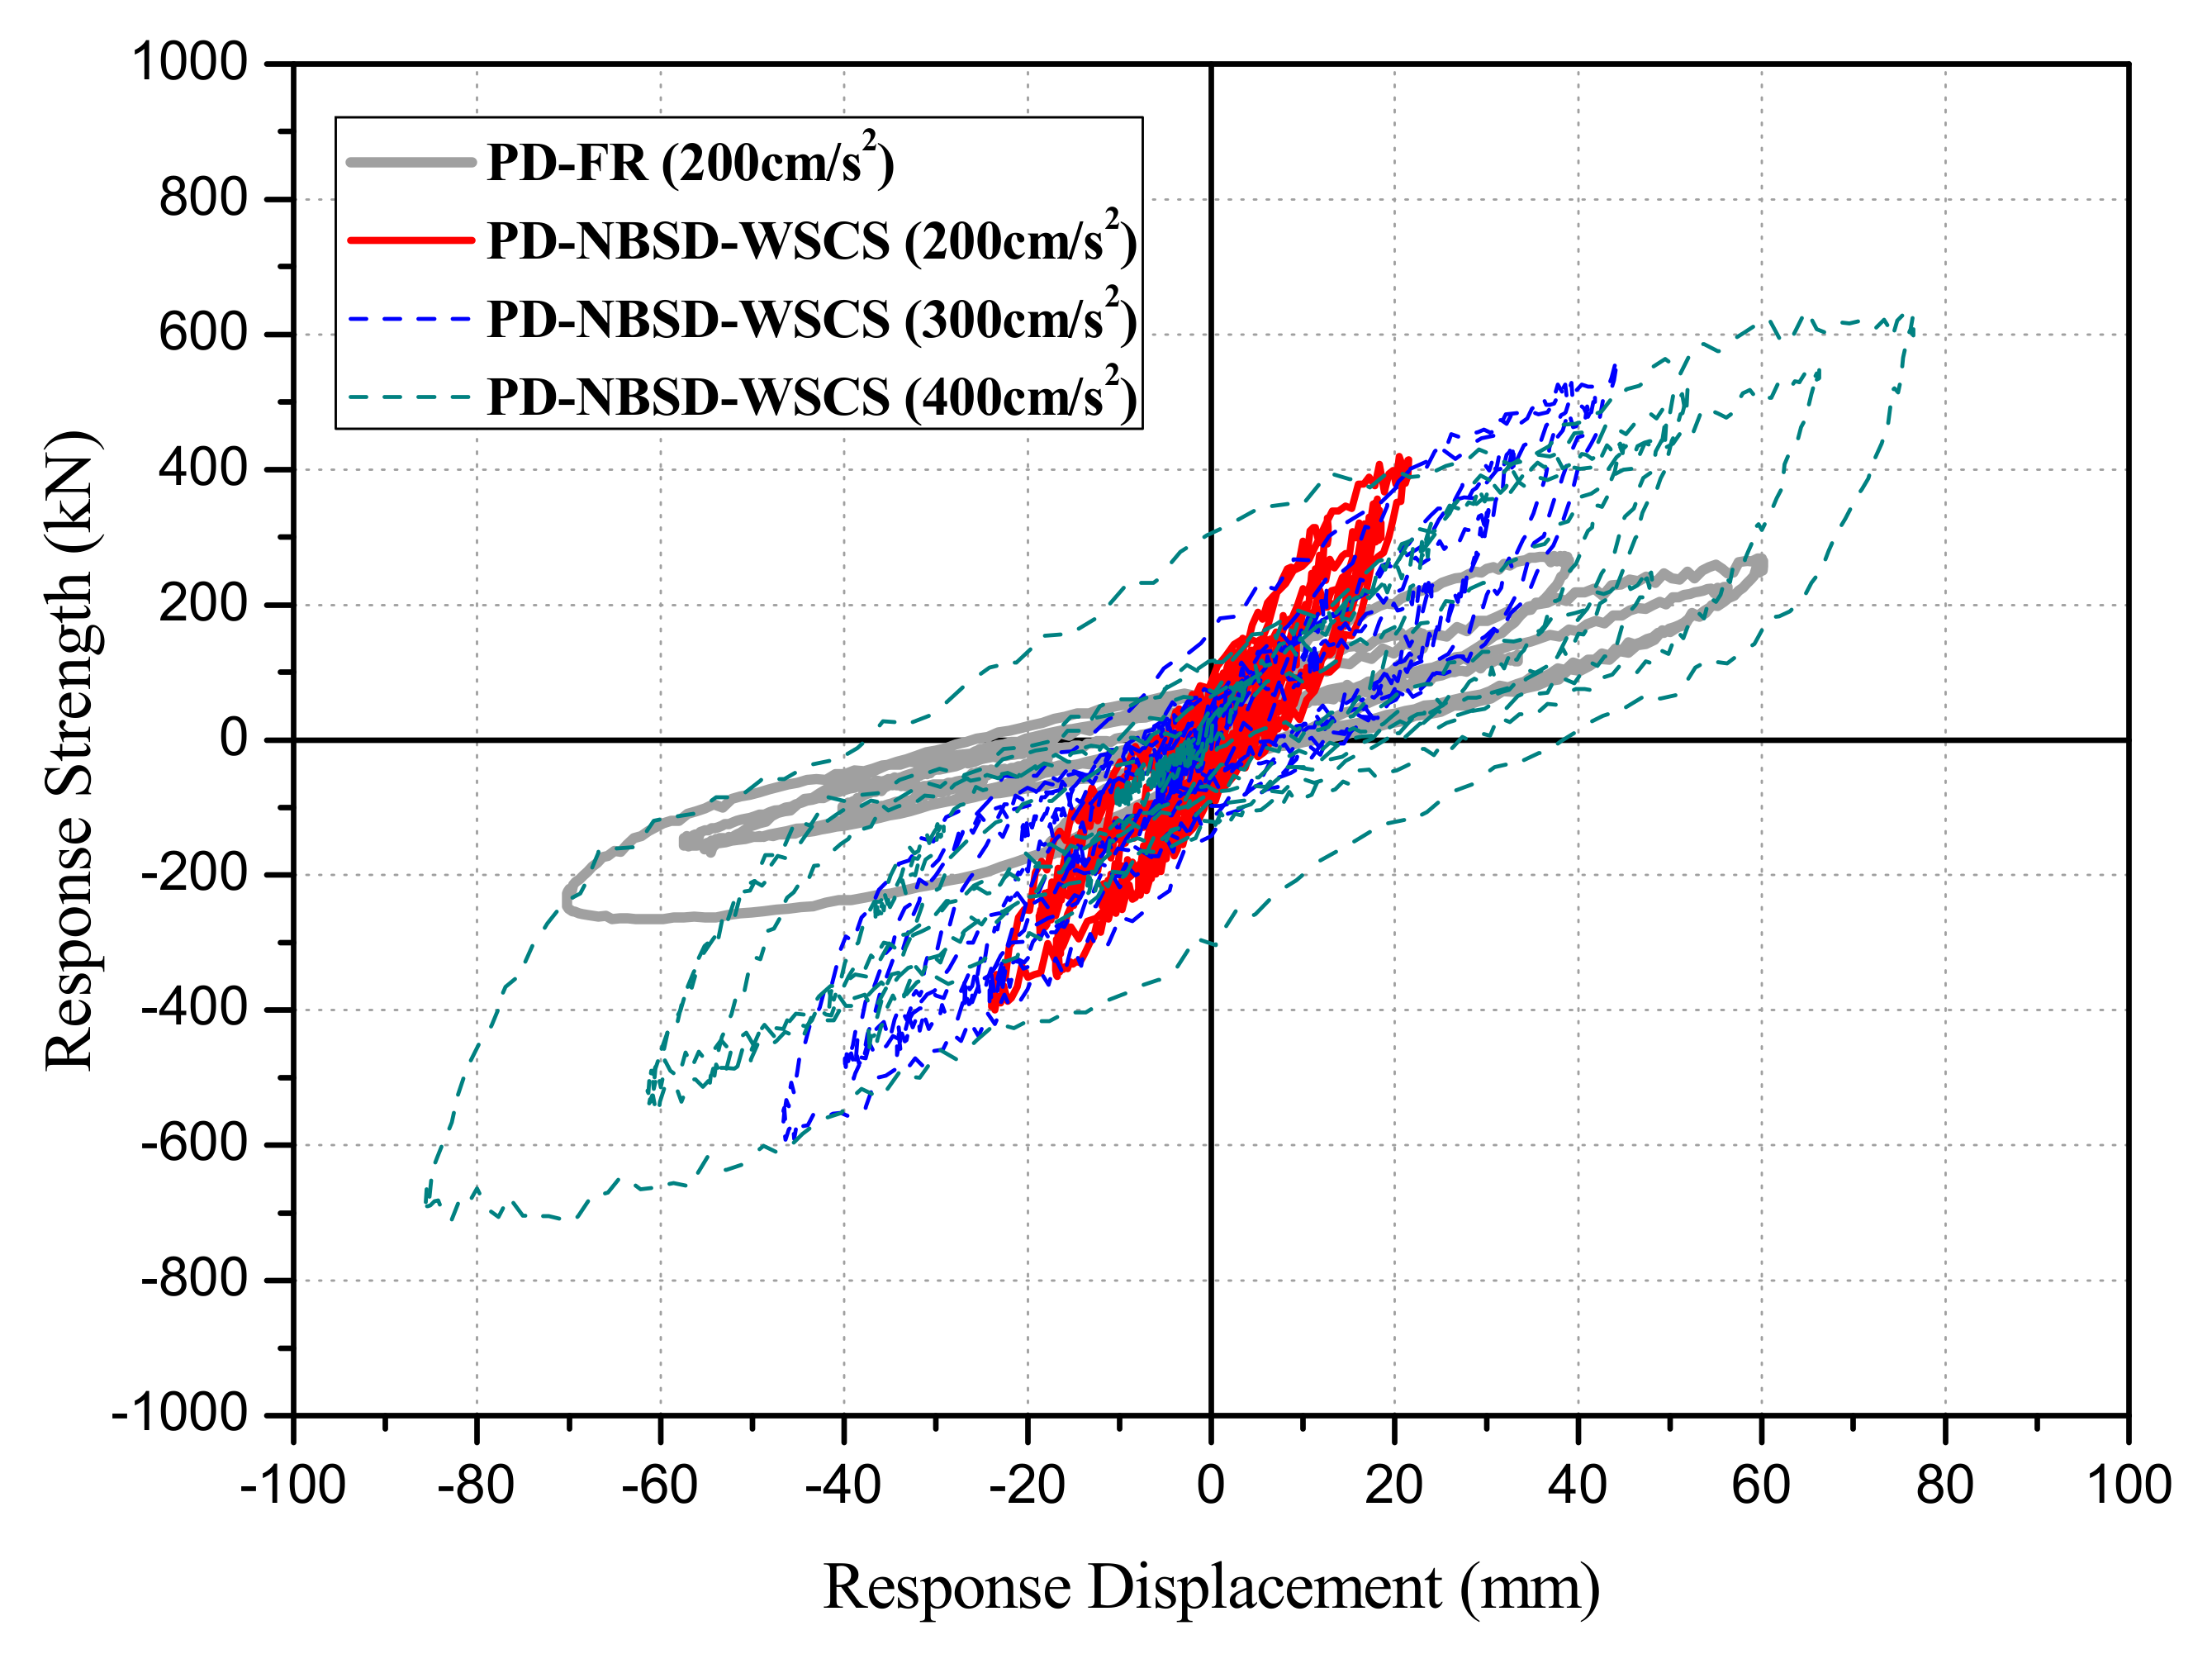
4.5.3. Comparison and Analysis of the Load-Displacement Relationship and Displacement-Time Hysteresis
5. Comparison of the Pseudo-Dynamic Test Results and Nonlinear Dynamic Analysis Results
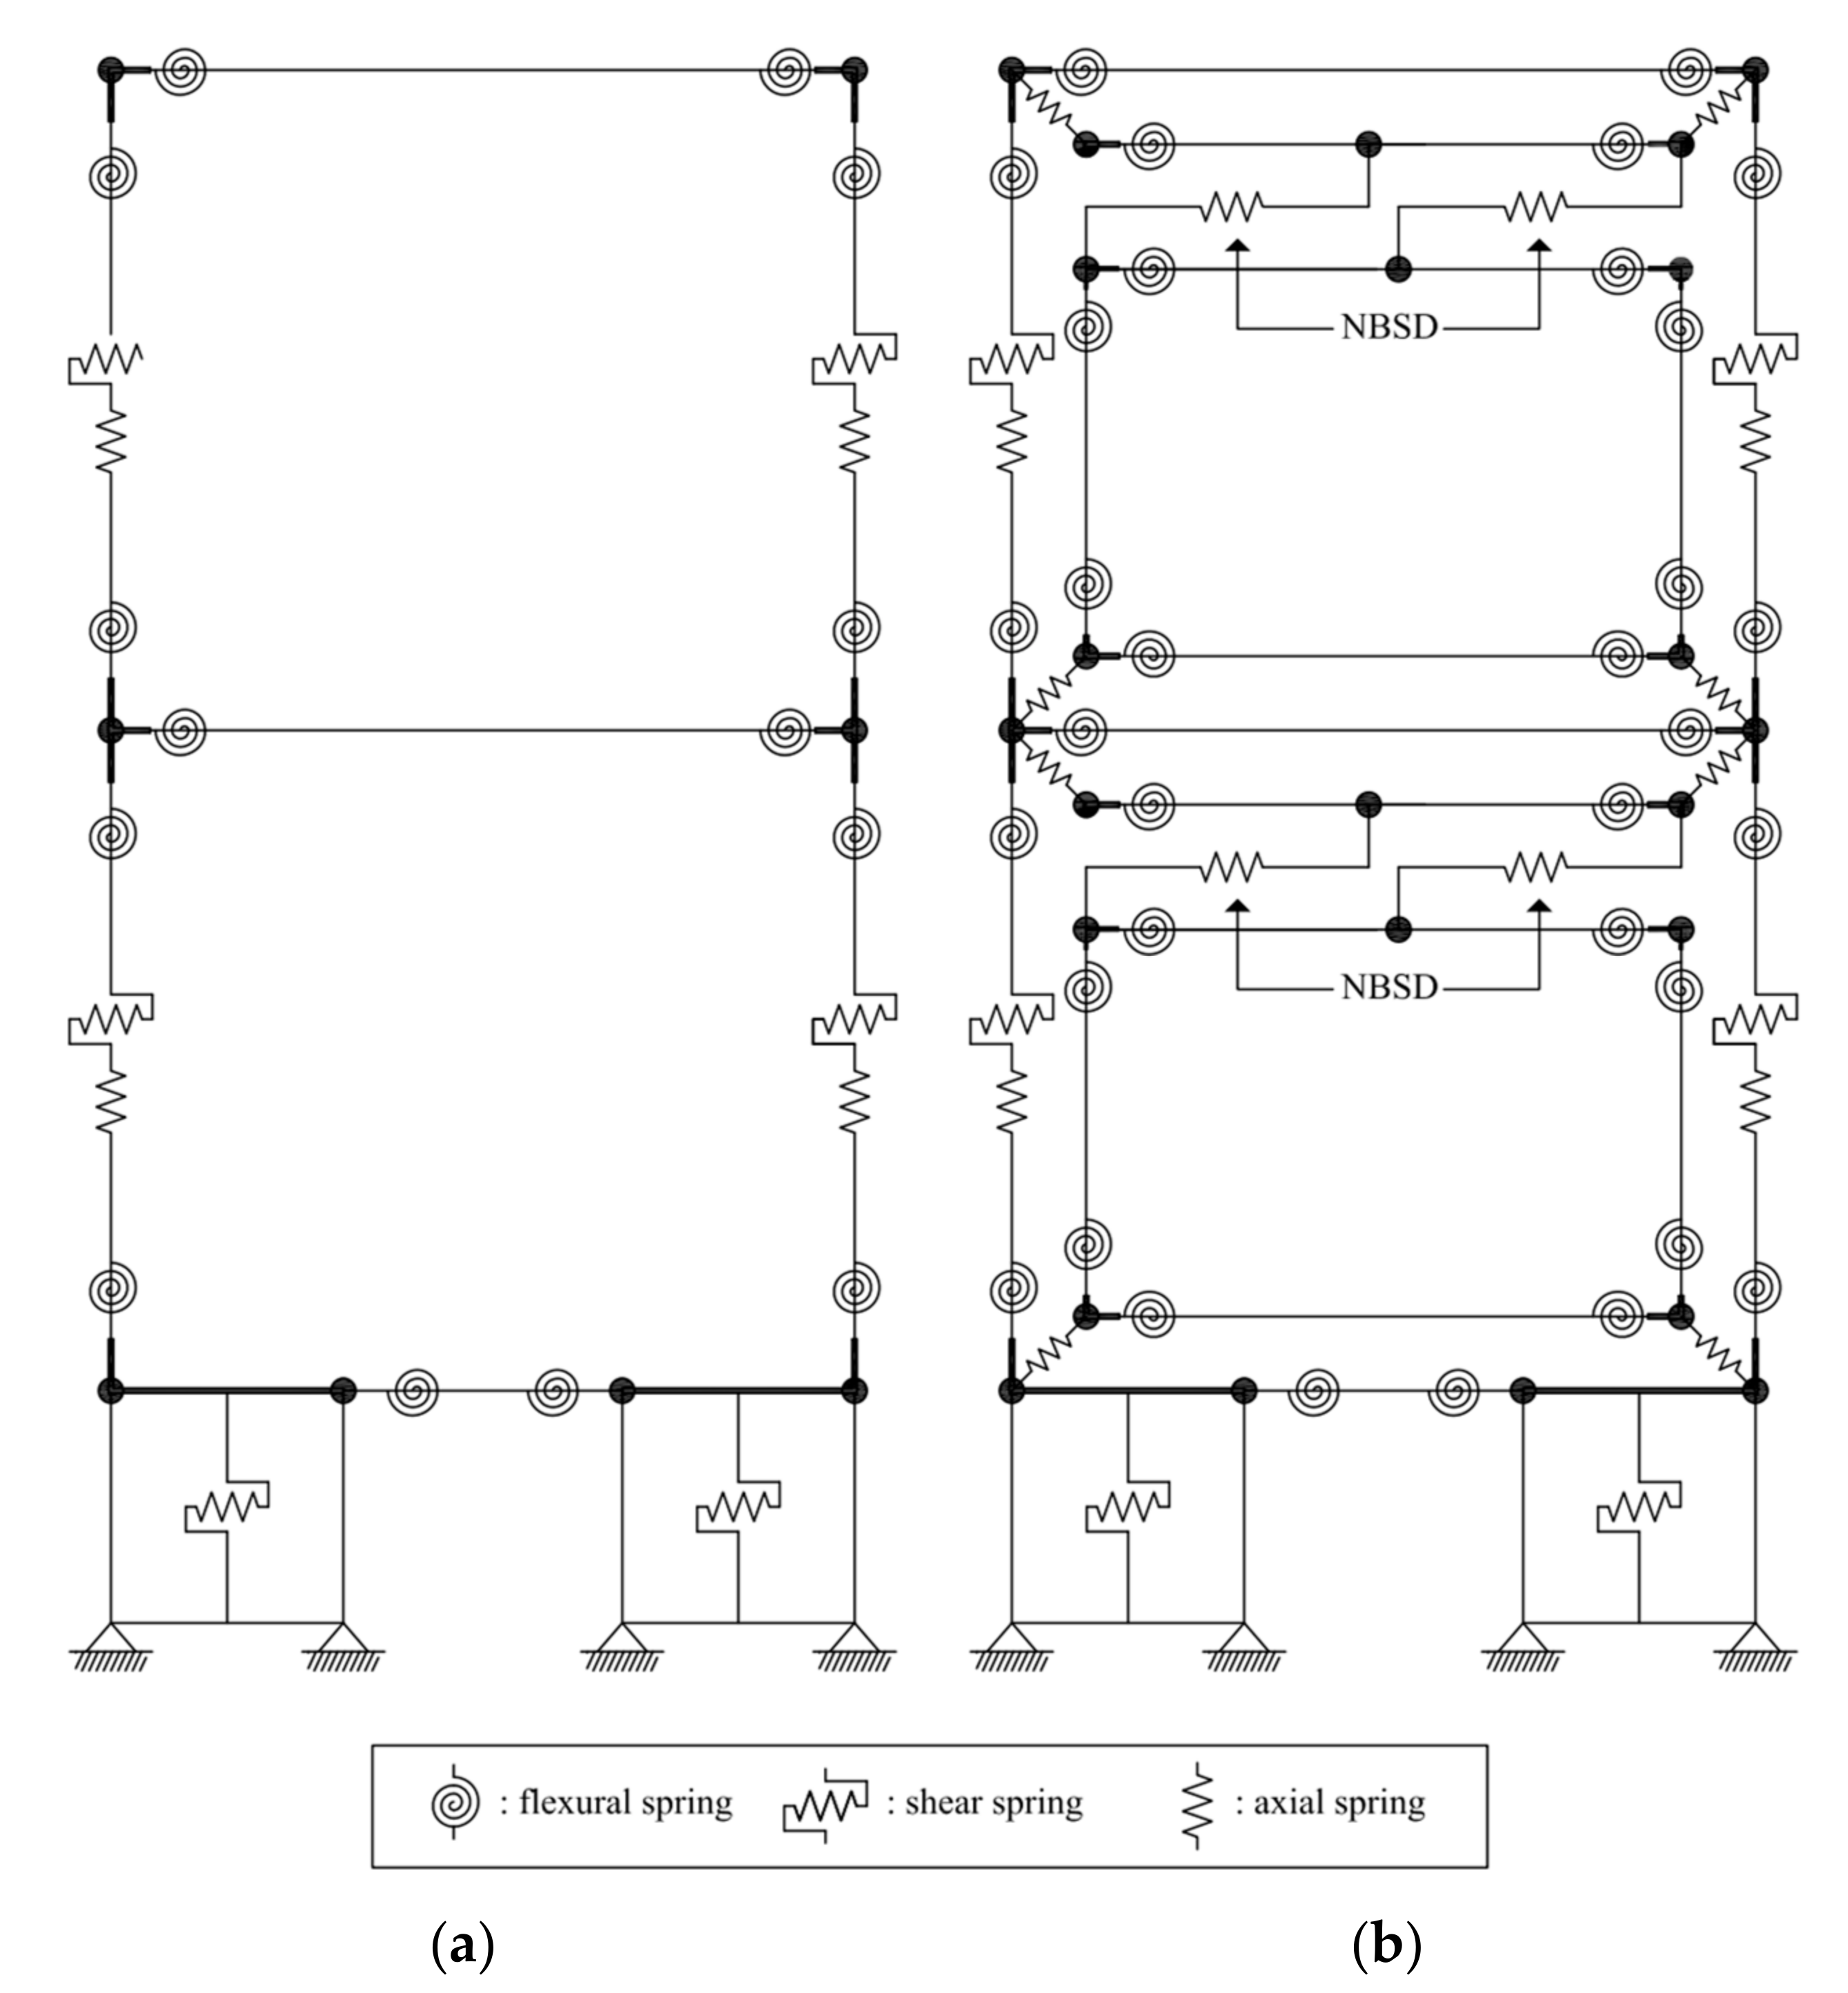
5.1. Overview of the Nonlinear Dynamic Analysis
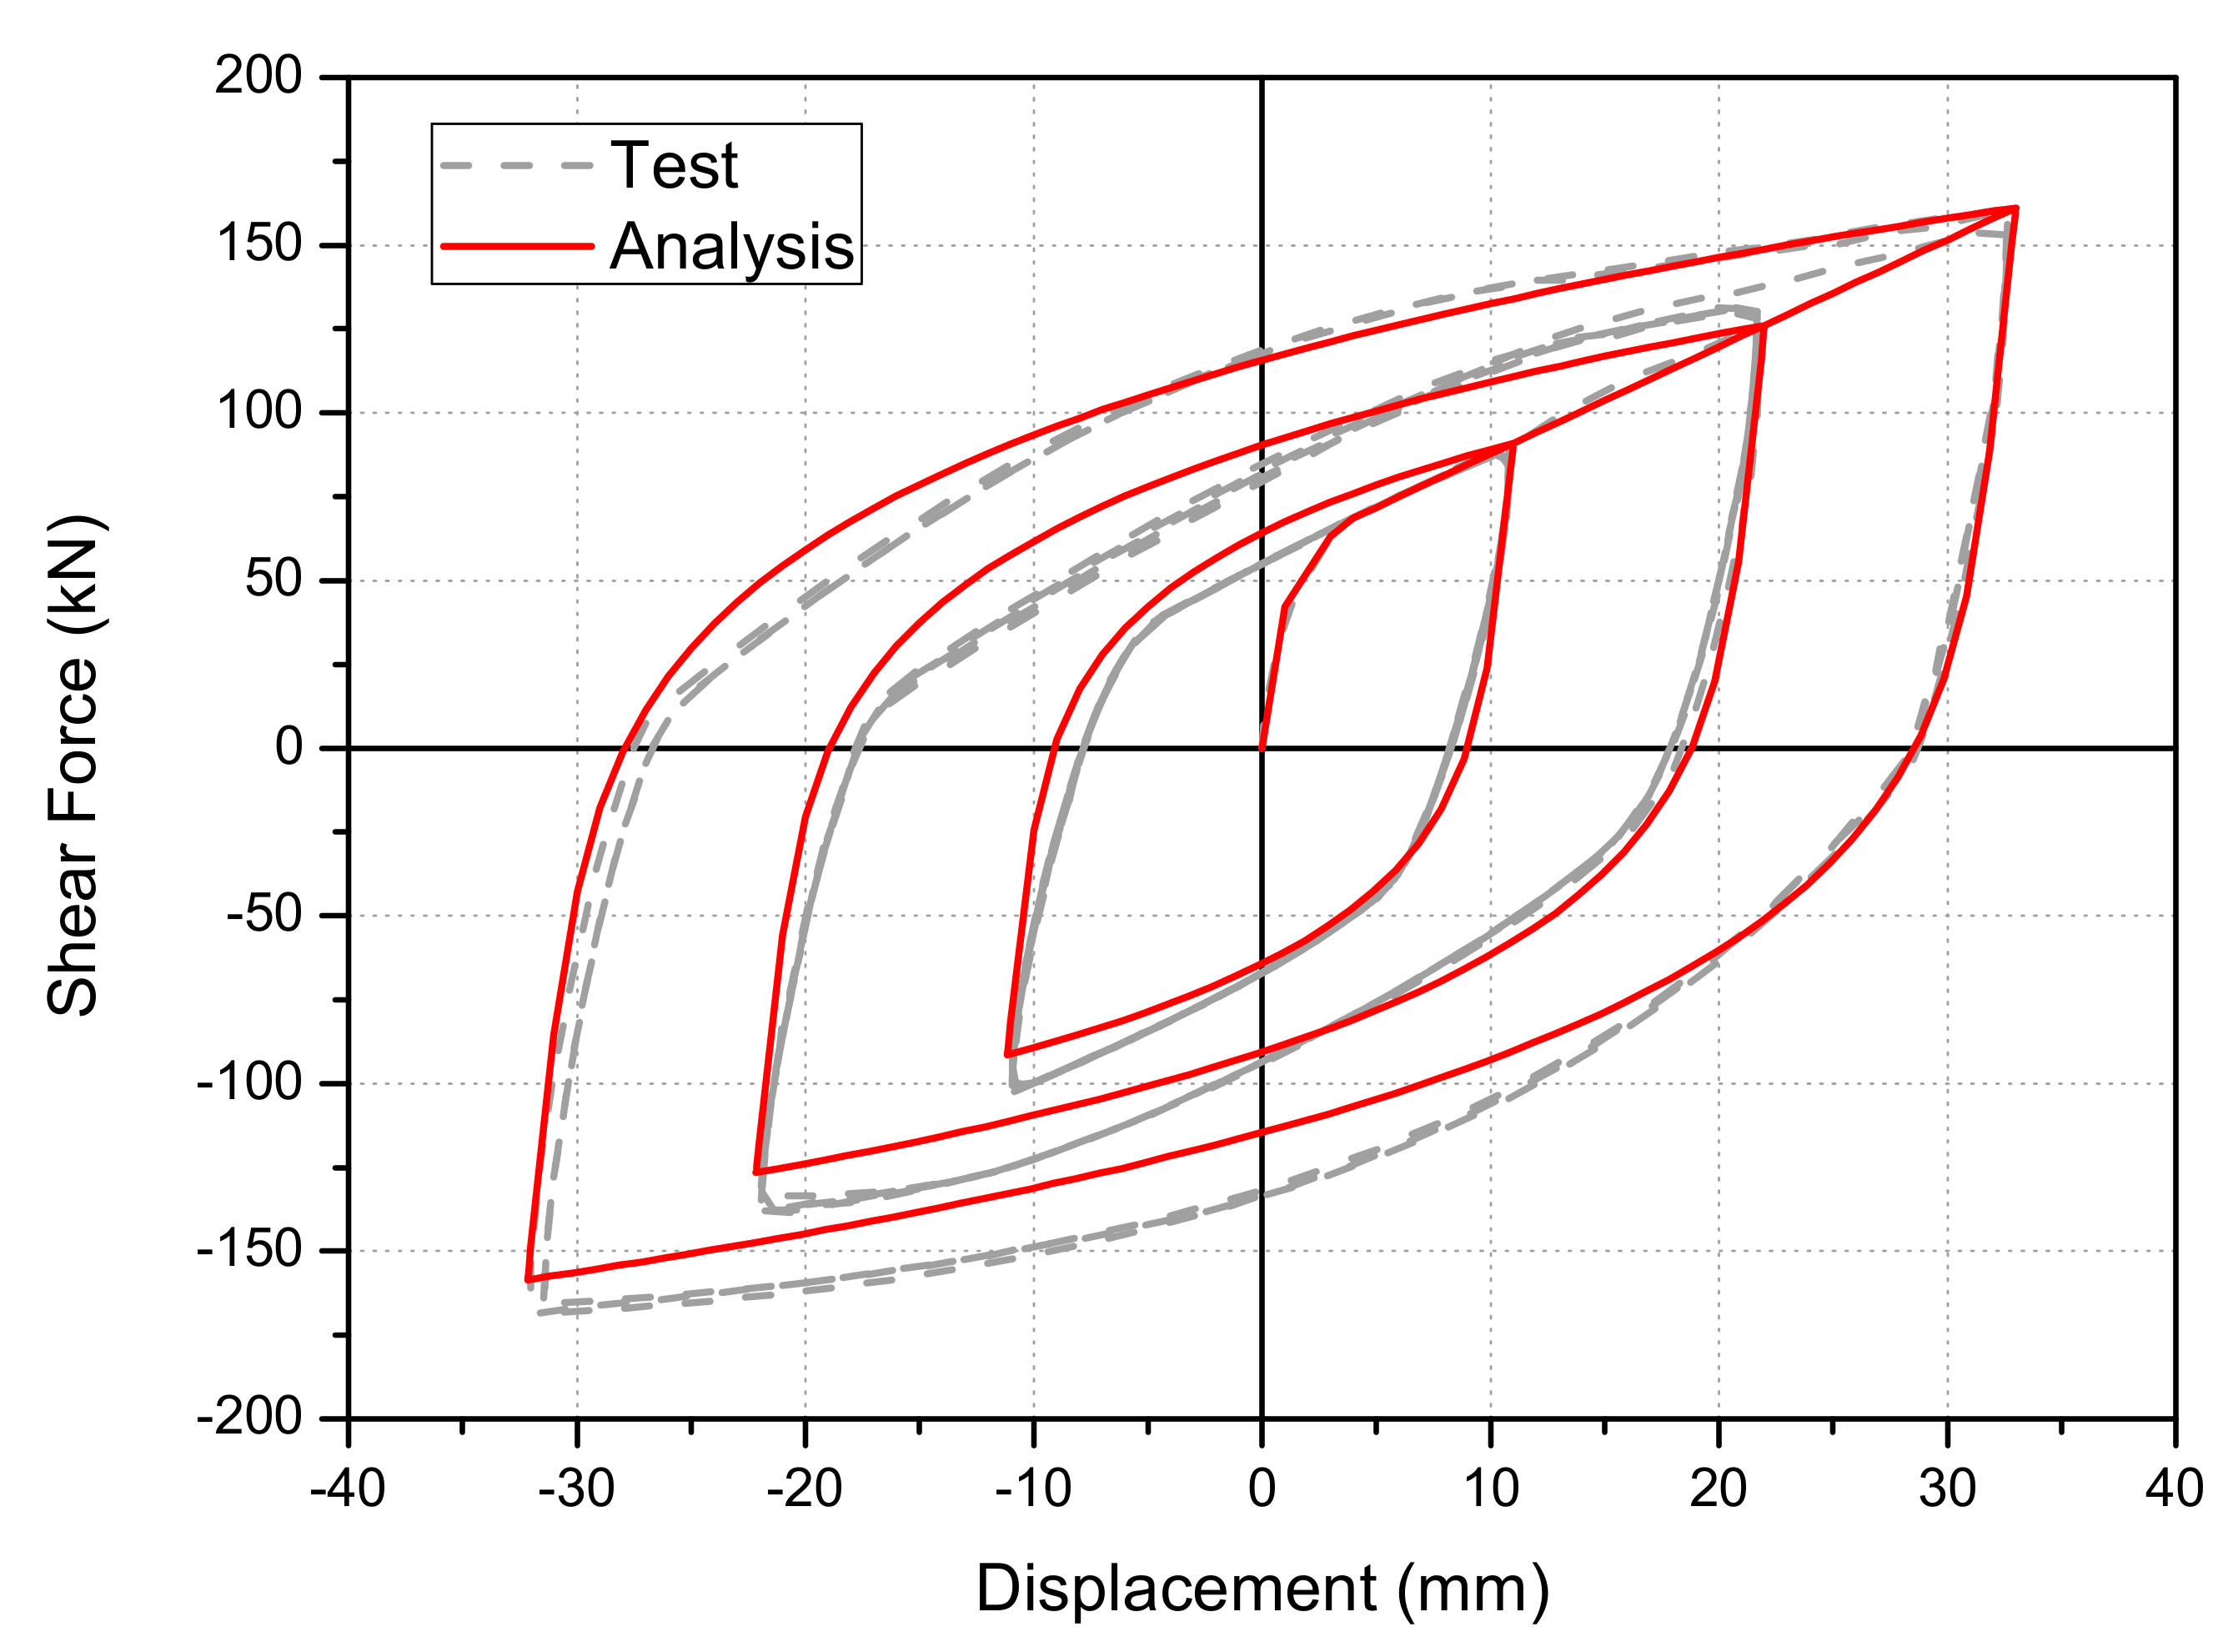
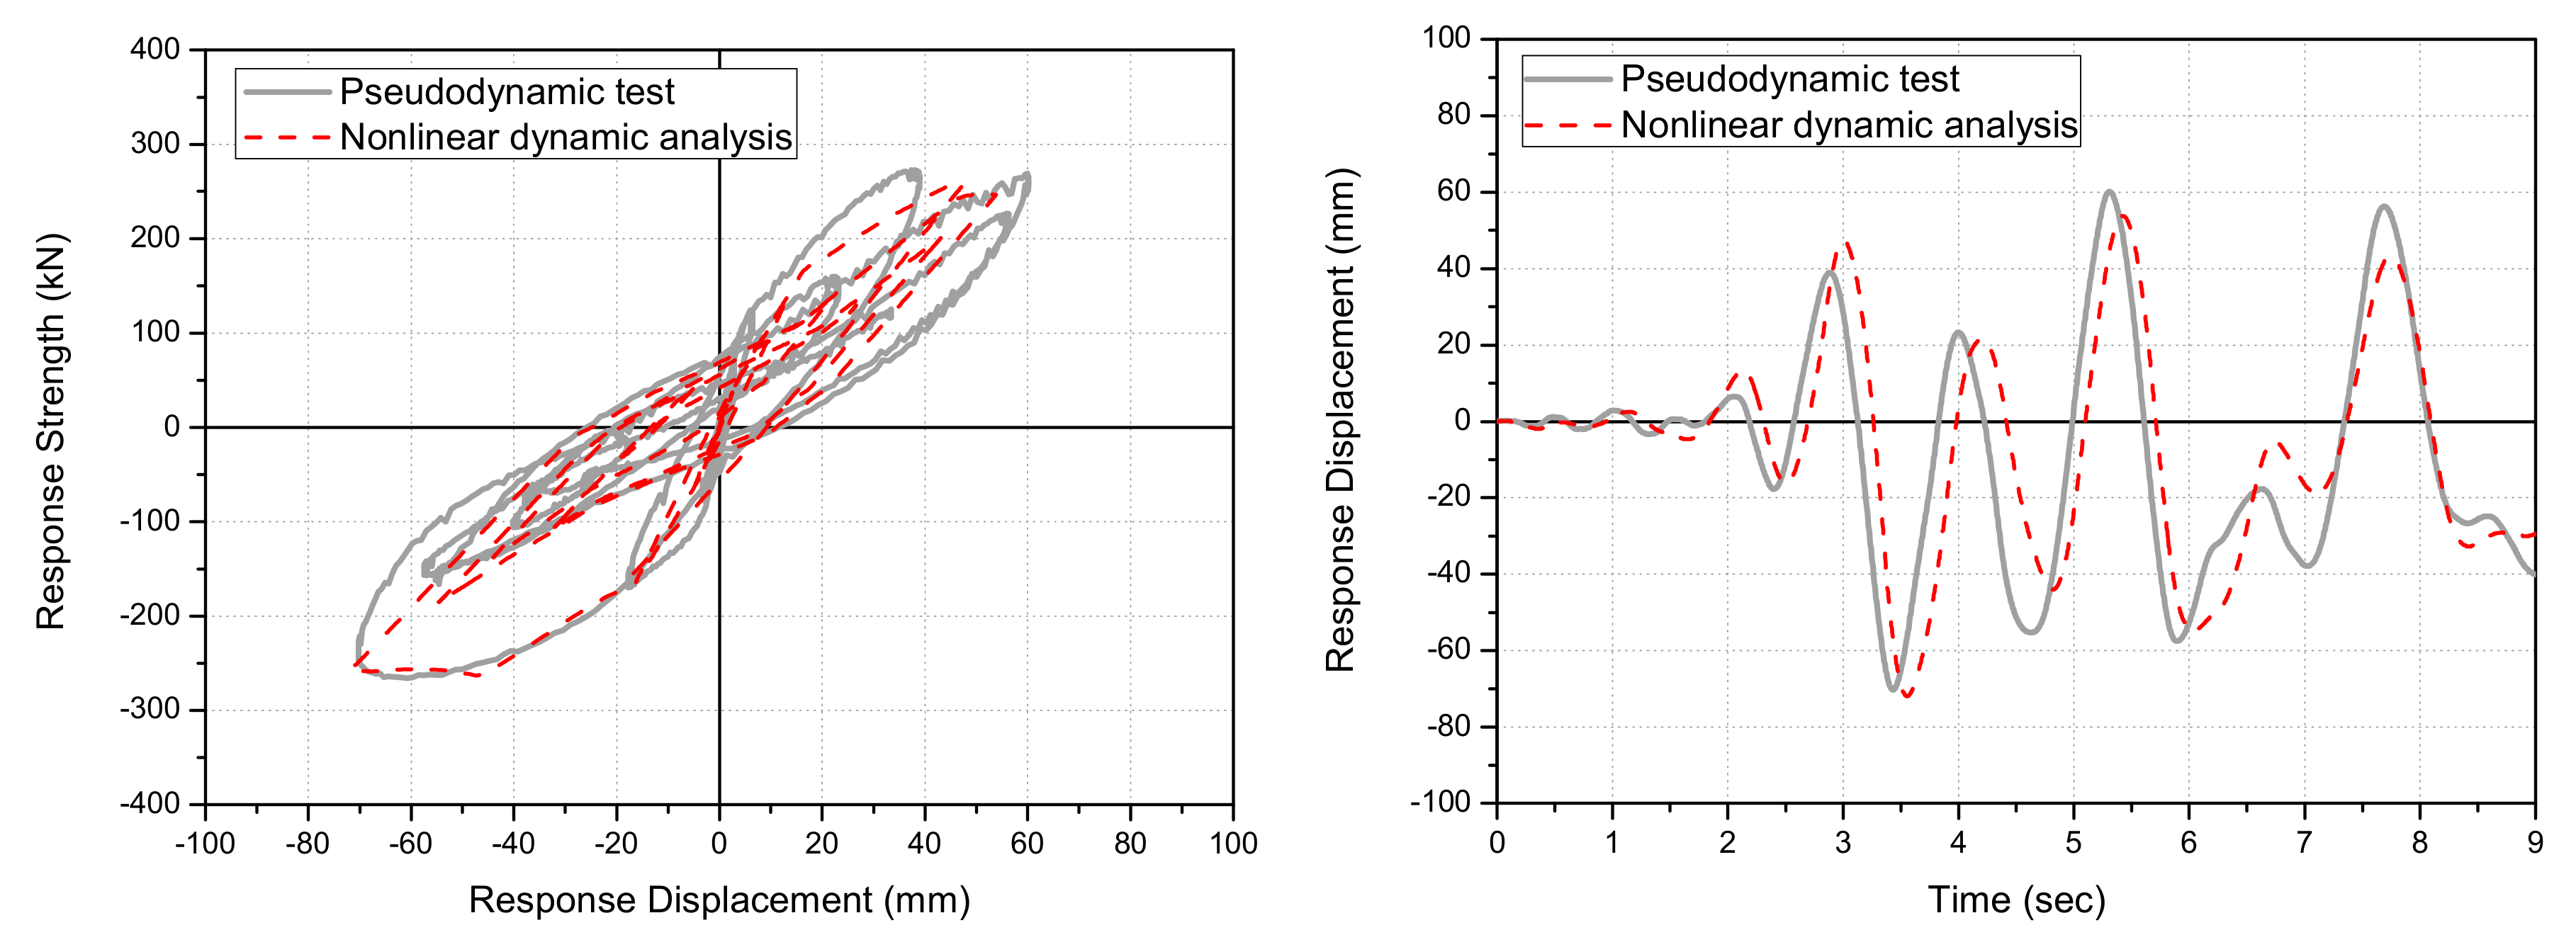
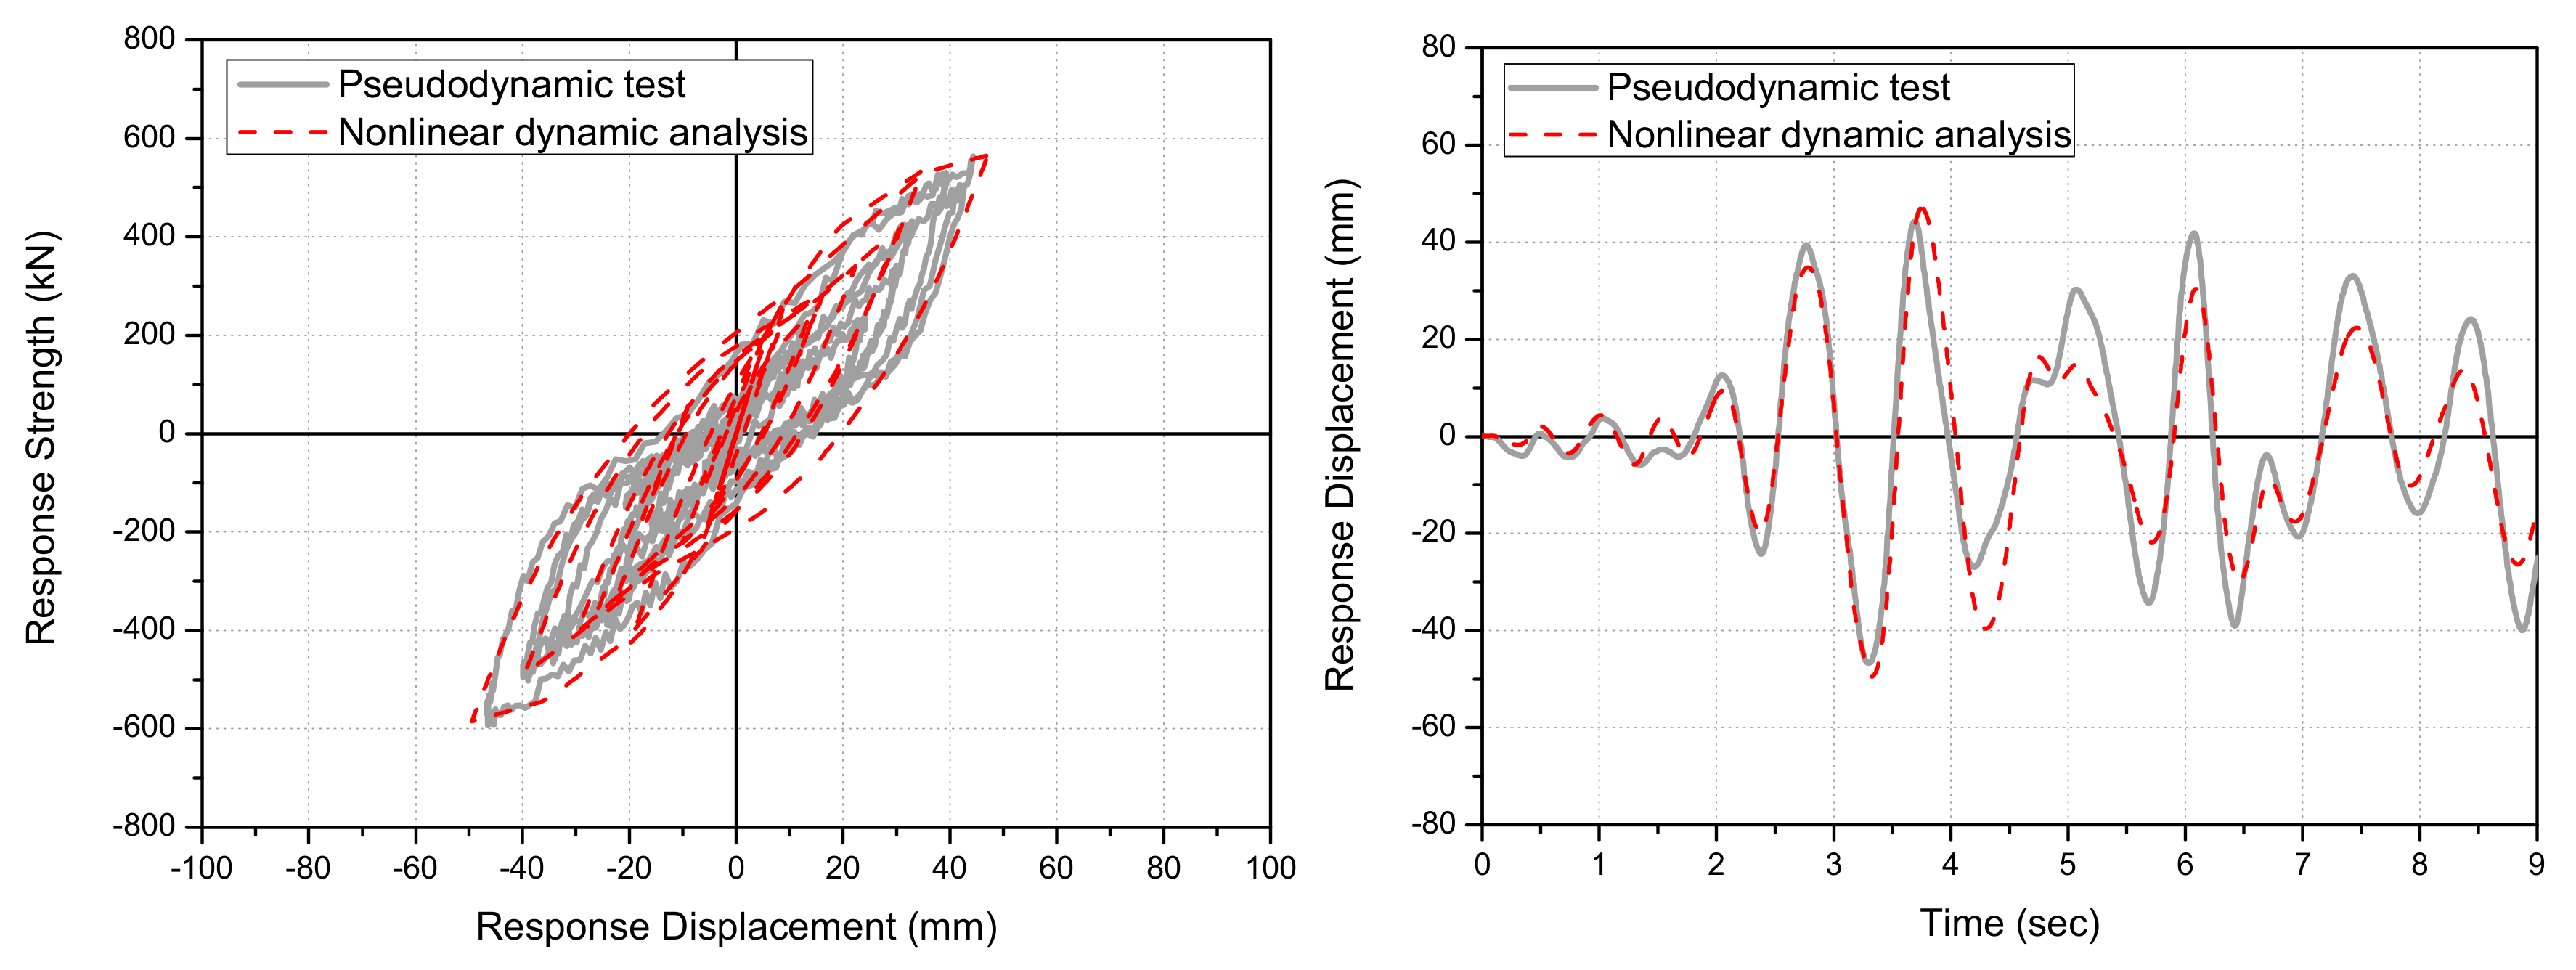
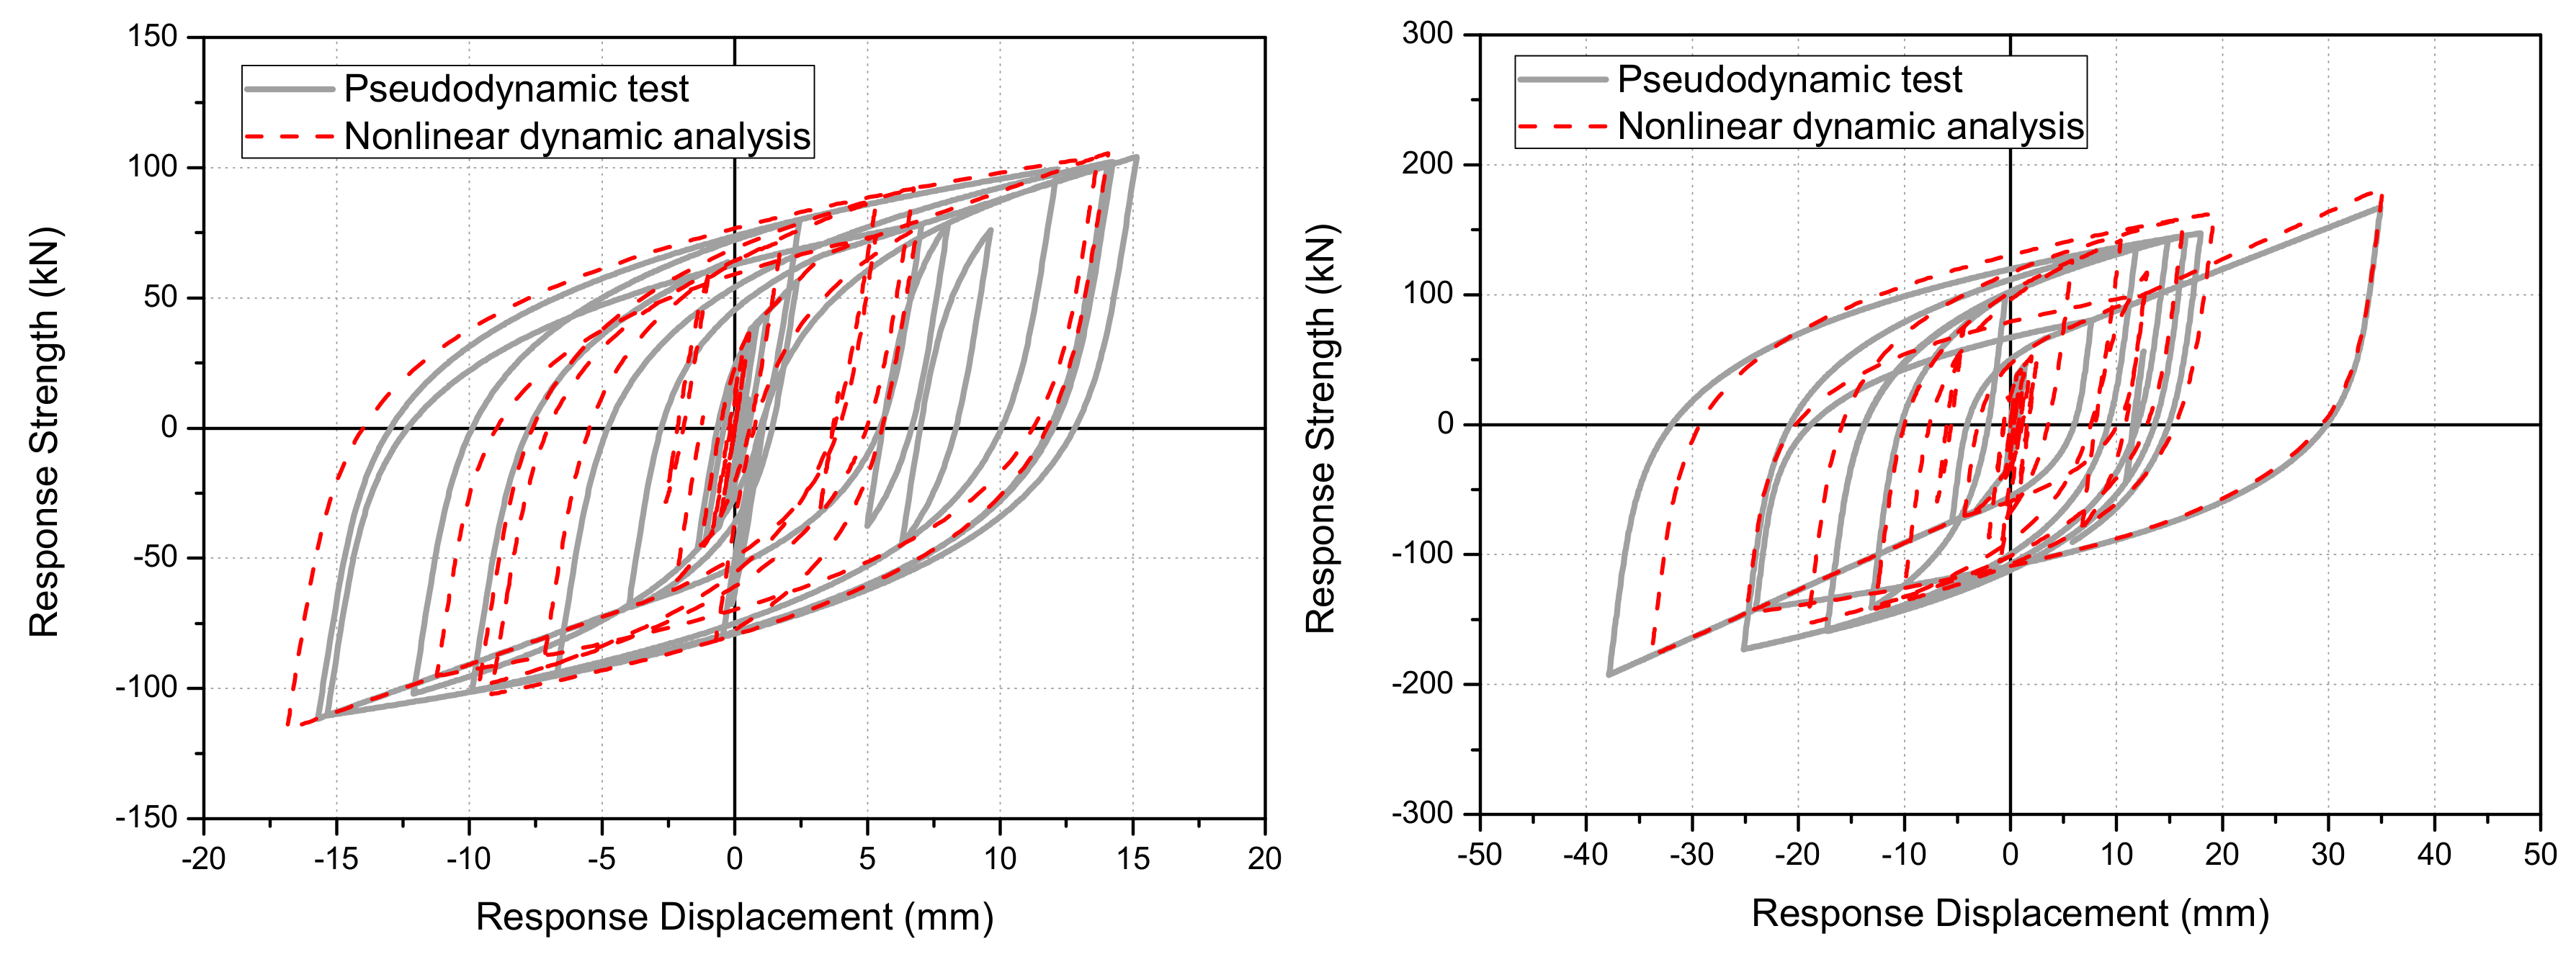
5.2. Comparison of the Nonlinear Dynamic Analysis and Pseudo-Dynamic Test Results
6. Seismic Performance Evaluation of RC Structures Retrofitted with the NBSD-Based Window-Type Seismic Control System
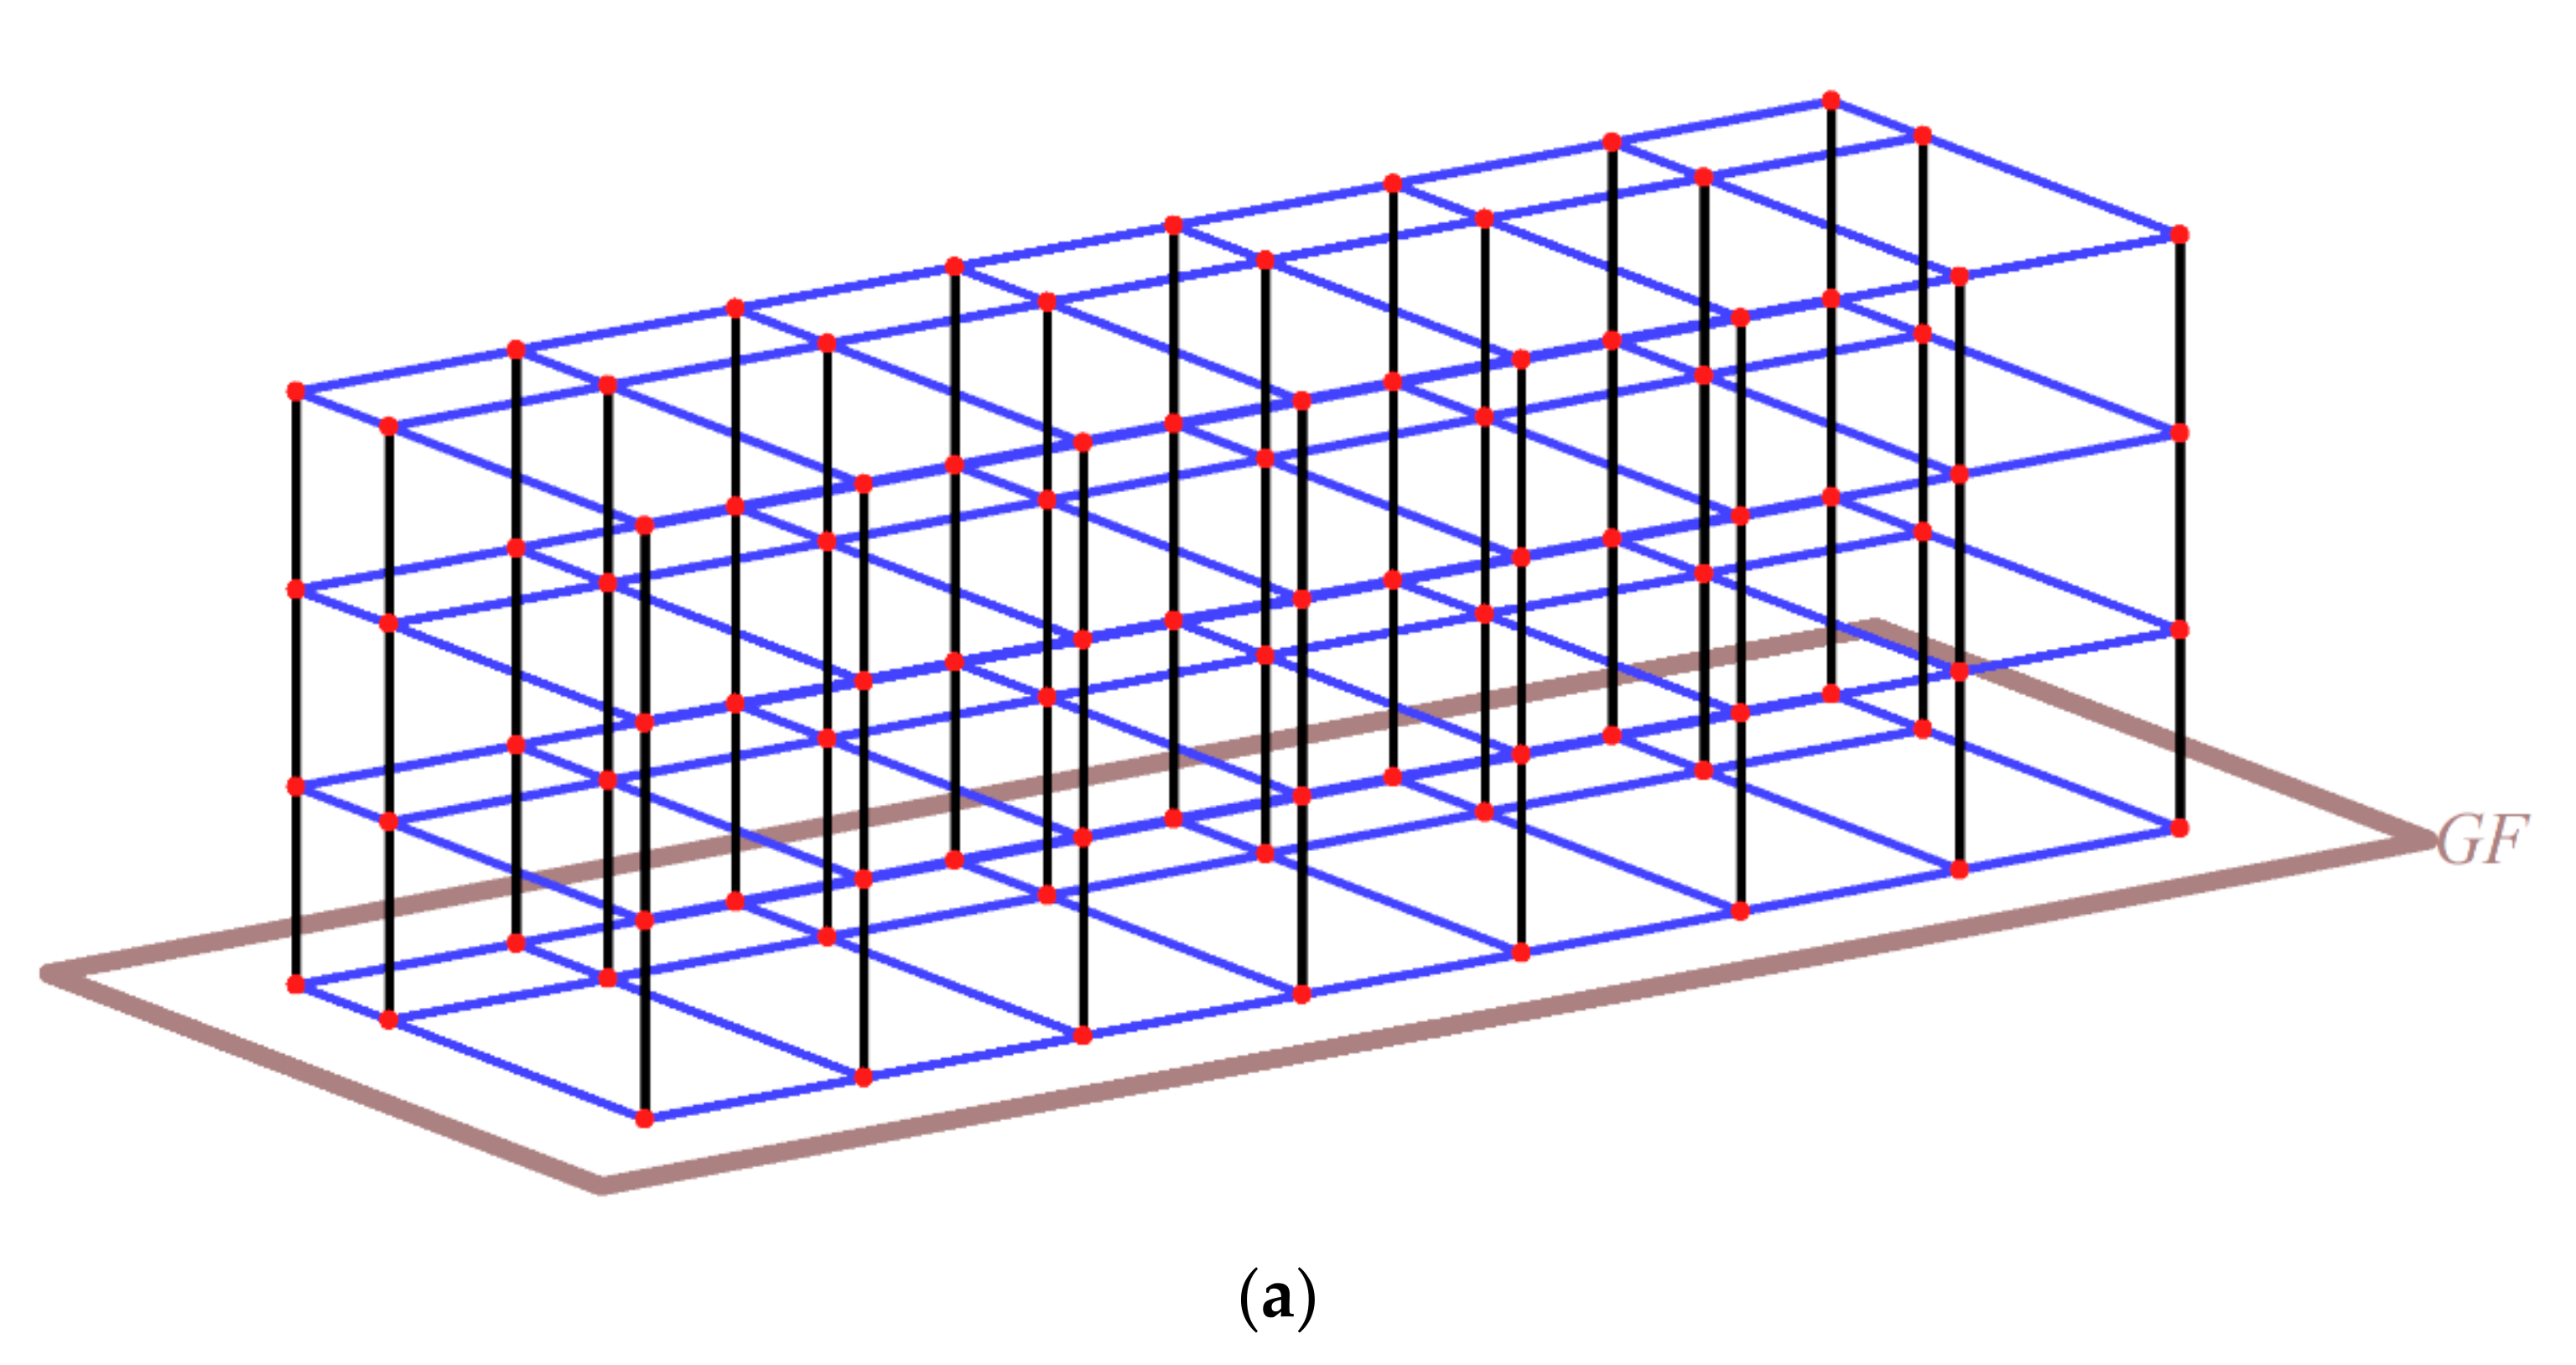
6.1. Overview of the Nonlinear Dynamic Analysis
6.2. Nonlinear Dynamic Analysis Results before and after Seismic Reinforcement
7. Conclusions
- (1)
- Cyclic loading tests were conducted according to the test method for displacement-controlled seismic control systems provided in KDS 41 [12] to check NBSD-WSCS for conformity with the seismic performance requirements. The results confirmed that the NBSD-based test specimen provided adequate performance as a displacement-controlled seismic control system.
- (2)
- Pseudo-dynamic testing was conducted at seismic intensity of 200 cm/s2. The results showed that the full-size two-story RC test frame with no reinforcement applied underwent shear failure, while only minor seismic damage was expected for the test frame retrofitted with NBSD-WSCS. Even when the seismic intensity was set to 300 cm/s2, only small or moderate seismic damage was expected. These results confirmed that, given that the test frame with no reinforcement applied underwent shear failure, the reinforcement using NBSD led to a failure mode shift from shear to flexural failure, demonstrating the significantly improved energy dissipation capacity of NBSD-WSCS developed in the present study.
- (3)
- In addition, based on material testing and pseudo-dynamic test results obtained from NBSD members, the characteristics of beams, columns, and reinforcing members (NBSD) with respect to restoring force were proposed to implement the nonlinear dynamic analysis of the full-size two-story test frame retrofitted with NBSD-WSCS. Further, based on the proposed restoring force characteristics, nonlinear dynamic analysis was conducted, and the results were compared with those obtained by the pseudo-dynamic tests. It was then found that the average deviation ratios in seismic response load and displacement were within 10%, i.e., the two methods provided similar results. This further confirmed that the nonlinear dynamic analysis model and methodology developed in the present study were able to effectively simulate and evaluate the seismic retrofitting performance of this novel NBSD-based WSCS via nonlinear dynamic analysis.
- (4)
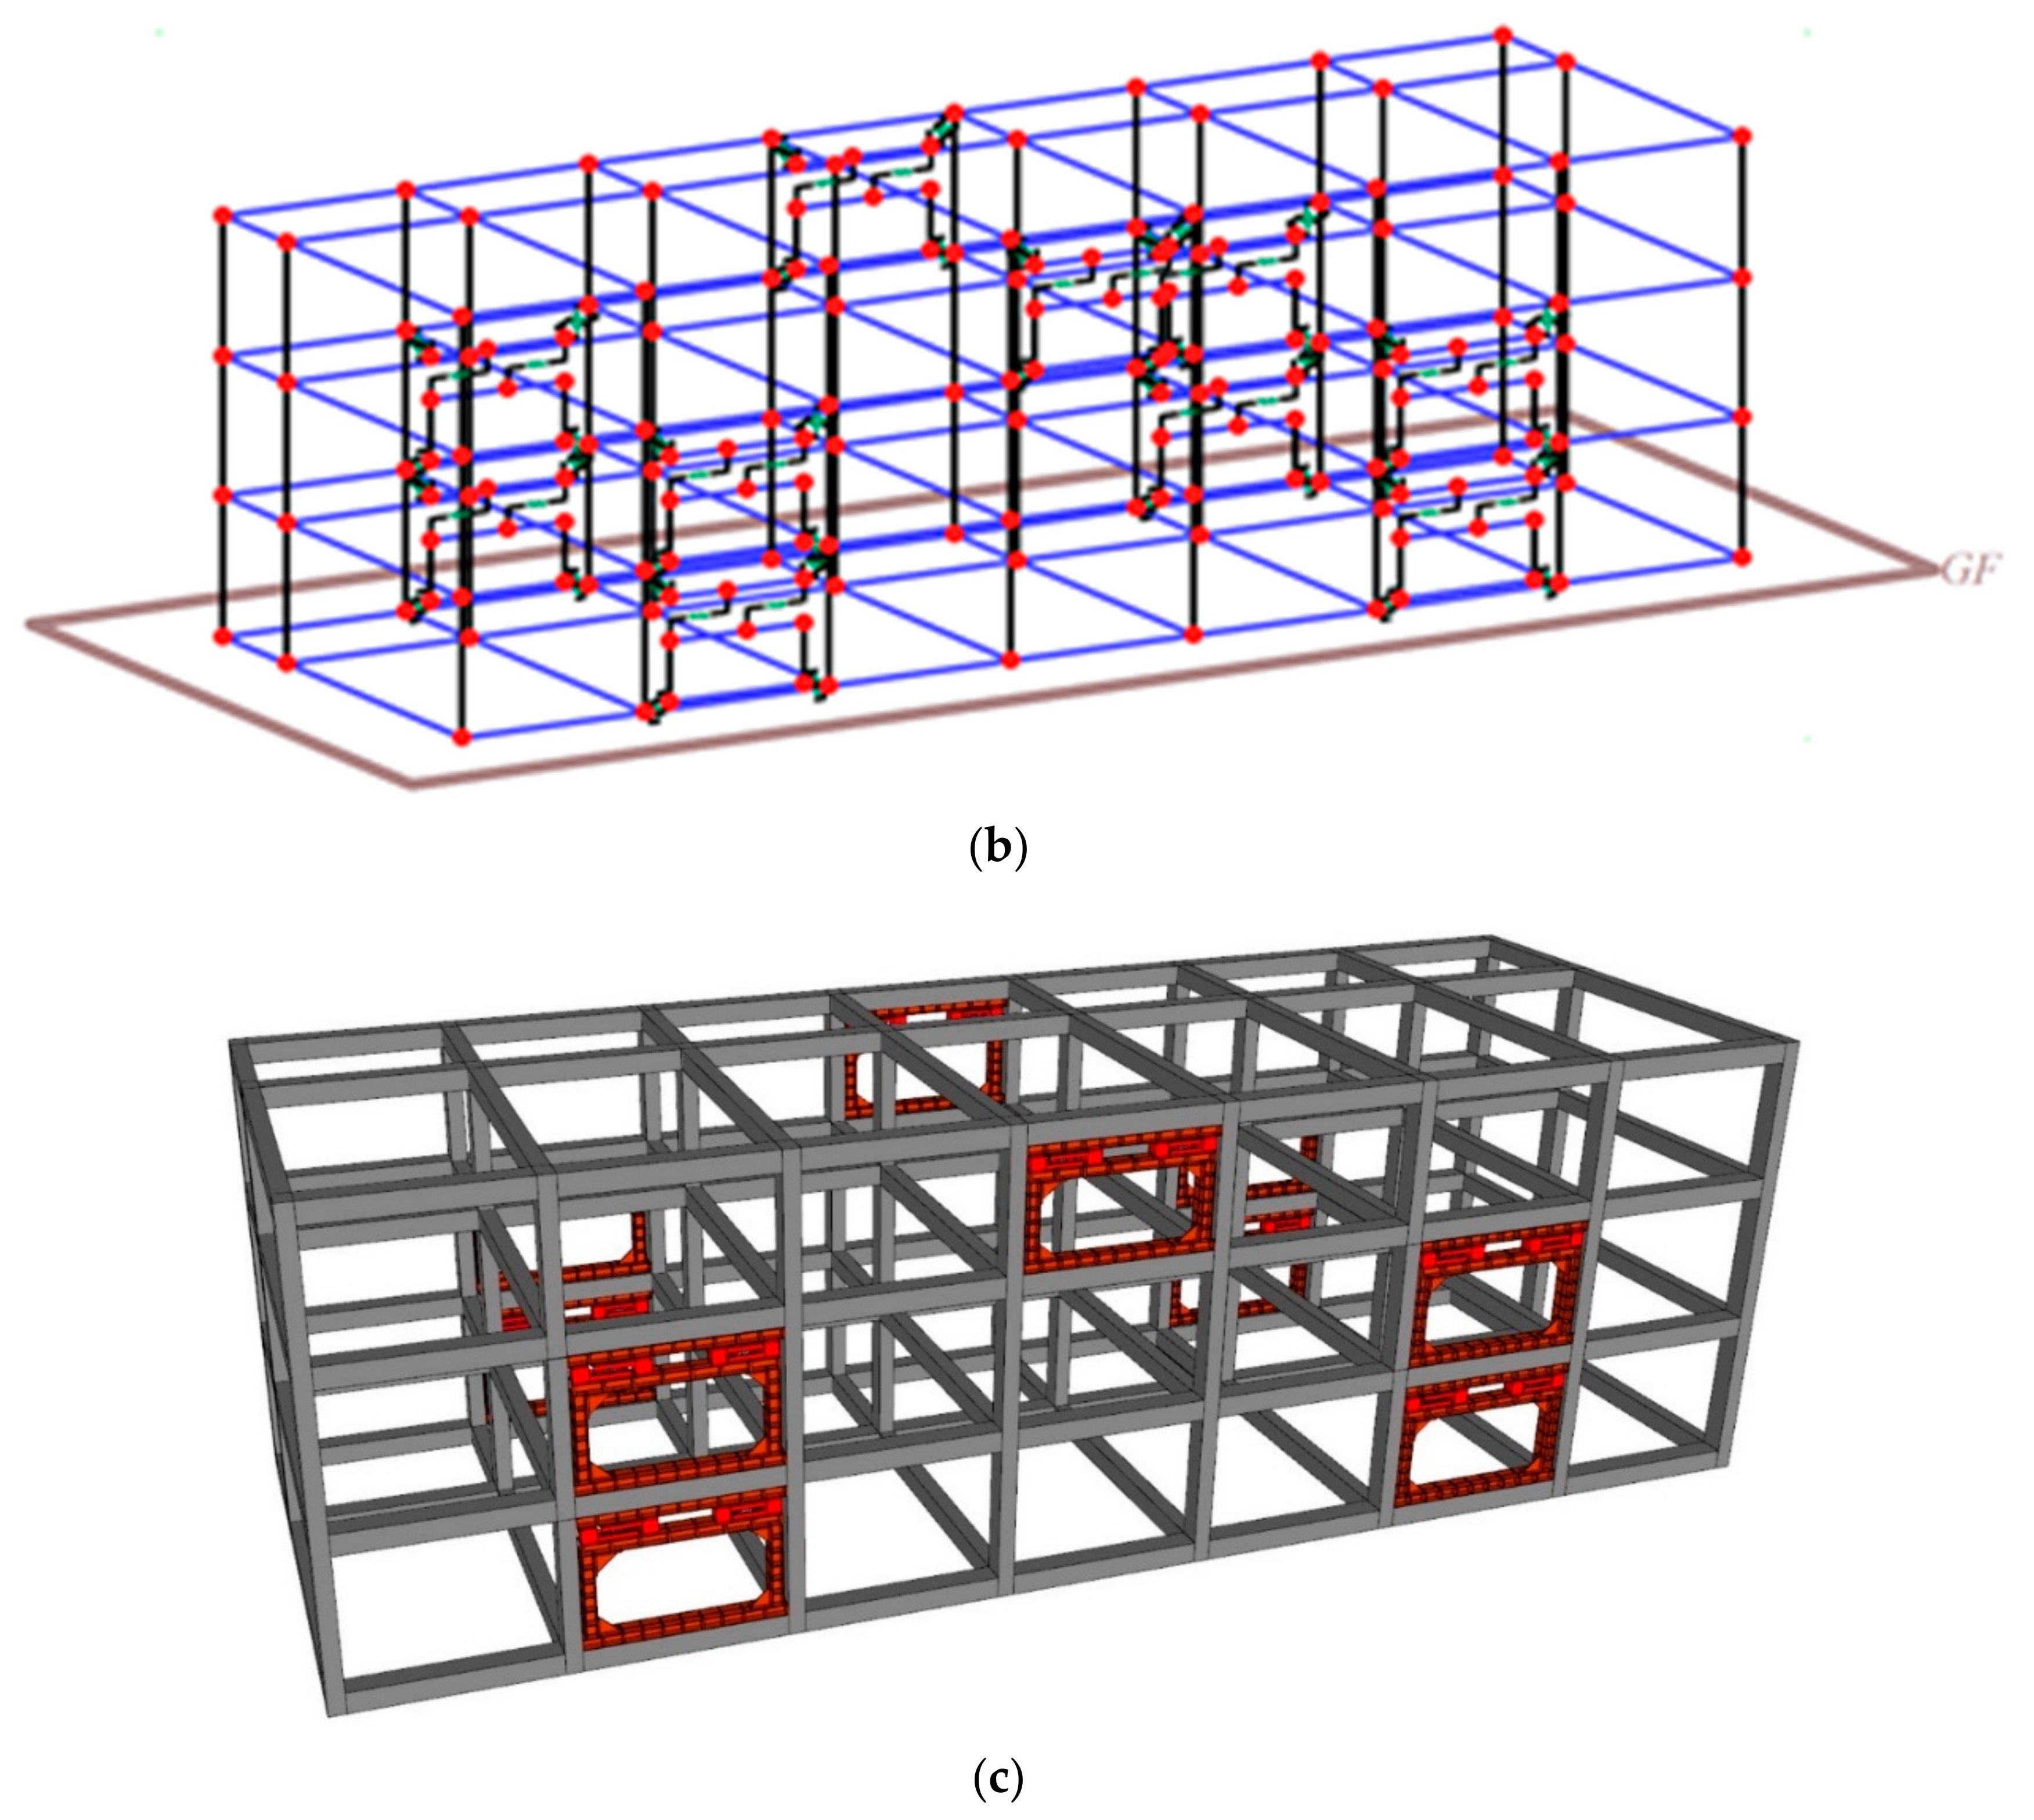
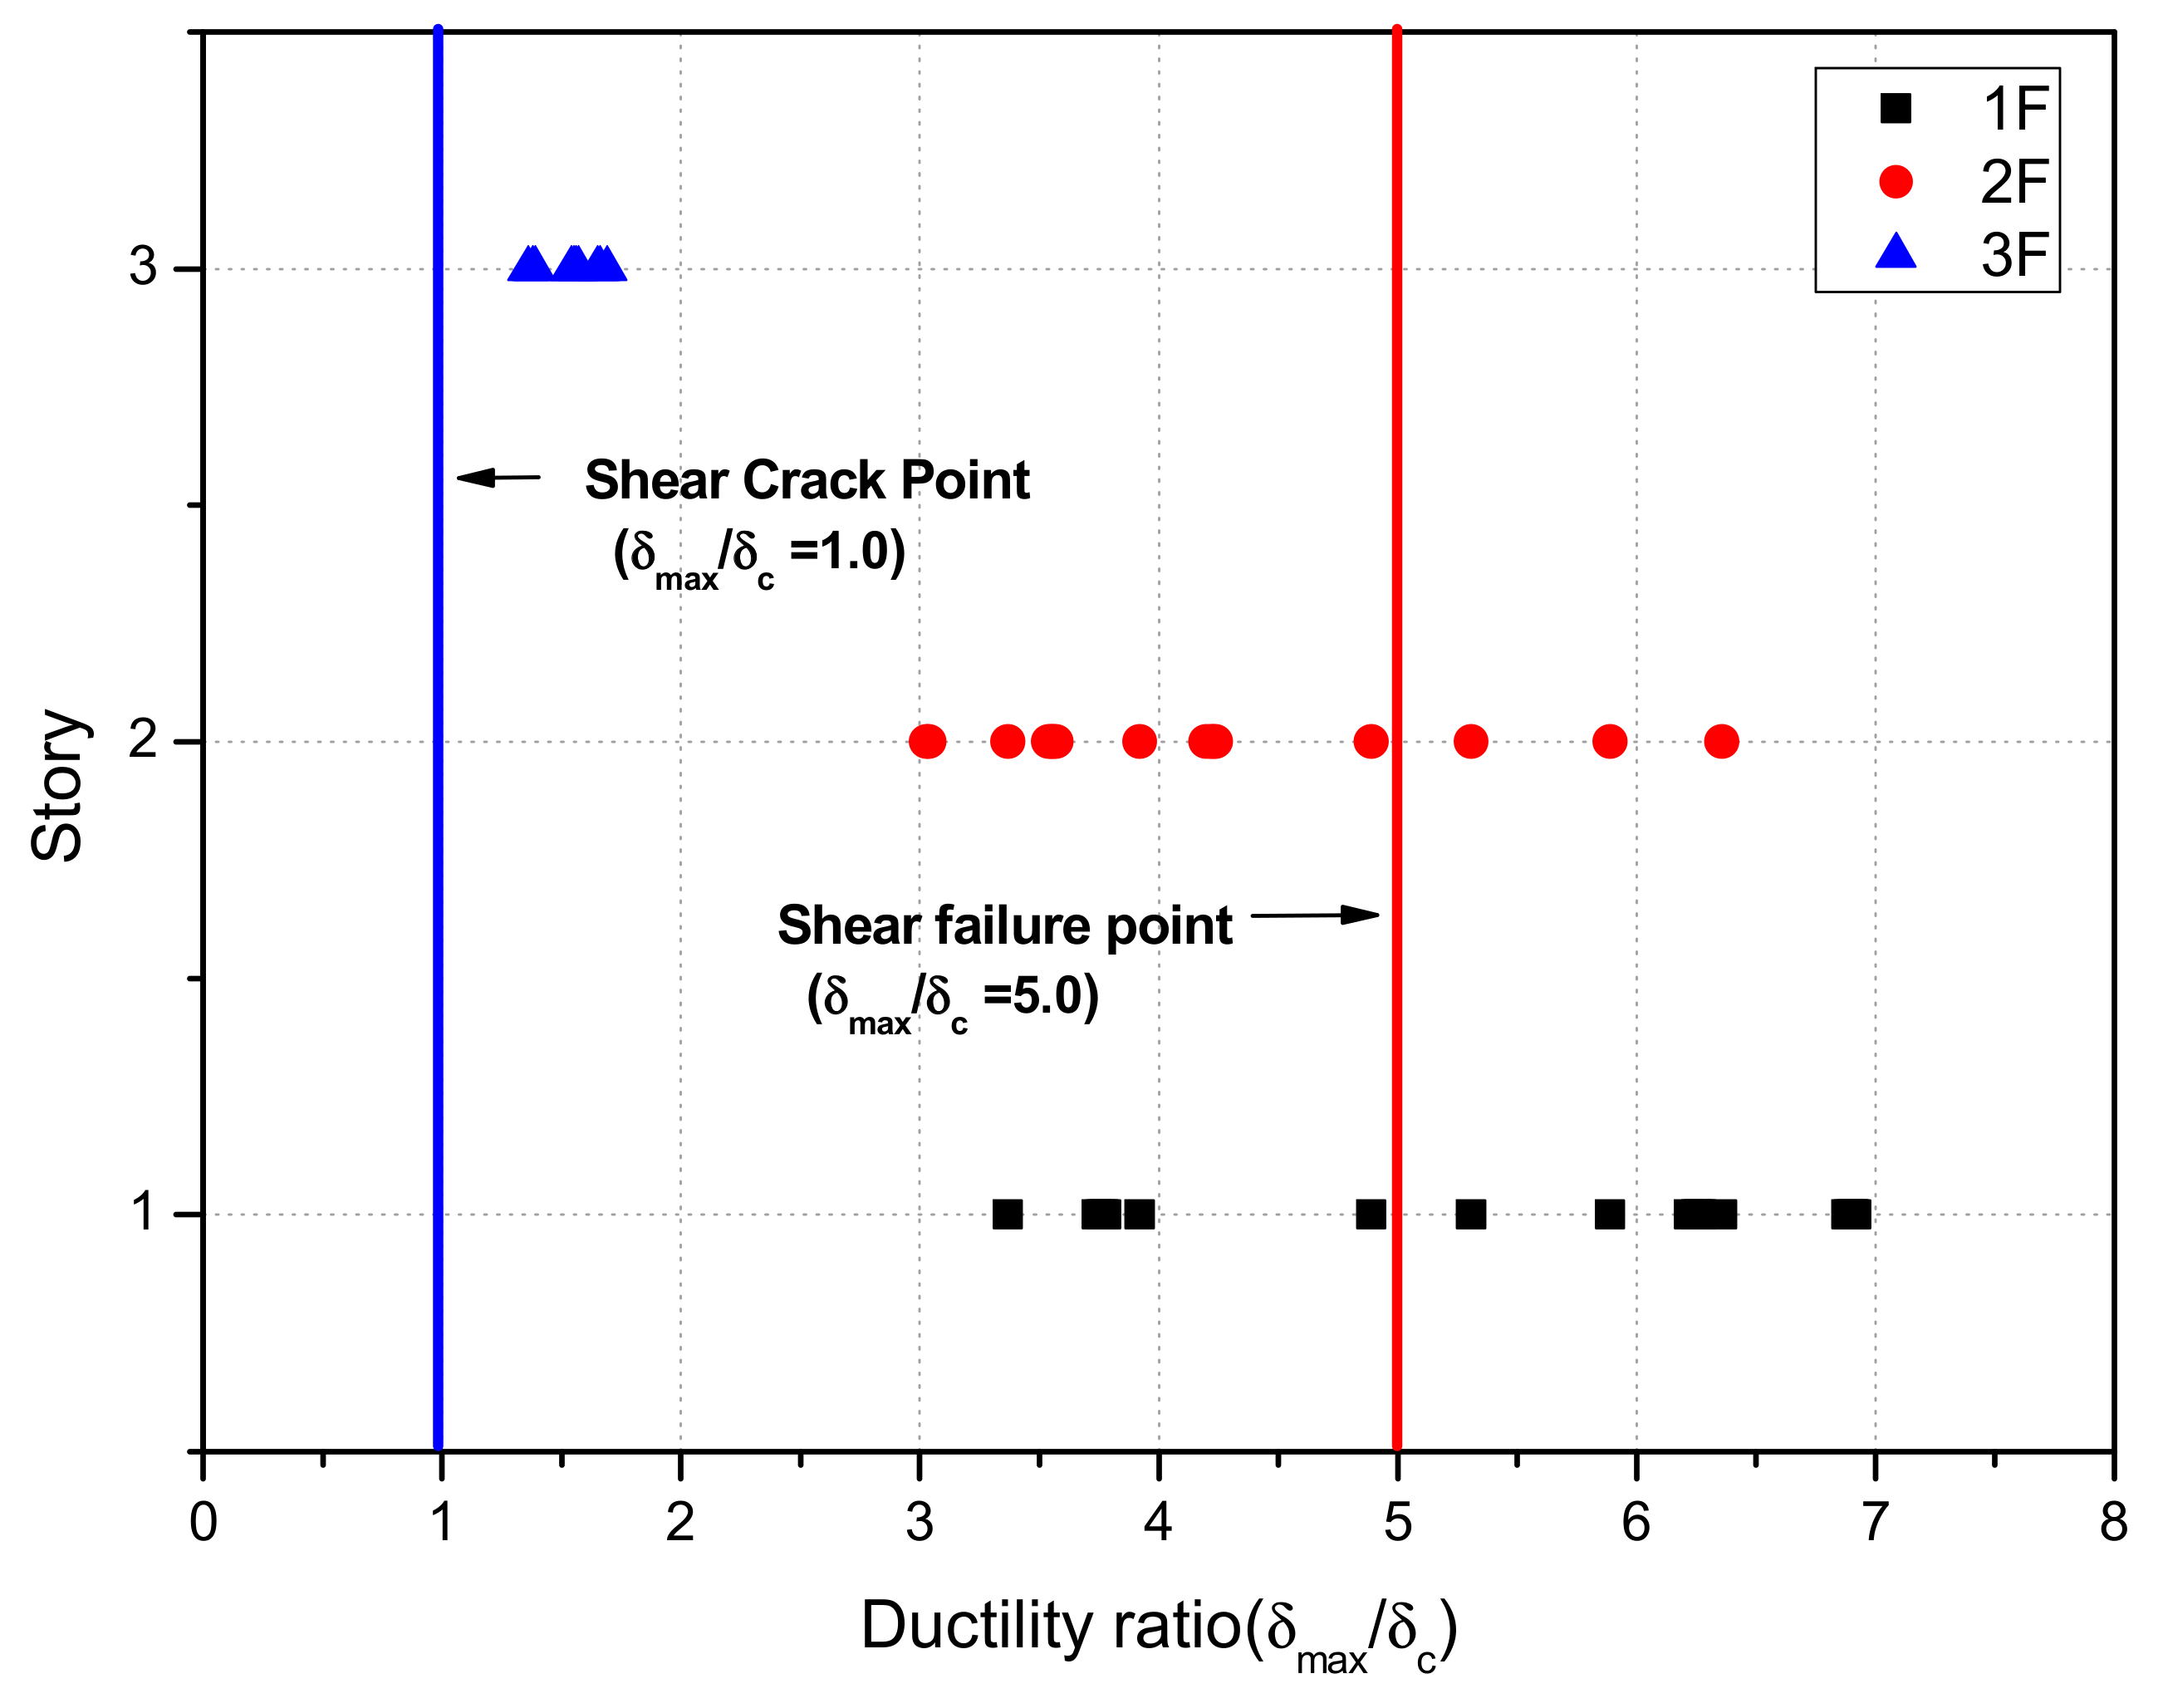
- In an attempt to commercialize this NBSD-based WSCS, nonlinear dynamic analysis was conducted on the entire RC building with non-seismic details retrofitted with NBSD-WSCS to examine the effect of seismic reinforcement. The results showed that the reference RC building with non-seismic details underwent shear collapse at seismic intensity of 200 cm/s2. In the RC building with non-seismic details retrofitted with NBSD-WSCS, however, NBSD-WSCS with excellent energy dissipation capacity was able to accommodate about 42% of the total energy exerted on the test building. Thus, only minor seismic damage was expected. The major findings of the present study clearly indicated that this novel seismic retrofitting method using the NBSD-based WSCS has a high potential for commercialization.
Author Contributions
Funding
Institutional Review Board Statement
Informed Consent Statement
Data Availability Statement
Acknowledgments
Conflicts of Interest
References
- Kobayashi, T.; Zen, K.; Yasufuku, N.; Nagase, H.; Chen, G.; Kasama, K.; Hirooka, A.; Wada, H.; Onoyama, Y.; Uchida, H. Damage to Residential RetainingWalls at the Genkai-Jima Island Induced by the 2005 Fukuoka-Ken Seiho-Oki Earthquake. Soil Found. 2006, 46, 793–804. [Google Scholar] [CrossRef] [Green Version]
- Miyamoto, H.K.; Gilani, A.S.; Wada, A. Reconnaissance report of the 2008 Sichuan earthquake, damage survey of buildings and retrofit options. In Proceedings of the 14th World Conference on Earthquake Engineering, Beijing, China, 12–17 October 2008. [Google Scholar]
- Sarrafzadeh, M.; Elwood, K.J.; Dhakal, R.P.; Ferner, H.; Pettinga, D.; Stannard, M.; Maeda, M.; Nakano, Y.; Mukai, T.; Koike, T. Performance of reinforced concrete buildings in the 2016 Kumamoto Earthquakes and seismic design in Japan. Bull. N. Z. Soc. Earthq. Eng. 2017, 50, 394–435. [Google Scholar]
- Architectural Institute of Korea (AIK). Site Inspection and Damage Investigation of Buildings by Earthquakes in Gyoungju and Pohang, Seoul, Korea. J. Korea Concr. Inst. 2018, 3, 1–47. [Google Scholar]
- KDS 41; Korean Design Standard. Architectural Institute of Korea: Seoul, Korea, 2019. (In Korean)
- FEMA 356; Prestandard and Commentary for Seismic Rehabilitation of Buildings. FEMA: Washington, DC, USA, 2000.
- Standard for Seismic Evaluation of Existing Reinforced Concrete Buildings, Guidelines for Seismic Retrofit of Existing Reinforced Concrete Buildings, and Technical Manual for Seismic Evaluation and Seismic Retrofit of Existing Reinforced Concrete Buildings. JBDPA: Tokyo, Japan, 2005.
- SSRG (Seismic Strengthening Research Group). Seismic Strengthening of RC Buildings; SSRG, Ohmsha Press: Tokyo, Japan, 2008. (In Japanese) [Google Scholar]
- Badoux, M.; Jirsa, O. Steel bracing of RC frames for seismic retrofitting. J. Struct. Eng. ASCE 1990, 116, 55–74. [Google Scholar] [CrossRef]
- Nateghi-Alahi, F. Seismic strengthening of eight-storey RC apartment building using steel braces. Eng. Struct. 1995, 17, 455–461. [Google Scholar] [CrossRef]
- Sugano, S. Seismic strengthening of existing reinforced concrete buildings in Japan. Bull. N. Z. Soc. Earthq. Eng. 1981, 14, 209–222. [Google Scholar] [CrossRef]
- Ju, M.; Lee, K.S.; Sim, J.; Kwon, H. Non-compression cross-bracing system using carbon fiber anchors for seismic strengthening of RC structures. Mag. Concr. Res. 2014, 66, 159–174. [Google Scholar] [CrossRef]
- Lee, K.S. An experimental study on non-compression X-bracing systems using carbon fiber cable for seismic strengthening of RC buildings. Polymers 2015, 7, 1716–1731. [Google Scholar] [CrossRef] [Green Version]
- Smith, S.T.; Kim, S.J. Shear strength and behavior of FRP spike anchors in FRP-to-concrete joint assemblies. In Proceedings of the Fifth International Conference on Advanced Composite Materials in Bridges and Structures (ACMBS-V), Winnipeg, MB, Canada, 22–24 September 2008; ISBN 978-0-9736430-7-7. [Google Scholar]
- Lee, K.S.; Lee, B.Y.; Seo, S.Y. A Seismic Strengthening Technique for Reinforced Concrete Columns Using Sprayed FRP. Polymers 2016, 8, 107. [Google Scholar] [CrossRef] [Green Version]
- Lee, K.S. Experimental study on sprayed FRP system for strengthening reinforced concrete beams. J. Adv. Concr. Technol. 2012, 10, 219–230. [Google Scholar] [CrossRef] [Green Version]
- American Society of Civil Engineers. ASCE 7-10 (2010) Minimum Design Loads for Buildings and Other Structures; ASCE (American Society of Civil Engineers): Reston, VI, USA, 2010. [Google Scholar]
- Matsagar, V.A.; Jangid, R.S. Base Isolation for Seismic Retrofitting of Structures. Pract. Period. Struct. Des. Constr. 2008, 13, 175–185. [Google Scholar] [CrossRef]
- Ferraioli, M.; Mandara, A. Base Isolation for Seismic Retrofitting of a Multiple Building Structure: Design, Construction, and Assessment. Math. Probl. Eng. 2017, 2017, 4645834. [Google Scholar] [CrossRef]
- Bruno, S.; Valente, C. Comparative response analysis of conventional and innovative seismic protection strategies. Earthq. Eng. Struct. Dyn. 2002, 31, 1067–1092. [Google Scholar] [CrossRef]
- Sahoo, D.R.; Rai, D.C. Seismic strengthening of non-ductile reinforced concrete frames using aluminum shear links as energy-dissipation devices. Eng. Struct. 2010, 32, 3548–3557. [Google Scholar] [CrossRef]
- Ibrahim, Y.E.; Marshall, J.; Charney, F.A. A visco-plastic device for seismic protection of structures. J. Constr. Steel Res. 2007, 63, 1515–1528. [Google Scholar] [CrossRef]
- Lee, C.-H.; Ryu, J.; Kim, D.-H.; Ju, Y.K. Improving seismic performance of non-ductile reinforced concrete frames through the combined behavior of friction and metallic dampers. Eng. Struct. 2018, 172, 304–320. [Google Scholar] [CrossRef]
- Sutcu, F.; Takeuchi, T.; Matsui, R. Seismic retrofit design method for RC buildings using buckling-restrained braces and steel frames. J. Constr. Steel Res. 2014, 101, 304–313. [Google Scholar] [CrossRef]
- Ramazan, O.; Yagmur, D.; Elif, E.F. The development of the buckling restrained braces with new end restrains. J. Constr. Steel Res. 2017, 138, 208–220. [Google Scholar]
- Ferraioli, M.; Lavino, A. A Displacement-Based Design Method for Seismic Retrofit of RC Buildings Using Dissipative Braces. Math. Probl. Eng. 2018, 2018, 5364564. [Google Scholar] [CrossRef]
- Eldin, M.N.; Dereje, A.J.; Kim, J. Seismic Retrofit of Framed Buildings Using Self-Centering PC Frames. J. Struct. Eng. 2020, 146, 04020208. [Google Scholar] [CrossRef]
- Bedon, C.; Amadio, C. Passive Control Systems for the Blast Enhancement of Glazing Curtain Walls Under Explosive Loads. Open Civ. Eng. J. 2017, 11, 396–419. [Google Scholar] [CrossRef] [Green Version]
- Bedon, C.; Amadio, C. Numerical assessment of vibration control systems for multi-hazard design and mitigation of glass curtain walls. J. Build. Eng. 2018, 15, 1–13. [Google Scholar] [CrossRef] [Green Version]
- Bedon, C.; Amadio, C. ADAS dampers for the hazard protection of multi-storey buildings with glazing envelopes: A feasibility study. Boll. Di Geofis. Teor. Ed. Appl. 2019, 60, 197–220. [Google Scholar]
- Ito, H.; Kasai, K. Passive control design for elasto-plastically damped building structure. In Proceedings of the Fifth International Conference on Behaviour of Steel Structures in Seismic Areas, STESSA 2006, Yokohama, Japan, 14–17 August 2006; Taylor & Francis Group: London, UK, 2006. [Google Scholar]
- JSSI (Japan Society of Seismic Isolation). JSSI Manual 2nd Edition: Design and Construction Manual for Passively Controlled Buildings; Japan Society of Seismic Isolation: Tokyo, Japan, 2007. [Google Scholar]
- Pu, W.; Kasai, K. Design Method for RC Building Structure Controlled by Elasto-Plastic Dampers Using Performance Curve. In Proceedings of the 15th World Conference on Earthquake Engineering, Lisbon, Portugal, 24–28 September 2012. [Google Scholar]
- Kafi, M.A.; Hoosh, K.N. The geometric shape effect of steel slit dampers in their behavior. Mag. Concr. Res. 2019, 3, 3–17. [Google Scholar]
- KS B 0801; Test Pieces for Tension Test for Metallic Materials. Korean Industrial Standards: Seoul, Korea, 2017. (In Korean)
- KS B 0802 (2018); Method of Tensile Test for Metallic Materials. Korean Standards Association: Seoul, Korea, 2018. (In Korean)
- AIK (Architectural Institute of Korea). Design Guideline and Examples of Seismic Energy Dissipating System; AIK: Seoul, Korea, 2012. (In Korean) [Google Scholar]
- Benavent Climent, A.; Oh, S.H.; Akiyama, H. Ultimate energy absorption capacity of slit-type steel plates subjected to shear deformations. J. Struct. Constr. Eng. 1998, 503, 139–145. [Google Scholar] [CrossRef] [Green Version]
- Standard for Structural Calculation of Reinforced Concrete Structures. AIJ: Tokyo, Japan, 2010. (In Japanese)
- Umemura, H. Earthquake Resistant Design of Reinforced Concrete Buildings, Accounting for the Dynamic Effects of Earthquakes; Giho-do Publishing Co.: Tokyo, Japan, 1973. (In Japanese) [Google Scholar]
- Takanashi, K.; Udagawa, K.; Tanaka, H. Pseudo-dynamic tests on a 2-storey steel frame by a computer-load test apparatus hybrid system. In Proceedings of the 7th World Conference on Earthquake Engineering, Istanbul, Turkey, 8–13 September 1980. [Google Scholar]
- Tokyo Soki Kenkyujo Company. Tokyo, Japan. 2020. Available online: https://www.tml.jp/e/ (accessed on 15 December 2021).
- MTS Systems Corporation. Pseudodynamic Testing for 793 Controllers; MTS Systems Corporation: Eden Prairie, MI, USA, 2020. [Google Scholar]
- Hilber, H.M.; Hughes, T.J.; Taylor, R.L. Improved numerical dissipation for time integration algorithms in structural dynamics. Earthq. Eng. Struct Dyn. 1977, 5, 283–292. [Google Scholar] [CrossRef] [Green Version]
- Lee, K.S. Seismic capacity requirements for low-rise reinforced concrete buildings controlled by both shear and flexure. J. Adv. Concr. Technol. 2010, 8, 75–91. [Google Scholar] [CrossRef] [Green Version]
- Lee, K.S.; Wi, J.D.; Kim, Y.I.; Lee, H.H. Seismic safety evaluation of Korean RC school buildings built in the 1980s. J. Korean Inst. Struct. Maint. Insp. 2009, 13, 149–159. [Google Scholar]
- Standard for Damage Level Classification. JBDPA: Tokyo, Japan; p. 2017.
- Maeda, M.; Nakano, Y.; Lee, K.S. Postearthquake damage evaluation for RC buildings based on residual seismic capacity. In Proceedings of the 13th World Conference on Earthquake Engineering, Vancouver, BC, Canada, 1–6 August 2004. [Google Scholar]
- Jung, J.S.; Lee, K.S. A Seismic Capacity of RC Building Damaged by the 2016 Gyeongju Earthquake Based on the Non-linear Dynamic Analysis. J. Korea Inst. Struct. Maint. Insp. 2018, 22, 137–146. [Google Scholar]
- Li, K.N. Canny: A 3-Dimensional Nonlinear Dynamic Structural Analysis Computer Program, User Manual; CANNY Structural Analysis Company: Vancouver, BC, Canada, 2009. [Google Scholar]
- Matsumoto, Y.; Kitajima, K.; Nakanishi, M.; Adachi, H. A Study on Seismic Retrofit Design of Exiting RC Buildings by means of Friction Damper. Trans. Jpn. Concr. Inst. 2000, 21, 431–438. [Google Scholar]
- Yokouchi, H.; Kitajima, K.; Nakanishi, M.; Adachi, H.; Aoyama, H. Experimental Study on Retrofit Effect of an Existing RC School Building Retrofitted with Energy Dissipation Devices. J. Struct. Constr. Eng. (Trans. AIJ) 2005, 70, 145–152. [Google Scholar] [CrossRef]
- Jung, J.S.; Lee, K.S. A methodology for evaluating seismic capacity and seismic risk assessment of reinforced concrete buildings in Korea. J. Asian Archit. Build. Eng. 2020, 19, 103–122. [Google Scholar] [CrossRef] [Green Version]


| Specimen Name | Number of Dampers Used (N) | Yield Strength of the Steel Plate (MPa) | Thickness (mm) | Fillet Radius (mm) | Strut Width (mm) | Strut Height (mm) | Number of Struts (n) | Design Yield Strength (Kn) | Design Yield Displacement (mm) |
|---|---|---|---|---|---|---|---|---|---|
| NBSD-1 | 2 | 275 | 10 | 10 | 35 | 130 | 4 | 102.6 | 0.69 |
| NBSD-2 |
| Specimen Name | Maximum Control Displacement | Yield | Positive Load | Negative Load | (kN/mm2) | |||
|---|---|---|---|---|---|---|---|---|
(mm) | (kN) | (mm) | (kN) | (mm) | (kN) | |||
| NBSD-1 | 33 | 1.49 | 76.0 | 32.6 | 205.9 | 32.5 | 216.5 | 51.0 |
| NBSD-2 | 1.56 | 80.8 | 32.3 | 201.6 | 32.6 | 215.5 | 51.7 | |
| Specimen Name | Stiffness (kN/mm) | |||
|---|---|---|---|---|
| NBSD-1 | 51.0 | 11.4 | 6.6 | 6.5 |
| NBSD-2 | 51.7 | 11.8 | 8.1 | 6.4 |
| Specimen Name | Control Displacement (mm) | (kN·m) | (kN·m) | (kN·m) | ||
|---|---|---|---|---|---|---|
| NBSD-1 | 11 | 2.79 | 0.69 | 0.32 | 0.36 | 119.5 |
| 22 | 8.43 | 1.6 | 0.42 | |||
| 33 | 17.01 | 3.54 | 0.38 | |||
| NBSD-2 | 11 | 2.67 | 0.71 | 0.3 | 0.34 | 116.1 |
| 22 | 8.19 | 1.96 | 0.34 | |||
| 33 | 16.54 | 3.48 | 0.38 |
| Criterion | Performance Requirements |
|---|---|
| 1 | During cyclic loading for a certain number of cycles, both maximum load (Qmax) and minimum load (Qmin) measured at the zero-displacement point are required to be within 15% of the average of all measured loads. |
| 2 | During cyclic loading for a certain number of cycles, the loads measured in each direction at the maximum device displacement are required to be within 15% of the average of all measured loads. |
| 3 | During cyclic loading for a certain number of cycles, the area of hysteresis loop measured from the damper (ED) is required to be within 15% of the average of all measured hysteresis loop areas (ED,ave). |
| Division | Performance Requirements | ||||
|---|---|---|---|---|---|
| Criterion 1 | Cycle | 1 | 2 | 3 | Average |
| Qmax (kN) | 153.4 | 153.1 | 154.1 | 153.3 | |
| Qmin (kN) | −167.9 | −169.8 | −171.7 | −169.8 | |
| (Qmax − Qave)/Qave | −0.0001 | −0.002 | 0.003 | ||
| (Qmin − Qave)/Qave | −0.01 | 0 | 0.01 | ||
| Results | Conforming | Conforming | Conforming | - | |
| Criterion 2 | Cycle | 1 | 2 | 3 | Average |
| Qmax (kN) | 206.1 | 204.2 | 196.6 | 202.3 | |
| Qmin (kN) | −212.5 | −212.7 | −216.4 | −213.8 | |
| (Qmax − Qave)/Qave | 0.01 | 0.009 | −0.02 | ||
| (Qmin − Qave)/Qave | −0.006 | −0.005 | 0.01 | ||
| Results | Conforming | Conforming | Conforming | - | |
| Criterion 3 | Cycle | 1 | 2 | 3 | Average |
| ED (kN·m) | 17.0 | 16.4 | 17.7 | 17.01 | |
| (ED − ED,ave)/ED,ave | −0.001 | −0.03 | 0.04 | ||
| Results | Conforming | Conforming | Conforming | - | |
| Division | Performance Requirements | ||||
|---|---|---|---|---|---|
| Criterion 1 | Cycle | 1 | 2 | 3 | Average |
| Qmax (kN) | 139.7 | 141.6 | 144.5 | 141.9 | |
| Qmin (kN) | −160.7 | −162.6 | −165.9 | −163.0 | |
| (Qmax − Qave) Qave | −0.01 | −0.002 | 0.01 | ||
| (Qmin − Qave)/Qave | −0.01 | −0.002 | 0.01 | ||
| Results | Conforming | Conforming | Conforming | - | |
| Criterion 2 | Cycle | 1 | 2 | 3 | Average |
| Qmax (kN) | 192.5 | 196.3 | 202.0 | 196.9 | |
| Qmin (kN) | −208.7 | −212.5 | −214.4 | −211.8 | |
| (Qmax − Qave)/Qave | −0.02 | −0.003 | 0.02 | ||
| (Qmin − Qave)/Qave | −0.01 | 0.002 | 0.01 | ||
| Results | Conforming | Conforming | Conforming | - | |
| Criterion 3 | Cycle | 1 | 2 | 3 | Average |
| ED (kN·m) | 16.4 | 16.1 | 17.1 | 16.5 | |
| (ED − ED,ave)/ED,ave | −0.008 | −0.02 | 0.03 | ||
| Results | Conforming | Conforming | Conforming | - | |
| Specimen Name | Test Method | Reinforcing Method | Input Seismic Wave Intensity (cm/s2) |
|---|---|---|---|
| PD-FR | Pseudo-dynamic testing | - | 200 |
| PD-NBSD-WSCS | Pseudo-dynamic testing | The NBSD-based window-type seismic control system | 200/300/400 |
| Specimen Name | Input Seismic Ground Motion | Input Seismic Ground Motion (cm/s2) | Maximum Load Vu (kN) | Maximum Displacement δu (mm) | Degree of Seismic Damage * (Failure Mode) |
|---|---|---|---|---|---|
| PD-FR | Hachinohe (EW) | 200 | 272.5 | 70.2 | Collapse (shear failure) |
| PD-NBSD-WSCS | 200 | 419.5 | 23.8 | Small (flexural cracks) | |
| 300 | 592.9 | 46.6 | Moderate (flexural shear cracks) | ||
| 400 | 711.9 | 85.6 | Large (flexural shear failure) |
| Specimen Name | Input Seismic Ground Motion | Degree of Acceleration (cm/s2) | Seismic Response Load | Seismic Response Displacement | ||
|---|---|---|---|---|---|---|
| Maximum Load Vu (kN) | Maximum Strength Ratios Rs *1 | Maximum Displacement δu (mm) | Displacement Ratios Rd *2 | |||
| PD-FR | Hachinohe (EW) | 200 | 272.5 | 1.00 (272.5/272.5) | 70.2 | 1.00 (70.2/70.2) |
| PD-NBSD-WSCS | Hachinohe (EW) | 200 | 419.5 | 1.53 (419.5/272.5) | 23.8 | 0.33 (23.8/70.2) |
| 300 | 592.9 | 2.17 (592.9/272.5) | 46.6 | 0.66 (46.6/70.2) | ||
| 400 | 711.9 | 2.61 (592.9/272.5) | 85.6 | 1.21 (46.6/70.2) | ||
| Test Specimen | (kN/mm) | (kN) | (kN) | Energy Dissipation [Test] (kN·m) | Energy Dissipation [Analysis] (kN·m) | Error Rate [Test/Analysis] (%) | |||
|---|---|---|---|---|---|---|---|---|---|
| NBSD | 65.1 | 37.8 | 0.161 | 66.4 | 0.056 | 5.0 | 119.5 | 118.3 | 1.01 [119.5/118.3] |
| Member | Restoring Force Model | Model Name | |
|---|---|---|---|
| Beam | Flexural spring | CP3 | Cross-peak trilinear model |
| Shear spring | OO3 | Trilinear origin-oriented | |
| Column | Flexural spring | CA7 | CANNY sophisticated trilinear hysteresis model |
| Shear spring | OO3 | Trilinear origin-oriented | |
| Axial spring | AE1 | Axial stiffness model | |
| Wall | Shear spring | OO3 | Trilinear origin-oriented |
| Anchor bolt | Shear spring | EL2 | Bilinear elastic model |
| NBSD | Damper spring | RO3 | Modified Ramberg-Osgood model |
| Steel frame (H-beam) | Flexural spring | BL2 | Degrading bilinear model |
| Shear spring | EL1 | Linear elastic model | |
| Specimen Name | Input Seismic Acceleration (cm/s2) | Method | Maximum Displacement (mm) | Maximum Displacement Deviation Ratio [Analytical/ Experimental] | Maximum Load (kN) | Maximum Load Deviation Ratio [Analytical/ Experimental] |
|---|---|---|---|---|---|---|
| PD-FR | 200 | Pseudo-dynamic testing | 70.2 | 1.02 | 272.5 | 0.96 |
| Nonlinear dynamic analysis | 71.9 | 263.0 | ||||
| PD-NBSD-WSCS | 200 | Pseudo-dynamic testing | 26.4 | 0.90 | 356.2 | 1.17 |
| Nonlinear dynamic analysis | 23.9 | 419.5 | ||||
| 300 | Pseudo-dynamic testing | 49.4 | 0.94 | 584.2 | 1.01 | |
| Nonlinear dynamic analysis | 46.6 | 592.9 |
| Estimation of the Target Building’s Seismic Performance | ||||||
| Floor | Floor height (mm) | Weight of each floor W (kN) | Yield displacement (mm) | Yield proof stress (kN) | Failure mode | Basic seismic capacity index |
| 1 | 3300 | 1133.4 | 24.1 | 2779 | Shear failure | 0.24 |
| 2 | 3300 | 7556 | 27.9 | 2268 | Shear failure | 0.24 |
| 3 | 3300 | 3778 | 18.0 | 1343.7 | Shear failure | 0.23 |
| Estimation of Required Amount of Reinforcement | ||||||
| Damper’s yield displacement *1 (mm) | Damper yield proof stress *2 (kN) | Cumulative plastic deformation ratio | Target seismic capacity by Reinforcement *3 | Required damper stress | Required number of dampers [EA] | Number of dampers applied [EA] |
| 1.5 | 152.0 | 10 | 0.52 | 537.9 | 3.53 | 4 |
| 0.52 | 445.7 | 2.93 | 4 | |||
| 0.52 | 282.6 | 1.85 | 2 | |||
| Building | Floor | Maximum Response Stress | Maximum Response Displacement | Failure Mode or Crack Patterns | Degree of Seismic Damage |
|---|---|---|---|---|---|
| No reinforcement applied | 1 | 3584.2 | 49.1 | Shear failure | Collapse |
| 2 | 2651.9 | 38.2 | Shear failure | Large | |
| 3 | 1411.3 | 22.6 | Shear cracks | Small | |
| Retrofitted with NBSD | 1 | 3602.8 | 17.0 | Flexural/shear cracks | Small |
| 2 | 2951.6 | 14.3 | Flexural/shear cracks | Small | |
| 3 | 1627.1 | 9.5 | Flexural cracks | Insignificant |
| Building | Kinetic Energy (kN·m) | Plastic Deformation Energy (kN·m) | Damping Energy (kN·m) | Total Energy | Plastic Deformation Energy of NBSD-WSCS (kN·m) | Contribution of NBSD-WSCS (%) |
|---|---|---|---|---|---|---|
| NBSD-WSCS | 0.1 | 328.1 | 28.5 | 357.0 | 149.5 | 41.8 |
Publisher’s Note: MDPI stays neutral with regard to jurisdictional claims in published maps and institutional affiliations. |
© 2022 by the authors. Licensee MDPI, Basel, Switzerland. This article is an open access article distributed under the terms and conditions of the Creative Commons Attribution (CC BY) license (https://creativecommons.org/licenses/by/4.0/).
Share and Cite
Lee, K.-S.; Lee, B.-G.; Jung, J.-S. Seismic Strengthening of R/C Buildings Retrofitted by New Window-Type System Using Non-Buckling Slit Dampers Examined via Pseudo-Dynamic Testing and Nonlinear Dynamic Analysis. Appl. Sci. 2022, 12, 1220. https://doi.org/10.3390/app12031220
Lee K-S, Lee B-G, Jung J-S. Seismic Strengthening of R/C Buildings Retrofitted by New Window-Type System Using Non-Buckling Slit Dampers Examined via Pseudo-Dynamic Testing and Nonlinear Dynamic Analysis. Applied Sciences. 2022; 12(3):1220. https://doi.org/10.3390/app12031220
Chicago/Turabian StyleLee, Kang-Seok, Bok-Gi Lee, and Ju-Seong Jung. 2022. "Seismic Strengthening of R/C Buildings Retrofitted by New Window-Type System Using Non-Buckling Slit Dampers Examined via Pseudo-Dynamic Testing and Nonlinear Dynamic Analysis" Applied Sciences 12, no. 3: 1220. https://doi.org/10.3390/app12031220
APA StyleLee, K.-S., Lee, B.-G., & Jung, J.-S. (2022). Seismic Strengthening of R/C Buildings Retrofitted by New Window-Type System Using Non-Buckling Slit Dampers Examined via Pseudo-Dynamic Testing and Nonlinear Dynamic Analysis. Applied Sciences, 12(3), 1220. https://doi.org/10.3390/app12031220