Abstract
It is well known that the effect of shale hydration causes wellbore instability due to water phase invasion of drilling fluid to lamellar shale rich formations. This is because of that the mechanical properties (compressive strength, elastic modulus, etc.) of lamellar shale surrounding the borehole, which is rich in clay minerals, will decrease significantly after hydration. In this study, using the lamellar shale in the continental stratum of the southern Ordos Basin, the mechanical properties of lamellar shale were studied by compression tests considering the effect of lamellar structure and hydration from a macroscopic point of view. In addition, the mechanical mechanism was discussed combined with the CT scanning tests results from a microscopic point of view. The results demonstrate the following points. Lamellar shale has stronger anisotropy than bedding shale, the compressive strength (deviatoric stress) and elastic modulus of lamellar shale are both lower than those of bedding shale, and it is more prone to tension fracture. With the increase in the angle (β) between the lamina and the axial direction from 0° to 90°, the compressive strength of lamellar shale decreases when β < 30° and then increases, the elastic modulus of lamellar shale decreases greatly when β < 30° and then tends to flatten. With the increase in hydration time, the compressive strength and elastic modulus of lamellar shale both gradually decrease, and the rates of their decrements reduce. The mechanical properties of lamellar shale are more affected by hydration than those of bedding shale. The hydration of lamellar shale leads to the formation of new fractures and the expansion of existing fractures in the junction area between the laminae and rock matrix, resulting in easy tension fracture along the laminae of shale.
1. Introduction
With the advancement of shale oil exploration and development technology, exploiting huge shale oil resources has gradually become viable, and the shale oil resources have already played an important role in many countries [1,2,3,4,5,6]. The continental shale is generally mixed up with silty, tuffaceous or argillaceous minerals, presenting a horizontal lamellar structure with dark and light colors [7]. Affected by this lamellar structure, the mechanical properties and hydration mechanism of lamellar shale in the continental formation are significantly different from those of bedding shale. As a result, the existing borehole stability calculation methods and anti-collapse technical measures for bedding shale formation are difficult to adapt to deal with the borehole instability problem of the lamellar shale oil reservoir. Therefore, it is important to understand the hydration–mechanical properties and micro-instability mechanism of lamellar shale, to provide a basis for the study of the borehole stability prediction technology of lamellar shale reservoir.
There are obvious bedding planes in shale, and the weak bedding planes lead to the shale forming significant transverse isotropic characteristic [8,9,10]. This characteristic causes the direction of stress loading on the shale bedding to have a significant impact on the failure of shale. For example, when the stress is parallel to the shale bedding plane, the shale forms local shear failures or tension fractures that are parallel to the bedding plane; when the stress is perpendicular to the bedding plane, only local shear failure occurs [11,12]. Therefore, the strength, elastic characteristics, crack propagation and corresponding strain of shale all vary with the angle of stress and the bedding plane (β) [13,14]. Singh et al. [15] summarized previous data and found that when β = 30°, the compressive strength of shale is lowest, whereas when β = 90°, the compressive strength is highest, forming a “U” shape between compressive strength and β [9]. In addition, the shear failure caused by wellbore pressure relief and the fracture extension in reservoir fracturing are all affected by bedding planes, complex natural pores and fractures, showing the anisotropic failure characteristics of shale formation [16,17,18]. As mentioned above, although many achievements have been made in the anisotropic characteristics of shale, there are few reports on lamellar shale.
Because shale is generally rich in clay minerals, the mechanical properties of shale are significantly affected by water intrusion [19]. Liang et al. [20,21] believe that surface hydration occurs on the particles of clay minerals; these minerals then exhibit hydration swelling, which generates a swelling stress. Lyu et al. [22] and Minaeian et al. [23] found that the strength, Young’s modulus and brittleness index of shale gradually decrease with the increase in water content. Therefore, Shi et al. [24] believe that secondary fracture failure caused by self-absorption is one of the main reasons for wellbore instability in hard and brittle shale formations. Thus far, many mechanics–chemistries coupling methods have been established to study the borehole stability of the shale reservoir [25,26,27]. For example, Ma and Chen [28] established a qualitative description method for shale hydration damage based on CT scanning data of shale to analyze shale borehole stability. Chen et al. [29] found that the number of weak shale planes, the difference in the occurrence of weak shale planes and different water saturations have a significant impact on wellbore stability while drilling through shale formation. Regarding shale hydration mechanics and wellbore stability research, currently, there are also few reports on lamellar shale.
In summary, at present, there are relatively few studies on the anisotropic and hydration characteristics of lamellar shale. Therefore, using the lamellar shale in Chang 73 Submember (third Submember of the Triassic Chang 7 Member), Yanchang Formation of Upper Triassic, southern Ordos Basin, uniaxial and triaxial compression tests and CT scanning experiments were conducted to study the mechanical properties and microstructure characteristics of lamellar shale affected by hydration. This can guide the study of borehole instability mechanisms and borehole stability analysis of lamellar shale formation during drilling operations using water-based drilling fluid.
2. Samples and Methods
2.1. Samples
The samples collected from the Chang 73 Submember, Yanchang Formation southern of Upper Triassic, southern Ordos Basin (Figure 1), and the sampling depth was 1400–1500 m. Chang 73 Submember is mainly composed of black shale, with a small amount of mudstone and siltstone. Its main mineral components are clay, quartz, potash feldspar, calcite, plagioclase, dolomite and pyrite, among which the content of clay and quartz are relatively high (Table 1).
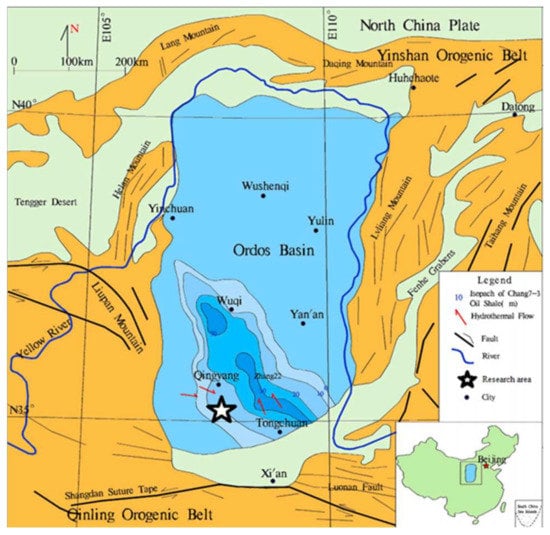
Figure 1.
Geographical location characteristics of Ordos Basin and study area (modified from [30]).

Table 1.
Mineral components of Chang 73 shale oil reservoir in Ordos.
The lamellar shale (Figure 2a) is different from the bedding shale (Figure 2c) which is a kind of rock with an obvious thin bedding structure dominated by clay minerals (kaolinite, hydromica, etc.). The lamellar shale is mainly constituted by a black shale matrix and siltstone, which form the alternate interlayer structure with various patterns and thickness. The downhole full diameter core (Figure 2a,c) was drilled (diameter of the base = 25 mm, height of cylinder = 50 mm) at different axial direction–lamina (bedding) angles (β) of 0°, 30°, 60° and 90°, respectively, as shown in Figure 2b. The schematic diagram of sample drilling is shown in Figure 2b. The number of samples taken from each angle of bedding shale was 3 (12 in total), and the number of samples taken from each angle of lamellar shale was 9 (36 in total). All of those samples were used for the mechanical test and CT scanning test.
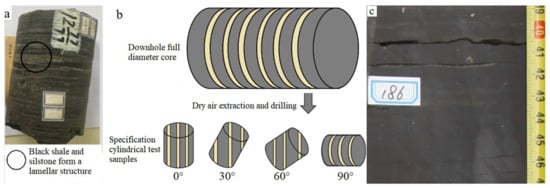
Figure 2.
Lamellar shale sample preparation: (a) downhole full diameter lamellar shale sample with diameter = 102 mm; (b) schematic diagram of sample drilling; (c) downhole full diameter bedding shale sample with diameter = 102 mm.
2.2. Experimental Procedure
2.2.1. Compression Experiments
Forty-eight shale samples were dried in a thermostatic drying oven at 85 °C for 24 h. In order to study the difference in mechanical properties between bedding shale and lamellar shale, 24 rock samples were selected for uniaxial mechanical tests. The 24 rock samples have four axial direction–lamina (bedding) angles (β), each of which has three bedding shale samples and three lamellar shale samples. First, according to the “Regulation for testing the physical and mechanical properties of rock—Part 5: Test for determining the water absorption of rock” (Chinese Standard, Standard ID: DZ/T 0276.5—2015), two samples from each β of bedding shale and lamellar shale were hydrated in distilled water at 80 °C for 24 h and 48 h, respectively. Then, the total of 24 samples after drying following the 24-h and 48-h hydration tests, were subjected to uniaxial compression test. The testing method is according to the “Regulation for testing the physical and mechanical properties of rock—Part 18: Test for determining the uniaxial compressive strength of rock” (Chinese Standard, Standard ID: DZ/T 0276.18—2015).
In the remaining 24 lamellar shale samples after drying, two samples from each β were taken for 24-h hydration test, and two samples from each β were taken for 48-h hydration test. In this way, two sets of samples were obtained. One piece of a dry sample, one piece of 24-h hydration sample and one piece of 48-h hydration sample under each β in a set. To further explore the effect of hydration on mechanical properties of lamellar shale, the two sets of samples were subjected to triaxial compression tests with confining pressures of 15 MPa and 30 MPa, respectively. The testing method is according to the “Regulation for testing the physical and mechanical properties of rock—Part 20: Test for determining the strength of rock in triaxial compression” (Chinese Standard, Standard ID: DZ/T 0276.20—2015).
The uniaxial compression tests and triaxial compression tests were all conducted using a triaxial rock mechanics testing apparatus (RTR—1000, GCTS Ltd., Phoenix, AZ, USA). The axial loading rate was 0.03 mm/min. This loading rate was determined according to the strain control loading method in the two Chinese standards as mentioned above. Compared with the stress control loading method [31], the strain control loading method has an advantage that the stress–strain curve of residual stress stage can be easily obtained. During the experiments, the axial stress, axial and radial deformation data of the sample were recorded in real time. The calculation methods of the compressive strength (deviatoric stress), Poisson’s ratio, elastic modulus and other mechanical parameters refer to the literature [32]. The shale anisotropic magnitude is described by RC [33]:
where σci(90) is the uniaxial compressive strength of the sample for β = 90°, and σci(min) is the minimum value of σci obtained from oriented samples of uniaxial compression tests.
2.2.2. CT Scanning Experiment
To observe the internal microstructure of the lamellar shale samples under the dry condition, after hydration, triaxial fracturing after hydration, and to analyse the damage of the shale caused by the interaction of hydration, force and lamellar structure CT scanning was performed.
Firstly, a dry sample for β = 0° was hydrated in 80 °C distilled water for 48 h, and then triaxial tests were performed on the sample under confining pressure of 30 MPa. CT tests were carried out on the conditions of this sample when it was dry, after hydration and after triaxial compression. These experiments were conducted using the MICROXCT-400 three-dimensional reconstruction imaging X-ray microscope. The method of CT scanning experiment is based on using X-rays to create a three-dimensional data set image of a sample by superimposing continuous two-dimensional cross-sections; in this case, the internal pore and fracture structure information can be clearly and intuitively reflected [34,35].
3. Results and Analysis
3.1. Comparison of Mechanical Properties between Bedding Shale and Lamellar Shale
The uniaxial compression test results of the samples of lamellar shale and bedding shale with different hydration times are shown in Table 2. The compressive strength (deviatoric stress) and elastic modulus of bedding shale are greater than those of lamellar shale under the same testing conditions. For example, for the samples with the same axial direction—lamina (bedding) angle (β), the dry bedding shale samples has 30.2–50.7% higher compressive strength and 34.1–50.2% higher elastic modulus than dry lamellar shale samples. The anisotropic magnitude of the dry lamellar shale sample under uniaxial conditions is 1.33 and that of the dry bedding shale sample is 1.15, which indicates that the anisotropy of the lamellar shale is stronger than that of the bedding shale.

Table 2.
Uniaxial compression test results.
The influence of hydration on the strength and elastic modulus of lamellar shale is greater than that of bedding shale. For example, after 48-h hydration in distilled water, the strength of lamellar shale for β = 30° decreases by 19.5%, while the strength of bedding shale for β = 30° decreases by 13.40%. The elastic modulus of lamellar shale for β = 30° decreased by 15.66%, and the elastic modulus of bedding shale for β = 30° decreased by 14.50%.
3.2. Anisotropic Mechanical Properties of Lamellar Shale
Figure 3 shows the complete stress–strain curves of the dry samples of lamellar shale and bedding shale [32]. The complete stress–strain curves of dry lamellar shale samples are obtained by testing the samples for β = 0°, 30°, 60° and 90°, respectively, under confining pressure of 15 MPa. The complete stress–strain curves of dry bedding shale samples are obtained by testing the samples for β = 0°, 30°, 45°, 60° and 90°, respectively, under confining pressure of 10 MPa. The complete stress–strain curves of both lamellar shale (Figure 3a) and bedding shale (Figure 3b) present a significant elastic deformation characteristic with a long elastic strain increment. Their differences are mainly manifested in: (1) The compaction stage of bedding shale is not obvious, while the compaction stage of lamellar shale is significant, especially for the sample with β = 90°. This may be due to the fact that more fractures and larger interfaces near the rock matrix and clay minerals in the lamina can lead to a significant micro-fracture closure process in the early loading stage. (2) The residual stress of the lamellar shale after the failure decreases slower with the increase in strain compared with that of the bedding shale.
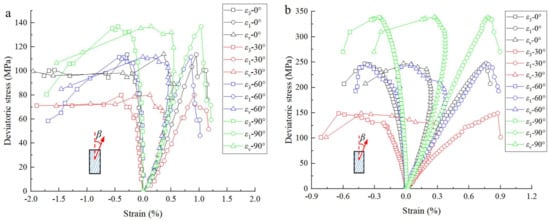
Figure 3.
Complete stress−strain curves of the dry samples of (a) lamellar shale and (b) bedding shale [32].
Comparing the complete stress–strain curves of the lamellar shale samples for each β, it is found that the compaction stage is more obvious and the elastic deformation stage is shorter when β is closer to 30°. For example, when β = 30°, the axial strain increments in the compaction stage and the elastic deformation stage are 0.26% and 0.69%, respectively; when β = 0°, the axial strain increments in the compaction stage and the elastic deformation stage are 0.17% and 0.87%, respectively. This indicates that lamellar shale would be more like elastic and brittle rock while β is closer to 0° or 90°, and would be more like plastic rock when β is closer to 30°. This may be due to the fact that while β is closer to 30°, shear failure would be more likely in the clay minerals lamella. In this case, the rock would present a plastic deformation because of that the deformation and failure of the lamina mainly show plastic characteristics due to that it is mainly composed of silty, tuffaceous or argillaceous minerals.
Figure 4 shows the change curves of the compressive strengths (deviatoric stresses) of dry shale samples with various β. From Figure 4, it can easily be seen that the confining pressure has a great influence on the compressive strength of lamellar shale, showing that the greater the confining pressure is, the higher the compressive strength will be. For example, the compressive strength of the sample for β = 30° under the confining pressure of 30 MPa increases by 31.5% compared with the compressive strength (83.44 MPa) of the sample under the confining pressure of 15 MPa. In addition, the compressive strength of lamellar shale decreases when β < 30° and then increases with the increasing β, showing a “U” shape relationship between compressive strength and β, which is the same as the result of bedding shale [32]. Moreover, the anisotropic magnitude of the lamellar shale sample is 1.65 under the confining pressure of 15 MPa, and the value is 1.45 under the confining pressure of 30 MPa, indicating that confining pressure would reduce the anisotropy of lamellar shale, which also shows the same result as that of bedding shale [32].
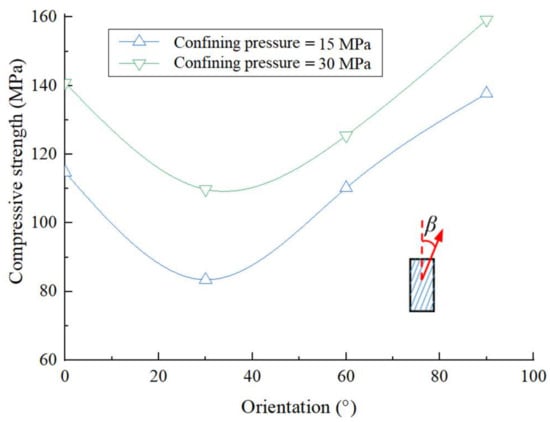
Figure 4.
Changes in compressive strength (deviatoric stress) of dry shale with various axial direction—lamina angles (β).
Figure 5 shows the variation curves of the elastic modulus and Poisson’s ratio of dry lamellar shale samples with various β. It can be seen from Figure 5 that the elastic modulus of the lamellar shale sample increases with the increase in confining pressure (Figure 5a). For example, the elastic modulus of the sample for β = 30° increases by 15.7% under the confining pressure of 30 MPa compared with that of the sample under the confining pressure of 15 MPa. With the increase in β from 0° to 90°, the elastic modulus of the lamellar shale sample decreases sharply when β < 30°, and then tends to flatten (Figure 5a). On the other hand, the Poisson’s ratio of the lamellar shale sample decreases with the increase in confining pressure. For example, the Poisson’s ratio of the sample for β = 30° under the confining pressure of 30 MPa decreases by 6% compared with that of the sample under the confining pressure of 15 MPa. In addition, under various confining pressures, with the increase in β from 0° to 90°, the Poisson’s ratio increases when β < 30° and then decreases rapidly (Figure 5b). The maximum Poisson’s ratio appears for the sample with β = 30°, and the values are 0.17 and 0.16 for the samples tested under the confining pressure of 15 MPa and 30 MPa, respectively.
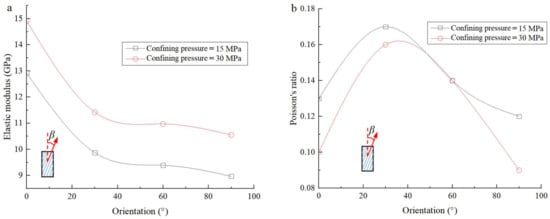
Figure 5.
Changes in elastic modulus (a) and Poisson’s ratio (b) of the dry shale samples with axial direction—lamina angles (β).
3.3. Influence of Hydration on Mechanical Properties of Lamellar Shale
Figure 6 shows the complete stress–strain curves of the lamellar shale samples for β = 30°, under the confining pressure of 15 MPa, after different hydration times. It can be seen from Figure 6 that with the increasing hydration time, the elastic deformation stage gradually becomes shorter, and the compaction stage, plastic deformation stage and residual stress stage become more significant. For example, the strain increments of the dry sample, and the samples after 24-h hydration and 48-h hydration in the elastic deformation stage and plastic deformation stage are 0.58%, 0.49%, 0.42% and 0.12%, 0.22%, 0.55%, respectively. Compared with the dry sample, the axial strain increment in the elastic deformation stage of the sample after 48-h hydration reduces by 27.5%, and the axial strain increment in the plastic deformation stage increases by 358%. This indicates that with the increase in hydration time (water content), the lamellar shale gradually develops from elastic and brittle deformation to plastic deformation. This rule is similar to the result of bedding shale obtained in the literature [32], but the difference is that lamellar shale shows more significant change under the effect of hydration. This may be due to the fact that the inclusion of lamellar structures, which contain a lot of clay minerals, would have more significant swelling deformation after hydration compared with bedding shale [36]. Thus, the increase in rock particle spacing is more obvious, leading to the reduction in elastic brittleness and increase in plasticity and ductility [37].
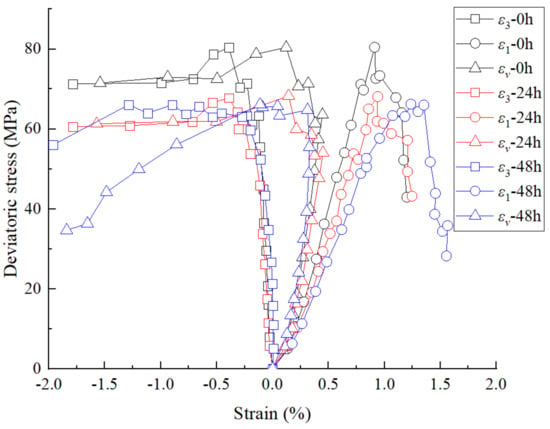
Figure 6.
Complete stress−strain curve of the lamellar shale samples for β = 30° under confining pressure of 15 MPa, after different hydration times.
Figure 7 shows the variation curves of the compressive strength (deviatoric stress) of lamellar shale with different hydration times under the confining pressure of 15 MPa. As shown in Figure 7, with the increase in hydration time, the compressive strength of lamellar shale gradually decreases, and the rate of decrease gradually reduces too. For example, for the sample with β = 30°, the compressive strength of the sample after 24-h hydration decreases by 14.7% compared with that of the dry sample, and the compressive strength of the sample after 48-h hydration decreases by 8.6% compared with that of the sample after 24-h hydration. Comparing the compressive strength variation of the samples with different β affected by hydration, it is found that the compressive strength of the sample with β = 30° is more significantly affected by hydration than those of the samples with other β. For example, after 48-h hydration, the compressive strength of the sample with β = 30° decreases by 22.0% compared with the dry sample, while the sample with β = 0° and 90° decreases by 15.0% and 20.2%, respectively. These findings are similar to those obtained for bedding shale [32], but compared with bedding shale, the compressive strength of lamellar shale with various β decreases more significantly. This may be due to the higher content of clay minerals in lamellar shale, which makes it can easier be hydrated, leading to a more obvious reduction in its mechanical properties. Especially for the sample with β = 30°, its failure surface is closer to the lamellar plane, and the compressive strength would decrease more significantly.
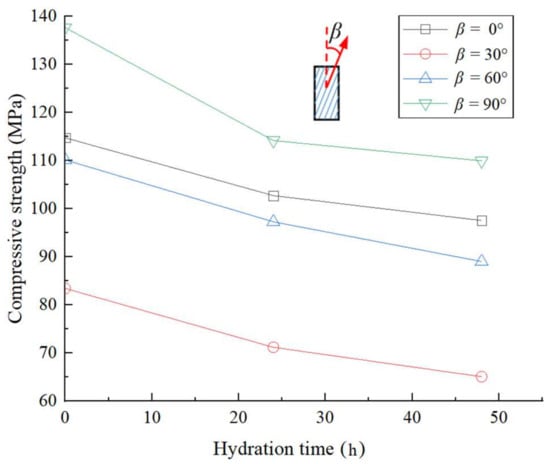
Figure 7.
Compressive strength (deviatoric stress) of the lamellar shale samples under confining pressure of 15 MPa changed with hydration time.
Figure 8 shows the variation curves of the elastic modulus of lamellar shale with different hydration times under the confining pressure of 15MPa. As shown in Figure 8, with the increase in the hydration time, the elastic modulus of the lamellar shale sample gradually decreases, and the rate of decrease gradually reduces too. For example, for the sample with β = 30°, the elastic modulus of the sample after 24-h hydration is 11.9% lower than that of the dry sample, and the elastic modulus of the sample after 48-h hydration is 5.1% lower than that of the sample after 24-h hydration. In addition, the elastic modulus of the samples with different β is affected differently by hydration. For example, after 48-h hydration, the elastic modulus of the sample with β = 30° decreases by 16.3% compared with that of the dry sample, while the elastic modulus of the samples with β = 0° and 90° decreases by 13.5% and 11.7%, respectively. It appears that the most significant changes in the elastic modulus are affected by hydration for the sample for which β is closer to 30°. These findings are similar to those obtained for bedding shale [32]. This may be due to the high clay minerals content in the lamellar shale oil reservoir of the Ordos Basin and the existence of a large amount of berry pyrite wrapped in clay minerals [38]. Therefore, the mechanical properties are significantly reduced after hydration. In particular, the sample with β = 30° is more likely to be destroyed at the lamina plane, and the elastic modulus of it decreases more significantly than that for the samples with other β.
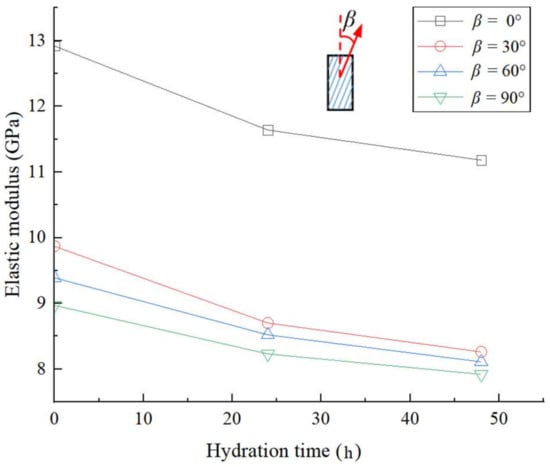
Figure 8.
Elastic modulus of the lamellar shale samples under confining pressure of 15 MPa changed with hydration time.
3.4. Failure Characteristics of Lamellar Shale
Figure 9 shows the failure characteristics of the lamellar shale samples after compression tests. It indicates that the failure of lamellar shale is controlled by the stress and the axial direction—lamina angle (β), showing a variety of failure modes. For example, under the confining pressure of 0 MPa, the sample with β = 0° mainly exhibits tension failure along the lamina (Figure 9a), while the sample with β = 90° exhibits shear failure with a certain angle to the lamina plane (Figure 9b). Under the confining pressure of 30 MPa, the sample with β = 0° has composite failures, constituted by tension failure (tension cracks) along the lamina (blue line in Figure 9c) and shear failure (shear cracks) at a certain angle relative to the lamina (red line in Figure 9c), while the sample with β = 90° exhibits shear failure at a certain angle relative to the lamina (Figure 9d).
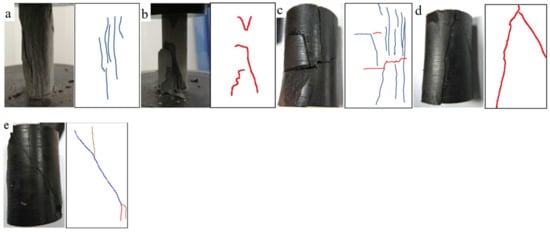
Figure 9.
Shale samples after compression tests and schematic diagram of fractures: (a) the dry sample with an axial direction—lamina angle of 0° after uniaxial compression test; (b) the dry sample with an axial direction—lamina angle of 90° after uniaxial compression test; (c) the sample hydrated in distilled water at 80 °C for 48 h with an axial direction—lamina angle of 0° after triaxial compression test under confining pressure of 30 MPa; (d) the samples hydrated in distilled water at 80 °C for 48 h with an axial direction—lamina angle of 90° after triaxial compression test under confining pressure of 30 MPa; (e) the sample hydrated in distilled water at 80 °C for 48 h with an axial direction—lamina angle of 30° after triaxial compression test under confining pressure of 30 MPa. The blue line indicates the failure line along the lamina, the red line indicates the failure line intersected with the lamina.
Previous studies indicate that the failure mode of bedding shale under high confining pressure is inclined shear failure [39]. In this paper, the reason for the composite failure of the lamellar shale sample with β = 0° under high confining pressure may be due to the sand–shale lamellar structure with weaker mechanical properties. In addition, the weak cementation between the lamina and the shale matrix has a large number of fractures near the lamellar structure [40], so there is also a tension failure along the lamellar structure. Thus, the lamellar shale sample with β = 0° after triaxial compression test under high confining pressure forms a complex composite failure mode. The failure mode of the lamellar shale sample with β = 30° is similar to that of bedding shale, both of which are shear slip failure along the lamina plane/bedding plane [39], as shown in Figure 9e. This is because of that the rock sample tends to fail at the angles of 30°–45° relative to axial stress under the compression test condition [32], especially for the lamellar shale after hydration, for which the clay minerals hydration can highly decrease the cohesive force and frictional force in clay minerals layers. This would be why the compressive strength of lamellar shale is lowest for the sample with β = 30°, as mentioned in Section 3.2 and Section 3.3.
3.5. Microstructure Characteristics of Lamellar Shale
Figure 10 shows the CT scanning image of the dry lamellar shale sample, the 48-h hydration lamellar shale sample and the 48-h hydration lamellar shale sample after a triaxial compression test under the confining pressure of 30 MPa. As shown in Figure 10a, the dry lamellar shale sample is relatively dense, its minerals are cemented tightly and there are no obvious fractures in the dry lamellar shale sample. As shown in Figure 10c, in the top view of the sample after hydration in distilled water at 80 °C for 48 h, there are two parallel unequal length fractures, the one near the center is longer and the other one is shorter. The front view image shows two fractures, one wide and one narrow, and they are approximately parallel with each other. The three fractures in the left view image are also basically parallel to each other with the same width but different lengths. In the different observation views in Figure 10b, the hydration fractures in the sample are consistent with the lamellar direction, which implies that water tends to flow along the laminae, showing the anisotropic permeation characteristics of water in lamellar shale [41] and resulting in hydration swelling damage in the laminae. Thus, lots of tensile cracks along the laminae (Figure 10b), which will lead to significant plastic deformation, would develop in the lamellar shale after hydration. Therefore, the strength and elastic modulus decrease significantly when the failure of the lamellar shale sample after hydration is along the laminae under compression test, and the rock would develop from an elastic–brittle characteristic to an elastic–plastic characteristic, as mentioned in Section 3.3.
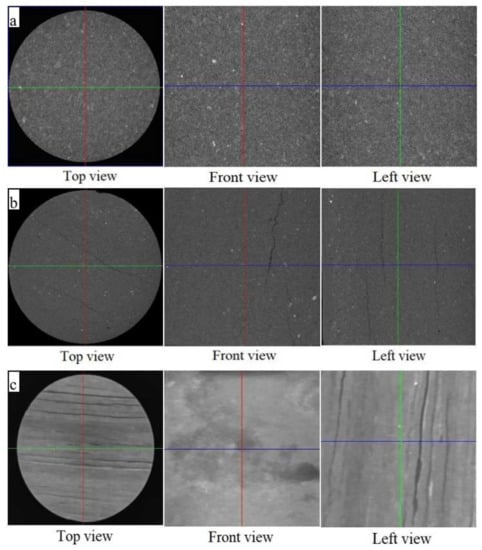
Figure 10.
CT scanning images of the lamellar shale samples: (a) the dry lamellar shale sample; (b) the 48-h hydration lamellar shale sample; (c) the 48-h hydration lamellar shale sample after triaxial compression test under the confining pressure of 30 MPa.
The fractures in the hydrated lamellar shale sample after a triaxial compression test under the confining pressure of 30 MPa distribute parallel to the lamina direction, forming a large tensile fracture from the top and left views (Figure 10c). Compared with the tensile fracture characteristics of the lamellar shale sample after hydration in distilled water at 80 °C for 48 h (Figure 10b), the widths of the fractures increase and the number of them is larger after the triaxial compression test. Therefore, it can be deduced that the hydration fractures along the lamina direction can highly promote the failure of lamellar shale during a triaxial compression test, showing that with the increase in deviatoric stress, these hydration fractures would be extended and some new factures can also be produced along the lamellar direction, making the rock more likely to be damaged with a plastic characteristic and weak mechanical properties.
From what has been discussed above, we should pay close attention to the wellbore stability of lamellar shale formation during drilling operations using water-based drilling fluid. First, since the water tends to flow along the lamina resulting in hydration damage in the lamina that can highly decrease the rock strength, as mentioned in Section 3.3 and Section 3.5, a geological analysis should be conducted in detail to understand the distribution characteristics of lamellar shale, and water-based drilling fluid should be avoided for drilling operations in lamellar shale formation if possible. Second, because lamellar shale has the lowest strength for the sample with β = 30° and highest strength for the sample with β = 90°, as mentioned in Section 3.2 and Section 3.3, the direction of the wellbore should be precisely designed to obtain a high stability of the wellbore, considering the lamina direction and in situ stress distribution. Third, due to the fact that the strength of lamellar shale decreases significantly with the increase in hydration time, as mentioned in Section 3.3, a fast drilling operation and a high-quality plugging capability of the drilling fluid are recommended for drilling lamellar shale formation if water-based drilling fluid is used.
4. Conclusions
Using the lamellar shale in the continental stratum of the southern Ordos Basin, the mechanical properties and corresponding mechanisms of lamellar shale were studied by compression tests and CT scanning tests, considering the effect of lamellar structure and hydration. Based on the results, the following conclusions can be drawn.
First, under the same conditions, the compressive strength and elastic modulus of bedding shale are both greater than those of lamellar shale, and the anisotropic magnitude of lamellar shale is greater than that of bedding shale.
Second, the complete stress–strain curve of lamellar shale has a longer elastic deformation stage, but compared with bedding shale, its compaction stage, plastic deformation stage and residual strain stage are more significant. While the axial direction–lamina angle (β) of sample is closer to 30°, the compaction stage and plastic deformation of the sample would be more obvious, and the elastic deformation stage would be shorter.
Third, with the increase in β from 0° to 90°, the compressive strength of lamellar shale decreases when β < 30° and then increases, showing a “U”-shaped variation relationship; the elastic modulus of lamellar shale decreases greatly when β < 30° and then tends to flatten; Poisson’s ratio increases when β < 30° and then decreases rapidly. With the increase in confining pressure, the anisotropy magnitude of lamellar shale decreases gradually.
Fourth, with the increase in hydration time, the elastic deformation stage of lamellar shale becomes shorter, and the compaction stage, plastic deformation stage and residual stress stage become more significant. The compressive strength and elastic modulus of lamellar shale gradually decrease, and the rate of decrease reduces too. Under the influence of hydration, lamellar shale will develop from elastic–brittle deformation to plastic deformation. Moreover, when β is closer to 30°, the compressive strength and elastic modulus of lamellar shale decreases more significantly, and the development towards plastic deformation becomes more obvious.
Fifth, the failure of lamellar shale is significantly affected by the clay minerals lamina. Hydration causes the expansion of clay mineral lamina to produce tensile fractures. In triaxial compression tests under high or low confining pressures, the failure occurs along the lamina direction, making the plasticity of lamellar shale become stronger and the mechanical properties decrease significantly.
Finally, the mechanical properties of lamellar shale after hydration, as mentioned above, can provide guidance for the study of borehole instability mechanisms and borehole stability analysis of lamellar shale formation during drilling operations using water-based drilling fluid.
Author Contributions
Conceptualization, Q.Z.; methodology, Q.Z. and L.H.; validation, F.Z.; formal analysis, Y.F.; investigation, L.W., P.Z. and S.Y.; resources, X.F.; data curation, L.W.; Writing-original draft, L.W.; writing—review and editing, Q.Z., P.Z. and B.Y.; funding acquisition, X.F.; supervision, X.F. All authors have read and agreed to the published version of the manuscript.
Funding
This research was funded by the National Natural Science Foundation of China (Grant Nos. 42172313 and 51774246) and the financial support from the Key Laboratory of In-situ Proper-ty-improving Mining of Ministry of Education, Taiyuan University of Technology (Grant No. KLIPM-2019-03).
Institutional Review Board Statement
Not applicable.
Informed Consent Statement
Not applicable.
Data Availability Statement
The data presented in this study are openly available in [Mendeley Data] at [https://doi:10.17632/shmkw9kf2g.1].
Acknowledgments
The financial support from the National Natural Science Foundation of China (Grant No. 42172313 and 51774246), and the financial support from the Key Laboratory of In-situ Property-improving Mining of Ministry of Education, Taiyuan University of Technology (grants KLIPM-2019-03) are appreciated. The authors would like to express their gratitude to the editors and anonymous reviewers for their constructive comments on the draft paper.
Conflicts of Interest
The authors declare no conflict of interest.
References
- U.S. Energy Information Administration. Energy Information Administration. World Shale Resource Assessments [EB/OL]. Available online: https://www.eia.gov/analysis/studies/worldshalegas/ (accessed on 24 September 2015).
- Reynolds, D.; Umekwe, M. Shale-oil development prospects: The role of shale-gas in developing shale-oil. Energies 2019, 12, 3331. [Google Scholar] [CrossRef]
- Philp, R.; Degarmo, C. Geochemical characterization of the Devonian-Mississippian Woodford Shale from the McAlister Cemetery Quarry, Criner Hills Uplift, Ardmore Basin, Oklahoma—ScienceDirect. Mar. Pet. Geol. 2020, 112, 104078. [Google Scholar] [CrossRef]
- Ion-Danut, J.; Mariana, J. The current stage of shale gas exploration and exploitation in european countries compared to the U.S. situation. Ovidius Univ. Ann. 2013, 13, 825–830. [Google Scholar]
- Nie, X.; Lu, J.; Djaroun, R.R.; Wang, P.; Zhang, C.; Li, J. Oil content prediction of lacustrine organic-rich shale from wireline logs: A case study of intersalt reservoirs in the qianjiang sag, jianghan basin, China. Interpretation 2020, 8, 79–88. [Google Scholar] [CrossRef]
- Hu, Q.; Zhang, Y.; Meng, X.; Zheng, L.; Xie, Z.; Li, M. Characterization of micro-nano pore networks in shale oil reservoirs of paleogene shahejie formation in dongying sag of bohai bay basin, east china. Pet. Explor. Dev. 2017, 44, 720–730. [Google Scholar] [CrossRef]
- Shi, Z.; Qiu, Z.; Dong, D.; Lu, B.; Liang, P. Laminae characteristics of gas-bearing shale fine-grained sediment of the Silurian Longmaxi Formation of Well Wuxi 2 in Sichuan Basin, SW China. Pet. Explor. Dev. 2018, 2, 358–368. [Google Scholar] [CrossRef]
- Baird, A.F.; Kendall, J.M.; Fisher, Q.J.; Budge, J. The role of texture, cracks, and fractures in highly anisotropic shales. J. Geophys. Res. 2017, 122, 10341–10351. [Google Scholar] [CrossRef]
- Liu, X.; Zeng, W.; Liang, L.; Lei, M. Wellbore stability analysis for horizontal wells in shale formations. J. Nat. Gas Sci. Eng. 2016, 31, 1–8. [Google Scholar] [CrossRef]
- Zhang, Q.; Yao, B.; Fan, X.; Li, Y.; Zhao, P. A modified Hoek-Brown failure criterion for unsaturated intact shale considering the effects of anisotropy and hydration. Eng. Fract. Mech. 2020, 241, 107369. [Google Scholar] [CrossRef]
- Keller, L.M.; Schwiedrzik, J.J.; Gasser, P.; Michler, J. Understanding anisotropic mechanical properties of shales at difffferent length scales: In situ micropillar compression combined with fifinite element calculations. J. Geophys. Res. 2017, 122, 5945–5955. [Google Scholar] [CrossRef]
- Lora, R.V.; Ghazanfari, E.; Izquierdo, E.A. Geomechanical characterization of marcellus shale. Rock Mech. Rock Eng. 2015, 49, 3403–3424. [Google Scholar] [CrossRef]
- Rybacki, E.; Reinicke, A.; Meier, T.; Makasi, M.; Dresen, G. What controls the mechanical properties of shale rocks?—Part I: Strength and young’s modulus. J. Pet. Sci. Eng. 2015, 135, 702–722. [Google Scholar] [CrossRef]
- Wang, M.; Li, P.; Wu, X.; Chen, H. A study on the brittleness and progressive failure process of anisotropic shale. Environ. Earth Sci. 2016, 75, 886. [Google Scholar] [CrossRef]
- Singh, M.; Samadhiya, N.K.; Kumar, A.; Kumar, V.; Singh, B. A nonlinear criterion for triaxial strength of inherently anisotropic rocks. Rock Mech. Rock Eng. 2015, 48, 1387–1405. [Google Scholar] [CrossRef]
- Enriquez-Tenorio, O.; Knorr, A.; Zhu, D.; Hill, A.D. Relationships between mechanical properties and fracturing conductivity for the Eagle Ford Shale. SPE Prod. Oper. 2018, 34, 318–331. [Google Scholar]
- Sun, K.; Zhang, S.; Xin, L. Impacts of bedding directions of shale gas reservoirs on hydraulically induced crack propagation. Nat. Gas Ind. 2016, 3, 139–145. [Google Scholar] [CrossRef]
- Zhao, J.; Ren, L.; Shen, C.; Li, Y. Latest research progresses in network fracturing theories and technologies for shale gas reservoirs. Nat. Gas Ind. B 2018, 5, 533–546. [Google Scholar] [CrossRef]
- Lai, B.; Li, H.; Zhang, J.; Jacobi, D.; Georgi, D. Water-content effects on dynamic elastic properties of organic-rich shale. SPE J. 2016, 21, 635–647. [Google Scholar] [CrossRef]
- Liang, L.; Xiong, J.; Liu, X. Experimental study on crack propagation in shale formations considering hydration and wettability. J. Nat. Gas Sci. Eng. 2015, 23, 492–499. [Google Scholar] [CrossRef]
- Ahmad, H.; Murtaza, M.; Kamal, M.; Hussain, S.; Mahmoud, M. Cationic gemini surfactants containing biphenyl spacer as shale swelling inhibitor. J. Mol. Liq. 2021, 325, 115164. [Google Scholar] [CrossRef]
- Lyu, Q.; Ranjith, P.G.; Long, X.; Ji, B. Experimental investigation of mechanical properties of black shales after CO2-Water-Rock interaction. Materials 2016, 9, 663. [Google Scholar] [CrossRef]
- Minaeian, V.; Dewhurstc, D.N.; Rasouli, V. Deformational behaviour of a clay-rich shale with variable water saturation under true triaxial stress conditions. Geomech. Energy Environ. 2017, 11, 1–13. [Google Scholar] [CrossRef]
- Shi, B.; Xia, B.; Lin, Y.; Xu, J. CT Imaging and Mechanism Analysis of Crack Development by Hydration in Hard-Brittle Shale Formations. Acta Pet. Sin. 2012, 33, 137–142. [Google Scholar]
- Hale, A.H.; Mody, F.K.; Salisbury, D.P. The influence of chemical potential on wellbore stability. SPE Drill. Eng. 1993, 8, 207–216. [Google Scholar] [CrossRef]
- Ma, T.; Chen, P.; Zhang, Q.; Zhao, J. A novel collapse pressure model with mechanical-chemical coupling in shale gas formations with multi-weakness planes. J. Nat. Gas Sci. Eng. 2016, 36, 1151–1177. [Google Scholar] [CrossRef]
- Wen, H.; Chen, M.; Jin, Y.; Kai, W.; Niu, C. A chemo-mechanical coupling model of deviated borehole stability in hard brittle shale. Pet. Explor. Dev. 2014, 41, 817–823. [Google Scholar] [CrossRef]
- Ma, T.; Chen, P. Study of Meso-Damage Characteristics of Shale Hydration Based on CT Scanning Technology. Pet. Explor. Dev. 2014, 41, 249–256. [Google Scholar] [CrossRef]
- Chen, M.; Liang, C.; Lu, Y.; Jin, Y. Wellbore stability model for shale gas reservoir considering the coupling of multi-weakness planes and porous flow. J. Nat. Gas Sci. Eng. 2014, 21, 364–378. [Google Scholar]
- You, J.; Liu, Y.; Li, Y.; Zhou, D.; Gao, H. Influencing factor of Chang 7 oil shale of Triassic Yanchang Formation in Ordos Basin: Constraint from hydrothermal fluid. J. Pet. Sci. Eng. 2021, 201, 108532. [Google Scholar] [CrossRef]
- Deepak, A.M.; Janeček, I. Laboratory Triaxial testing—From historical outlooks to technical aspects. Procedia Eng. 2017, 191, 342–351. [Google Scholar]
- Zhang, Q.; Fan, X.; Chen, P.; Ma, T.; Zeng, F. Geomechanical behaviors of shale after water absorption considering the combined effect of anisotropy and hydration. Eng. Geol. 2020, 269, 105547. [Google Scholar] [CrossRef]
- Ramamurthy, T. Strength and Modulus Responses of Anisotropic Rocks; Pergamon Press: Oxford, UK, 1993. [Google Scholar]
- Chen, Y.; Jiang, C.; Leung, J.Y.; Wojtanowicz, A.K.; Zhang, D. Multiscale characterization of shale pore-fracture system: Geological controls on gas transport and pore size classification in shale reservoirs. J. Pet. Sci. Eng. 2021, 202, 108442. [Google Scholar] [CrossRef]
- Jiang, C.; Liu, X.; Wang, W.; Wei, W.; Duan, M. Three-dimensional visualization of the evolution of pores and fractures in reservoir rocks under triaxial stress. Powder Technol. 2021, 378, 585–592. [Google Scholar] [CrossRef]
- Zhao, P.; Fan, X.; Zhang, Q.; Wang, X.; Zhang, M.; Ran, J.; Lv, D.; Liu, J.; Shuai, J.; Wu, H. The Effect of Hydration on Pores of Shale Oil Reservoirs in the Third Submember of the Triassic Chang 7 Member in Southern Ordos Basin. Energies 2019, 12, 3932. [Google Scholar] [CrossRef]
- Chen, Y.; Jiang, C.; Yin, G.; Zhang, D.; Xing, H.; Wei, A. Permeability evolution under true triaxial stress conditions of Longmaxi shale in the Sichuan Basin, Southwest China. Powder Technol. 2019, 354, 601–614. [Google Scholar] [CrossRef]
- Zhao, P.; Fan, X.; Zhang, Q.; Yao, B.; Zhang, M.; He, L.; Qiang, Y.; Liu, J. Characteristics of Hydration Damage and Its Influence on Permeability of Lamellar Shale Oil Reservoirs in Ordos Basin. Geofluids 2021, 2021, 6646311. [Google Scholar] [CrossRef]
- Ma, T.; Chen, P. A wellbore stability analysis model with chemical-mechanical coupling for shale gas reservoirs. J. Nat. Gas Sci. Eng. 2015, 26, 72–98. [Google Scholar] [CrossRef]
- Liu, B.; Lu, Y.; Meng, Y.; Li, X.; Guo, X.; Ma, Q.; Zhao, W. Petrologic characteristics and genetic model of lacustrine lamellar fine-grained rock and its significance for shale oil exploration: A case study of Permian Lucaogou Formation in Malang sag, Santanghu Basin, NW China. Pet. Explor. Dev. 2015, 42, 656–666. [Google Scholar] [CrossRef]
- Parteli, E.; Da Silva, L.; Andrade, J. Self-organized percolation in multi-layered structures. J. Stat. Mech. Theory Exp. 2010, 3, 03026. [Google Scholar] [CrossRef][Green Version]
Publisher’s Note: MDPI stays neutral with regard to jurisdictional claims in published maps and institutional affiliations. |
© 2022 by the authors. Licensee MDPI, Basel, Switzerland. This article is an open access article distributed under the terms and conditions of the Creative Commons Attribution (CC BY) license (https://creativecommons.org/licenses/by/4.0/).