Article

Steam Pyrolysis of Oil Sludge for Energy-Valuable Products

1
Laboratory of Catalysis and Conversion of Carbonaceous Materials to Obtain Useful Products, Gorbachev Kuzbass State Technical University, 650000 Kemerovo, Russia
2
School of Energy & Power Engineering, National Research Tomsk Polytechnic University, 634050 Tomsk, Russia
3
Laboratory of Catalysis and Processing of Hydrocarbons, National University of Science and Technology “MISIS”, 119049 Moscow, Russia
*
Author to whom correspondence should be addressed.
Appl. Sci. 2022, 12(3), 1012; https://doi.org/10.3390/app12031012
Submission received: 4 December 2021 / Revised: 12 January 2022 / Accepted: 17 January 2022 / Published: 19 January 2022

Abstract

:
Experimental studies of the steam pyrolysis of oil sludge were performed using a flow-type pilot plant with 300 kg/h capacity (raw material) to obtain energy-valuable products, such as liquid hydrocarbons (30.4 wt%), semi-coke (39.6 wt%), non-condensable gas-phase compounds (26.5 wt%), and bitumen (3.5 wt%). The pyrolysis process was conducted at a temperature of 650 ° C and with a steam flow rate of 150 kg/h. Liquid hydrocarbons were considered a target product. Comprehensive studies of their physicochemical characteristics, atomization process, droplet ignition, and combustion were carried out. The studied sample had physicochemical characteristics similar to traditional fuel oil (calorific value—42.6 MJ/kg, sulfur content—0.8 wt%). The jet spraying angle was 25° in view of the improved rheological properties of the test sample, with a homogeneous jet structure and a predominant droplet diameter of no more than 0.4 mm. The flame combustion process was accompanied by the formation of microexplosions, the frequency and intensity of which depended on the temperature of the air (Tg = 450–700 °C). This study, in view of its applied nature, is of interest in the design of new installations and technological systems for hydrocarbon pyrolysis.

1. Introduction

Oil is one of the most abundant energy resources worldwide [1]; its extraction, transportation, storage, and processing are associated with the formation of a significant amount of waste, including oil sludge (OS) [2,3,4,5,6,7]. This type of high-hazard waste comprises water, oil, mineral impurities, and different deposits (sand, clay, silt, etc.) [8]. The ratio of these components varies within a wide range, depending on the type of oil and the way it is stored and processed. According to [3,4,9], the annual amount of OS formation is about 60 million tons. Because of the lack of resource-efficient and environmentally friendly approaches to sustainable OS management, their long-term accumulation can cause global environmental problems, such as the large-scale pollution of soil, atmosphere, and groundwater, that endanger human health.
One of the most effective and promising methods of OS processing is its thermal conversion (pyrolysis, gasification, combustion) [2,3,4,10]. The OS combustion method can be unstable due to the instability of the component composition of this material [8]. This can subsequently lead to the violation of the operating mode of boiler burners, which will reduce their efficiency and reliability. In addition, the OS combustion process is accompanied by the release of toxic and harmful gases [11,12]. In contrast to combustion, pyrolysis and gasification methods provide a wider variability of the energy-valuable products obtained at 500–600 °C [13]. The resulting liquid hydrocarbons (the main product of OS pyrolysis) can be used as fuel or feedstock for the petrochemical industries. In turn, non-condensable gas and carbon residue can be returned to the OS thermal processing cycle as a secondary energy source, since the pyrolysis predominantly proceeds in an allothermic mode [14]. According to [15,16], the solid residue can be used in the construction industry.
The thermal conversion of hydrocarbons in the superheated steam medium (at 500–700 °C) can have a number of environmental and technological advantages, such as the neutralization of harmful compounds formed in the steam–gas mixture [17,18] and the improvement of the quality indicators of the condensed liquid hydrocarbons (reduced content of sulfur compounds, ash, changed molecular weight of light hydrocarbons) [19]. In addition, the use of superheated steam as a hydrocarbons conversion agent increases the H2 content in the resulting synthesis gas: C + H2O → CO + H2, CH4 + H2O → CO + 3H2 and CO + H2O → CO2 + H2 [20,21,22,23]. Efika et al. [24] reported that the use of steam as an additional agent for biomass conversion increases the hydrogen concentration in the composition of gas-phase products by 30%. A similar trend was described by Motlang et al. [25] based on numerical studies of the effect of water vapor added in OS thermal conversion. In turn, Chu et al. [5] revealed five stages of steam pyrolysis of OS proceeding in the temperature range of 30–669 °C: drying of external moisture, volatilization of light components, cracking of heavy components and steam reforming, the coking process, and the subsequent inorganic mineral decomposition.
According to [26], liquid hydrocarbons yielded by steam pyrolysis of OS show energy characteristics (combustion heat of 38 MJ/kg, water content of 8 wt%, sulfur content of 1.9 wt%, density of 920 kg/m3) comparable with conventional residual fuel and can be used as heating oil at power facilities. At the same time, an analysis of the literature data shows no currently available comprehensive studies into energy products obtained by thermal conversion methods (in particular, steam pyrolysis).
This paper presents the results of comprehensive studies of the physical and chemical characteristics of energy products yielded by steam pyrolysis of OS using an experimental setup. The experimental results are provided for the main energy product—liquid hydrocarbons: spray, ignition, and combustion.

2. Materials and Methods

2.1. Oil Sludge

An oil sludge sample was extracted from oil separation facilities and cleaning systems for pipelines and oil tanks by Industrial Transport Corporation (Irkutsk, Russia). The average values of the mass content of hydrocarbons, water, and mechanical impurities were 51.9, 19.7, and 28.4 wt%, respectively. Before steam pyrolysis, OS was stored in an open-type sludge collection basin.

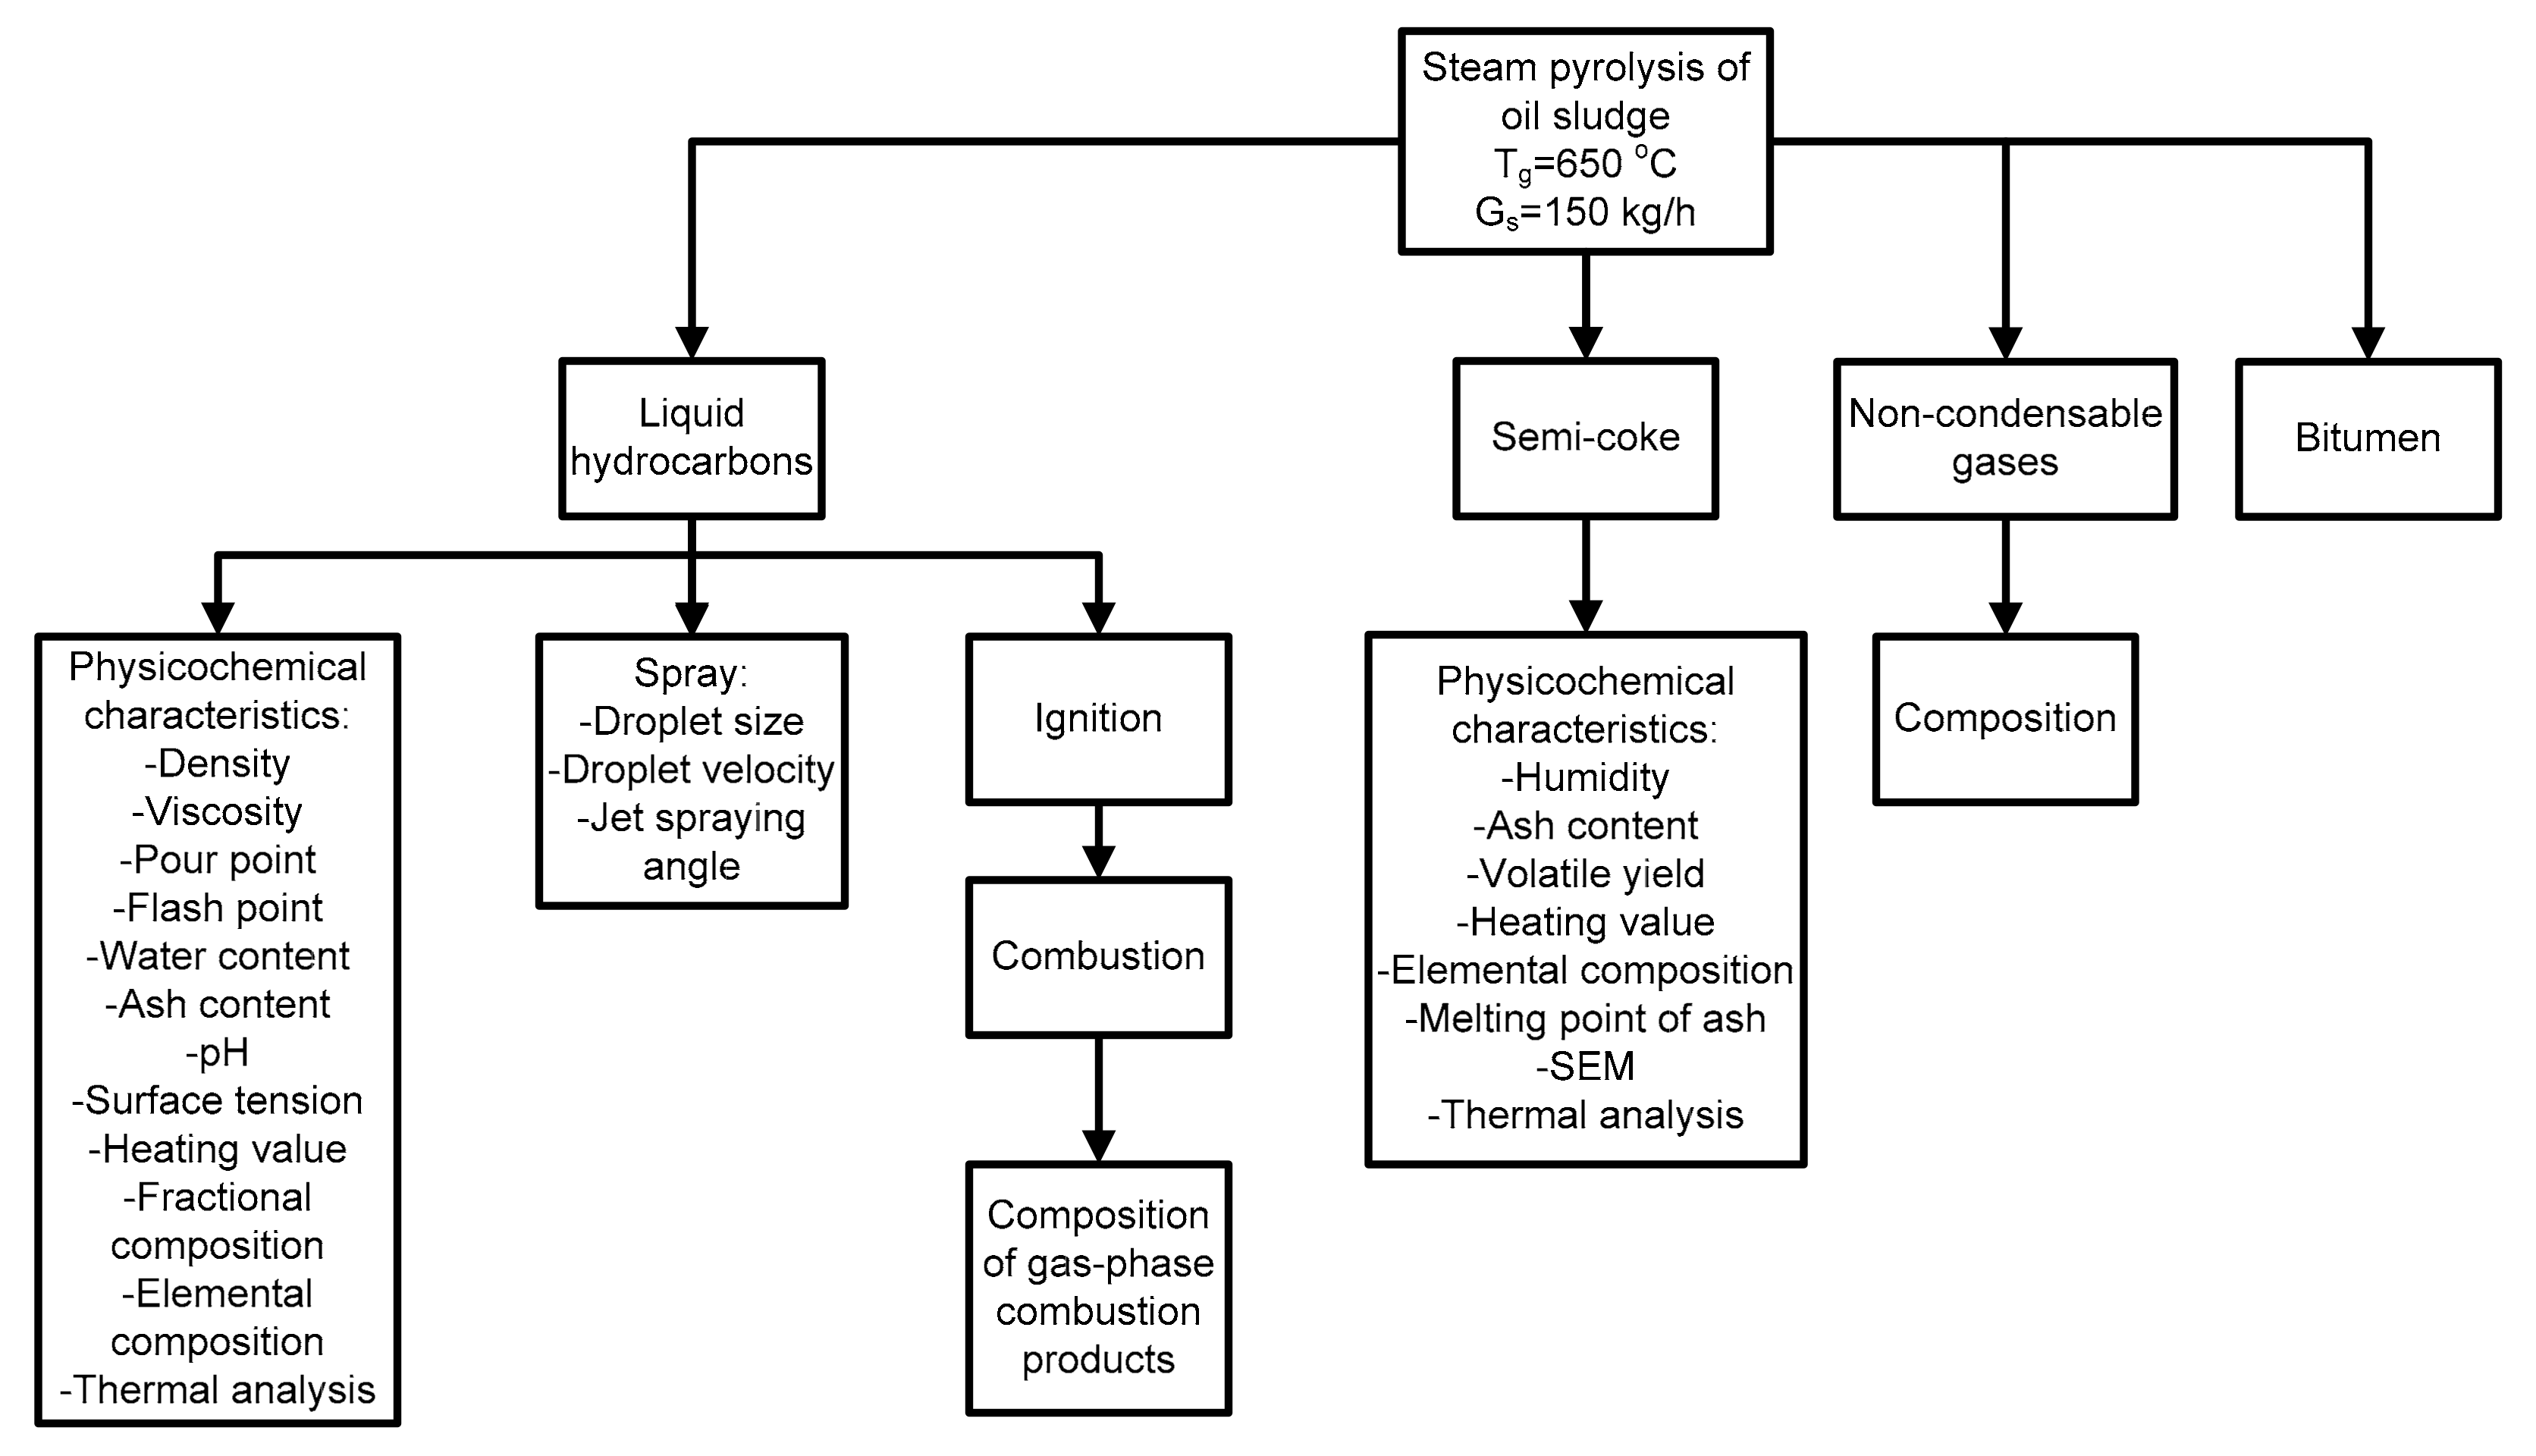
2.2. Methods Structure

Figure 1 shows the methods structure of the study, which contained two stages.
At the first stage, pilot tests of the OS pilot plant for steam pyrolysis were carried out. Based on the results of this stage, liquid hydrocarbons, semi-coke, non-condensable gas-phase compounds, and bitumen were obtained. Composition of non-condensable gas-phase compounds was determined. Physicochemical characteristics of the semi-coke and its mineral residue were determined.
Liquid hydrocarbons were considered a target product. A comprehensive study of their physicochemical characteristics (with a focus on energy properties), as well as spraying process, droplet ignition and combustion, using both standard and unique equipment was carried out.

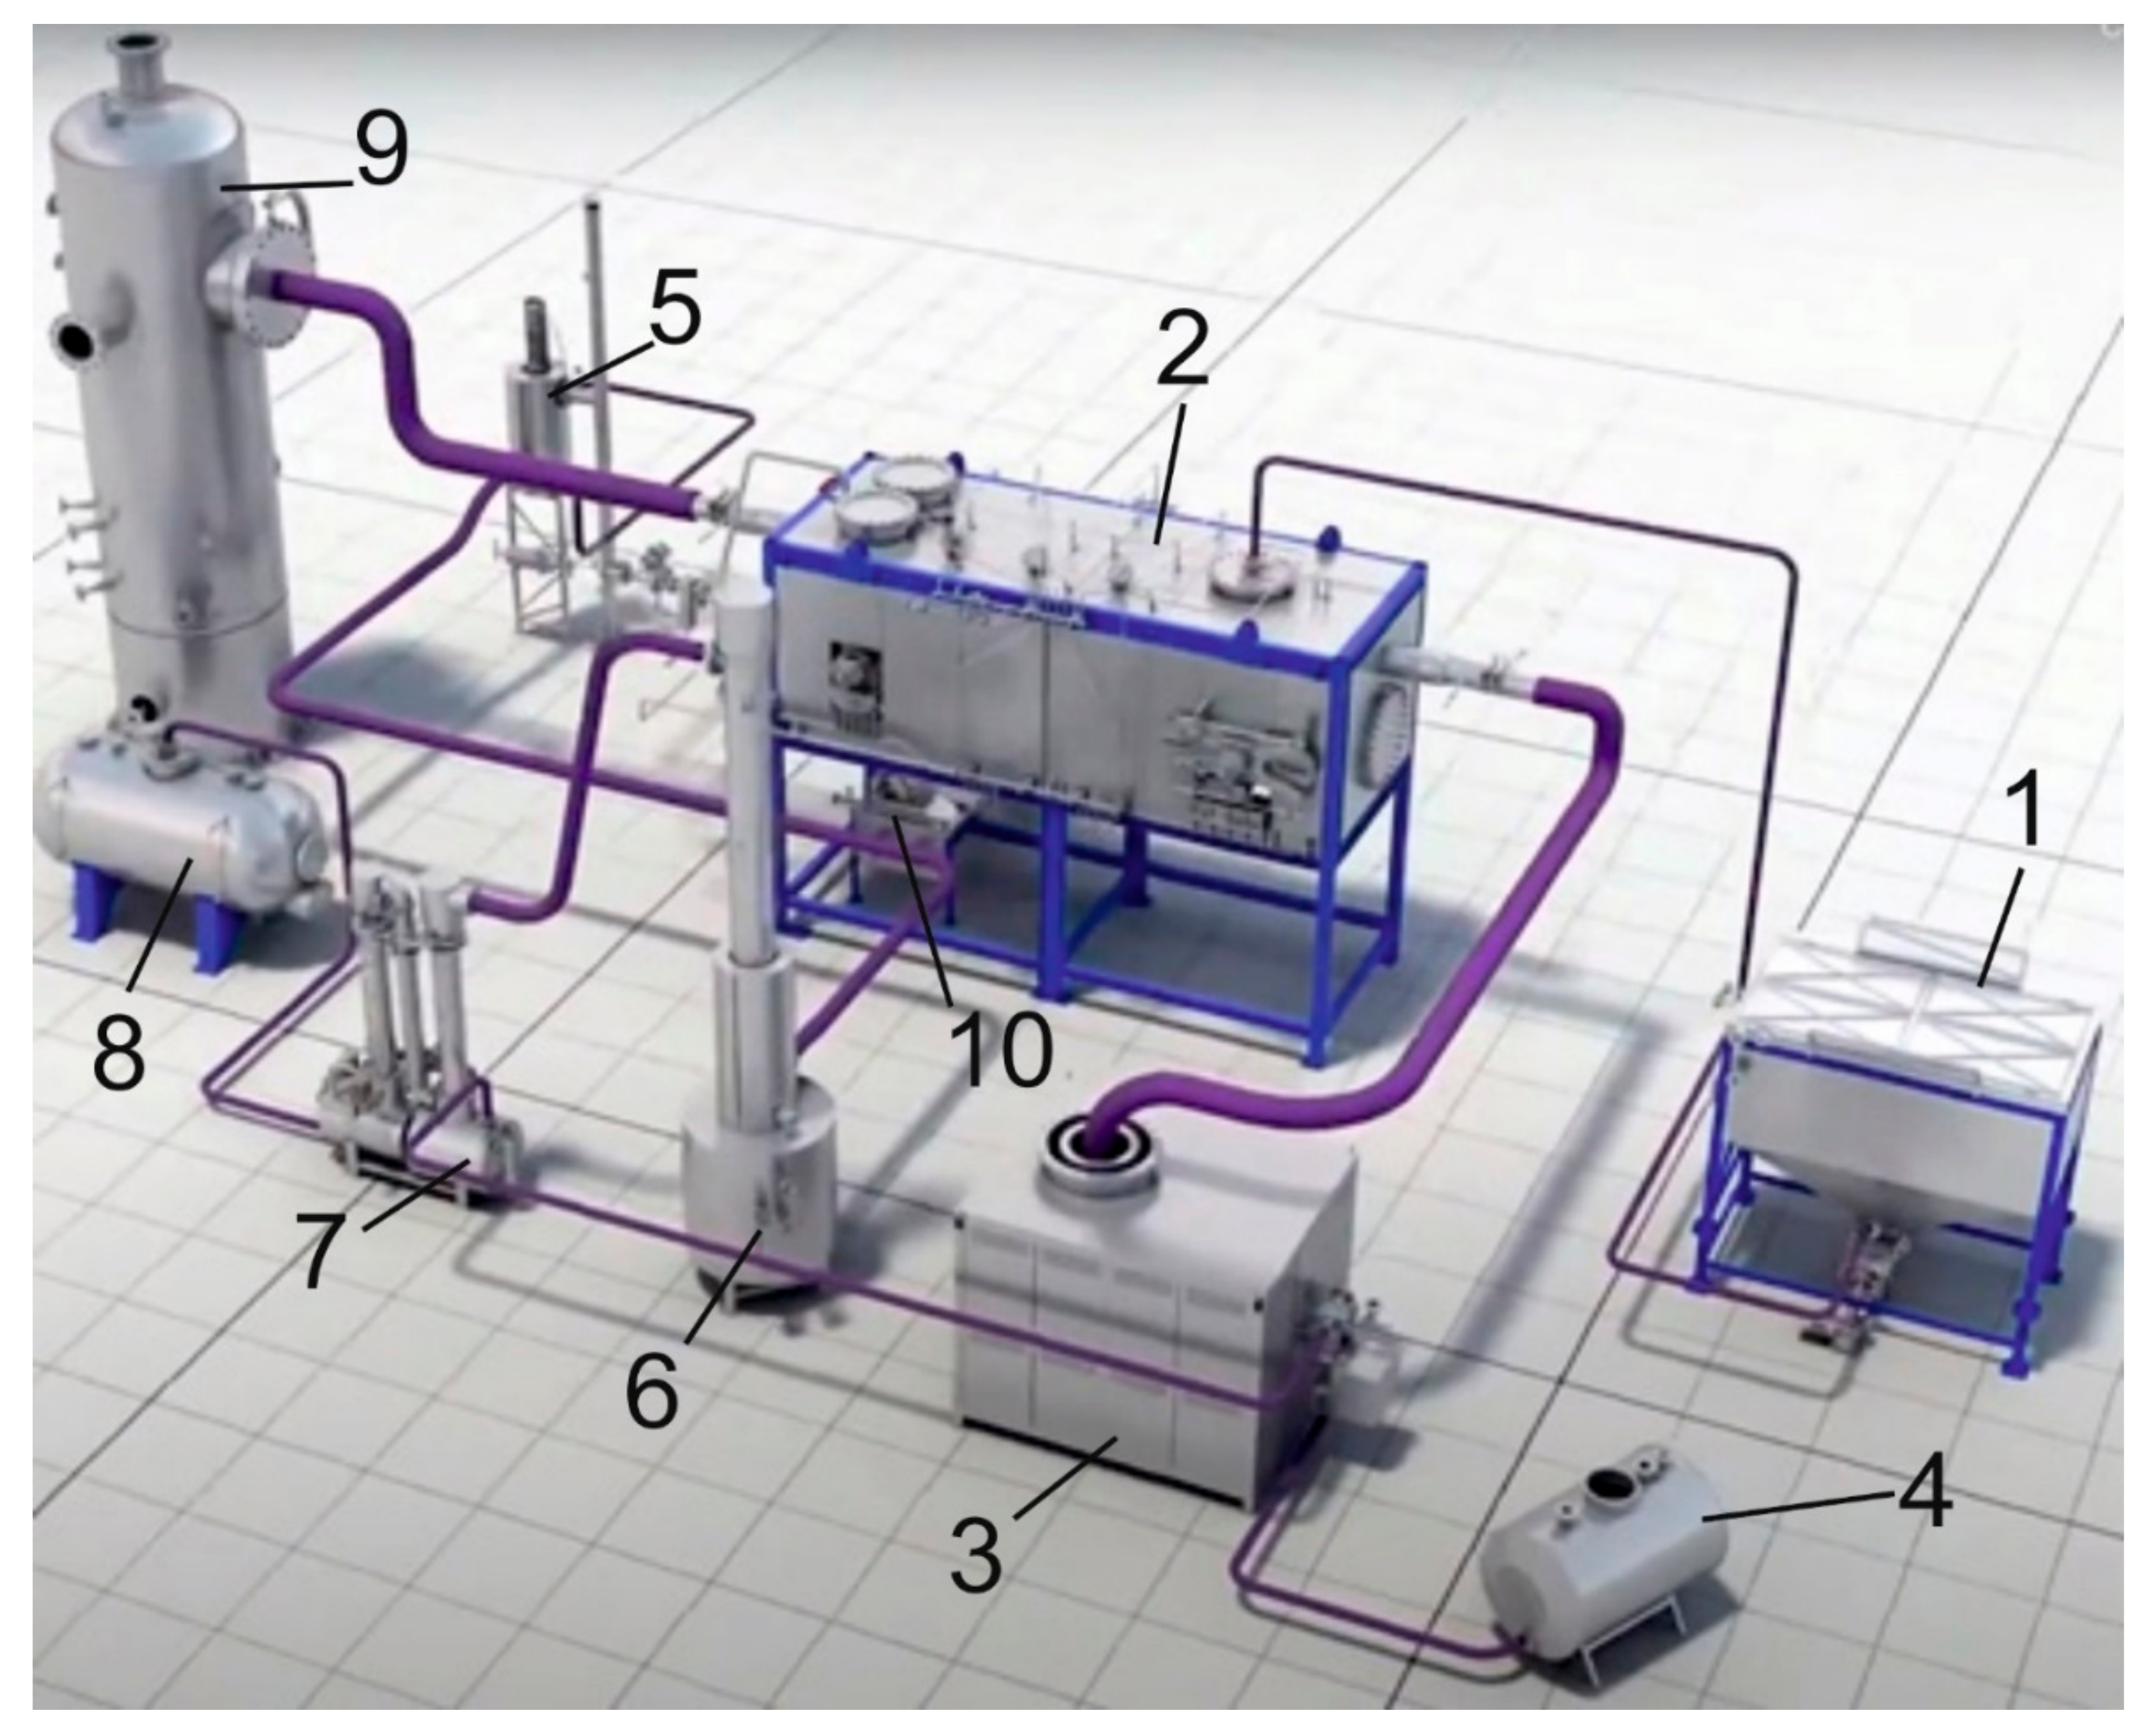
2.3. Setup for Steam Gasification of OS

Figure 2 shows the configuration of the once-through setup for steam pyrolysis of OS with a capacity of 300 kg/h from the city of Angarsk (Russia) installed at the production facilities of the Eco-Friendly Fuel and Energy Company (EFEC, Angarsk, Russia).
Before pyrolysis, OS was loaded into loading unit (1). This component contains a surface-type heat exchanger for OS heating to reduce viscosity and remove large inclusions. After that, the heated OS was transported to the transfer chamber of steam pyrolysis reactor (2) using an injection package. Water steam was generated and superheated using steam boiler (3) with a combined (by fuel type) burner. Diesel (4) and non-condensable gas derived from steam pyrolysis were used as fuel. The economic efficiency of the setup can also be increased with solid fuel (coal, biomass, and semi-coke obtained as a result of oil sludge processing) used as primary organic fuel.
The resulting steam (with a temperature of 650 °C and a flow rate of 150 kg/h) was supplied to reactor (2) as an agent, which initiated the OS steam pyrolysis. The OS heating rate was about 50 °C/min, which corresponds to the slow pyrolysis process. The maximum temperature of the OS sample was about 620 °C. The pyrolysis process can be generally divided into two stages: evaporation of external moisture and hydrocarbons with a low boiling point and thermal decomposition of high-molecular compounds with the formation of gaseous products. Based on the OS heating rate and the maximum attainable temperature inside the sample, the time of the active pyrolysis process (the second stage) proceeded on average for 45 min.
OS transportation in the reactor was performed using a belt conveyor made of heat-resistant steel with the rotation frequency controlled by the electric drive.
The steam–gas mixture formed as a result of the OS pyrolysis was continuously removed from the reactor and supplied to condensing devices (6) and (7). During primary condensation of the steam–gas mixture (6), heavier fractions—bitumen—were separated. At the second condensation stage (7), the liquid hydrocarbons formed and the water (agent used) were separated. Next, liquid hydrocarbons as the target product of OS processing were discharged into a separate container. After that, water from storage tank (8) and non-condensable gas-phase pyrolysis products were supplied to the burner of steam boiler (3). Combustion products from the steam boiler entered the heating jacket of steam pyrolysis reactor (2) and then were removed to a scrubber through a smoke exhauster to absorb dust and various gas-phase oxides.
The resulting solid-phase products of steam pyrolysis of OS (semi-coke) were removed through the reactor transfer chamber and cooled discharging loader (10) into the storage tank.
Quantitative composition of the non-condensable gas-phase products of steam pyrolysis was assessed using a once-through gas analyzer Test-1 (BONER, Novosibirsk, Russia).

2.4. Study of Semi-Coke Characteristics

Before the study, the produced semi-coke was ground using a ball mill in the following grinding mode: the material-to-grinding body mass ratio was 1:1, the grinding time was 2 h. After that, the ground sample was sieved to isolate particles of less than 80 μm.
Proximate analysis (moisture, ash, volatile matter content, calorific value) was performed according to standard ISO methods: ISO 589:2008—hard coal. Determination of total moisture; ISO 1171:2010—solid mineral fuels. Determination of ash; ISO 562:2010—hard coal and coke. Determination of volatile matter; ISO 1928:2009—solid mineral fuel. Determination of gross calorific value and calculation of net calorific value. The elemental composition was determined using a Flash 2000 CHNS analyzer (Thermo Fisher Scientific, Waltham, MA, USA). Chemical composition of the ash was determined according to ASTM D4326-21 Standard test method for major and minor elements in coal ash by X-ray fluorescence. Typical ash melting points were determined according to ISO 540-81—solid mineral fuel. Methods for determination of ash fusibility. Scanning electron microscopy of semi-coke was performed using a JSM-6000C scanning electron microscope (JEOL, Japan).
Thermal decomposition of the test semi-coke sample in oxidizing (air) and inert (argon) atmosphere was performed using a differential thermal analyzer Netzsch STA 449 F3 Jupiter (Netzsch, Germany). The analysis was performed in a corundum crucible with a perforated lid up to 800 °C at a heating rate of 10 °C/min. The gas flow rate was 150 mL/min. The sample weight was ≈15 mg. All the experiments were conducted under atmospheric pressure. The parameters of the thermal conversion of the test samples were evaluated using physical quantities (temperature, time and rate of thermal conversion) calculated graphically using TG and DTG curves.

2.5. Study of Liquid Hydrocarbon Characteristics

2.5.1. Characterization of Materials

The density and both kinematic and dynamic viscosity values at 50 and 80 °C were determined using a Stanbinger viscometer SVM3000 (Anton Paar, Graz, Austria) according to ISO 12185:1996 and ISO 3104:1994, respectively. The pour point (Tp) was determined using a liquid low-temperature thermostat KRIO-T-05-01 (Termex, Kirov, Russia) according to ASTM D97-17b. The flash point was determined using PE-TVO device (Ekros, Saint-Petersburg, Russia) according to ISO 2592:2000. The water mass content was determined from the density difference using a separating funnel and an oil demulsifier. The ash content of the liquid hydrocarbon sample was determined according to ISO 6245:2001. The calorific value of the products was found from the results of complete combustion of the samples in an ABK-1 bomb calorimeter (Russian Energy Technologies, Moscow, Russia). The content of carbon, hydrogen, nitrogen, and sulfur was determined using a Flash 2000 CHNS analyzer (Thermo Fisher Scientific, USA). The pH value of the liquid hydrocarbon sample was determined using a SevenCompact S220 pH meter (Mettler Toledo, Columbus, OH, USA) with a glass electrode. The fractional composition of the liquid hydrocarbon sample was determined using ARNS-1E distillation apparatus for oil products (Neftekhimavtomatika, Moscow, Russia) according to ISO 3405-2013. The sample surface tension was measured by the ring tearing method (du Nuy method) using a K6 tensiometer (KRUSS, Hamburg, Germany) at 25 °C.
The fractional composition was determined using ARNS-1E distillation apparatus for petroleum products (Neftekhimavtomatika, Moscow, Russia) according to ISO 3405-2013 «Petroleum products. Determination of distillation characteristics at atmospheric pressure».
Thermal decomposition of the liquid hydrocarbon sample in an inert argon atmosphere was performed using a Netzsch STA 449 F3 Jupiter differential thermal analyzer (Netzsch, Selb, Germany). The analysis was carried out in a corundum crucible with a perforated lid up to 600 °C at a heating rate of 10 °C/min. The gas flow rate was 150 mL/min. The sample weight was ≈15 mg. All the experiments were conducted under atmospheric pressure. The parameters of the sample thermal conversion were evaluated using physical quantities (temperature, time and rate of thermal conversion) calculated graphically using TG and DTG curves.

2.5.2. Experimental Study on Atomization Characteristics of Pyrolysis Oil Jet

High-speed visualization of jet characteristics (droplet velocities and spraying angle) and image processing were performed according to [26]. Image processing was performed using the ActualFlow software developed by Sigma-Pro (Novosibirsk, Russia) [27]. At the moment of the study area illumination with a laser pulse, the jet was recorded using a digital cross-correlation camera. The camera was installed perpendicular to the laser sheet plane. Figure 3 presents a schematic diagram of the experimental setup for recording a liquid hydrocarbon droplet jet after pneumatic spraying.
Liquid hydrocarbons were supplied from the fuel tank using an air-operated diaphragm pump. The spraying agent was air supplied by the compressor to a pneumatic nozzle with internal mixing chamber (Figure 4). The jet of sprayed products was illuminated with a laser sheet.
The pneumatic nozzle for liquid hydrocarbon spraying was made of stainless steel. The main sizes are shown in Table 1. The nozzle consists of a body with fuel and spraying agent inlets and two removable heads. They are attached by a thread. Liquid hydrocarbons flow through the inner channel to the mixing chamber where they are mixed with the spraying agent. Air flows through the inlet channel and then goes to the mixing chamber through the annular gap. The obtained fuel–air mixture is sprayed through the nozzle outlet.
The device for spraying liquid hydrocarbons used in the experiments is typical in design. The nozzle can be used to spray liquids with different properties (viscosity, density, etc.) with or without the spraying agent (air).
The pressure in the mixing chamber of a nozzle is a critical parameter [28] that influences jet characteristics after spraying. The air pressure was set to 0.02 MPa less than the fuel pressure to prevent its reverse flow through the fuel path. The fuel (Pf) and air (Pa) pressure for the studied liquid hydrocarbons spraying were Pf/Pa = 0.30/0.28 MPa.
The experiment was performed for 60 s. This time is sufficient for stable jet formation. The dimensions of the study area were 0.1 by 0.05 m. The experiments were conducted under the same conditions at a liquid hydrocarbon temperature of 18 °C and an ambient temperature of 20 °C, and relative humidity of 65%.

2.5.3. Ignition and Combustion

Droplet ignition and subsequent combustion of liquid hydrocarbons were studied using the experimental setup with a schematic diagram shown in Figure 5.
The main component of the experimental setup (Figure 5) is a temperature-controlled furnace (Rusuniversal, Russia) used as combustion chamber, supplied with a digital temperature controller (measurement error ± 1–3 °C) 0.012 m3 in volume. The setup also includes Fastcam SA4 high-speed cam-coder (Photron, USA) with a 1024 × 1024-pixel (20 µm pixel size) image format, 12-bit color depth, and 500 frames per second shooting frequency, and the platform of the coordinate mechanism was designed to feed liquid fuel droplets into the furnace with less than 1 mm movement error. Analysis of the gas-phase products was performed by once-through gas analyzer Test-1 (BONER, Russia).
The study of the ignition and combustion of single liquid hydrocarbon droplets included several stages. Firstly, the required heating temperature was set in the temperature-controlled furnace (in the range of 450–700 °C, with an intermediate step of 50 °C) recorded by a chromel–alumel thermocouple. These temperatures correspond to the conditions of sprayed liquid fuels supply to the combustion chamber of modern boilers [29]. Next, a Lenpipet NOVUS 10–100 μl mechanical dispenser was used to apply a liquid hydrocarbon droplet to the metal holder (made of steel wire). Then, the coordinates were set by the PC and the coordinate mechanism fed the sample to the center of the combustion chamber. Droplet diameter was measured using Tema Automotive software and accounted 1.5 mm (±0.1 mm).
Video recording started when the movement of the rod with a fuel droplet towards the combustion chamber began. The resulting gas-phase combustion products (CO, CO2, NOx, and SO2) were recorded using a once-through gas analyzer. Gas was extracted through a hollow rod (6 mm inner diameter) with the mechanical holder fixed on it. The resulting gas-phase products entered directly into its hollow part and then flew into the gas analyzer by means of a smoke exhauster due to the close rod proximity. The flow rate of gases was 3 L/min. The time period for scanning attained 3 s.
Several parameters were analyzed for comparative assessment of the droplet ignition and combustion characteristics at different air temperatures. They are ignition delay time, flame combustion time, and total combustion time recorded by a high-speed camcorder. The ignition delay time was considered the time from the moment the holder with a liquid hydrocarbon droplet entered the chamber focus until the start of the visible surface glowing, which corresponded to the start of combustion. The flame combustion time was recorded starting from the moment of visible glowing until flame failure. The total combustion time was determined by the interval from the moment of visible glowing to complete attenuation of the resulting carbon residue.
All experiments were conducted under the same conditions at room temperature of 20 ± 1 °C and relative humidity of 65 ± 3%. The systematic measurement error was less than 4% when measuring the characteristic droplet size; less than 0.3% when measuring the ignition delay time and flame combustion time; and ± 3 °C when measuring the air temperature. Fuel ignition was considered sustainable if an obvious glow (or flame) and the subsequent complete droplet combustion could be recorded. In this study, at least 10 experiments were conducted for each sample at a fixed air temperature.

3. Results

3.1. Material Balance of the Obtained Products of Steam Pyrolysis

Figure 6 presents the average values of the mass ratio of the products yielded by the steam pyrolysis of OS in the form of semi-coke, liquid hydrocarbons, and non-condensable gas-phase products. The figure also shows the composition of non-condensable gas-phase products of steam pyrolysis.
Figure 6 shows that the target energy product of steam pyrolysis is liquid hydrocarbons (30.4 wt%) and combustible non-condensable gas (26.5 wt%). In turn, semi-coke (39.6 wt%) shows a high content of inorganic components due to a high ash content in the original OS sample. Thus, the market product of steam pyrolysis of OS is liquid hydrocarbons, and combustible gas-phase compounds and carbon residue are considered as a secondary energy carrier to compensate for the energy costs of the setup when generating superheated steam. In turn, bitumen formed from heavy compounds of the steam–gas mixture is a direct analogue of the additive used in the manufacture and laying of asphalt [30].
Li J et al. [2] found that the yield of gas-phase products grows at increased OS pyrolysis temperatures. At 700 °C, the mass ratio of the obtained liquid hydrocarbons and gas-phase products was virtually 1:1. This effect is attributed to the secondary cracking of petroleum hydrocarbons [31].
Non-condensable gas-phase products contain a large number of combustible compounds such as CH4 (17.3 vol%), C2H6 (8.9 vol%), and CO (33.5 vol%) (Figure 6). In this case, H2 (15.9 vol%) is most likely formed due to the interaction of carbon and vapor (1), and H2S (3.3 vol%) is formed due to hydrogen and sulfur (2) contained in OS [32].
C + H2O → CO + H2
S + H2 → H2S
Partial imbalance in terms of the content of inorganic components can be due to the inhomogeneity of the OS sample used and a relatively high productivity (300 kg/h) of the experimental setup, and a large number of components in the technical system: pipelines, fittings, and containers, etc.

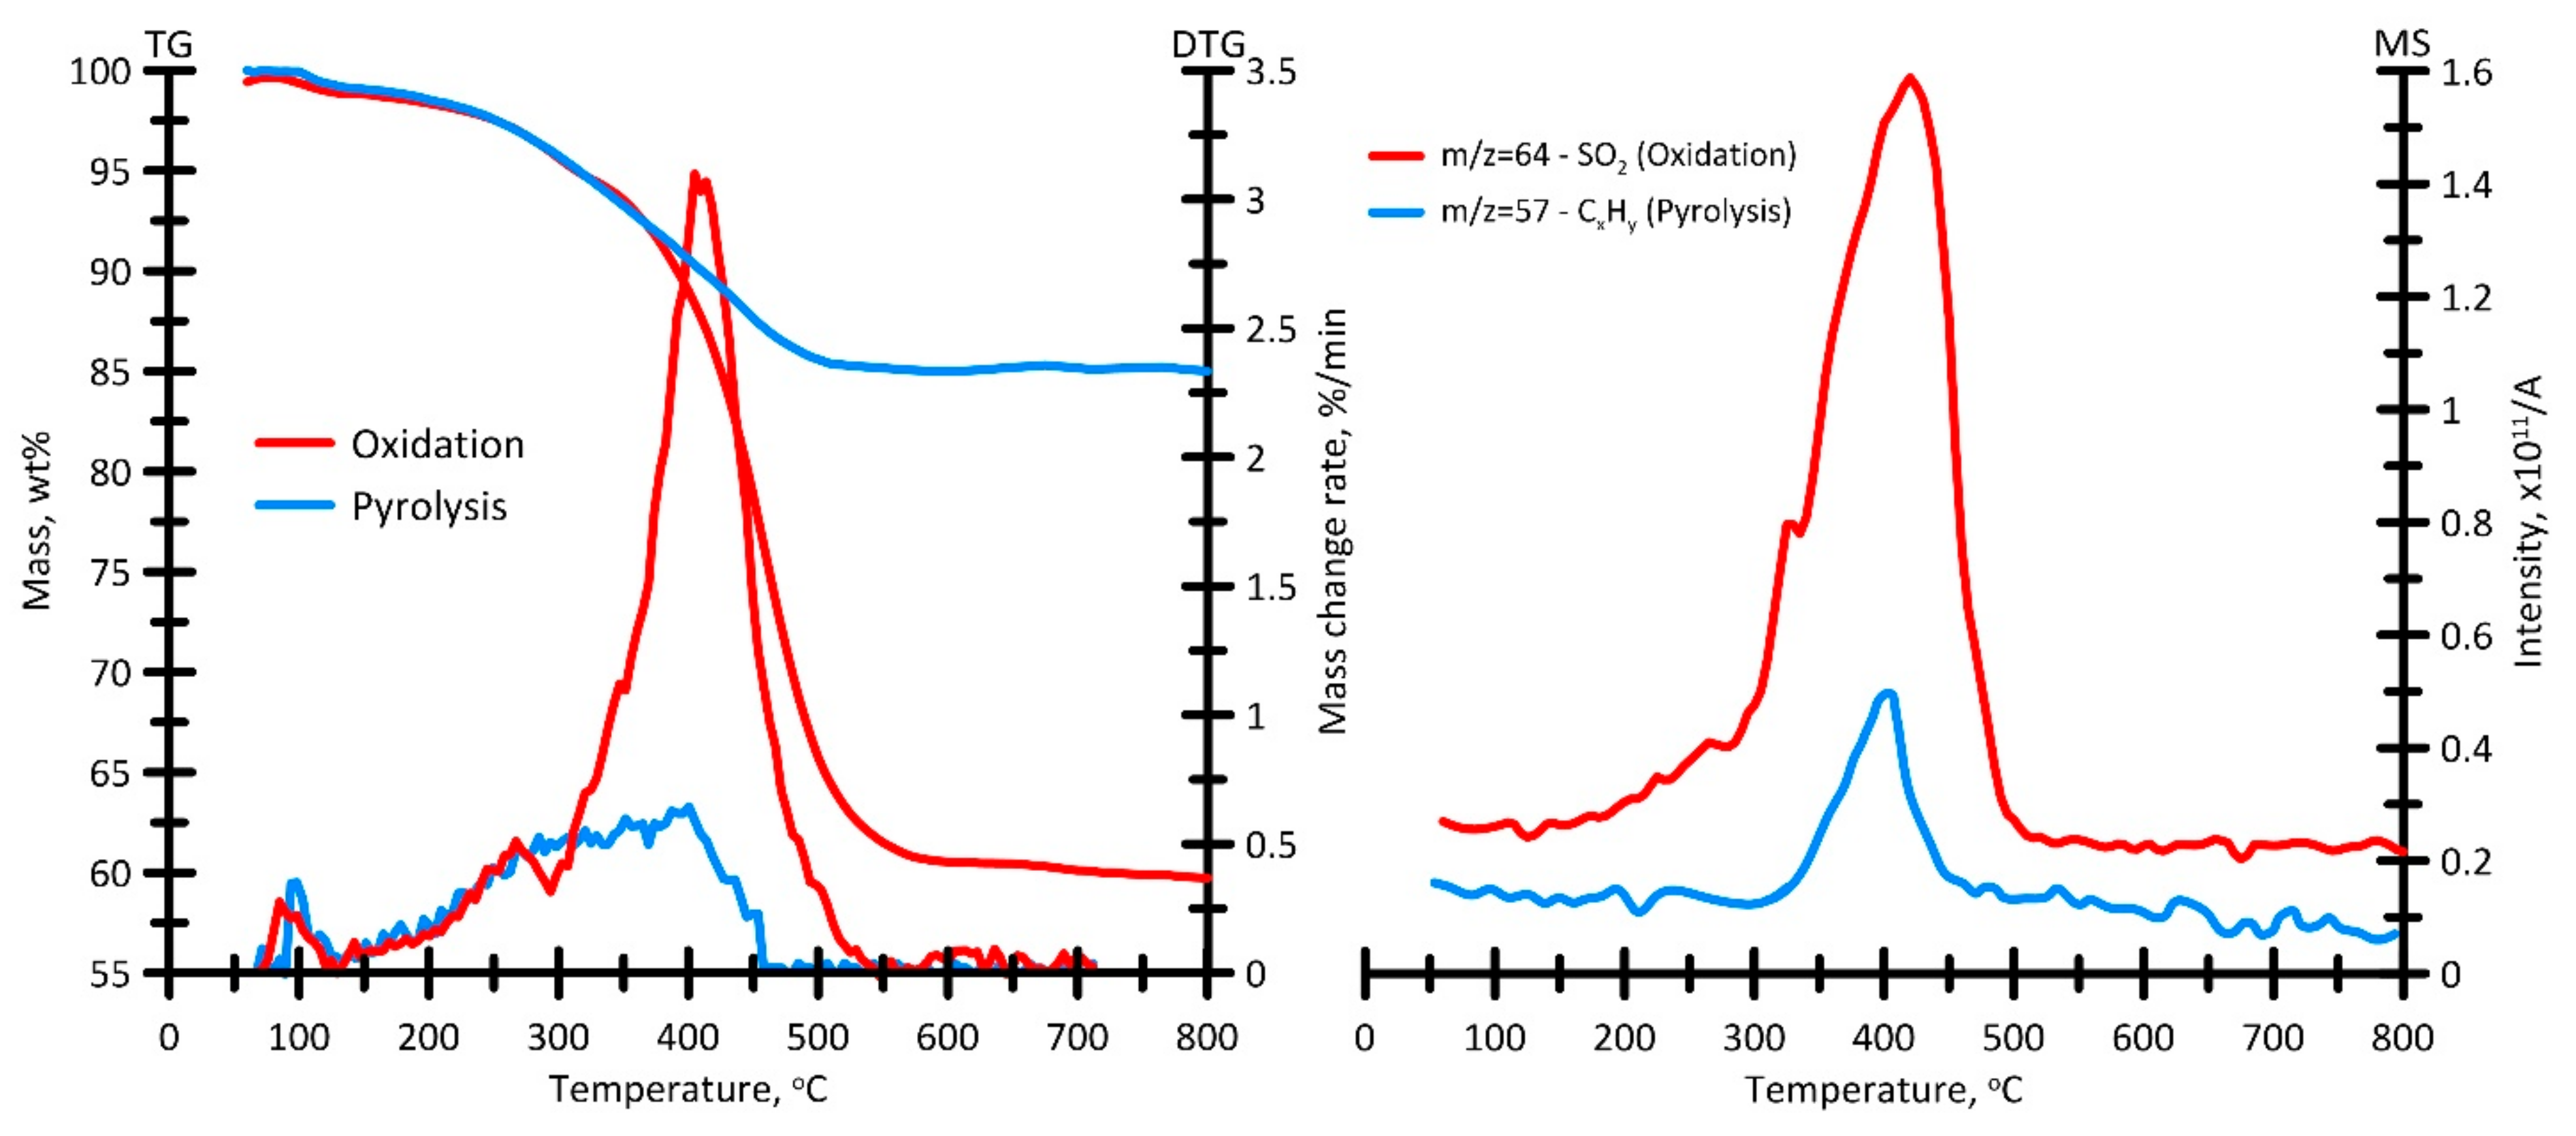
3.2. Characteristics of Semi-Coke

Table 2 summarizes the characteristics and elemental composition of semi-coke obtained from the steam pyrolysis of OS.
Table 2 shows that the semi-coke sample exhibits a high ash content (Ad = 63.7 wt%), which is associated with the origin and storage of the initial OS. In this case, the obtained heating value (LHV = 14.6 MJ/kg) is comparable to that for brown coal [33] and biomass [34]. The volatile yield in terms of dry ash-free mass is rather high (Vdaf = 62.7 wt%), which is characteristic of high reactive fuel. A high sulfur content (Sd = 1.7 wt%), which causes SO2 release during combustion, should be taken into account.
The main ash components include silicon oxide (63.4%), aluminum (12.1%), and iron (10.4%). The study of ash fusibility characteristics showed that the ash residue obtained from the combustion of semi-coke is of the medium-melting type (tc > 1250 °C).
The content of ash and SO2 formed during combustion can be decreased by mixing semi-coke with wood wastes [35], which exhibit a low ash content (up to 2 wt%) and no sulfur [34].
Figure 7 presents the results of the scanning electron microscopy of the semi-coke sample particles.
The semi-coke sample particles are characterized by a spherical shape and inhomogeneous uneven surfaces with numerous depressions. A large number of smaller fragments less than 10 μm in size can be found on the particle surface. The particle sizes did not exceed 80 μm.
Figure 8 shows the results of thermal analyses in inert and oxidizing atmospheres in the form of TG and DTG curves.
Due to the high content of volatile compounds (Table 2), the initial temperature Ti and the final temperature Te of the intensive oxidation attain 248 and 518 °C, respectively. The total mass loss in the oxidation mode is 38.6 wt%.
Generally, oxidation of the sample can be divided into two stages. The first one is removal of residual volatile compounds (up to 365 °C). The second one is subsequent oxidation of the carbon residue. Moreover, the monomodal DTG profile has an additional shoulder in the temperature range of 248–365 °C. The maximum reaction rate wmax is 3.1 wt%/min at Tmax = 462 °C.
The MS analysis data show that during oxidation of the semi-coke sample, SO2 releases with the profile that can be determined in the temperature range of 294–497 °C. The profile of CO2 release, the main product of oxidation of combustible matter, is in fact a mirror image of the corresponding DTG profile.
The mass loss (in the amount of 14 wt%) in an inert atmosphere is due to the removal of volatile compounds contained in the test sample (Table 2). The initial temperature of intense decomposition Td attained 223 °C. The DTG profile of the thermal decomposition of semi-coke in an inert atmosphere shows a monomodal curve with a peak in the temperature range of 189–513 °C. The mass spectrometry showed that thermal decomposition of semi-coke in an inert atmosphere was accompanied by the release of CxHy in the temperature range of 350–488 °C, the reflections of which corresponded to m/z = 57 – C4H9.
It should be noted that the mass loss of semi-coke during its thermal conversion (in oxidizing and inert atmospheres) occurred in an exothermic mode, which is evidenced by differential scanning calorimetry.

3.3. Liquid Hydrocarbons

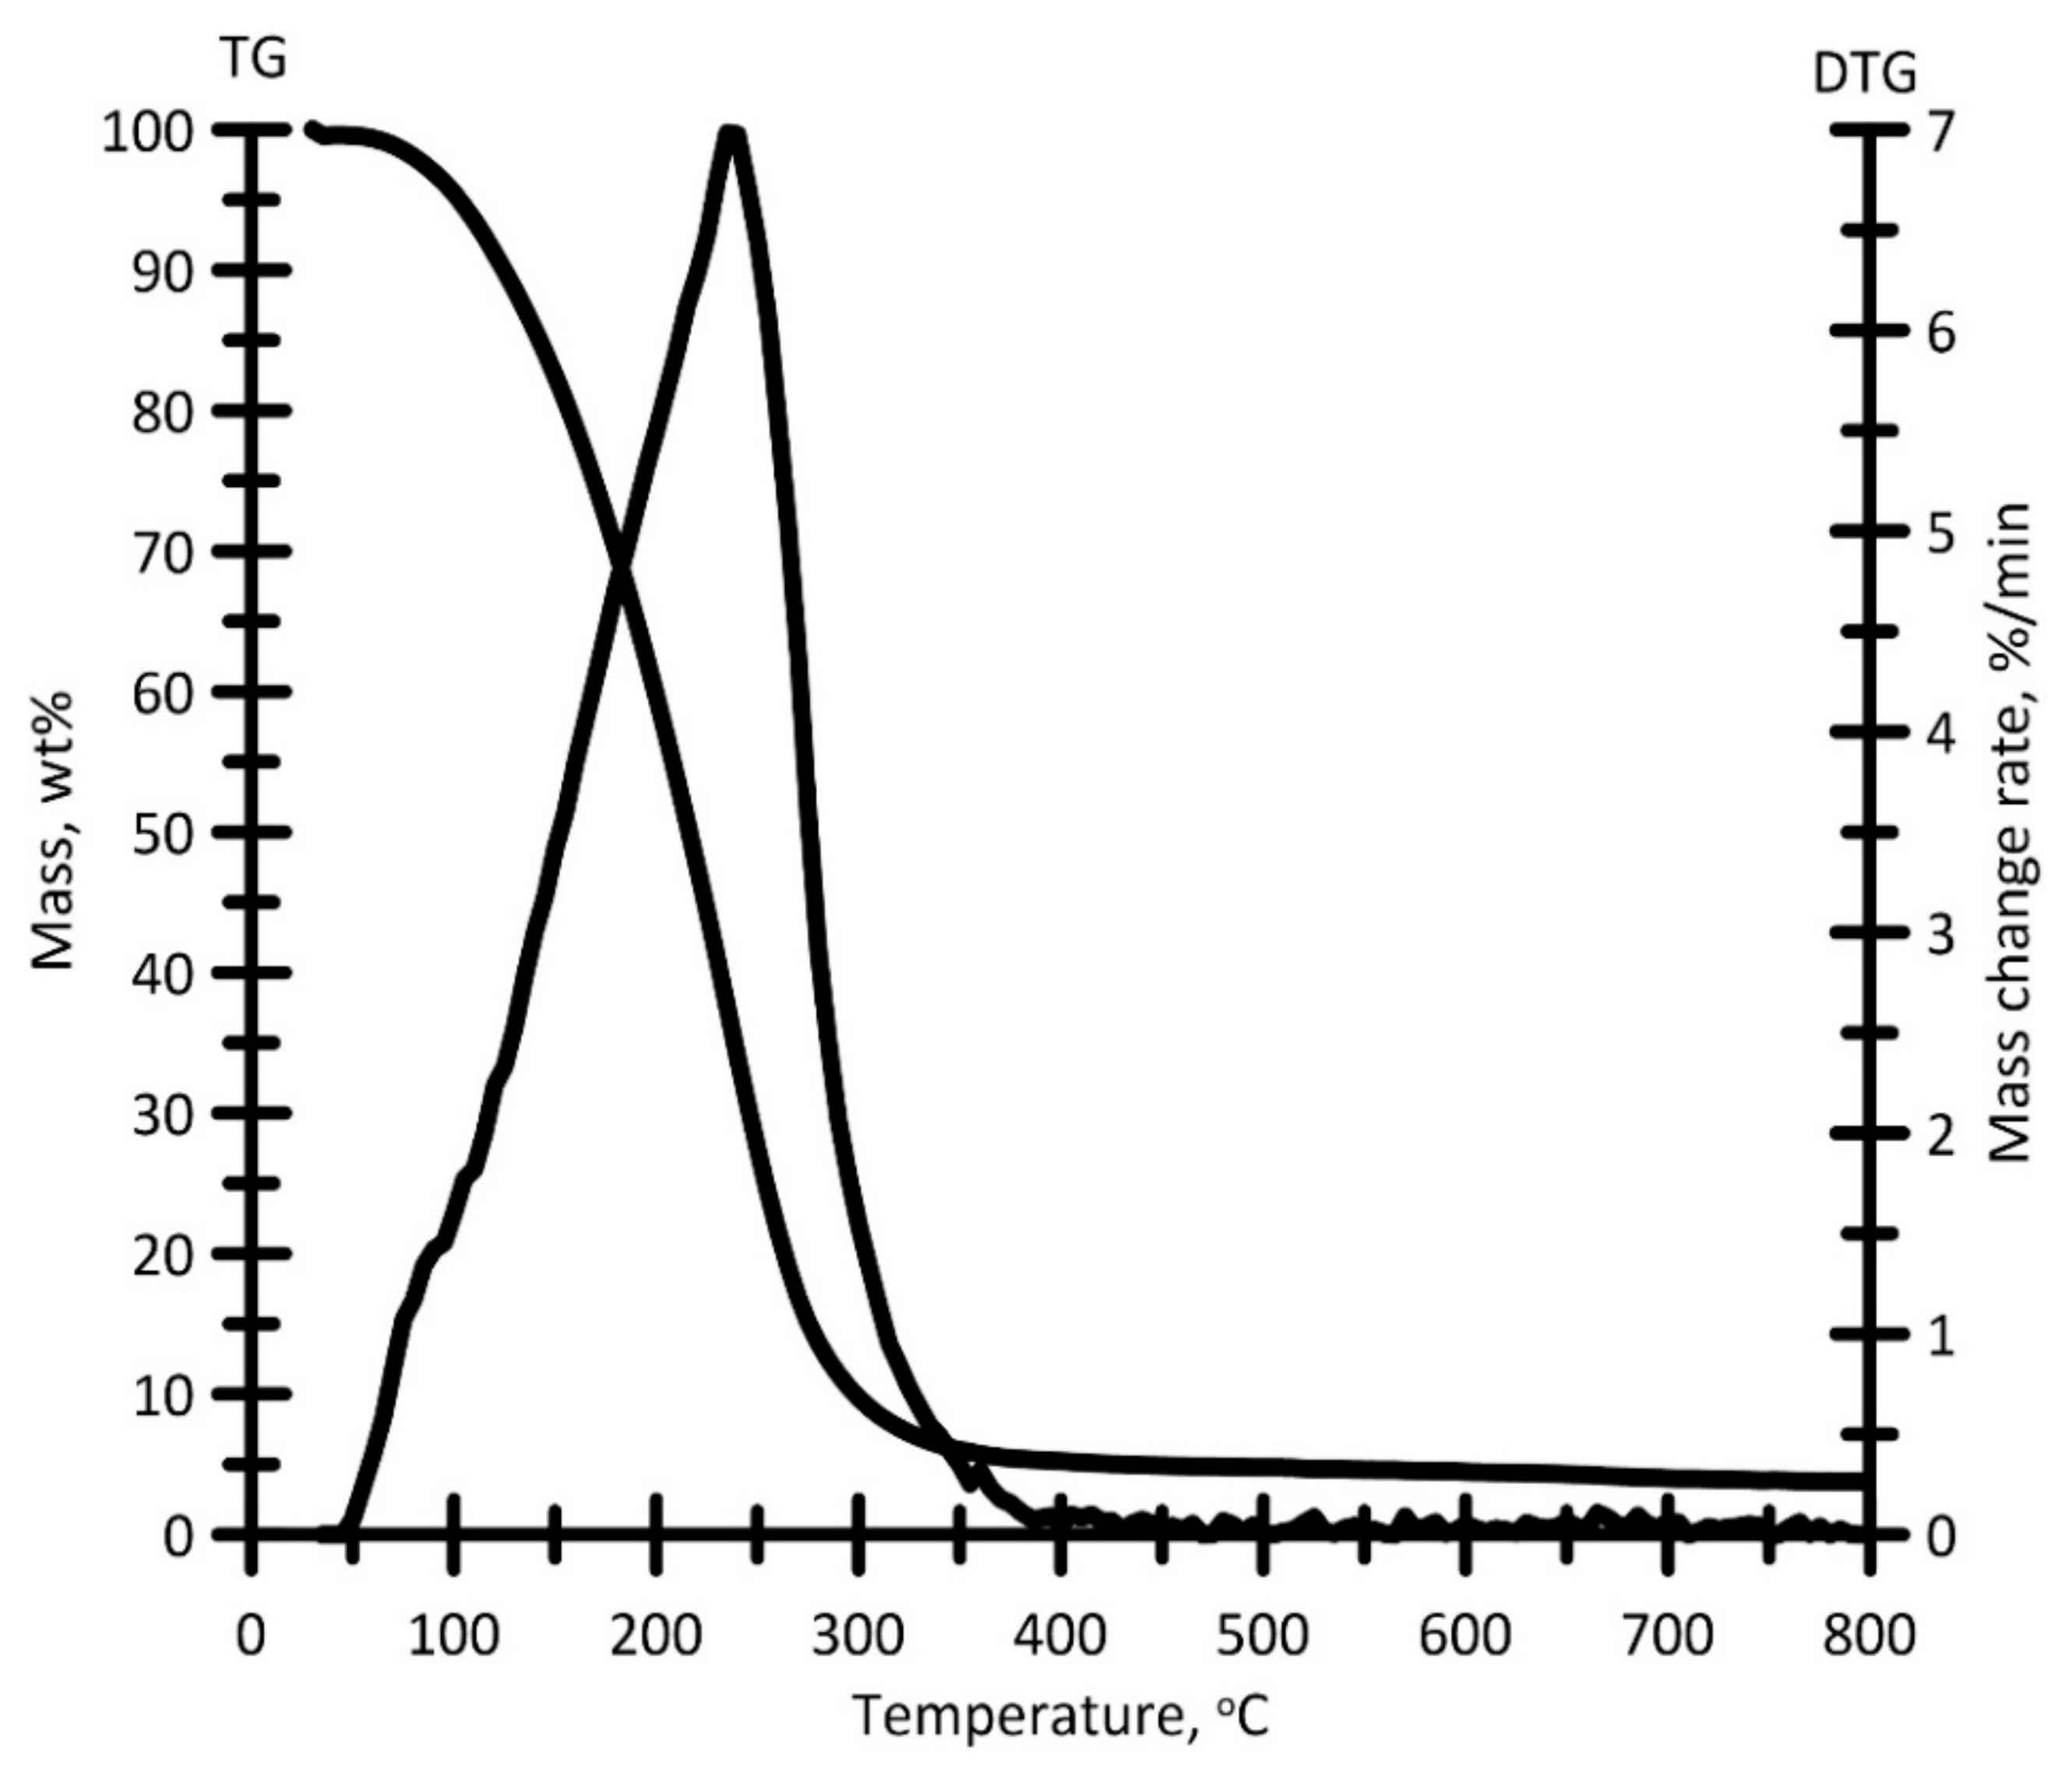
3.3.1. Physical and Chemical Characteristics
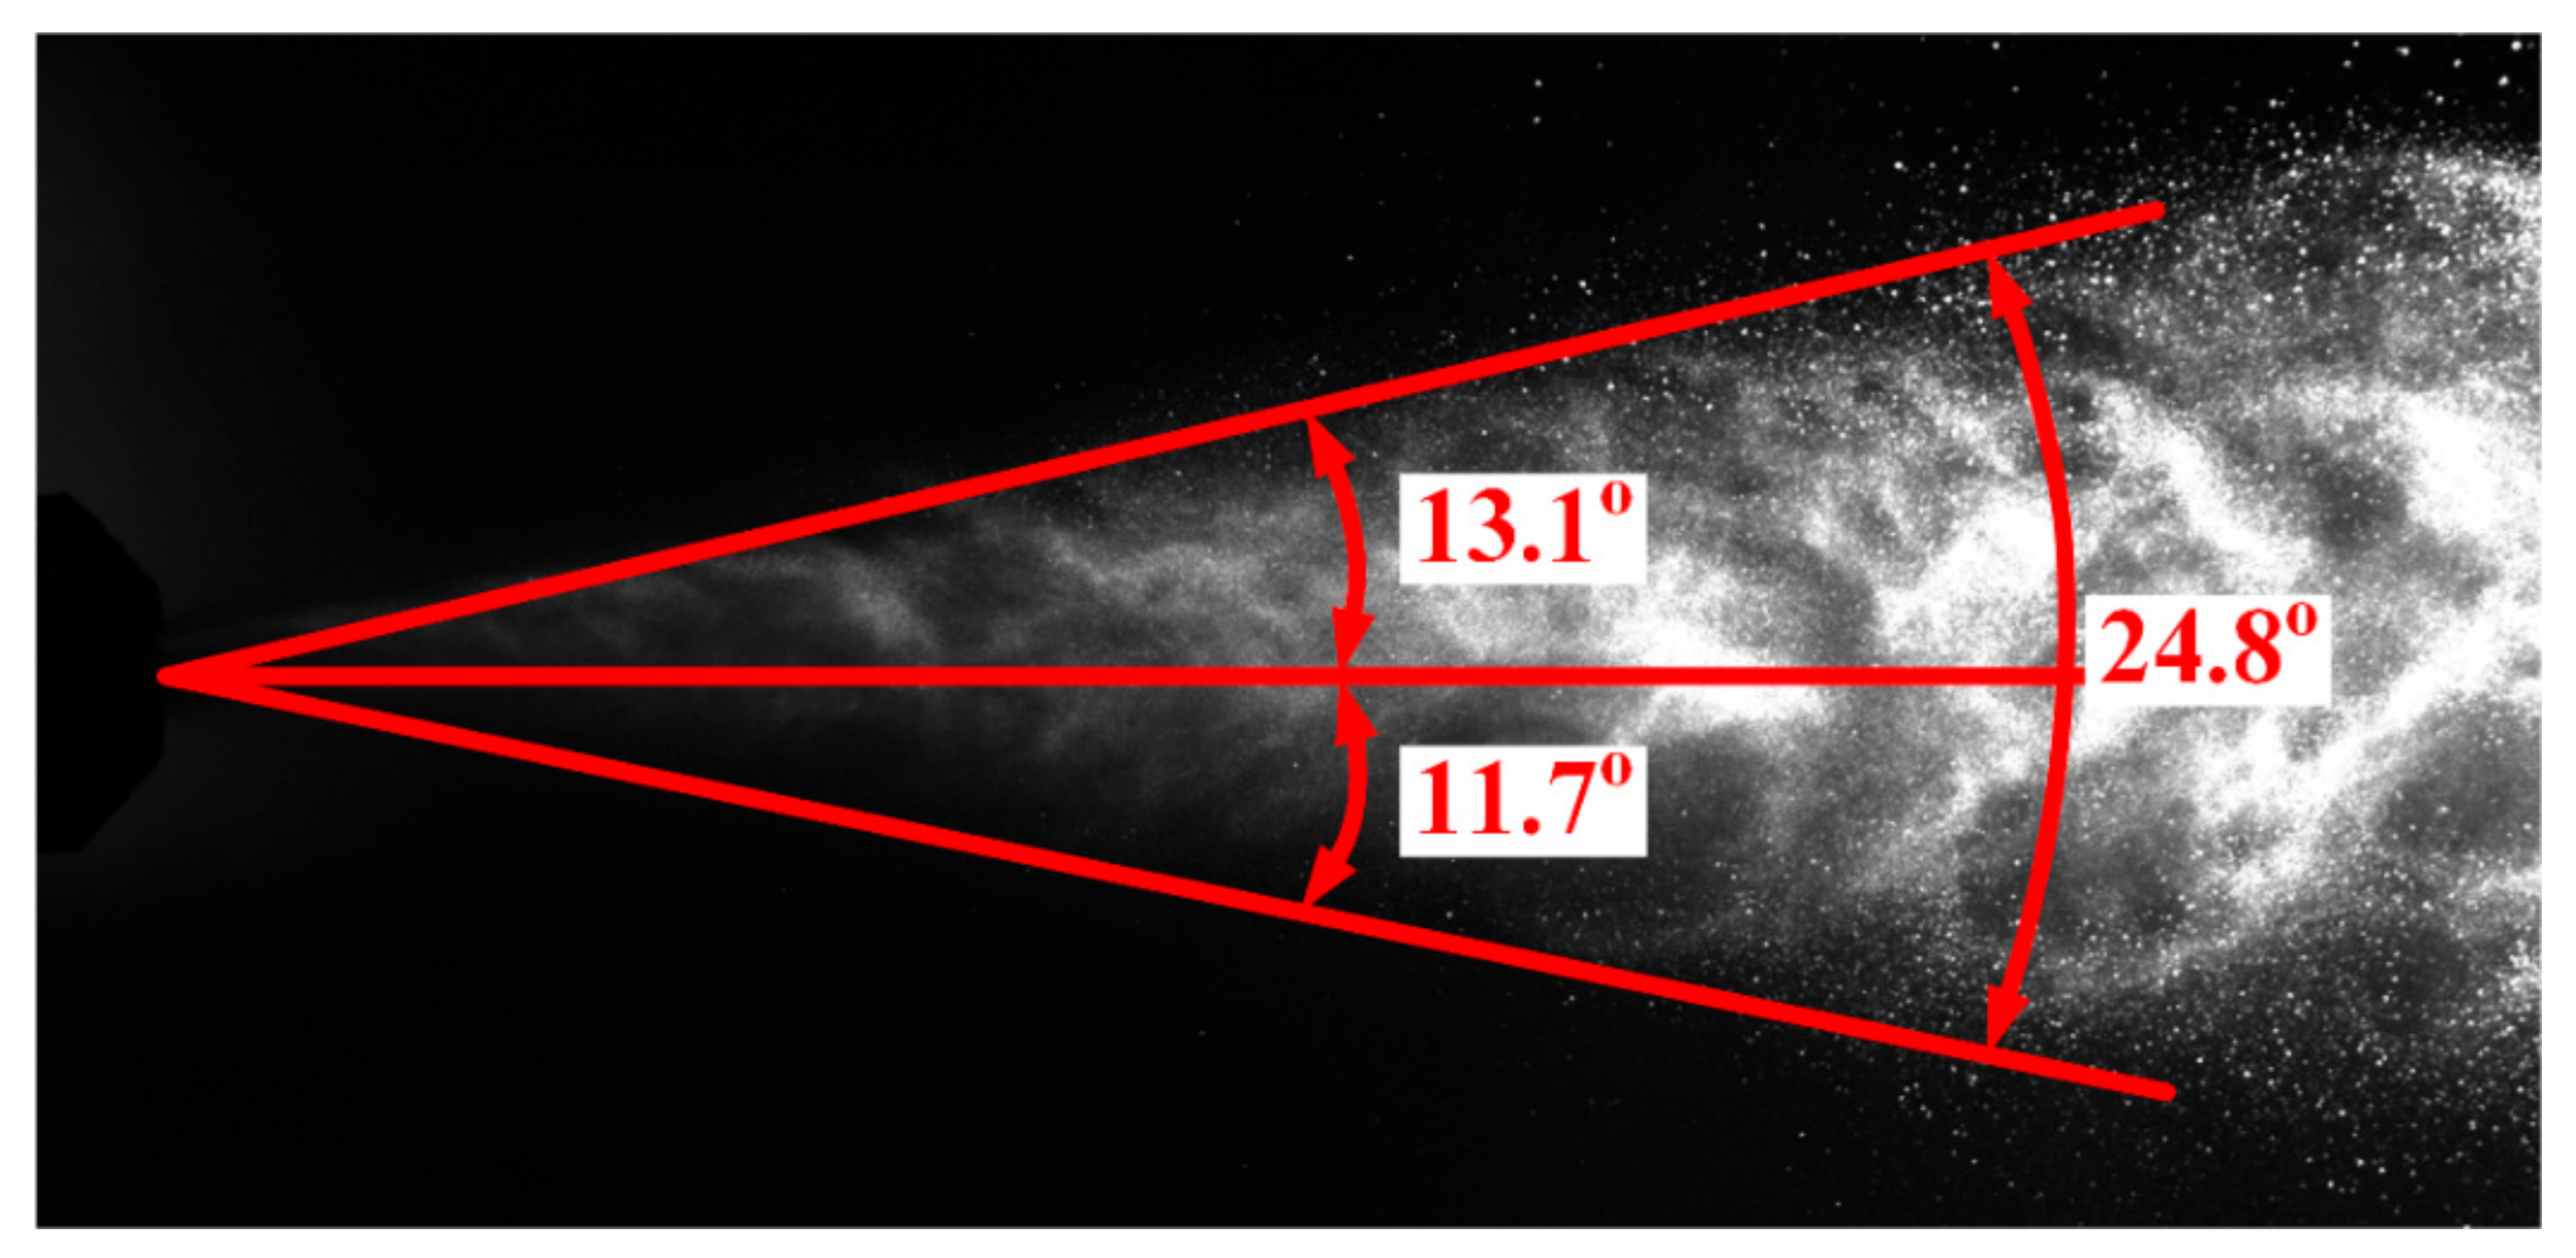
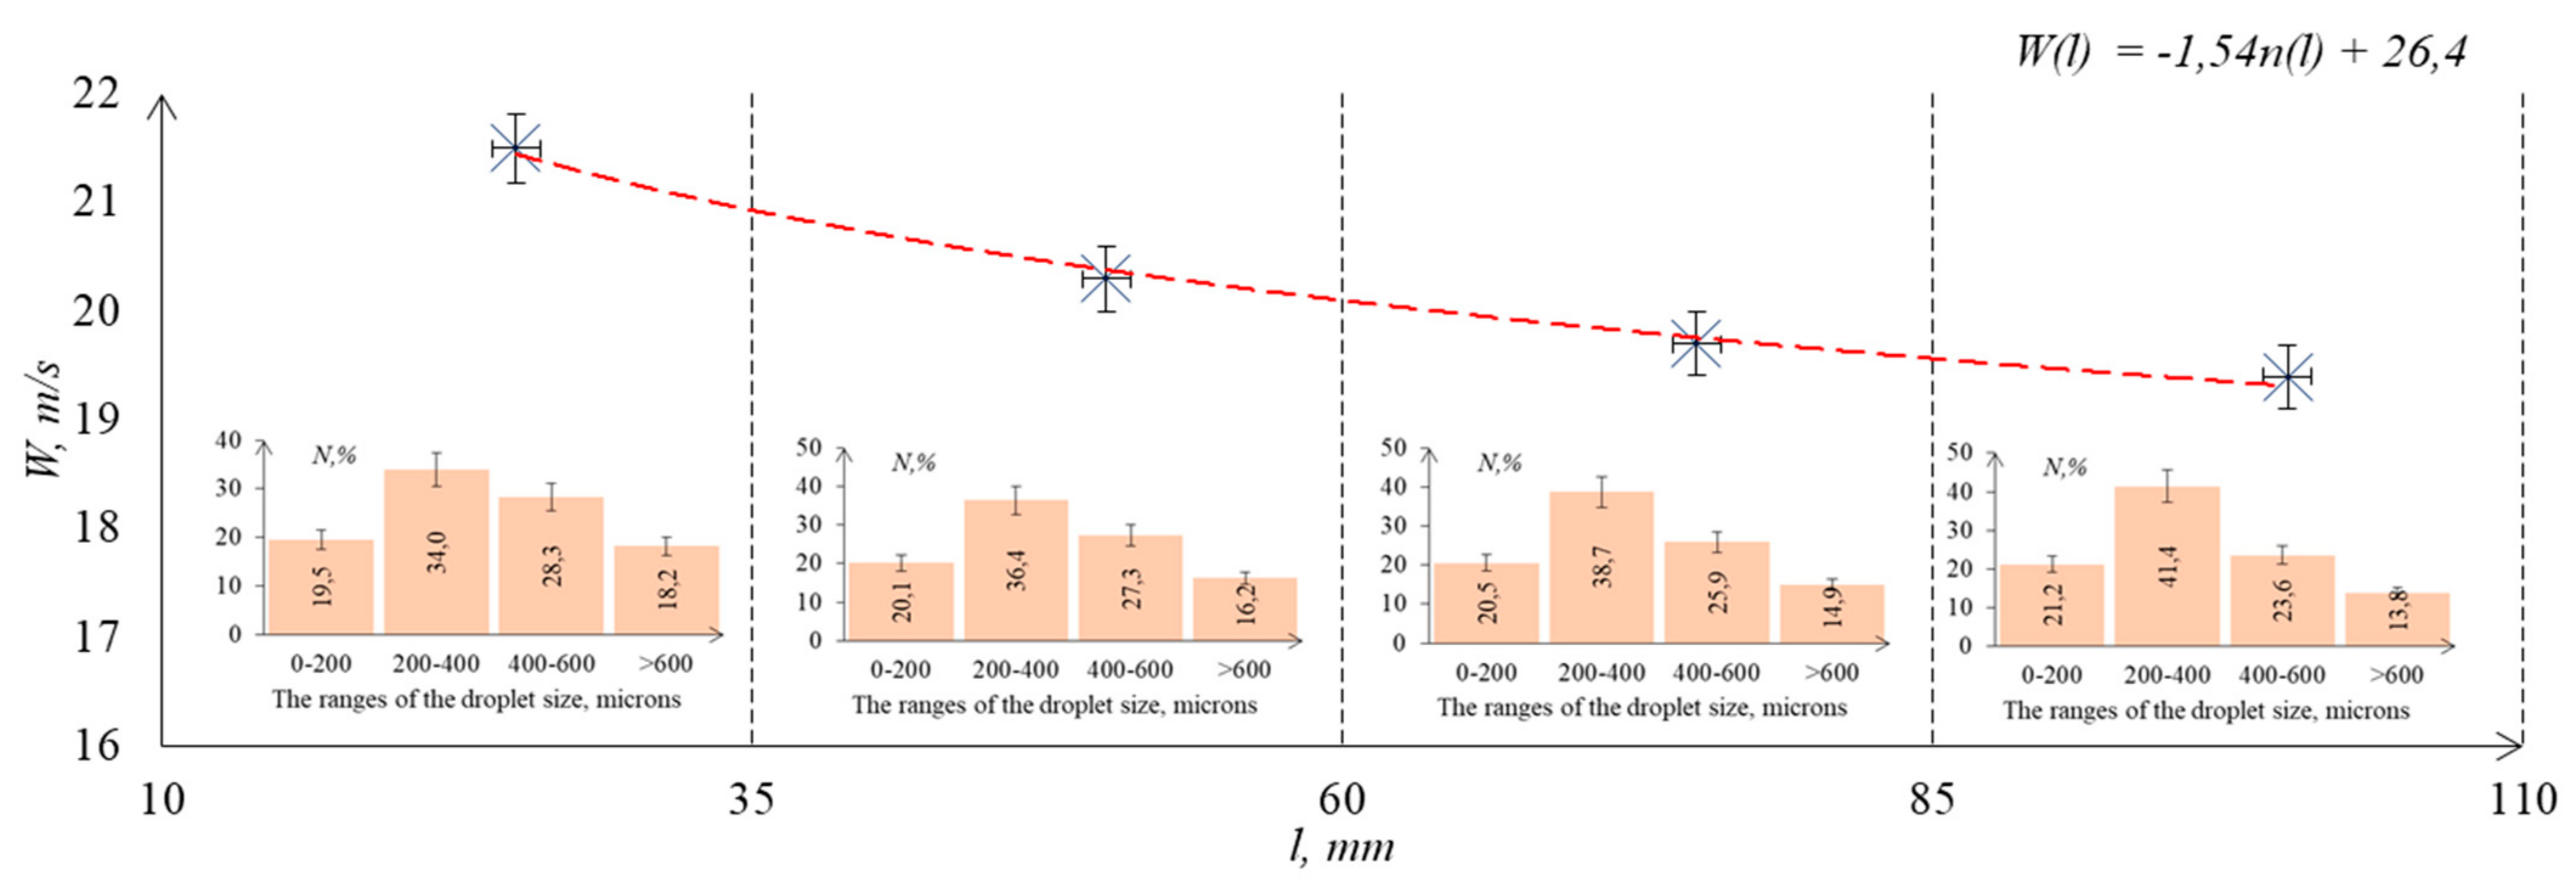
The properties and elemental compositions of the test sample of liquid hydrocarbons are presented in Table 3.
The properties of liquid hydrocarbons affect their characteristics in terms of potential parameters in the combustion system, storage, transportation, potential emissions, and distillation range, etc., [38].
Comparison of the physicochemical characteristics of the test sample with other fuel types (Table 3) shows that liquid hydrocarbons in general have similar characteristics to classic fuel oil, as well as oils obtained by pyrolysis from various industrial wastes.
The density and viscosity values determine fuel spraying in the combustion chamber. Fuel combustion and evaporation efficiency, as well as the boiler efficiency, depend on spraying conditions. An increased fuel viscosity decreases its combustion efficiency, followed by an increase in the specific fuel consumption and smokiness of combustion products. An increase in temperature from 15 to 40 °C led to the density change equal to 17.5 kg/m3. The viscosity values indicate that liquid hydrocarbons yielded by OS pyrolysis are appropriate for spraying in the burner nozzles of power boilers.
The obtained value of the pour point was 5 °C, which indicates the impossibility of it being used in a cold climate and the need for additional heating or anti-freezing additives, in particular, diesel fuel that shows a low pour point (−40–−50 °C) and high heating value (44–46 MJ/kg) [39]. The flash point was 89 °C, which is comparable to that of other types of pyrolysis oils [40]. This indicates the presence of a higher content of light fractions in the composition of liquid hydrocarbons derived from steam pyrolysis of OS in comparison with conventional fuel oil [41].
Despite the use of superheated steam as a pyrolysis medium, the water content in the test sample of liquid hydrocarbons attained 0.2 wt%, which is comparable with that in other conventional liquid fuels [42].
An insignificant amount of ash content was recorded for all the test samples. High ash content leads to the formation of carbon deposits in tanks and the emission of solid particles with combustion products. Therefore, low ash content is extremely preferable for such fuel application. The determined pH value of 6.8 is comparable to that for conventional fuel oil.
The heating value (LHV = 42.6 MJ/kg) is sufficient for energy use and is comparable to that for diesel fuel (43.3 MJ/kg), gasoline (44.4 MJ/kg), biodiesel (36.8 MJ/kg) [43], and pyrolysis oils obtained during the processing of tires [44] and plastic [45]. In [43], the authors reported about a direct correlation between the heating value and the mass yield of the product. Ramirez-Canon et al. [46] revealed that an increase in the mass fraction yield leads to a higher heating value of liquid hydrocarbons due to increased density.
The sulfur content in the test sample was 0.8 wt%, which is an advantage over conventional fuel oil [41]. This undoubtedly is the major advantage of such fuel since its combustion yields less sulfur oxide, which, in addition to the adverse anthropogenic impact, causes intense corrosion of the metal surfaces of pipes and other elements of boilers. A relatively high content of hydrogen (H = 11.4 wt%) and oxygen (O = 4.4 wt%) indicates the presence of light hydrocarbons.
Figure 9 presents the results of the thermal conversion of the test liquid hydrocarbon sample in an inert argon atmosphere.
According to TG data, the onset temperature of intense mass loss (decomposition) Td was 94 °C, the value of which correlates with that of the flash point Tf (Table 3). Figure 9 shows that the mass loss of the sample in the temperature range of 25–100 °C was about 5%, which is likely due to the boiling of residual moisture and some oil fraction [47], for which the boiling temperature range was typically equal to 40–100 °C. At temperatures up to 200 °C, the mass loss was 35%, which is associated with the boiling and conversion of gasoline fractions [48]. In the temperature range of 200–300 °C, which corresponds to boiling of the hydrocarbon fraction with an intermediate molar mass (in particular, kerosene) [48], the mass loss was 49.5%. At temperatures exceeding 300 °C, which refer to boiling of heavier fractions [48], the mass change was about 7%. At temperatures exceeding 340 °C, the sample exhibited no mass loss, which is caused by the formation of carbon residue amounting to about 3.5 wt%.
Figure 9 shows the DTG profile of a monomodal shape, which is determined in the temperature range of 50–370 °C. The maximum reaction rate (wmax = 7 wt%/min) was recorded at Tmax = 237 °C.

3.3.2. Spray

Changes in the droplet velocity values were recorded along the flow. The droplet velocity decreases in four cross-sections of the jet at distances of 25 mm, 50 mm, 75 mm, and 100 mm from the nozzle. In this case, the highest droplet velocity values are found directly in the center of the jet (along the axial coordinate). Jet expansion and aerodynamic resistance [49], coagulation of droplets [50], and their rotation and destruction [28] cause changes, such as decreased velocities of liquid droplets along the axial coordinate during spraying. In this case, the trajectory of motion of the liquid hydrocarbon droplets in the jet changes, thus increasing the diameter of the sprayed fuel jet.
Figure 10 shows an approximation curve of the change in the fuel droplet velocity along the longitudinal axis.
The experimental results (Figure 10) showed a decrease by no more than 10% in the velocity of liquid hydrocarbon droplets at Pf/Pa = 0.30/0.28 MPa after spraying. The obtained approximation equation estimates the change in the velocities of fuel droplets as they move away from the sprayer. In addition, Figure 10 shows the droplet sizes and their number in the characteristic sections of the jet. The experimental results showed that 200–400 μm fuel droplets predominate in the immediate vicinity of the nozzle (at a distance of 25 mm). Their number attains 35% of the total. In this case, the jet contains rather large droplets (more than 600 μm). The droplet velocity decreases as the distance from the nozzle increases. The sizes of fuel droplets also change due to the aerodynamic resistance of the environment (air). Thus, at a distance of 50 mm from the nozzle, the number of droplets up to 200 μm and 200–400 μm in size increases by 3 and 6%, respectively. At the boundary of the study area (100 mm from the nozzle), the number of small droplets (no more than 400 μm) increases by 16% compared to that in the 25 mm section.
The droplets of liquid hydrocarbons collide with each other after spraying and form new fragments or retain their integrity. The destruction of rather large droplets depends on the density ratio of air-to-liquid hydrocarbon [51]. High values of the ratio facilitate the droplet deformation and its subsequent destruction. It is known [50] that the smaller changes in droplets dimensions occur for a more viscous liquid. These droplets swirl and transform due to stretching and compression. Therefore, no further destruction occurs since the droplets are spherical and cannot be separated into smaller parts. Thus, the number of large droplets is likely to increase.
Figure 11 shows a micrograph illustrating the results of the high-speed recording of changes in the jet spraying angle of liquid hydrocarbons. In the image, the jet spraying angle is represented by red lines that indicate the jet boundaries. It is known [52] that spatial distribution of droplets and their size depend on geometric characteristics of the jet, including the spraying angle, which affects the conditions of ignition and combustion of sprayed fuels in the boiler furnaces.
The experimental value of the jet spraying angle in the study area did not exceed 25°. It should be noted that this value is significantly affected by the liquid parameters (viscosity, density, range). For instance, the jet range grows as the sprayed liquid density increases [53], whereas the stability of fuel droplets deteriorates and they become more susceptible to destruction as dynamic viscosity decreases [54]. As a result, the number of small droplets increases, which greatly simplifies their further ignition.

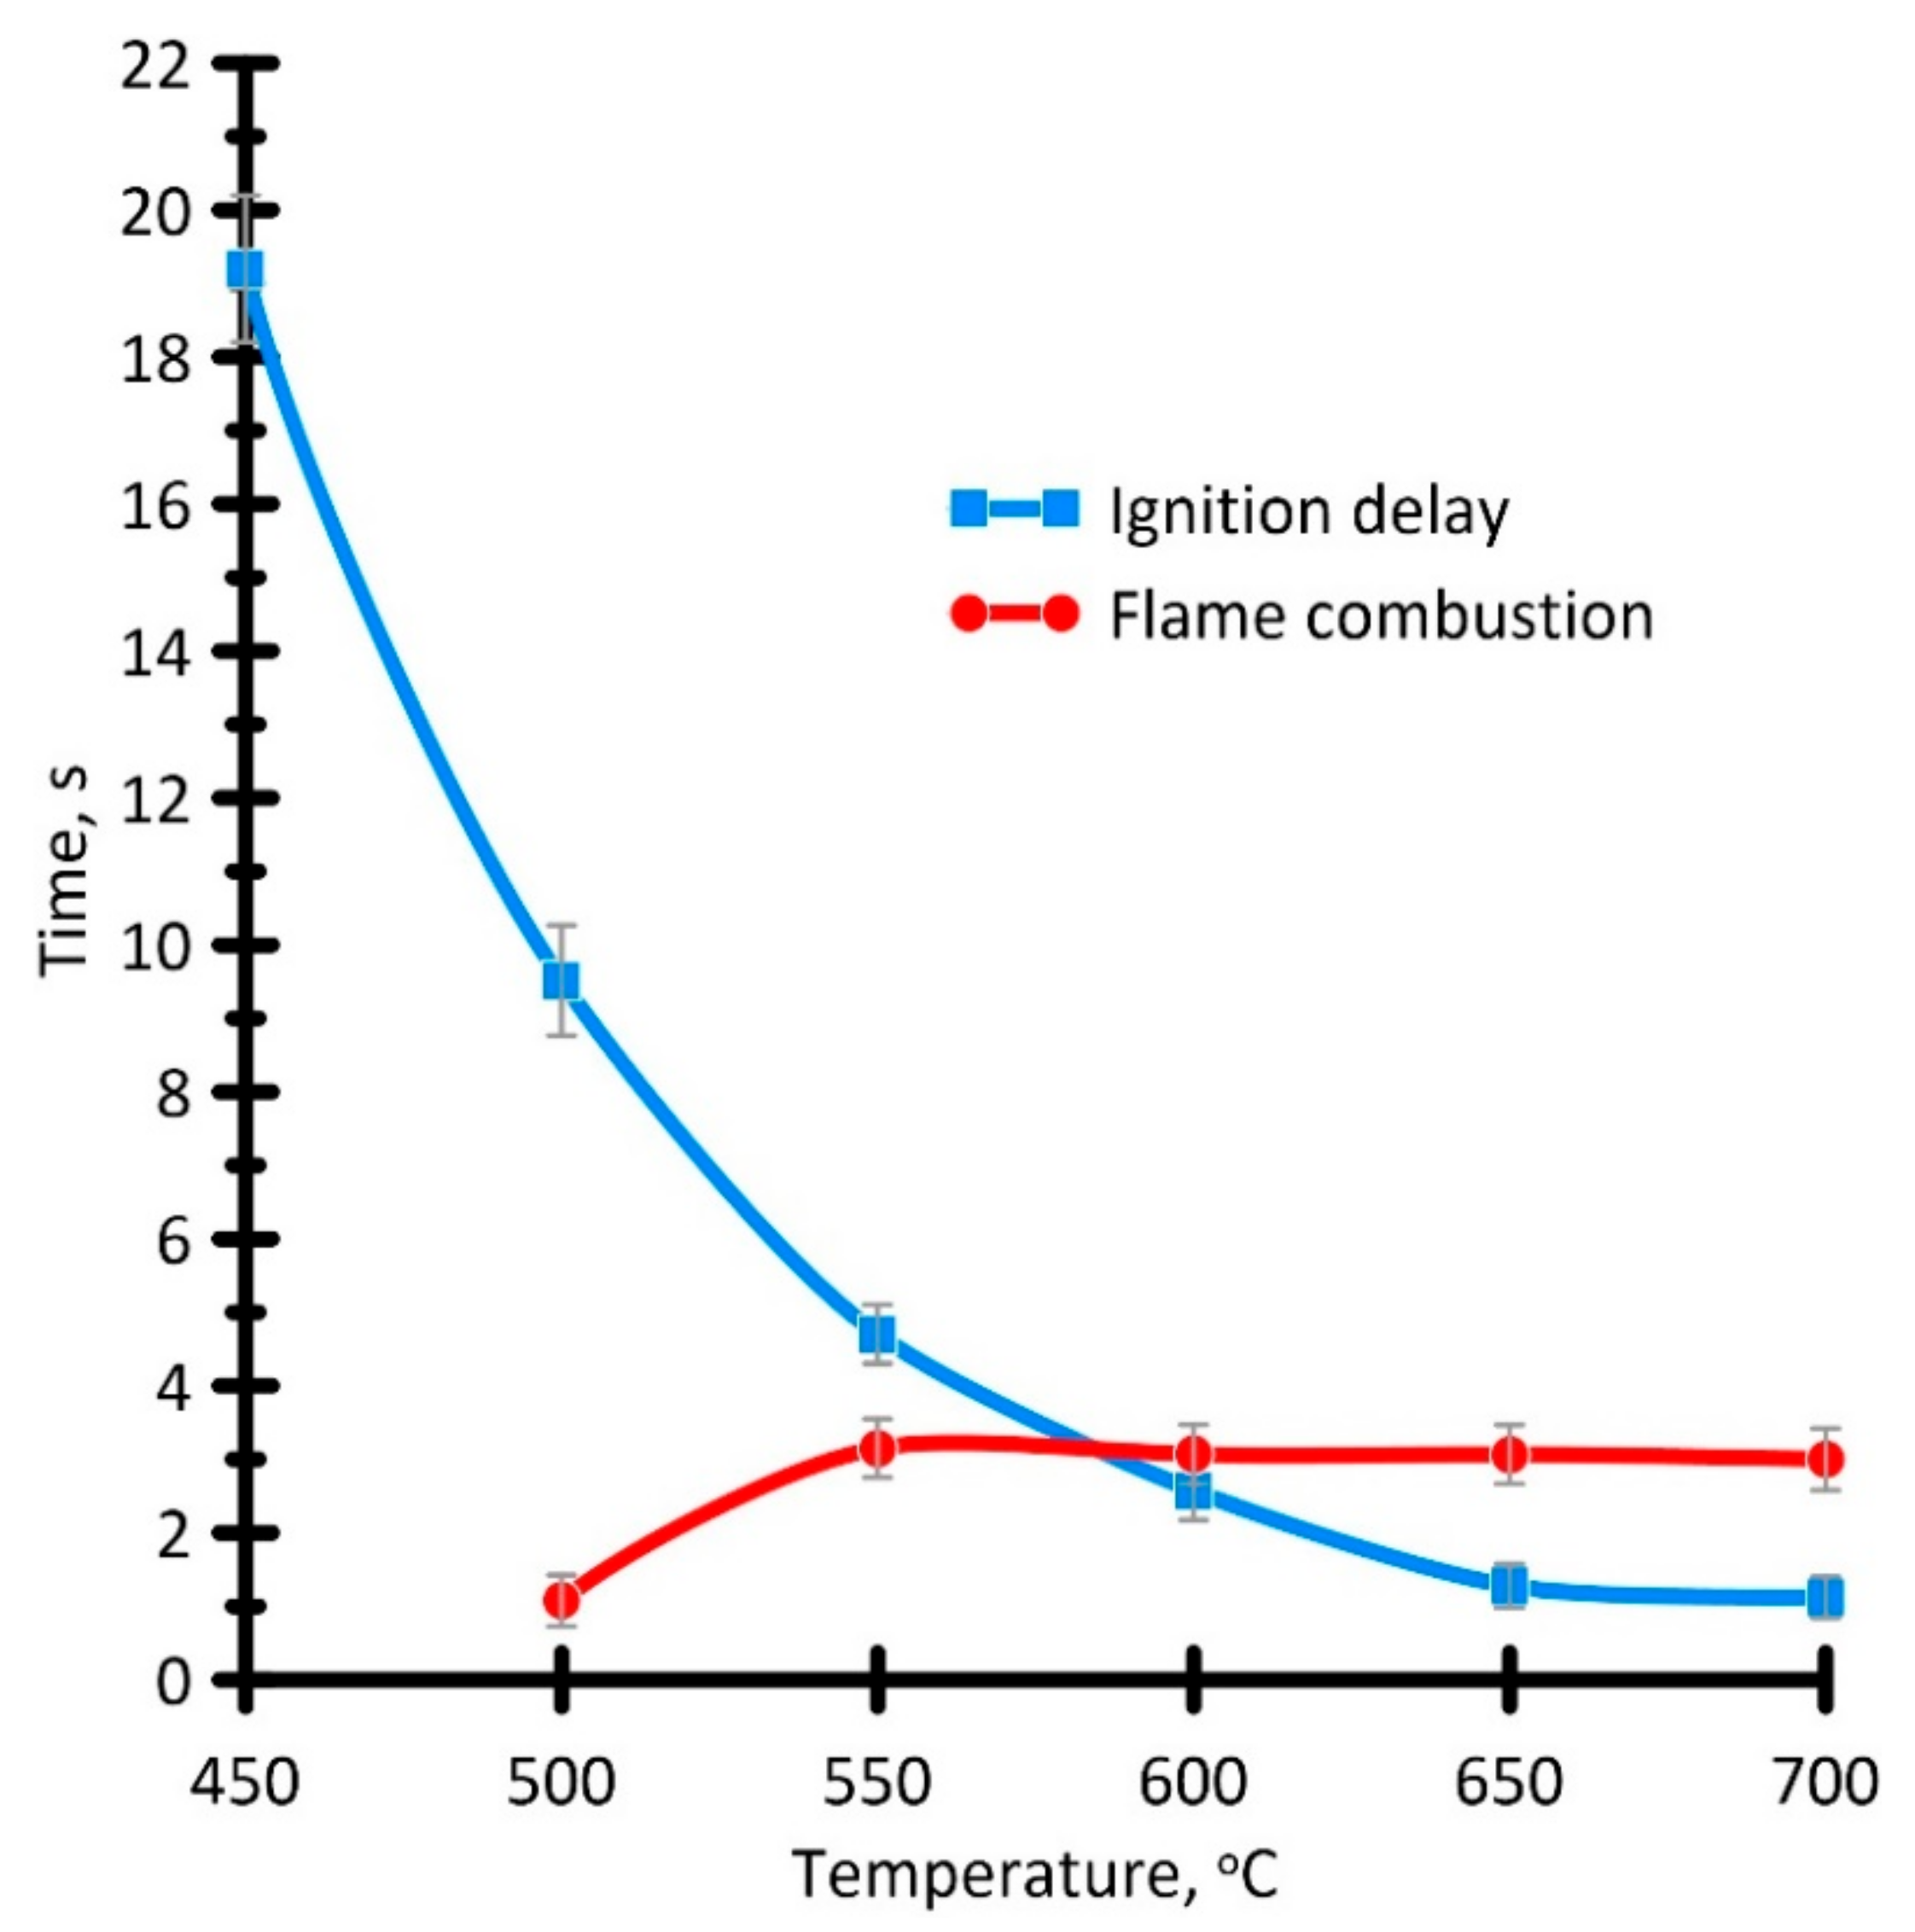
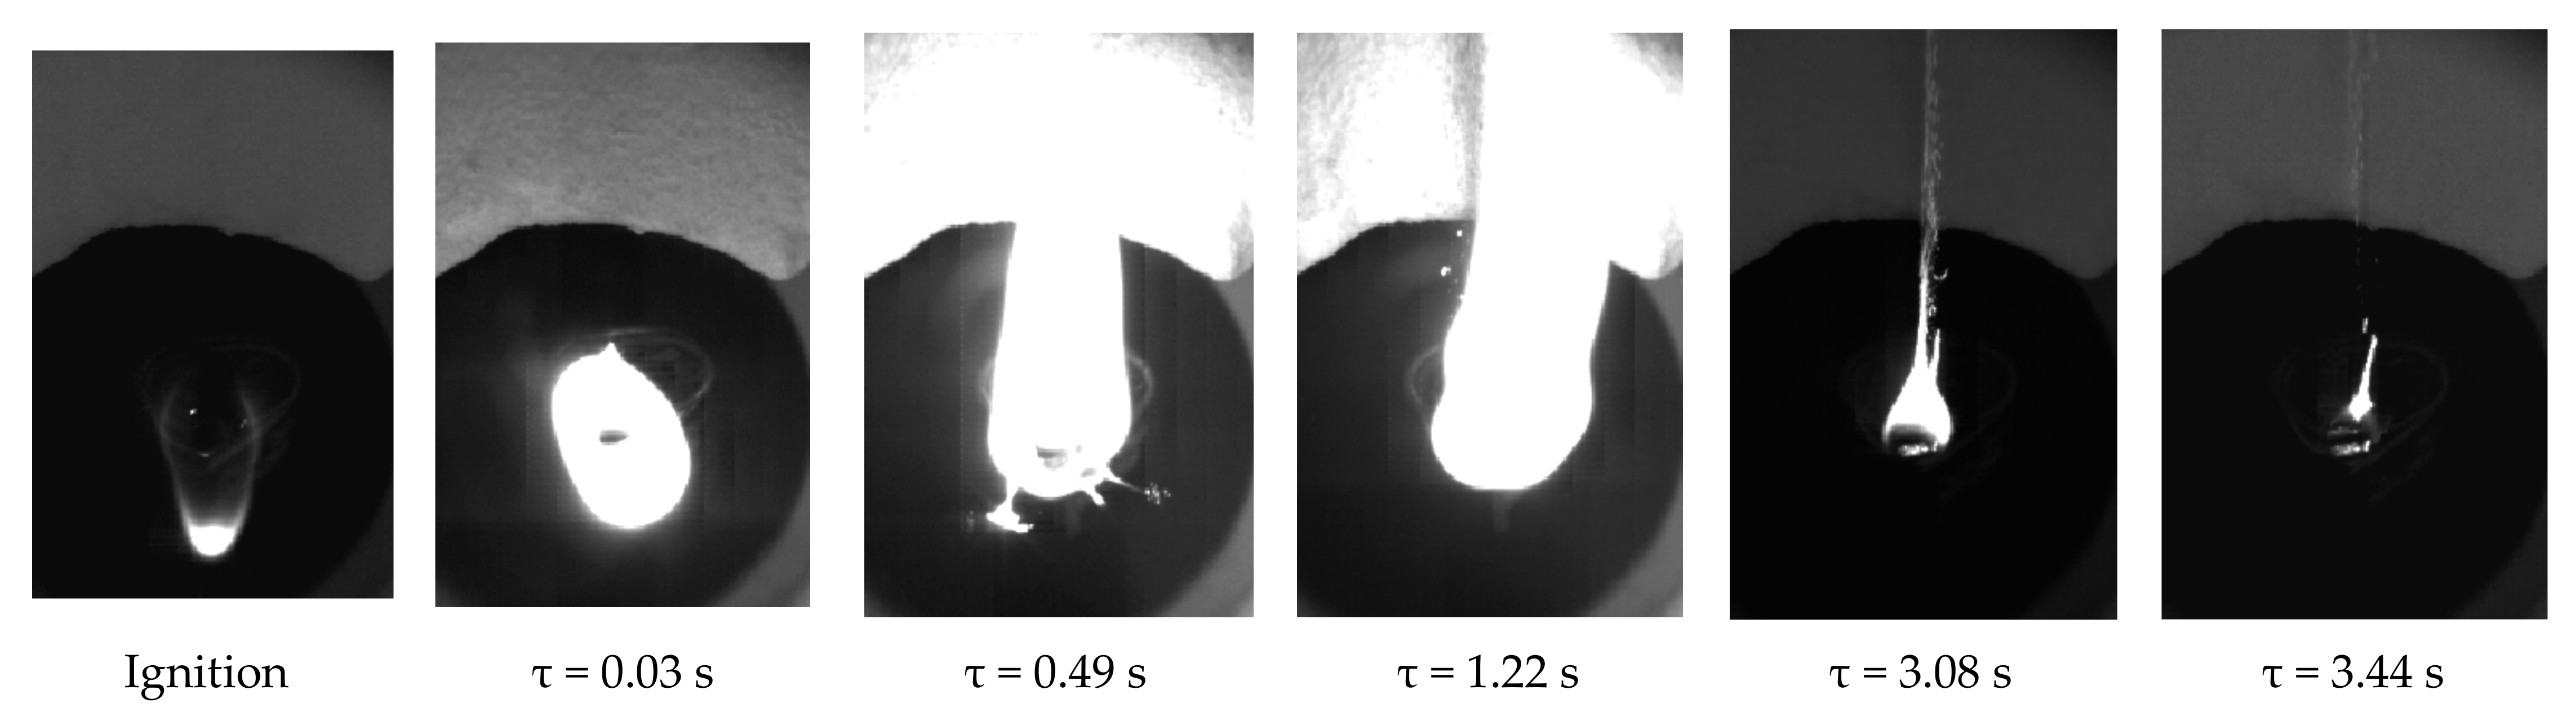
3.3.3. Ignition and Combustion

Figure 12 presents the dependences of the change in the ignition delay time and the flame combustion process of single droplets of the liquid hydrocarbon sample on the air temperature (Tg = 450–700 °C).
The maximum value of the ignition delay time for the liquid hydrocarbon sample was recorded at Tg = 450 °C. At increased air temperature (from 450 °C to 700 °C), the ignition delay time decreased from 19.2 to 1.1 s and exhibited an exponential dependence, which agrees with the results obtained by other authors [55]. It should be noted that at the air temperature ranging from 450 to 550 °C, the ti parameter was observed to decrease more intensively. This may be due to the intensification of vaporization and release of combustible products that induce the gas-phase ignition of the droplet. Starting from Tg = 600 °C, the dynamics of the relative change in the ignition delay time was observed to decrease.
At increased Tg, the combustion time of a single liquid hydrocarbon droplet in the flaming mode, the formation of which was recorded at Tg = 500–700 °C, tends to increase. A sharp increase in the air temperature leads to this effect, which can be explained by the coking of the droplet surface. It hinders the diffusion interaction between the air and the combustible components of liquid hydrocarbons. The obtained dependence of the flame combustion time of liquid hydrocarbons on the increased air temperature agrees with the data reported by other research [19].
Figure 13 presents the results of high-speed video recording (video frames) illustrating ignition and combustion of single hydrocarbon droplets at Tg = 700 °C (Video S1).
The process of droplet ignition and the combustion of liquid hydrocarbons yielded by steam pyrolysis of OS can be divided into several stages. Stage I involved the inert heating of a single droplet. Stage II showed the processes of intense evaporation, formation of volatiles, and the creation of a mixture of combustible gases. Stage III included an intense chemical interaction between combustible components and an oxidizer in a high-temperature gaseous medium. Stage IV involved the heterogeneous combustion of the carbon residue.
During the inert heating (Stage I), the droplet changes in appearance (transition to a matte color) and size along its longitudinal and cross sections, which is due to evaporation of light components of hydrocarbons from the near-surface layers. After inert heating, a vapor cloud with a combustible mixture is formed around the droplet surface (Stage II). The gas-phase ignition of the mixture (Stage III) occurs when the minimum required concentration of hydrocarbon vapors is attained at the appropriate temperature.
After the gas-phase ignition, a flame was observed to gradually develop around the drop, the surface of which changed significantly (Figure 13). This may indicate the primary evaporation of the fuel (light hydrocarbons) from the droplet surface and the subsequent concentration of heavier fuel components, which makes the droplet shell more viscous [56]. An exception was the droplet combustion at the air temperature of 450 °C, which proceeded without the formation of a visible flame in the oxidation (smoldering) mode. The flame formation was recorded at Tg = 500 °C.
The droplet combustion is accompanied by periodic microexplosions and, as a consequence, the deformation of its surface with the separation of smaller fragments (companions) with a size not exceeding 0.2 mm. It should be noted that the epicenters of the formation of microexplosions are both on the surface and in the bulk of the droplet of liquid hydrocarbons. Internal microexplosions are caused by the formation of larger bubbles from microbubbles during vaporization and overheating. Next, the bubbles containing combustible products approach the near-surface layer of the droplet, and after partial rupture or disruption of its structure these products are released from the inner part of the droplet in the form of spark-like satellites.
Figure 13 shows that the combustion front of the droplet expands as the residence time of the droplet in the combustion chamber volume expires. An increased combustion intensity, evidenced by an increased size of the flame and its unstable shape (due to formation of microexplosions), can contribute to the additional heating of the droplet as a whole. In this case, the liquid core of the fuel is retained in the droplet center. The energy released in the gas-phase combustion is sufficient to facilitate hydrocarbon evaporation from the liquid core of the droplet and the propagation of the heterogeneous combustion front from the droplet surface to its center, until the hydrocarbons are burned out.
A cloud of soot of a fibrous structure is formed during the entire flame combustion in the immediate vicinity of the droplet. Under microgravity conditions, the formed soot tends to chaotically move in the combustion chamber volume with subsequent coking in the air.
After the removal of volatile components, the flame combustion stage is completed and the obtained coke residue in the form of soot continues to burn in the heterogeneous mode (Stage IV). Due to the high content of volatile components of liquid hydrocarbons (Figure 9), this stage is quite short and, at the air temperature of Tg = 700 °C, it lasts about 0.5 s.

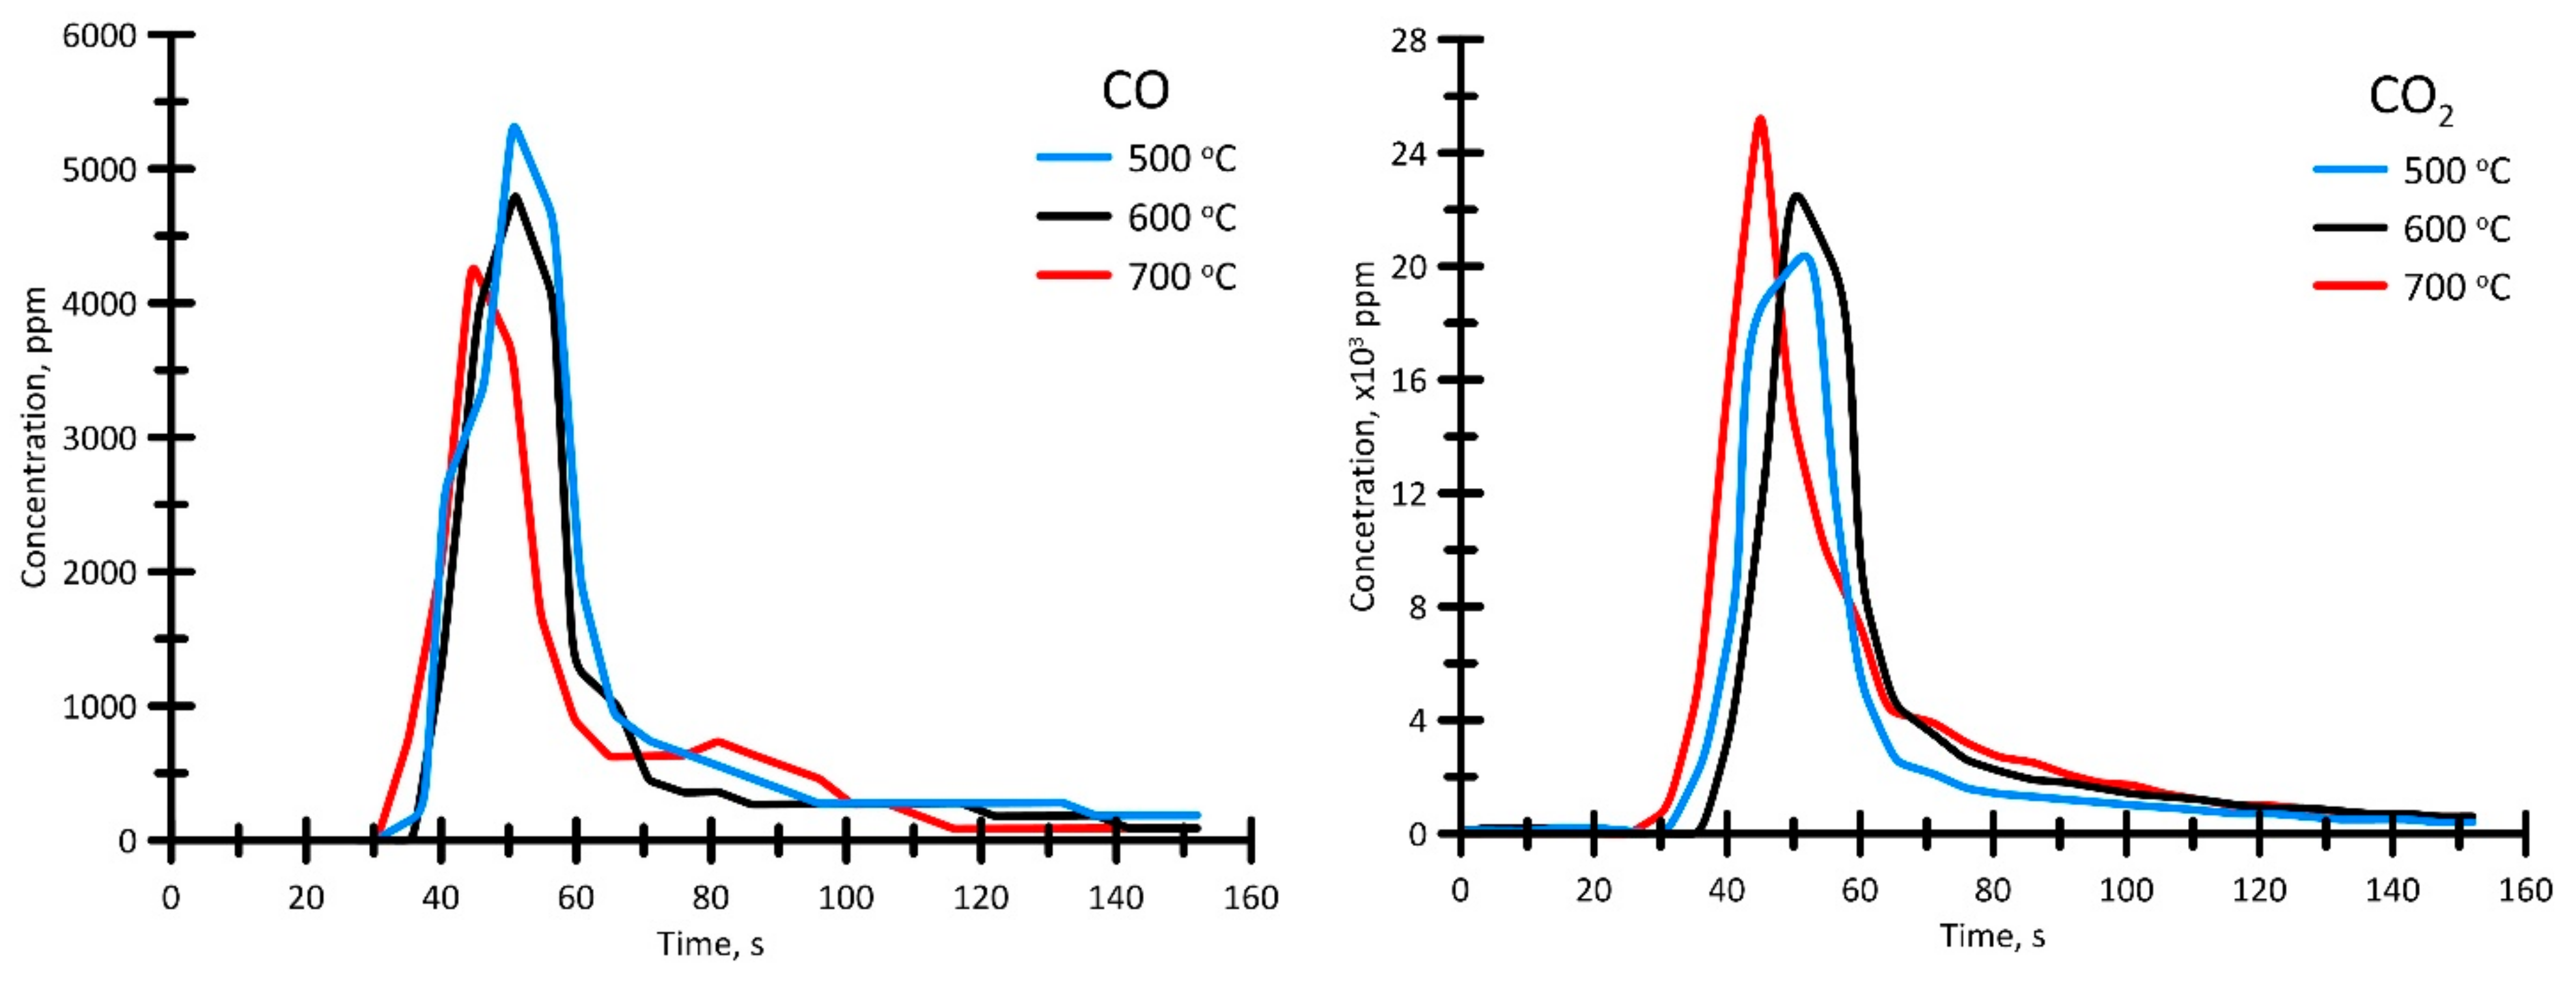
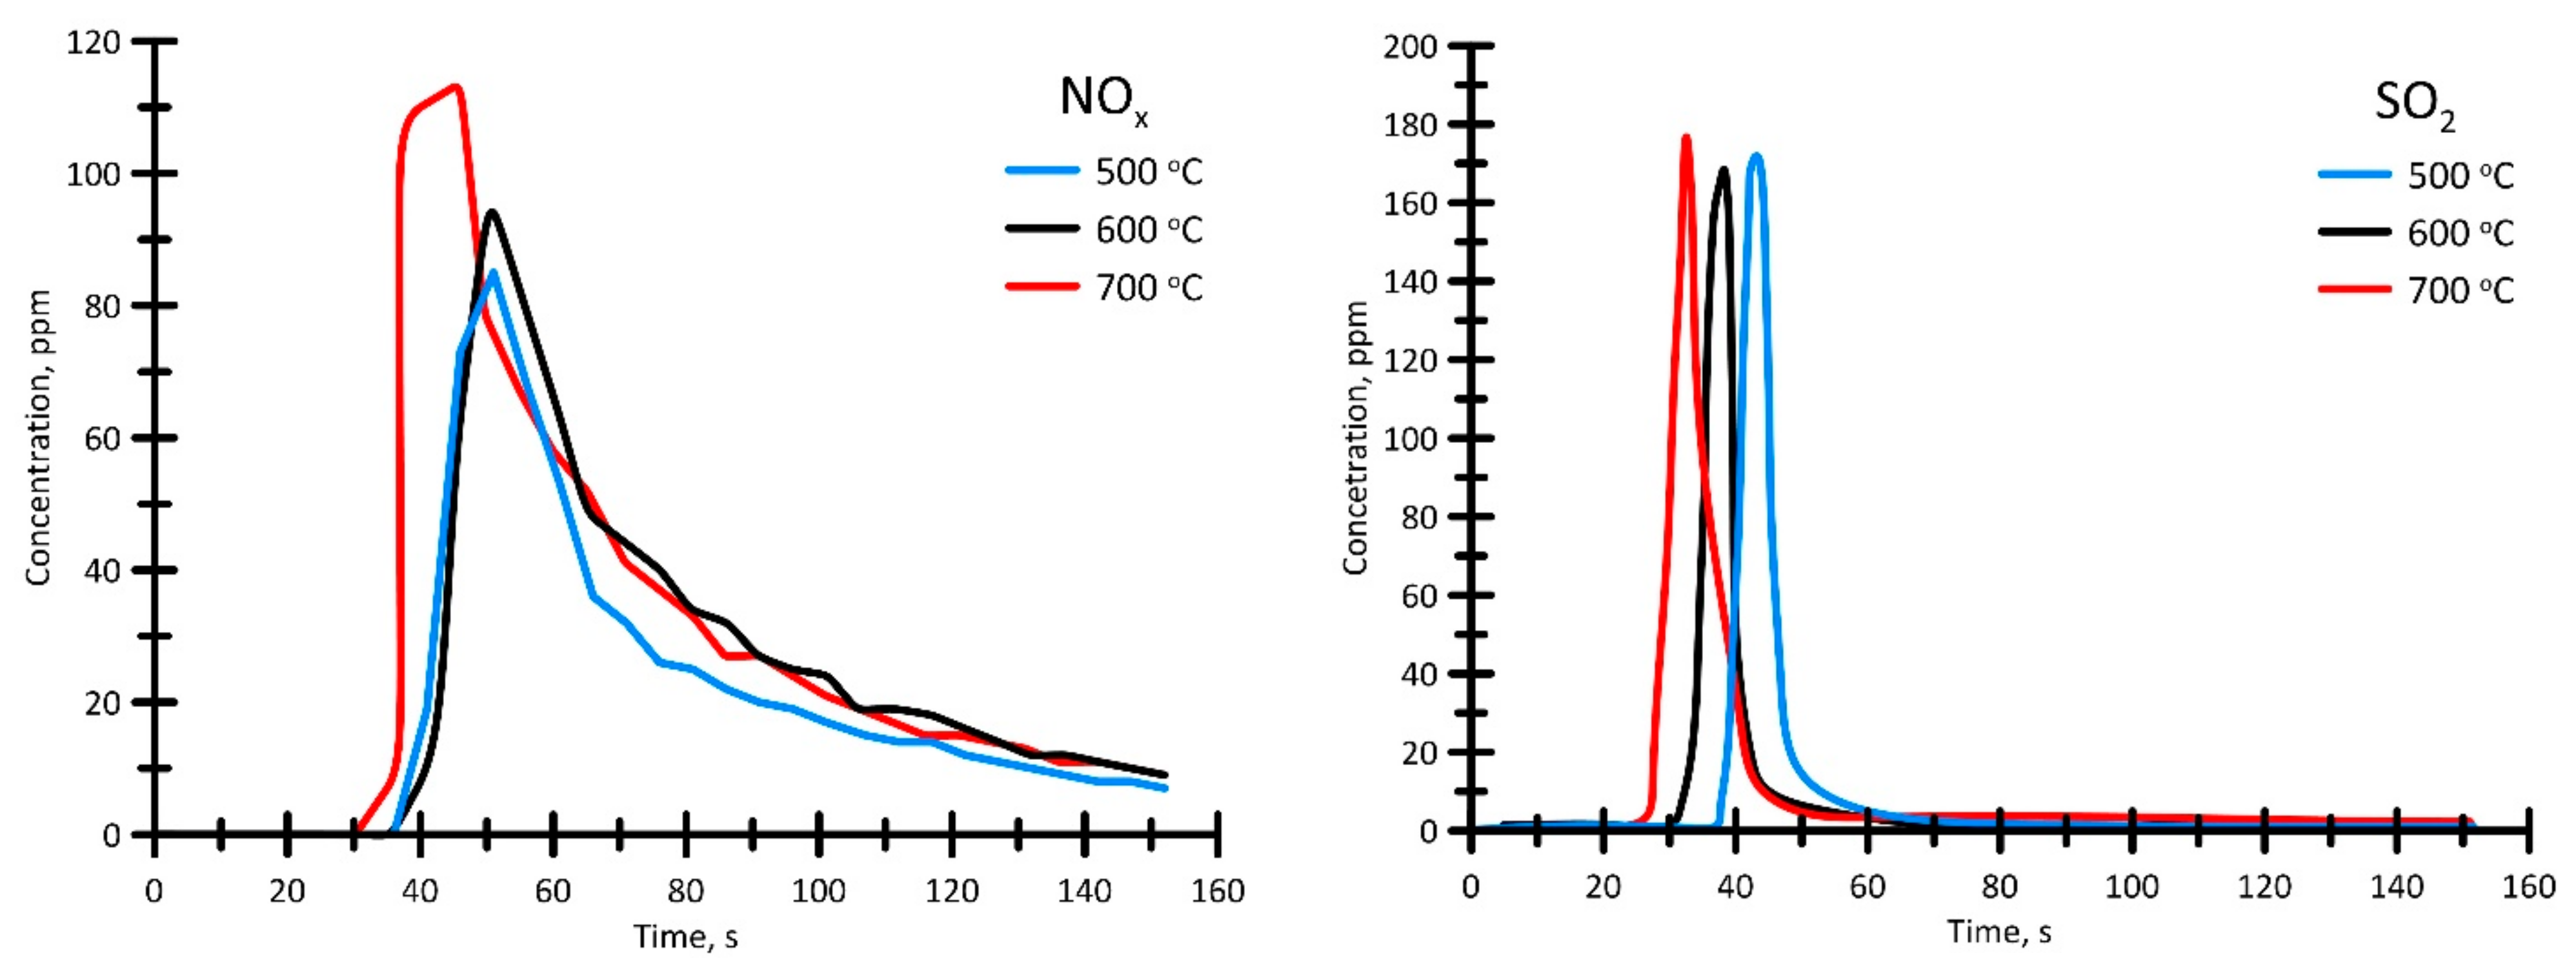
3.3.4. Analysis of Gas-Phase Combustion Products

Figure 14 presents the results of the analysis of gas-phase compounds (CO, CO2, NOx, and SO2) formed during the combustion of liquid hydrocarbon droplets at different air temperatures (Tg = 500–700 °C).
As the air temperature increased from 500 to 700 °C, the intensity of the CO release present in the gas-phase products of liquid hydrocarbon combustion is observed to decrease. This is due to the change in the combustion kinetics (Figure 12) and the oxidation of carbon monoxide to CO2. For carbon dioxide (the main product of hydrocarbon combustion), an inverse relationship is expressed by an increased value of the maximum concentration of CO2 released at an increased Tg. It should be noted that additional CO oxidation can be associated with microexplosions (Figure 13), the frequency of which increases as Tg increases. In particular, this is due to the fact that when liquid fuel is heated, water in microdroplets evaporates first, since it is more volatile than liquid hydrocarbons, which leads to further microexplosions. This occurs at temperatures much higher than the boiling point of water. The dispersion of fuel droplets is favorable for mixing the fuel with the air to intensify the air–fuel interaction. Thus, it enhances the secondary spraying of the fuel during combustion and causes the formation of flammable gases such as CO and H2.
It should be noted that the total time virtually does not change for almost all the recorded compounds at increased temperatures Tg. This is likely due to the constancy of the time interval of the flame combustion in the test liquid hydrocarbon sample (Figure 12).
An increased concentration maximum of NOx released at higher temperatures of the air can be associated with the additional involvement of molecular nitrogen from the air. In this case, the pattern of the profiles that describe SO2 release at increased Tg does not change significantly.

4. Conclusions

Based on the study results, the operation of the pilot OS steam pyrolysis unit was tested to obtain energy-valuable products (liquid hydrocarbons, semi-coke, non-condensable gas-phase compounds, and bitumen) with a subsequent approbation of their physicochemical characteristics.
The results of determining the material balance showed that the main energy products are liquid hydrocarbons (30.4 wt%), non-condensable gas-phase compounds (26.5 wt%), and semi-coke (39.6 wt%). In this case, semi-coke and non-condensable gas-phase compounds are considered as secondary energy carriers for generating thermal energy, which supports the technological process of pyrolysis.
An analysis of non-condensable gas-phase products showed that the dominant compounds are CO (33.5 vol%), CH4 (17.3 vol%), and H2 (15.9 vol%). The CO2 value was 12.6 vol%.
The semi-coke had a high ash (63.7 wt%) and sulfur (1.7 wt%) content and a calorific value of 14.6 MJ/kg. In this case, the ash residue belonged to the medium-melting type (tc > 1250 °C) and mainly consisted of SiO2 (63.4 wt%), Al2O3 (12.1 wt%), and Fe2O3 (10.4 wt%).
The target product—liquid hydrocarbons—had low viscosity and a high content of the light fractions, which was expressed in a relatively low value of the flash point (Tf = 89 °C). The calorific value was 42.6 MJ/kg with a carbon and hydrogen content of 83.4 wt% and 11.4 wt%, respectively. Sulfur content was 0.8 wt%.
During the spraying of liquid hydrocarbons using a pneumatic nozzle, the droplet velocity after spraying decreased by no more than 10%. The value of the jet spraying angle in the process did not exceed 25°. The number of small droplets (no more than 400 µm) increased by 16%, whereas the number of large droplets (more than 600 µm) decreased by 24%.
At the air temperature, Tg increased from 450 to 700 °C and the ignition delay time ti decreased exponentially from 19.2 to 1.1 s. Starting from 500 °C, a flame was observed to form, and its duration increased at increased Tg. At Tg = 450 °C, thermal conversion of the droplet of liquid hydrocarbons occurred in the smoldering mode. Droplet combustion in the temperature range of 600–700 °C was accompanied by the formation of intense microexplosions, which is explained by the high content of light fractions in this fuel composition. In addition, the release of CO, CO2, NOx, and SO2 was recorded during the combustion process. At the same time, the maximum concentrations of the emitted CO2 and NOx compounds increased by an average of 30% with the Tg increase, which is associated with the combustion process intensification.
The obtained results of the study, in view of their applied nature, may be useful in the future for the development of the pyrolysis industry, in particular, for the design of new types of reactors, and installations in general.

Supplementary Materials

The following are available online at https://www.mdpi.com/article/10.3390/app12031012/s1, Video S1: droplet combustion of liquid hydrocarbons at Tg = 700 °C.

Author Contributions

Conceptualization, K.L.; methodology, A.K., D.G., A.Z. and I.B.; formal analysis, K.S.; writing—original draft preparation, K.L., D.G. and M.K.; writing—review and editing, K.L.; visualization, A.K.; project administration, V.G.; funding acquisition, K.L. All authors have read and agreed to the published version of the manuscript.

Funding

The experiments on the characterization of the energy products were carried out with the support of the Ministry of Science and Higher Education of the Russian Federation (project No. 075-00268-20-02 (ID: 0718-2020-0040)), the combustion and spray of the liquid hydrocarbons was realized with financial support according to additional contract No. 075-03-2021-138/3 on subsidy from Russian Federal budget for financial support of governmental task realization for governmental services (internal number 075-GZ/X4141/687/3).

Institutional Review Board Statement

Not applicable.

Informed Consent Statement

Not applicable.

Acknowledgments

The authors express gratitude to the TPU development program.

Conflicts of Interest

The authors declare no conflict of interest.

Nomenclature

OSoil sludge
Tppour point
Tfflash point
tiignition delay time
TGthermogravimetry
DTGderivative thermogravimetry
Pffuel pressure
Paair pressure
PCpersonal computer
NCGnon-condensable gas-phase
Wahumidity
Adash content
Vdafvolatile yield
LHVlower heating value
tcash melting point
Tiinitial temperature
Tefinal temperature
wmaxmaximum reaction rate
Tmaxmaximum temperature
MSmass spectrometry
Tgair temperature

References

  1. IEA. Electricity. Available online: https://www.iea.org/fuels-and-technologies/electricity (accessed on 3 December 2021).
  2. Li, J.; Lin, F.; Xiang, L.; Zheng, F.; Che, L.; Tian, W.; Guo, X.; Yan, B.; Song, Y.; Chen, G. Hazardous elements flow during pyrolysis of oily sludge. J. Hazard. Mater. 2021, 409, 124986. [Google Scholar] [CrossRef] [PubMed]
  3. Zhao, C.; Li, Y.; Gan, Z.; Nie, M. Method of smoldering combustion for refinery oil sludge treatment. J. Hazard. Mater. 2021, 409, 124995. [Google Scholar] [CrossRef]
  4. Castillo Santiago, Y.; Martínez González, A.; Venturini, O.J.; Yepes Maya, D.M. Assessment of the energy recovery potential of oil sludge through gasification aiming electricity generation. Energy 2021, 215, 119210. [Google Scholar] [CrossRef]
  5. Chu, Z.; Gong, Z.; Wang, Z.; Zhang, H.; Wu, J.; Wang, Z.; Guo, Y.; Zhang, J.; Li, G.; Zhang, L.; et al. Experimental study on kinetic characteristics of oil sludge gasification. Asia-Pacific J. Chem. Eng. 2021, 16, e2616. [Google Scholar] [CrossRef]
  6. Wang, Z.; Gong, Z.; Wang, Z.; Li, X.; Chu, Z. Application and development of pyrolysis technology in petroleum oily sludge treatment. Environ. Eng. Res. 2021, 26, 1–15. [Google Scholar] [CrossRef]
  7. Shao, Z.; Ma, Y.; Wang, B.; He, L.; Zhang, Z.; Yue, C. Study of pyrolysis and combustion kinetics of oil sludge. Energy Sources Part A Recovery Util. Environ. Eff. 2021. [Google Scholar] [CrossRef]
  8. Mazlova, E.A.; Meshcheryakov, S.V. Ecological characteristics of oil sludges. Chem. Technol. Fuels Oils 1999, 35, 49–53. [Google Scholar] [CrossRef]
  9. Da Silva, L.J.; Alves, F.C.; De França, F.P. A review of the technological solutions for the treatment of oily sludges from petroleum refineries. Waste Manag. Res. 2012, 30, 1016–1030. [Google Scholar] [CrossRef]
  10. Zhou, L.; Jiang, X.; Liu, J. Characteristics of oily sludge combustion in circulating fluidized beds. J. Hazard. Mater. 2009, 170, 175–179. [Google Scholar] [CrossRef]
  11. Chen, G.-B.; Li, J.-W.; Lin, H.-T.; Wu, F.-H.; Chao, Y.-C. A Study of the Production and Combustion Characteristics of Pyrolytic Oil from Sewage Sludge Using the Taguchi Method. Energies 2018, 11, 2260. [Google Scholar] [CrossRef] [Green Version]
  12. Lin, B.; Huang, Q.; Ali, M.; Wang, F.; Chi, Y.; Yan, J. Continuous catalytic pyrolysis of oily sludge using U-shape reactor for producing saturates-enriched light oil. Proc. Combust. Inst. 2019, 37, 3101–3108. [Google Scholar] [CrossRef]
  13. Gong, Z.; Du, A.; Wang, Z.; Fang, P.; Li, X. Experimental Study on Pyrolysis Characteristics of Oil Sludge with a Tube Furnace Reactor. Energy Fuels 2017, 31, 8102–8108. [Google Scholar] [CrossRef]
  14. Milhé, M.; van de Steene, L.; Haube, M.; Commandré, J.-M.; Fassinou, W.-F.; Flamant, G. Autothermal and allothermal pyrolysis in a continuous fixed bed reactor. J. Anal. Appl. Pyrolysis 2013, 103, 102–111. [Google Scholar] [CrossRef]
  15. Kankia, M.U.; Baloo, L.; Danlami, N.; Samahani, W.N.; Mohammed, B.S.; Haruna, S.; Jagaba, A.H.; Abubakar, M.; Ishak, E.A.; Sayed, K.; et al. Optimization of Cement-Based Mortar Containing Oily Sludge Ash by Response Surface Methodology. Materials 2021, 14, 6308. [Google Scholar] [CrossRef] [PubMed]
  16. Kankia, M.U.; Baloo, L.; Mohammed, B.S.; Suhaimi, B.H.; Ishak, E.A.; Zango, U.Z. Review of petroleum sludge thermal treatment and utilization of ash as a construction material, a way to environmental sustainability. Int. J. Adv. Appl. Sci. 2020, 7, 68–81. [Google Scholar] [CrossRef]
  17. Moulin, L.; Da Silva, S.; Bounaceur, A.; Herbolt, M.; Soudais, Y. Assessment of Recovered Carbon Black Obtained by Waste Tires Steam Water Thermolysis: An Industrial Application. Waste Biomass Valor. 2017, 8, 2757–2770. [Google Scholar] [CrossRef] [Green Version]
  18. Li, Q.; Li, F.; Meng, A.; Tan, Z.; Zhang, Y. Thermolysis of scrap tire and rubber in sub/super-critical water. Waste Manag. 2018, 71, 311–319. [Google Scholar] [CrossRef] [PubMed]
  19. Larionov, K.B.; Slyusarskiy, K.V.; Kirgina, M.V.; Gvozdyakov, D.V.; Bogdanov, I.A.; Zenkov, A.V.; Yankovsky, S.A.; Gubin, V.E. Liquid Hydrocarbons Production by the Steam Pyrolysis of Used Tires: Energy Characteristics and Environmental Sustainability. Waste Biomass Valorization 2021. [Google Scholar] [CrossRef]
  20. Mei, Z.; Chen, D.; Zhang, J.; Yin, L.; Huang, Z.; Xin, Q. Sewage sludge pyrolysis coupled with self-supplied steam reforming for high quality syngas production and the influence of initial moisture content. Waste Manag. 2020, 106, 77–87. [Google Scholar] [CrossRef]
  21. Häring, H.-W. Hydrogen and Carbon Monoxide: Synthesis Gases. In Industrial Gases Processing; Wiley-VCH Verlag GmbH & Co. KGaA: Weinheim, Germany, 2008; pp. 135–184. [Google Scholar]
  22. Avbenake, O.P.; Yakasai, F.I.; Jibril, B.Y. Sustainability Effect of Water Gas Shift Reaction (Syngas) in Catalytic Upgrading of Heavy Crude Oil and Bitumen. In Sustainable Alternative Syngas Fuel; IntechOpen Limited: London, UK, 2019. [Google Scholar]
  23. Chimpae, S.; Wongsakulphasatch, S.; Vivanpatarakij, S.; Glinrun, T.; Wiwatwongwana, F.; Maneeprakorn, W.; Assabumrungrat, S. Syngas Production from Combined Steam Gasification of Biochar and a Sorption-Enhanced Water–Gas Shift Reaction with the Utilization of CO2. Processes 2019, 7, 349. [Google Scholar] [CrossRef] [Green Version]
  24. Efika, C.E.; Wu, C.; Williams, P.T. Syngas production from pyrolysis–catalytic steam reforming of waste biomass in a continuous screw kiln reactor. J. Anal. Appl. Pyrolysis 2012, 95, 87–94. [Google Scholar] [CrossRef]
  25. Motlagh, A.H.; Klyuev, S.V.; Surendar, A.; Ibatova, A.Z.; Maseleno, A. Catalytic gasification of oil sludge with calcined dolomite. Pet. Sci. Technol. 2018, 36, 1998–2002. [Google Scholar] [CrossRef]
  26. Gao, N.; Kamran, K.; Quan, C.; Williams, P.T. Thermochemical conversion of sewage sludge: A critical review. Prog. Energy Combust. Sci. 2020, 79, 100843. [Google Scholar] [CrossRef]
  27. Anufriev, I.S.; Shadrin, E.Y.; Kopyev, E.P.; Alekseenko, S.V.; Sharypov, O.V. Study of liquid hydrocarbons atomization by supersonic air or steam jet. Appl. Therm. Eng. 2019, 163, 114400. [Google Scholar] [CrossRef]
  28. Volkov, R.S.; Zabelin, M.V.; Strizhak, P.A. On The Laws of Liquid Drop Deformation in Gas Flows. Chem. Pet. Eng. 2016, 52, 85–89. [Google Scholar] [CrossRef]
  29. Mahmoudi, A.H.; Pozarlik, A.K.; van der Weide, E.; Kersten, S.R.A.; Luding, S.; Brem, G. Effect of char on the combustion process of multicomponent bio-fuel. Chem. Eng. Sci. 2018, 175, 286–295. [Google Scholar] [CrossRef]
  30. Akinbomi, J.G.; Asifat, S.O.; Ajao, A.; Oladeji, O. Asphalt Making Potential of Pyrolytic Bitumen from Waste Rubber Tyres: An Adaptive Measure to Climate Change. In Handbook of Climate Change Resilience; Springer International Publishing: Berlin/Heidelberg, Germany, 2019; pp. 1–15. [Google Scholar]
  31. Gao, N.; Jia, X.; Gao, G.; Ma, Z.; Quan, C.; Naqvi, S.R. Modeling and simulation of coupled pyrolysis and gasification of oily sludge in a rotary kiln. Fuel 2020, 279, 118152. [Google Scholar] [CrossRef]
  32. Zhao, R.; Qin, J.; Chen, T.; Wang, L.; Wu, J. Experimental study on co-combustion of low rank coal semicoke and oil sludge by TG-FTIR. Waste Manag. 2020, 116, 91–99. [Google Scholar] [CrossRef] [PubMed]
  33. Upadhyay, D.S.; Khosla, A.; Chaudhary, A.; Patel, R.N. Effect of catalyst to lignite ratio on the performance of a pilot scale fixed bed gasifier. Energy 2019, 189, 116229. [Google Scholar] [CrossRef]
  34. Larionov, K.B.; Yankovsky, S.A.; Gubin, V.E.; Slyusarskiy, K.V.; Ulko, A.A.; Gasparian, G.D. Production of Briquetted Semicoke from Wood Waste by Multistep Low-Temperature Pyrolysis. Coke Chem. 2020, 63, 592–598. [Google Scholar] [CrossRef]
  35. Kuznetsov, G.V.; Yankovskii, S.A.; Tolokol’nikov, A.A.; Cherednik, I.V. Mechanism of the Suppression of Sulfur Oxides in the Oxidative Thermolysis Products of Coals upon Their Combustion in a Mixture with Dispersed Wood. Solid Fuel Chem. 2020, 54, 311–317. [Google Scholar] [CrossRef]
  36. Čepić, Z.; Mihajlović, V.; Đurić, S.; Milotić, M.; Stošić, M.; Stepanov, B.; Ilić Mićunović, M. Experimental Analysis of Temperature Influence on Waste Tire Pyrolysis. Energies 2021, 14, 5403. [Google Scholar] [CrossRef]
  37. Singh, R.K.; Ruj, B.; Sadhukhan, A.K.; Gupta, P.; Tigga, V.P. Waste plastic to pyrolytic oil and its utilization in CI engine: Performance analysis and combustion characteristics. Fuel 2020, 262, 116539. [Google Scholar] [CrossRef]
  38. Williams, P.T. Pyrolysis of waste tyres: A review. Waste Manag. 2013, 33, 1714–1728. [Google Scholar] [CrossRef] [PubMed] [Green Version]
  39. Osayi, J.I.; Iyuke, S.; Daramola, M.O.; Osifo, P.; Van Der Walt, I.J.; Ogbeide, S.E. Evaluation of pyrolytic oil from used tires and natural rubber (Hevea brasiliensis). Chem. Eng. Commun. 2018, 205, 805–821. [Google Scholar] [CrossRef]
  40. Larionov, K.B.; Slyusarskiy, K.V.; Tsibulskiy, S.A.; Kaltaev, A.Z.; Berezikov, N.I.; Gorshkov, A.S.; Lavrinenko, S.V.; Gubin, V.E. Activation of Anthracite Combustion Using Pyrolysis Oil from Thermal Conversion of Waste Car Tires. ACS Omega 2021, 6, 19731–19739. [Google Scholar] [CrossRef] [PubMed]
  41. Hou, S.-S.; Rizal, F.M.; Lin, T.-H.; Yang, T.-Y.; Wan, H.-P. Microexplosion and ignition of droplets of fuel oil/bio-oil (derived from lauan wood) blends. Fuel 2013, 113, 31–42. [Google Scholar] [CrossRef]
  42. Ocampo-Barrera, R.; Villasenor, R.; Diego-Marin, A. An experimental study of the effect of water content on combustion of heavy fuel oil/water emulsion droplets. Combust. Flame 2001, 126, 1845–1855. [Google Scholar] [CrossRef]
  43. Mikulski, M.; Ambrosewicz-Walacik, M.; Hunicz, J.; Nitkiewicz, S. Combustion engine applications of waste tyre pyrolytic oil. Prog. Energy Combust. Sci. 2021, 85, 100915. [Google Scholar] [CrossRef]
  44. Yaqoob, H.; Teoh, Y.H.; Jamil, M.A.; Gulzar, M. Potential of tire pyrolysis oil as an alternate fuel for diesel engines: A review. J. Energy Inst. 2021, 96, 205–221. [Google Scholar] [CrossRef]
  45. Erdogan, S. Recycling of Waste Plastics into Pyrolytic Fuels and Their Use in IC Engines. In Sustainable Mobility; IntechOpen: London, UK, 2020. [Google Scholar]
  46. Ramirez-Canon, A.; Muñoz-Camelo, Y.; Singh, P. Decomposition of Used Tyre Rubber by Pyrolysis: Enhancement of the Physical Properties of the Liquid Fraction Using a Hydrogen Stream. Environments 2018, 5, 72. [Google Scholar] [CrossRef] [Green Version]
  47. Tipler, S.; Mergulhão, C.S.; Vanhove, G.; Van Haute, Q.; Contino, F.; Coussement, A. Ignition Study of an Oxygenated and High-Alkene Light Petroleum Fraction Produced from Automotive Shredder Residues. Energy Fuels 2019, 33, 5664–5672. [Google Scholar] [CrossRef] [Green Version]
  48. Viswanathan, B. Petroleum. In Energy Sources; Elsevier: Amsterdam, The Netherlands, 2017; pp. 29–57. [Google Scholar]
  49. Shin, J.; Kim, D.; Seo, J.; Park, S. Effects of the physical properties of fuel on spray characteristics from a gas turbine nozzle. Energy 2020, 205, 118090. [Google Scholar] [CrossRef]
  50. Shlegel, N.E.; Tkachenko, P.P.; Strizhak, P.A. Influence of viscosity, surface and interfacial tensions on the liquid droplet collisions. Chem. Eng. Sci. 2020, 220, 115639. [Google Scholar] [CrossRef]
  51. Ju, D.; Sun, X.; Jia, X.; Huang, Z.; Qiao, X.; Han, D.; Huang, Z. Experimental investigation of the atomization behavior of ethanol and kerosene in acoustic fields. Fuel 2017, 202, 613–619. [Google Scholar] [CrossRef]
  52. Zhao, Y.; He, X.; Li, M.; Yao, K. Experimental investigation on spray characteristics of aircraft kerosene with an external-mixing atomizer. Fuel Process. Technol. 2020, 209, 106531. [Google Scholar] [CrossRef]
  53. Li, B.; Wang, Y.; Long, W.; Zhu, J.; Tian, J.; Cui, J.; Wang, Y. Experimental research on the effects of kerosene on the pre-injection spray characteristics and engine performance of dual-direct injection diesel Jet Controlled Compression Ignition mode. Fuel 2020, 281, 118691. [Google Scholar] [CrossRef]
  54. Kook, S.; Pickett, L.M. Liquid length and vapor penetration of conventional, Fischer–Tropsch, coal-derived, and surrogate fuel sprays at high-temperature and high-pressure ambient conditions. Fuel 2012, 93, 539–548. [Google Scholar] [CrossRef]
  55. Pinchuk, V.A.; Sharabura, T.A.; Kuzmin, A.V.; Pinchuk, S.A. Engineering equations for determining coal-water fuel combustion stages. J. Energy Inst. 2020, 93, 1924–1933. [Google Scholar] [CrossRef]
  56. Wang, C.H.; Liu, X.Q.; Law, C.K. Combustion and microexplosion of freely falling multicomponent droplets. Combust. Flame 1984, 56, 175–197. [Google Scholar] [CrossRef]
Figure 1. Methods structure of the study.
Applsci 12 01012 g001
Figure 2. Setup for steam pyrolysis of OS: 1—loading unit, 2—reactor, 3—steam boiler, 4—fuel storage tank, 5—emergency combustion system, 6—stage I of steam–gas product condensation, 7—stage II of steam–gas product condensation, 8—accumulator of condensed products (water), 9—scrubber, 10—discharging loader for solid-phase products.
Applsci 12 01012 g002
Figure 3. Schematic diagram of the experimental setup for liquid fuel spray recording.
Applsci 12 01012 g003
Figure 4. Scheme of the pneumatic injector.
Applsci 12 01012 g004
Figure 5. Experimental setup for studying droplet combustion of liquid hydrocarbons.
Applsci 12 01012 g005
Figure 6. (a) Material balance of the products yielded by steam pyrolysis of OS and (b) the composition of non-condensable gas-phase (NCG) compounds.
Applsci 12 01012 g006
Figure 7. Micrograph of the semi-coke sample.
Applsci 12 01012 g007
Figure 8. TG, DTG, and MS data for thermal conversion of the semi-coke sample in oxidizing (air) and inert (argon) atmosphere. Heating rate is 10 °C/min, gas flow rate is 150 ml/min, sample weight is ≈15 mg.
Applsci 12 01012 g008
Figure 9. TG and DTG curves for evaporation and thermal decomposition of liquid hydrocarbon samples. Medium—argon 150 ml/min, heating rate—10 °C/min, sample weight ≈ 15 mg.
Applsci 12 01012 g009
Figure 10. Change in the velocity of liquid hydrocarbon droplets along the longitudinal axis.
Applsci 12 01012 g010
Figure 11. The jet spraying angle of liquid hydrocarbons.
Applsci 12 01012 g011
Figure 12. Dependences of the ignition delay and flame combustion time of single droplets of the liquid hydrocarbon sample on the air temperature of 450–700 °C.
Applsci 12 01012 g012
Figure 13. Video frames of the drop ignition and subsequent combustion of liquid hydrocarbons at Tg = 700 °C.
Applsci 12 01012 g013
Figure 14. Concentration profiles of the release of gas-phase compounds CO, CO2, NOx, and SO2 formed in the combustion of liquid hydrocarbon droplets at Tg = 500–700 °C.
Applsci 12 01012 g014aApplsci 12 01012 g014b
Table 1. Values of geometric characteristics.
ParameterValue, mm
Nozzle outer diameter d120
Fuel inlet channel diameter d28
Air inlet channel diameter d34
Height of the annular gap d42
Nozzle outlet diameter d52.5
Table 2. Physical and chemical characteristics of semi-coke.
ParameterValue
Humidity Wa, wt%0.8
Ash content Ad, wt%63.7
Volatile yield Vdaf, wt%62.7
Heating value LHV, MJ/kg14.6
Elemental compositiond, wt%
C25.3
H2.0
N0.3
S1.7
O1.0
Elemental composition of the ash residued, %
SiO263,4
Al2O312.1
Fe2O310.4
SO32.4
CaO4.7
MgO2.9
K2O + Na2O4.1
Indices: a—analytical mass of the sample, d—dry basis of the sample, daf—dry ash-free basis of the sample.
Table 3. Physicochemical characteristics of liquid hydrocarbons obtained after OS steam pyrolysis in comparison with other types of similar fuels.
ParameterValue
Test SampleFuel Oil [19]Pyrolysis Oil from Tires at 500 °C (in Steam Environment) [19]Classic Pyrolysis Oil from Tires at 500 °C [36]Pyrolysis Oil from Plastic at 500 °C [37]
Density, kg/m3
At 15 °C884.2950.6928.9937734
At 20 °C880.7----
At 40 °C866.7----
Dynamic viscosity, mPa·s
At 15 °C13.6----
At 20 °C10.1----
At 40 °C4.9545.79.7--
Kinematic viscosity, mm2/s
At 15 °C15.4----
At 20 °C11.5----
At 40 °C5.6583.710.64.72.9
Pour point Tp, °C510−52−11−3
Flash point Tf, °C89175823146
Water content, %0.20.20.7--
Ash content, %tracestracestraces-<1.0
pH6.86.86.0--
Surface tension, mN/m31.2----
Lower heating value LHV, MJ/kg42.643.943.342.441.3
Fractional composition
10 vol.%41 °C----
20 vol.%125 °C----
30 vol.%188 °C----
40 vol.%243 °C----
50 vol.%307 °C----
60 vol.%336 °C----
70 vol.%360 °C----
Elemental composition, wt.%
C83.487.886.285.4-
H11.49.911.010.1-
N-0.20.61.2-
S0.81.80.80.5-
O4.40.31.42.8-
H/C1.641.41.51.4-
O/C0.04-0.010.02-
Publisher’s Note: MDPI stays neutral with regard to jurisdictional claims in published maps and institutional affiliations.

