Article

A Study on High-Speed Outlier Detection Method of Network Abnormal Behavior Data Using Heterogeneous Multiple Classifiers

1
Illinois Institute of Technology, Chicago, IL 60616, USA
2
Department of Computer Science and Engineering, Seoul National University of Science and Technology, Seoul 01811, Korea
*
Author to whom correspondence should be addressed.
Appl. Sci. 2022, 12(3), 1011; https://doi.org/10.3390/app12031011
Submission received: 8 November 2021 / Revised: 12 January 2022 / Accepted: 13 January 2022 / Published: 19 January 2022

Abstract

:
As the complexity and scale of the network environment increase continuously, various methods to detect attacks and intrusions from network traffic by classifying normal and abnormal network behaviors show their limitations. The number of network traffic signatures is increasing exponentially to the extent that semi-realtime detection is not possible. However, machine learning-based intrusion detection only gives simple guidelines as simple contents of security events. This is why security data for a specific environment cannot be configured due to data noise, diversification, and continuous alteration of a system and network environments. Although machine learning is performed and evaluated using a generalized data set, its performance is expected to be similar in that specific network environment only. In this study, we propose a high-speed outlier detection method for a network dataset to customize the dataset in real-time for a continuously changing network environment. The proposed method uses an ensemble-based noise data filtering model using the voting results of 6 classifiers (decision tree, random forest, support vector machine, naive Bayes, k-nearest neighbors, and logistic regression) to reflect the distribution and various environmental characteristics of datasets. Moreover, to prove the performance of the proposed method, we experimented with the accuracy of attack detection by gradually reducing the noise data in the time series dataset. As a result of the experiment, the proposed method maintains a training dataset of a size capable of semi-real-time learning, which is 10% of the total training dataset, and at the same time, shows the same level of accuracy as a detection model using a large training dataset. The improved research results would be the basis for automatic tuning of network datasets and machine learning that can be applied to special-purpose environments and devices such as ICS environments.

1. Introduction

With information and communication technology development, various services and computing environments are interconnected to create higher value. Today’s network computing environment expanded with paradigms such as 5G, and the Internet of Things(IoT) has reached a very high complexity and scale. Thus, network data has already reached a level where the amount and bandwidth cannot be processed in real-time, leading to new physical and technical challenges that existing security systems and services must solve [1,2].
On the other hand, attacks on networks gradually diversify the patterns and forms of attacks by actively using the complex network characteristics [3]. As the types of communication protocols and services constituting the network are diversified, it is becoming easier to modify existing attack techniques and apply them to a new environment that could be classified as unknown attacks [4]. Furthermore, attackers on a wide area or a targeted attack on a specific area using this expanding attack vector as well [5]. Therefore, these types of attacks are the most urgent threat to modern security systems [6,7].
A common method to respond to sophisticated cyber-attacks is to predict and detect attacks through machine learning or artificial intelligence inference. Many solutions and techniques adopt machine learning methodologies [8]. The Intrusion Detection System (IDS) is the most basic and universal means to protect the network environment. IDS collects various types of data from network traffic to identify and observe user behavior and uses it to detect abnormal behavior [9]. However, existing machine learning-based security systems inevitably have to learn the data, which is directly related to the problems of the size and complexity of data. An attack on the network essentially requires an immediate or preemptive response in terms of availability [10]. Nowadays, the computing environment and the amount of data collected are beyond what can be processed in real-time. Due to this, the security system cannot keep up with the variability of the attacks, and the issue of the increase in dwell time, which means the difference between the attack detection time and the actual attack execution time, continues to arise [11,12]. Therefore, a flexible response is required to detect and respond to sophisticated cyberattacks quickly. To this end, the attack detection model requires the ability to reflect the characteristics of the observed data in real-time. Therefore, the most critical problem is how to quickly and accurately learn large-scale complex data generated from network traffic [13].
This paper proposes an abnormal data detection framework based on large amounts of complex network traffic data learning effectively and quickly. The proposed method is mainly composed of two parts. The first part is an ensemble model-based noise (outlier) data detection and removal. In this part, we train a large dataset as an ensemble model and filter out if it is relatively unnecessary for classifiers’ model training stage. This mechanism lowers the complexity and size of abstracted data by selecting only the optimal data for attack detection model training. The second part is a real-time behavior trend analysis through recursive model learning. This allows the attack detection model to be quickly trained using the previously derived optimal dataset. The optimal state of the dataset for model training is always maintained by repeatedly performing a series of procedures for classification, noise removal, and model training. In addition, this method allows the model to quickly reflect the characteristics of newly observed data (new trend) by recursive model learning the dataset in real-time. This paper presents the results of anomaly detection experiments on network traffic datasets in general IT environments to verify the method’s performance and effectiveness for deriving the optimal dataset. This experiment constructs an optimal dataset in real-time through noise detection and recursive learning through the proposed method.
The structure of this paper is as follows. Section 2 of this paper introduces related works to network attack detection, anomaly detection, and noise detection techniques. Section 3 describes the outline and detailed functional and structural elements of the network data purification and attack detection framework proposed in this paper. Section 4 describe how to implement the proposed framework. Section 5 describes the experiments to evaluate the performance of the proposed framework and the results and concludes in Section 6.

2. Related Work

This section describes some related researches on machine learning-based attack detection techniques and noise reduction techniques for network traffic data.

2.1. Machine Learning Based Anomaly Detection and Data Noise Reduction for Network Traffic Dataset

Sharafaldin et al. [14] proposed a methodology to effectively generate a dataset optimized for learning IDS in a network environment where noise data exist. This research proposed data set creation techniques that can effectively reflect the characteristics of each attack type for various types of attacks. The dataset created as a result of this research was published as the CIC-IDS dataset [15].
Anderson et al. [16] researched how to mitigate the adverse effects of mislabeled data on an attack detection model in the process of analyzing malicious behavior from encrypted network traffic. This method constructs a model that enhances resistance to noise data based on data distribution in an environment where the information on network traffic data is limited.
Yu et al. [17] analyzed the influence of noise data on unbalanced datasets in network traffic datasets. In addition, this research proposed a method of minimizing the influence of noise and deriving high performance by appropriately refining data from an unbalanced dataset using the methodology of Few-shot learning. Ahmed et al. [18] proposed filtering normal data using AutoEncoder to detect and remove noise data present in a dataset in an industrial control environment. This study detects noise data and intentionally changes it into a shape similar to normal data, thereby minimizing data loss and reducing the influence of noise data.

2.2. Noise Reduction Methods for Anomaly Detection

Network data is observed due to the interaction of various behaviors, and these complex results include various types of anomalous behavior. Therefore, to detect anomalies in the complex interaction of various behaviors, an ensemble model using various models that are not dependent on one model is appropriate [19]. Methodologies such as voting, bagging, boosting, and stacking can be largely used to construct an ensemble model for detecting attacks and abnormal behaviors on the network [20]. This section describes six classification models frequently used as network anomaly detection models and explains why these models are appropriate as internal models of ensemble models for anomalous behavior detection.

2.2.1. Decision Tree

The decision tree model is an intuitive methodology for classifying data using a top-down technique. This model is less affected by the quality of the data and is effective for analyzing large amounts of network traffic data because the learning rate of the data is relatively fast. In addition, since the judgment result can be interpreted through the white-box model, it is suitable for detecting attacks sensitive to False Alarm and analyzing attack traffic data containing the attacker’s intentions [21]. In addition, the decision tree model has a point that it can effectively calculate the impurity of the data by analyzing the entropy i = 1 C f i log f i and the Gini coefficient i = 1 C f i ( 1 f i ) for the frequency f i of the data label i and unique label set C. This function is very effective in reducing noise [22].

2.2.2. Random Forest

Random forest is an ensemble model that uses the classification results of multiple decision tree models. This method has less variation in the detection performance for each classification object than a single decision tree. Also, this method alleviates the limitation of the decision tree model in which the error of the upper decision layer is propagated to the next stage through techniques such as bagging and randomized node optimization. In particular, when the random forest model is applied to the dataset for network attack and abnormal behavior detection, it shows a relatively high detection effect for attack types with a tiny data ratio [23].

2.2.3. Support Vector Machine

The SVM model takes much time to learn data relatively and has a disadvantage. As retrains the number of features in the training data increases, the interpretability decreases. However, among machine learning methodologies, it is generally a model showing high performance and prediction accuracy. In addition, it has the advantage that the risk of overfitting is relatively low, even for data with a biased distribution [24,25]. The SVM model should use the appropriate kernel and parameters to construct the decision boundary. As parameters, the margin for error tolerance, flexibility (gamma) for decision boundaries, and kernel function should be appropriately selected considering the complexity and scale of network data. For the kernel function ( k ( x , x i ) , for arbitrary data x and support vector x i , linear, polynomial( ( x · x i + 1 ) d ), Gaussian radial basis function( e x p ( γ | | x x i | | 2 ) ), sigmoid( t a n h ( α x T y + c ) ) are frequently used.

2.2.4. Naive Bayes Classifier

The Naive Bayes model is a supervised learning method that performs classification based on Bayesian estimation p ( θ | X ) = p ( θ , X ) p ( X ) for feature X and label θ . Since this method performs classification based on conditional probabilities between features, it has the advantage of classifying large and complex datasets quickly. This advantage is suitable for analyzing network datasets. However, since the performance of this method is affected by the independence between features, the preprocessing technique for the features must be performed precisely [26].

2.2.5. K-Nearest Neighbors Classifier

The K-NN model has the advantage that it is less affected by the presence of noise data because it uses only some adjacent data in the process of classification. These characteristics can be utilized to effectively classify noise data in the noise reduction process. In addition, since the K-NN model is a model that is less affected by the type and characteristics of data, it can be flexibly applied regardless of the environment in which the data is collected [26,27]. However, the network traffic dataset may have many features depending on the data collection range. In this case, the K-NN model can be significantly affected by the dimensional curse. To alleviate this problem, the norm value p of the distance formula d ( x i , y i ) = ( i = 1 n | x i y i | p ) 1 p used in the K-NN model should be appropriately selected as manhattan( p = 1 ), euclidean( p = 2 ), Chebyshev( p = ), etc [26,28].

2.2.6. Logistic Regression

The logistic regression is a model that can obtain a relatively sophisticated classification result, unlike other models in that it can calculate the weight for the classification result by expressing the classification result as a probability between 0 and 1. This method reflects the overall trend of data that is changed in real-time and can perform more sophisticated noise detection in the noise reduction process of detecting new noise data [29].

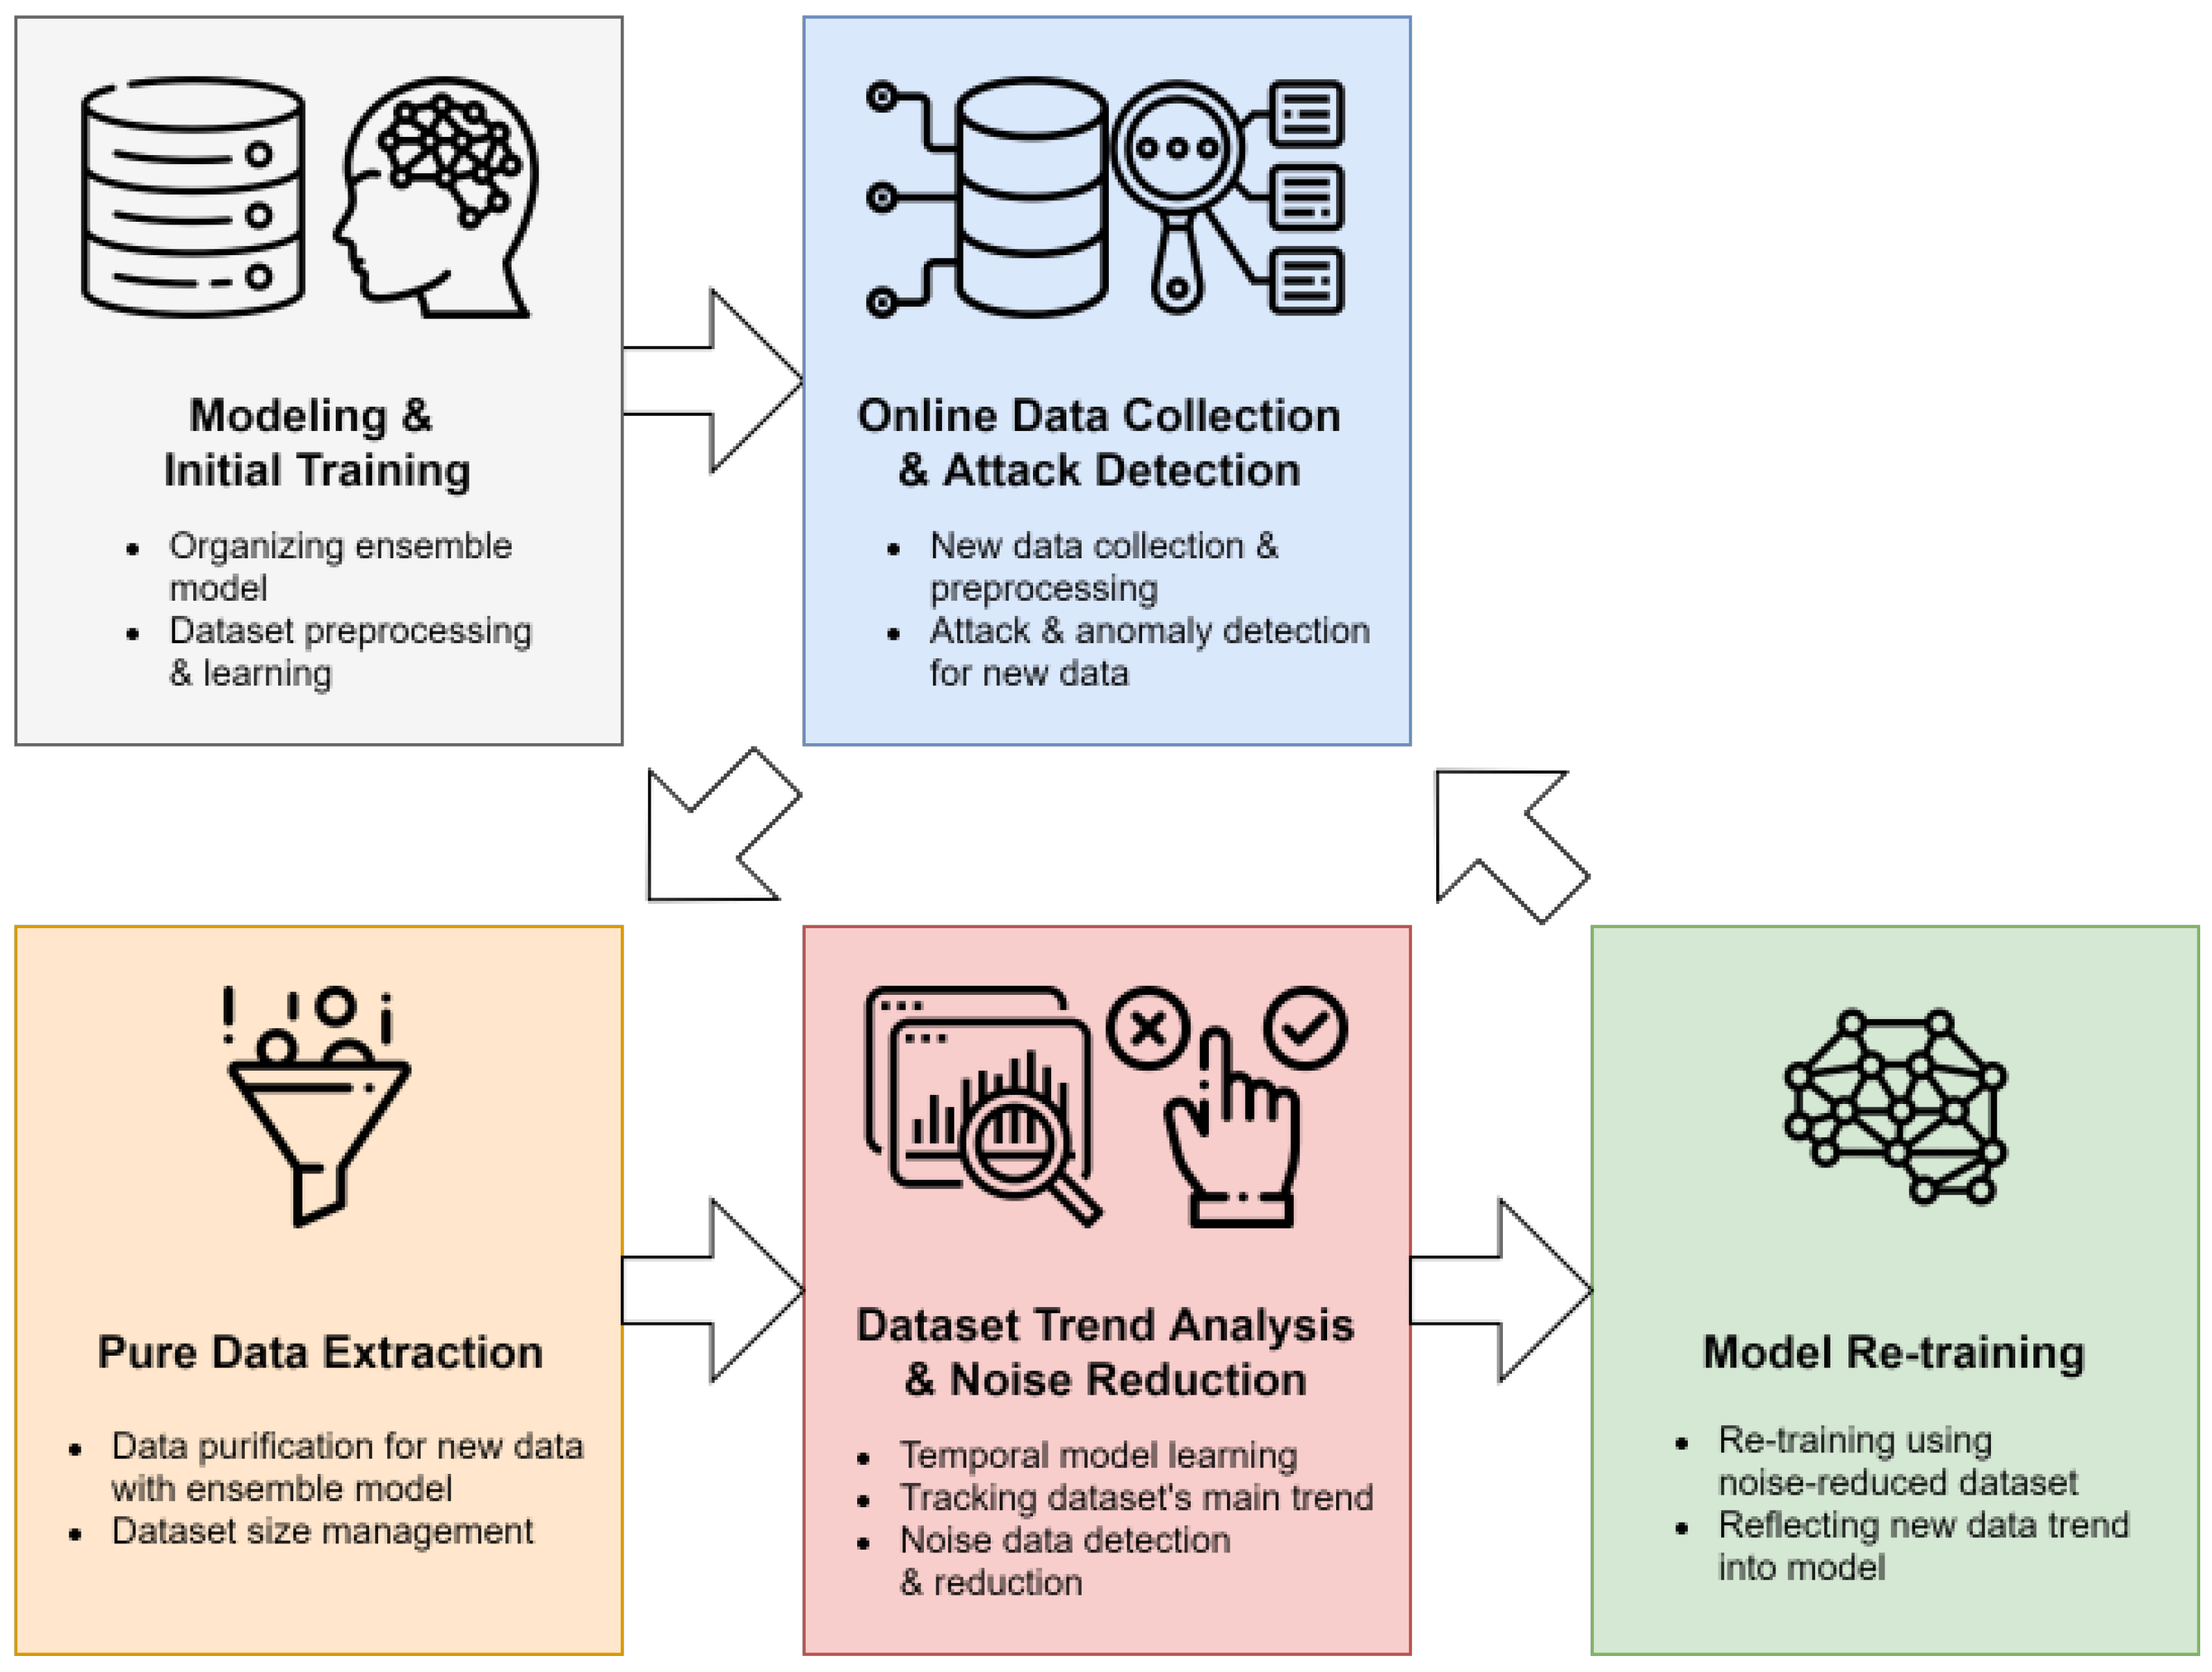
3. High Speed Outlier Detection of Network Abnormal Behavior

This section describes a high-speed outer detection and network abnormal behavior detection method based on noise detection and data purification. This purification technique reconstructs the training dataset from which noise data is removed to train the model so that the classification model has the most distinct classification boundary while avoiding overfitting. In addition, a dataset reconstructed on an appropriate scale allows the model to re-learn data trends in semi-real time. The proposed method is primarily divided into two processes; Pre-General learning and detection steps, dataset noise reduction through noise data detection and removal, and retraining steps. Figure 1 shows the two main processes of the proposed methodology and five detailed steps. The following is a description of each process and detailed steps.

3.1. General Training Detection Phase

The first phase of the proposed method is learning a model using general classification techniques and performing attack detection. The following is a detailed description of each procedure in the first phase.

3.1.1. Modeling and Initial Training

In the Modeling and Initial Training stage, dataset collection and preprocessing are performed to learn the machine learning model. In addition, this step constructs a classification model suitable for the type of attack to be observed and detected and learns the model using the prepared initial training dataset.

3.1.2. Online Data Collection and Attack Detection Using Ensemble Model

Detection of abnormal behavior on the network needs to be performed using continuously collected traffic data. This step performs attack detection in semi real-time using continuously observed traffic data. First, the newly observed network traffic data is classified through an initially learned model in real-time. At the same time, newly observed data are divided into units of a specific size and used in the next step for noise reduction, data trend analysis, and model re-learning. The first phase’s two steps can be seen as a general attack detection technique using the classification model. The proposed method allows various classification models to be flexibly applied depending on the purpose by constructing detecting attacks with multiple classification models. In addition, the first phase is performed independently of the second step of performing noise reduction, and this configuration improves the compatibility of the entire system [30].

3.2. Dataset Purification Model Re-Training

The second phase is the core of the proposed method, which removes noise data from new data and filters optimal data for re-learning the model. After that, this phase constructs an optimal training dataset using filtered data and retrains the attack classification model to reflect the data trend effectively.

3.2.1. Pure Data Extraction

Network data observed in real-time may change its distribution and characteristics rapidly depending on the environment of the network. To construct a model that quickly reflects these changes, data that can quickly and effectively train the model must be selected. To this end, the pure data extraction step analyzes the classification results of new data using an ensemble model. When the internal models of the ensemble model derive the same classification result for specific data, the data correspond to data located in a clear area of the decision areas of the models. On the other hand, when the classification results of the internal models of the ensemble model are diverse, the data are located around the crystal interface of the ensemble model. Data clearly classified as an ensemble classification model are pure data far from noise. Models learned with these pure data likewise have pure and clear decision boundaries and can derive accurate results. Finally, the proposed methodology extracts pure data from newly observed data and re-learns the model.

3.2.2. Dataset Trend Analysis and Noise Reduction

The pure data filtered in the previous step becomes eigenvectors indicating the direction of change in network traffic data. Then, the Dataset Trend Analysis and Noise Reduction phase use the newly collected pure data to re-learn the entire model. Through this, the attack detection model learns the purest direction of the data trend. The updated detection model reflects the trend of data, and the classification result of the newly learned model may be different from the previous result. Therefore, data classified as normal data may also be classified as abnormal or attack after the model is updated. In this case, it may be considered that the existing normal data has been moved to the noise area according to the result of the trend reflection of the data. The proposed method performs reclassification on pure datasets using the updated model to reflect the change in this noise area. Through reclassification, noise data included in the finally changed noise area can be detected, resulting in a pure dataset in which new noise is completely removed. In this process, the size of the training dataset may change, and the entire system should adequately set the thresholds used for pure data filtering and noise reduction so that the size of the training dataset is available.

3.2.3. Model Retraining

The training dataset modified through the noising reduction step is a pure dataset for the effective classification boundary of the model. This dataset retrains the attack classification model. The retrained model repeats step 2 to classify the following new observed data. This approach constructs a model that can quickly adapt to data trends through semi-real-time model learning by effectively constructing economic and high-quality datasets.

4. Implementation

This section describes the detailed structure and mechanisms for implementing the proposed method. To implement the proposed methodology, the composition of the ensemble model and the dataset purification mechanism that filters pure data and reduces noise data must be appropriately organized. The following Figure 2 is a detailed flowchart of the operation procedure of each element of the proposed methodology. The following subsections describe the implementation method for each element.

4.1. Model for Dataset Noise Reduction and Purification

This section describes how to construct the noise reduction model used in the proposed method. This paper uses all six classifier models described in Section 2.2: Decision Tree, Random Forest, SVM, Naive-Bayes, K-NN, and Logistic Regression. Each model shows different performance depending on the data distribution and their features. Combining these models allows consistent performance even for datasets with various distributions and characteristics. This paper constructs a hard-voting ensemble model using the above six classifier models. The hard-voting method in the ensemble model filters only the results of the unanimous classification of the six internal models. This ensemble model selects only data classified as an attack (6 voted) or normal (0 voted) by all internal models, and all remaining data (1 to 5 voted) is classified as noise data and removed. This extreme filtering has the purest form of the decision boundary.

4.2. Dataset Purification

This section describes a dataset purification mechanism for fast outlier and noise detection. The Purification mechanism receives previous training datasets and new data, learns the trend of changed data, and returns a new training dataset removed from noise data. In this process, the Dataset purification mechanism uses a threshold to generate an appropriate dataset considering the trade-off between classification performance and training time. Algorithm 1 is the pseudo-code of our algorithm for the data set purification mechanism of the proposed methodology.
The proposed method uses the unanimity threshold u for the sum of the classification results of the ensemble model. If the sum of classification results is higher than this threshold, the data is judged as pure data. These pure data are used for retraining the next model, and classification results lower than this threshold are excluded from the retraining process. At the same time, the unanimity threshold is a factor that determines how sensitively the classification model reflects the trend of newly observed data. If the unanimity threshold is high, the classification model conservatively reflects the trend, and if the unanimity threshold is low, the model actively reflects the trend of new data. This threshold may be applied differently depending on the environment of the network. In an environment where the pattern of network traffic changes frequently and a flexible decision boundary is required, it can respond by setting the unanimity threshold low. On the other hand, in a static environment where almost the same pattern is repeated, such as ICS, it is possible to respond sensitively to abnormal behavior by applying a high unanimity threshold.
Algorithm 1: Data Purification Mechanism.
Input: previous training dataset T
     newly observed data N
     ensemble model E
     unanimity threshold u
     purity threshold p
Output:  purified new training dataset P
1   for each n i N do
2  preds = prediction(E, x)
3  for each y preds do
4    if sum(y) > u then
5       store y in U
6    end if
7  end
8   end
9   N = N U
10  l = length(N)
11  model_training( E , N )
12  for each n l N do
13     preds = prediction(E, n l )
14     for each y preds do
15     if sum(y) > p then
16       store y in P
17     end if
18     end
19  end
20  return P
The dataset purification mechanism selects data for retraining and merges them with the existing training dataset. This new dataset is used to update the classification model temporarily. Then, the updated model performs recursive classification on the dataset used to train the model. After that, for the recursive classification results, data to be included in the final training dataset is selected based on the sum of the classification result values of the sub-models of the classification model.
Dataset purification mechanism removes new noise data in the classification models reflecting new data trends. This process can adjust the size of the training dataset by tuning the ratio of increasing new data to decreasing noise data. In this process, the purity threshold p is used. Like the unanimity threshold, this threshold refers to the reflection rate of trends and determines the rate of change in the size of the training dataset. The purity threshold is inversely proportional to the growth rate of the size of the training dataset. If the purity threshold is high, the size of the training dataset is maintained or gradually decreased. If the purity threshold value is low, the size of the training dataset continues to increase in proportion to the new data. Therefore, the purity threshold should be adjusted appropriately by considering all factors such as the amount of data observed in the network, the performance of the classification model, and the time used for learning.
The training dataset P finally derived by Algorithm 1 is used to train the model again so that the trend of the new observation data N is reflected in the training dataset for the next step.

5. Experiments and Assumptions on Abnormal Behavior Detection and Noise Removal Performance

This section presents the experimental results to evaluate the attack detection performance of the proposed network attack detection framework and the level of noise removal and real-time data trend reflection.

5.1. Dataset and Environments

This section describes the dataset used to experiment with and evaluate the accuracy improvement in network attack detection and classification through noise detection and data trend reflection. This experiment used the CIC-IDS-2017 Dataset [15], which collected periodic DDoS attack attempts to observe the data pattern change effectively. This dataset is about network packet data collected through simulations in a typical IT network environment for about a week. It includes 77 various statistical characteristics that can be observed in the network. Detailed information on the CIC-IDS-2017 dataset is shown in Table 1 below. In addition, to reflect the degree of change in extreme data patterns, data bias, and realistic attack distribution, a filtered dataset that reduces the number of attack data from the original dataset to 20% was used. This dataset was used in the experiment to explain the influence of the threshold described in Section 4.
This experiment was performed in Ubuntu 20.04.3 LTS operating system environment with Intel i7-9700KF (3.60 GHz) CPU, 64 GB of RAM, and GPU of Geforce RTX 2080 SUPER, with Jupyter Lab version 3.1.4.

5.2. Training and Test Dataset

In this experiment, the size of the training dataset using the proposed method was fixed to show that the small training dataset from which noise has been properly removed is more effective than the large training dataset containing noise data. For the entire dataset, including 225,711 entries, the proposed method uses 20,000 (about 8.9%) and 40,000 (about 17.7%), respectively, as the training dataset in the two experiments. To maintain the time series characteristics of the dataset, each training dataset uses the first part of the entire dataset, and the proposed method uses the remaining 91.1% to 82.3% of the entire dataset as the test dataset. At this time, the test dataset in each experiment is divided into 100 folds of the same size, and each fold is sequentially input to the model. The model used classifies the sequentially input test dataset folds, regenerates the new training dataset using filtered classification results, and repeats the process of retraining the model. On the other hand, the ideal experiment to compare the performance of the proposed experiment uses all data up to the starting index of each fold. For example, in the first experiment with 20,000 training datasets (the size of each fold is 2057), the proposed method uses a model trained with 20,000 training datasets to measure the performance for the tenth fold. However, in the ideal experiment, classification is performed with a model trained on all data from 0 to 40,570. This difference in the size of the training dataset was established to show that the proposed model can obtain a sufficient level of classification accuracy even with a model trained quickly using a small-scale training dataset.

5.3. Parameters Used in Ensemble Model for Attack Detection and Noise Reduction

This section describes the ensemble model used to perform the proposed methodology’s noise reduction and attack detection. In this experiment, a voting-based ensemble model was constructed using the six models (Decision Tree, Random Forest, SVM, Naive-Bayes, K-NN, Logistic Regression) described in Section 2.2. The constructed model was used for both network attack detection and noise reduction. The following is a description of the parameters used in each internal model.

5.3.1. Decision Tree

The decision tree model uses the criterion for measuring the impurity of each classification group and the split criterion in the process of splitting for classification. To construct a model that can be comprehensively applied to datasets of various distributions, we used the Gini index, which is less affected by the influence of data distribution. In addition, since the learning time of the decision, is relatively short, we choose the ’best’ split method to derive high accuracy even though this approach takes some time.

5.3.2. Random Forest

In this experiment, the parameters of the internal models constituting the random forest are configured with the Gini index in the same way as the decision tree. Also, we confirmed that the dataset used in the experiment does not have significant decision boundaries for trees of depth 5. Thus we set the maximum depth of the random forest model to 4 for efficiency of training time.

5.3.3. SVM

We assume that there is noise in the dataset in our experiments, which we mean here includes data that has a low impact on constructing the decision boundary of the overall model. Therefore, when the hyperplane of the SVM is determined, we set the regularization parameter to 0.8, lower than the default value of 1.0, so that the entire model can form a flexible decision boundary by forming a sufficient margin for the noise data. Also, due to the complexity of the dataset, we use a linear kernel for the availability of classification.

5.3.4. Naive-Bayes

On the dataset used in this experiment, all 77 features had real type values, and no unusual distribution was identified in the dataset. Thus, we constructed an ensemble model using the Gaussian Naive-Bayes model to enhance the coverage of natural events.

5.3.5. K-NN

Although the K-NN model can perform classification most intuitively, its computational complexity is very high due to the complexity of features and the number of entries in a given dataset. Therefore, we set a lower criterion of 3 than the default value of 5, which reasonably compromises computational performance. Also, these shallow criteria make the model more responsive to rapidly changing data patterns.

5.3.6. Logistic Regression

Datasets with different attack patterns may require more iterations for the logistic regression model to converge. We set the iteration to 1000, which is ten times the default setting, for coverage on datasets where various attack patterns exist. Stopping criteria set the model to converge at a regular rate using the default value of 0.0001. In addition, the inverse of regularization strength, which means the reliability of the training data, was set to 0.8 instead of the default value of 1.0 to flexibly cope with the noise data existing in the training dataset.

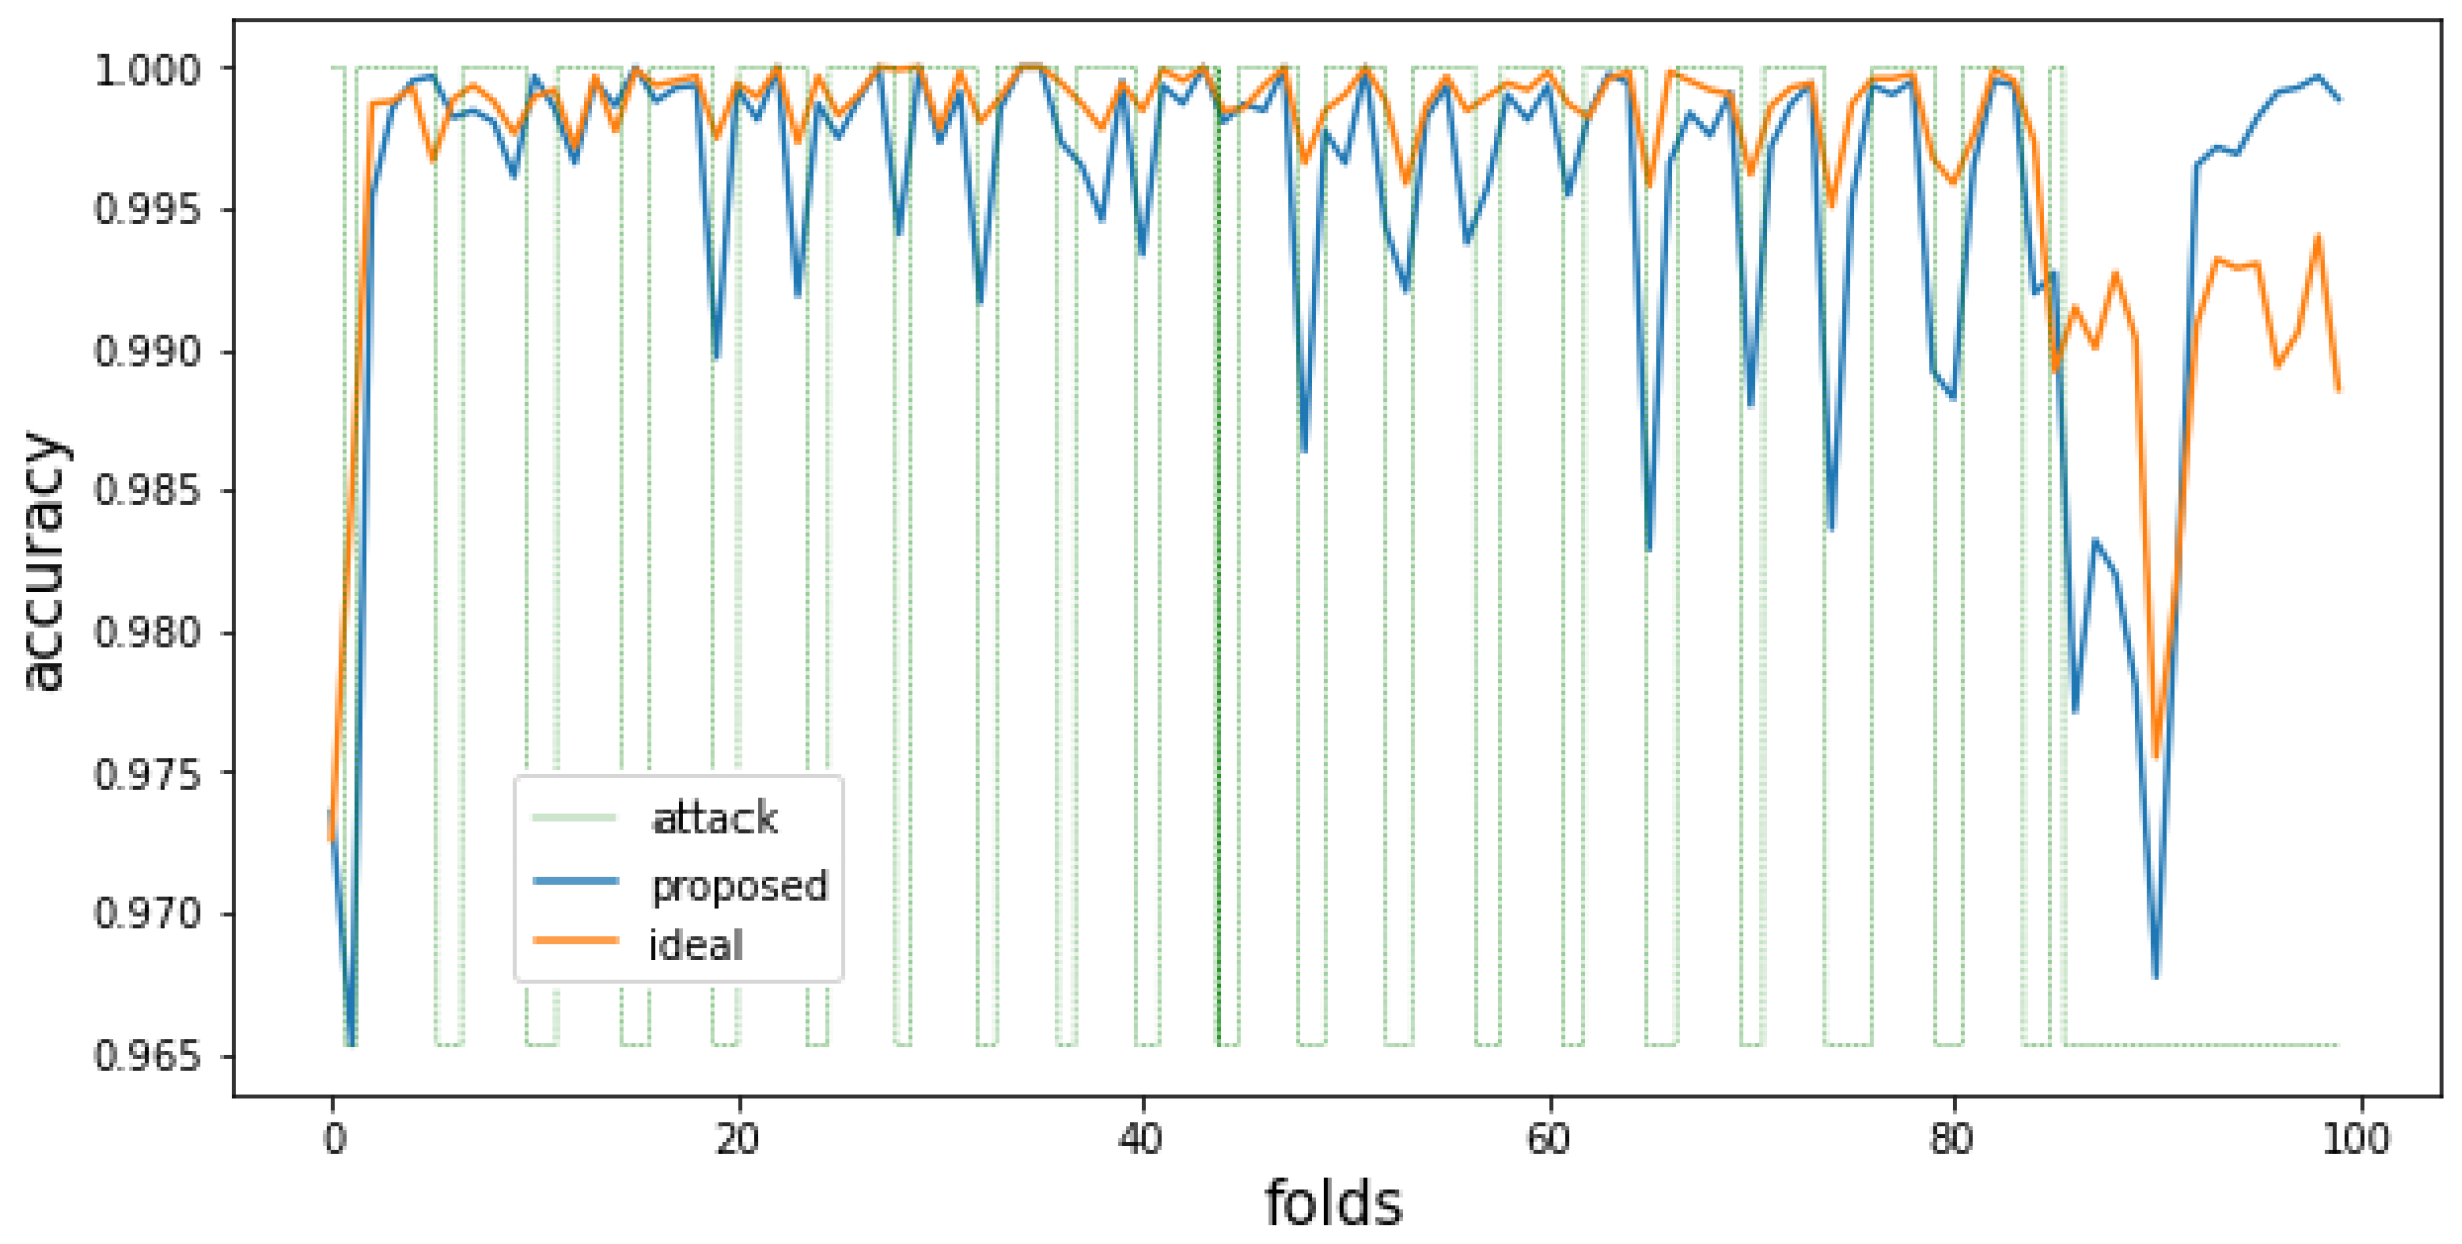
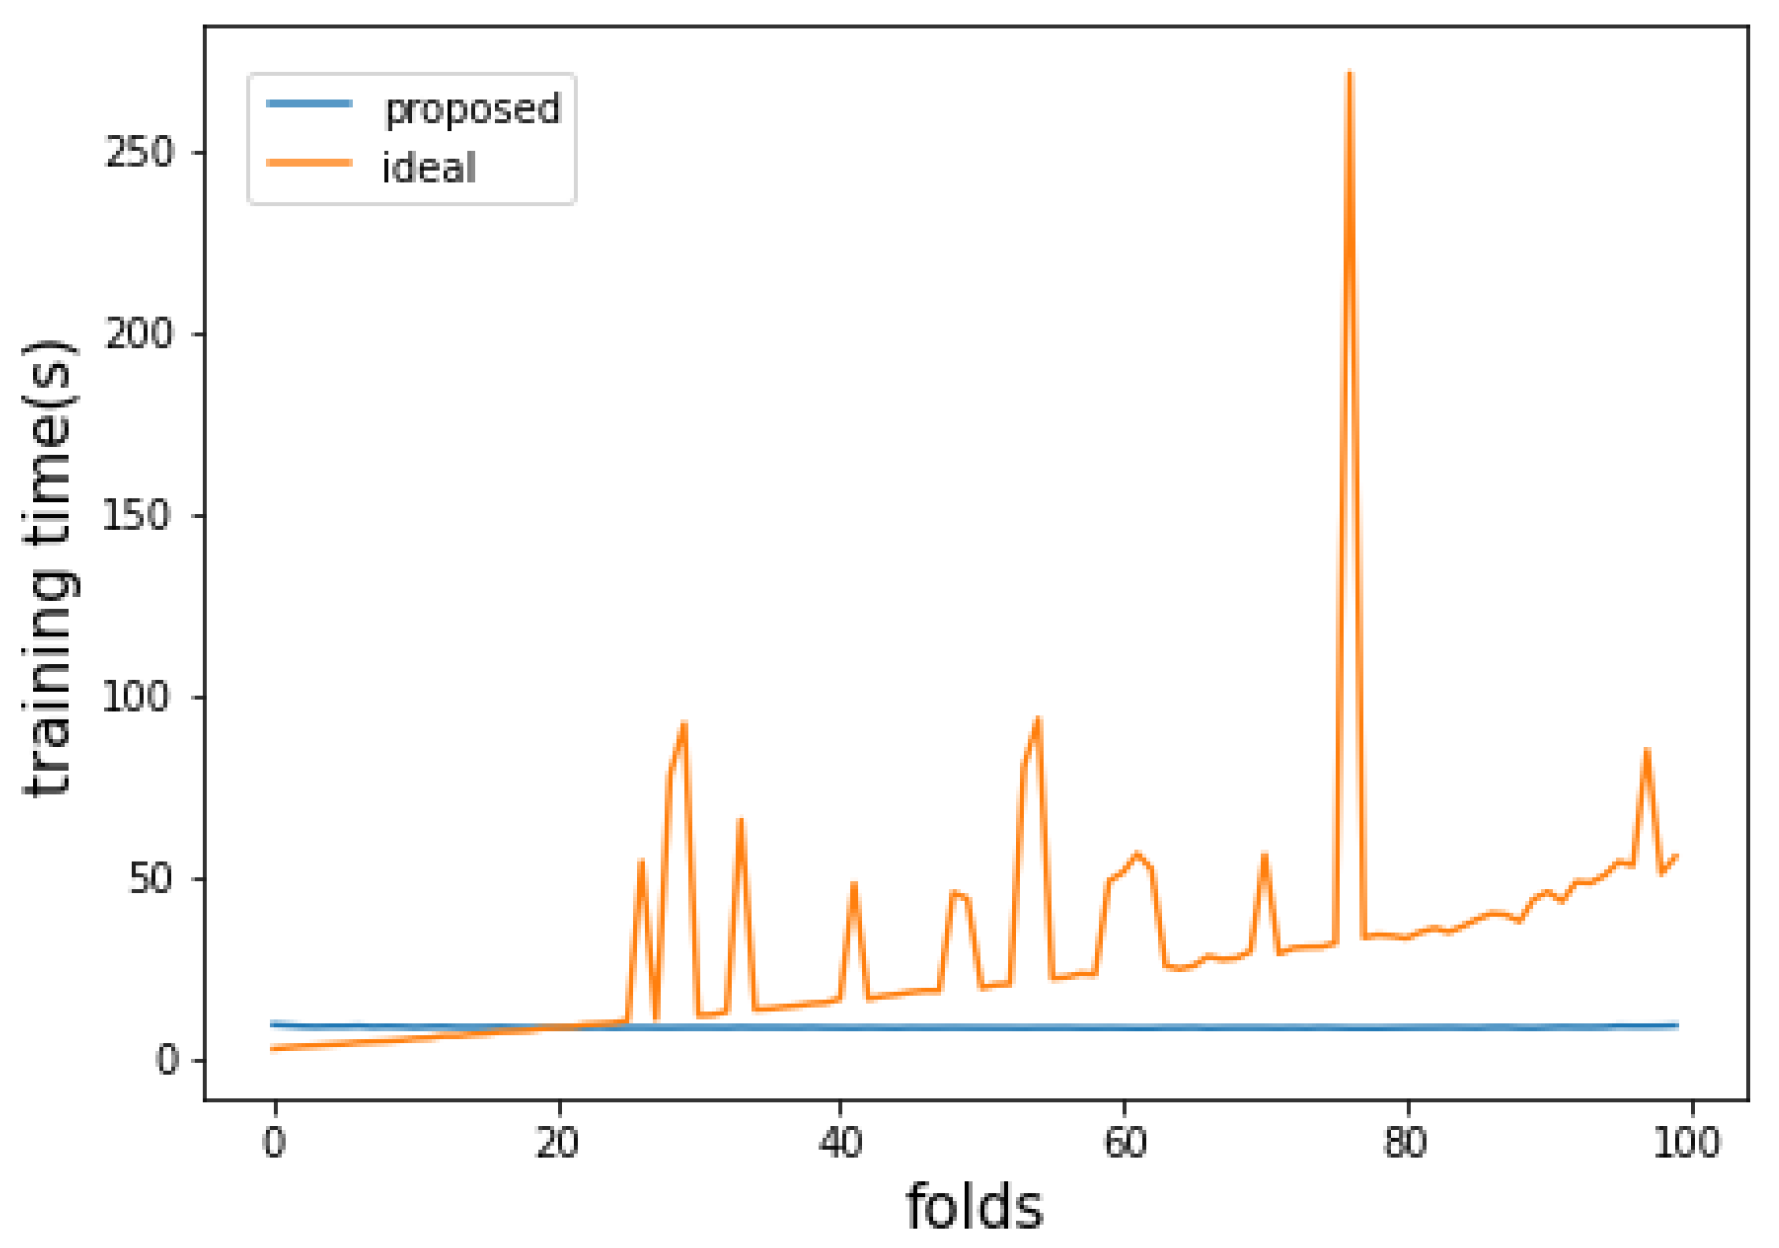
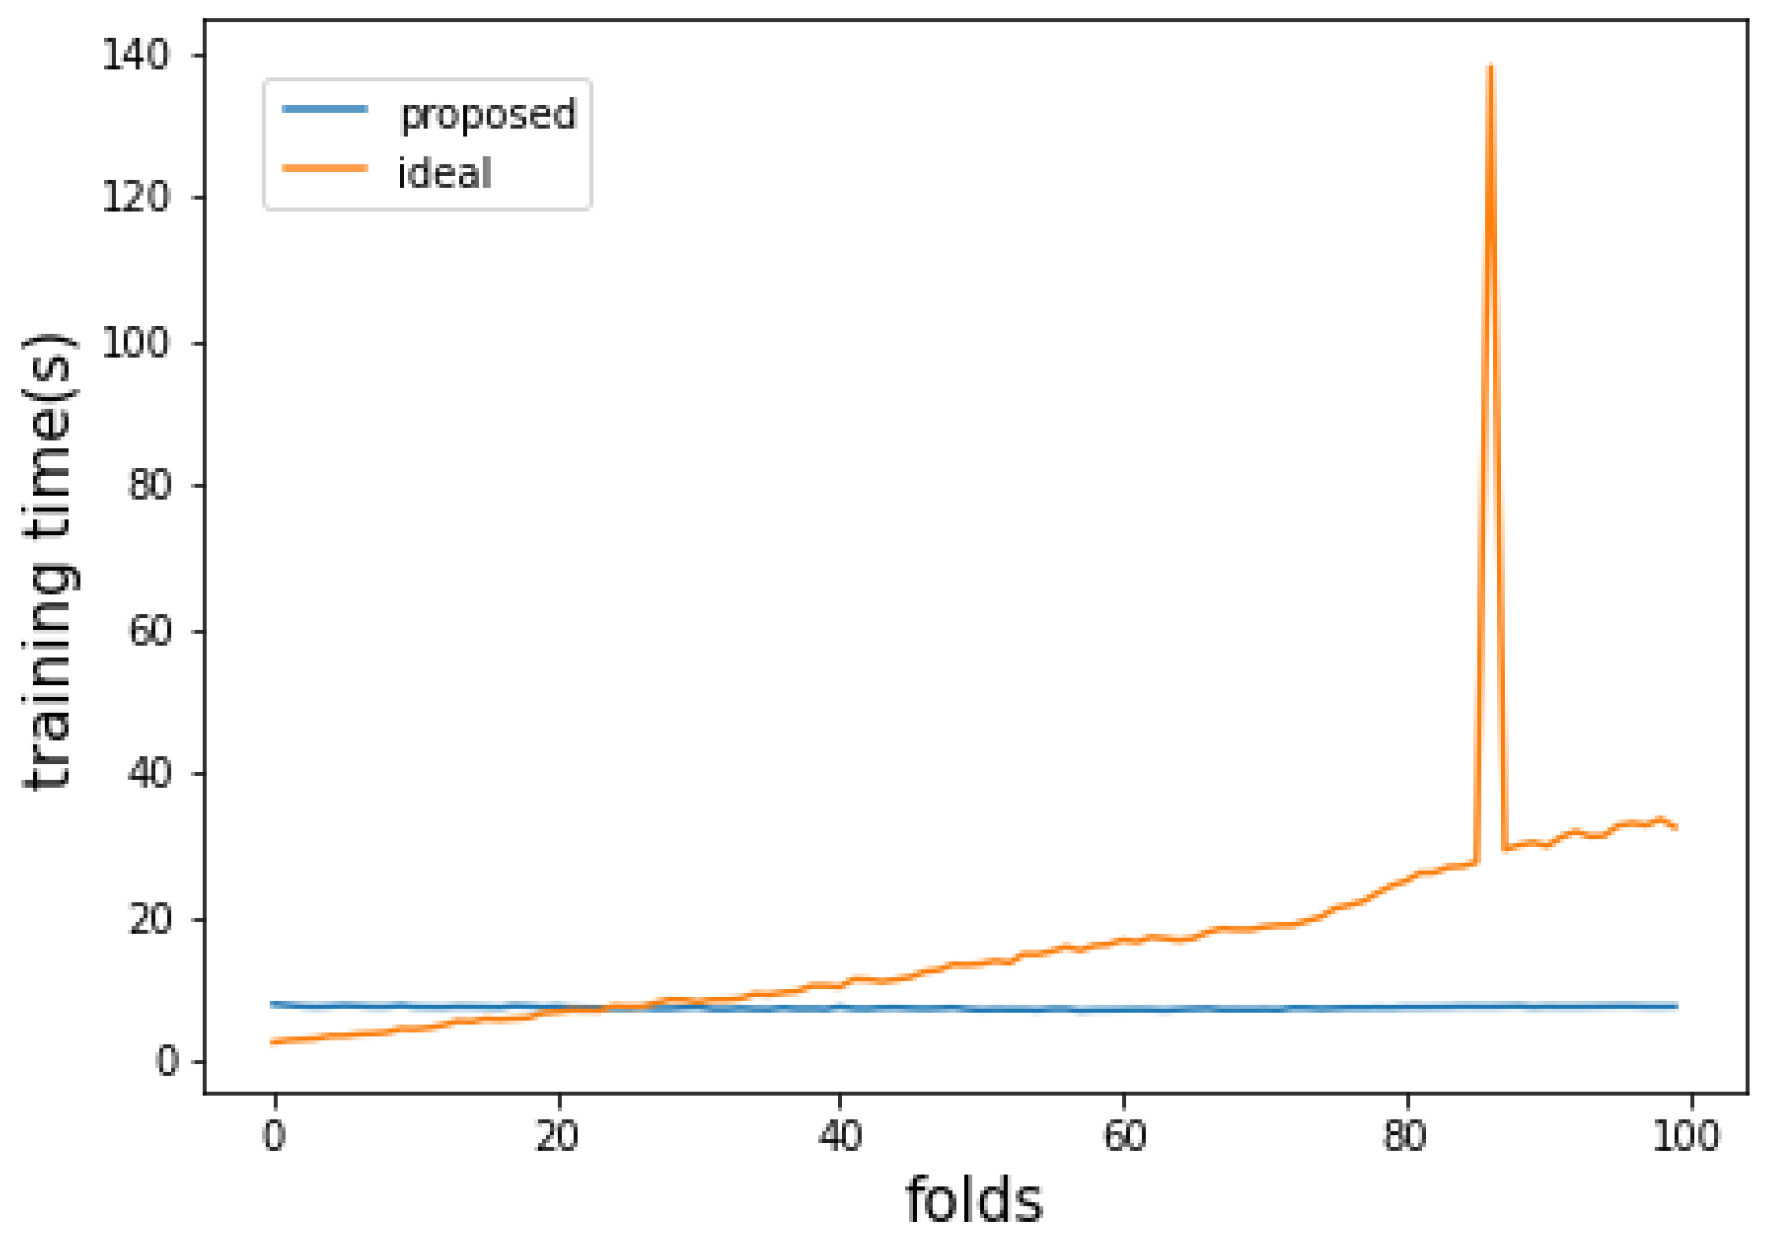
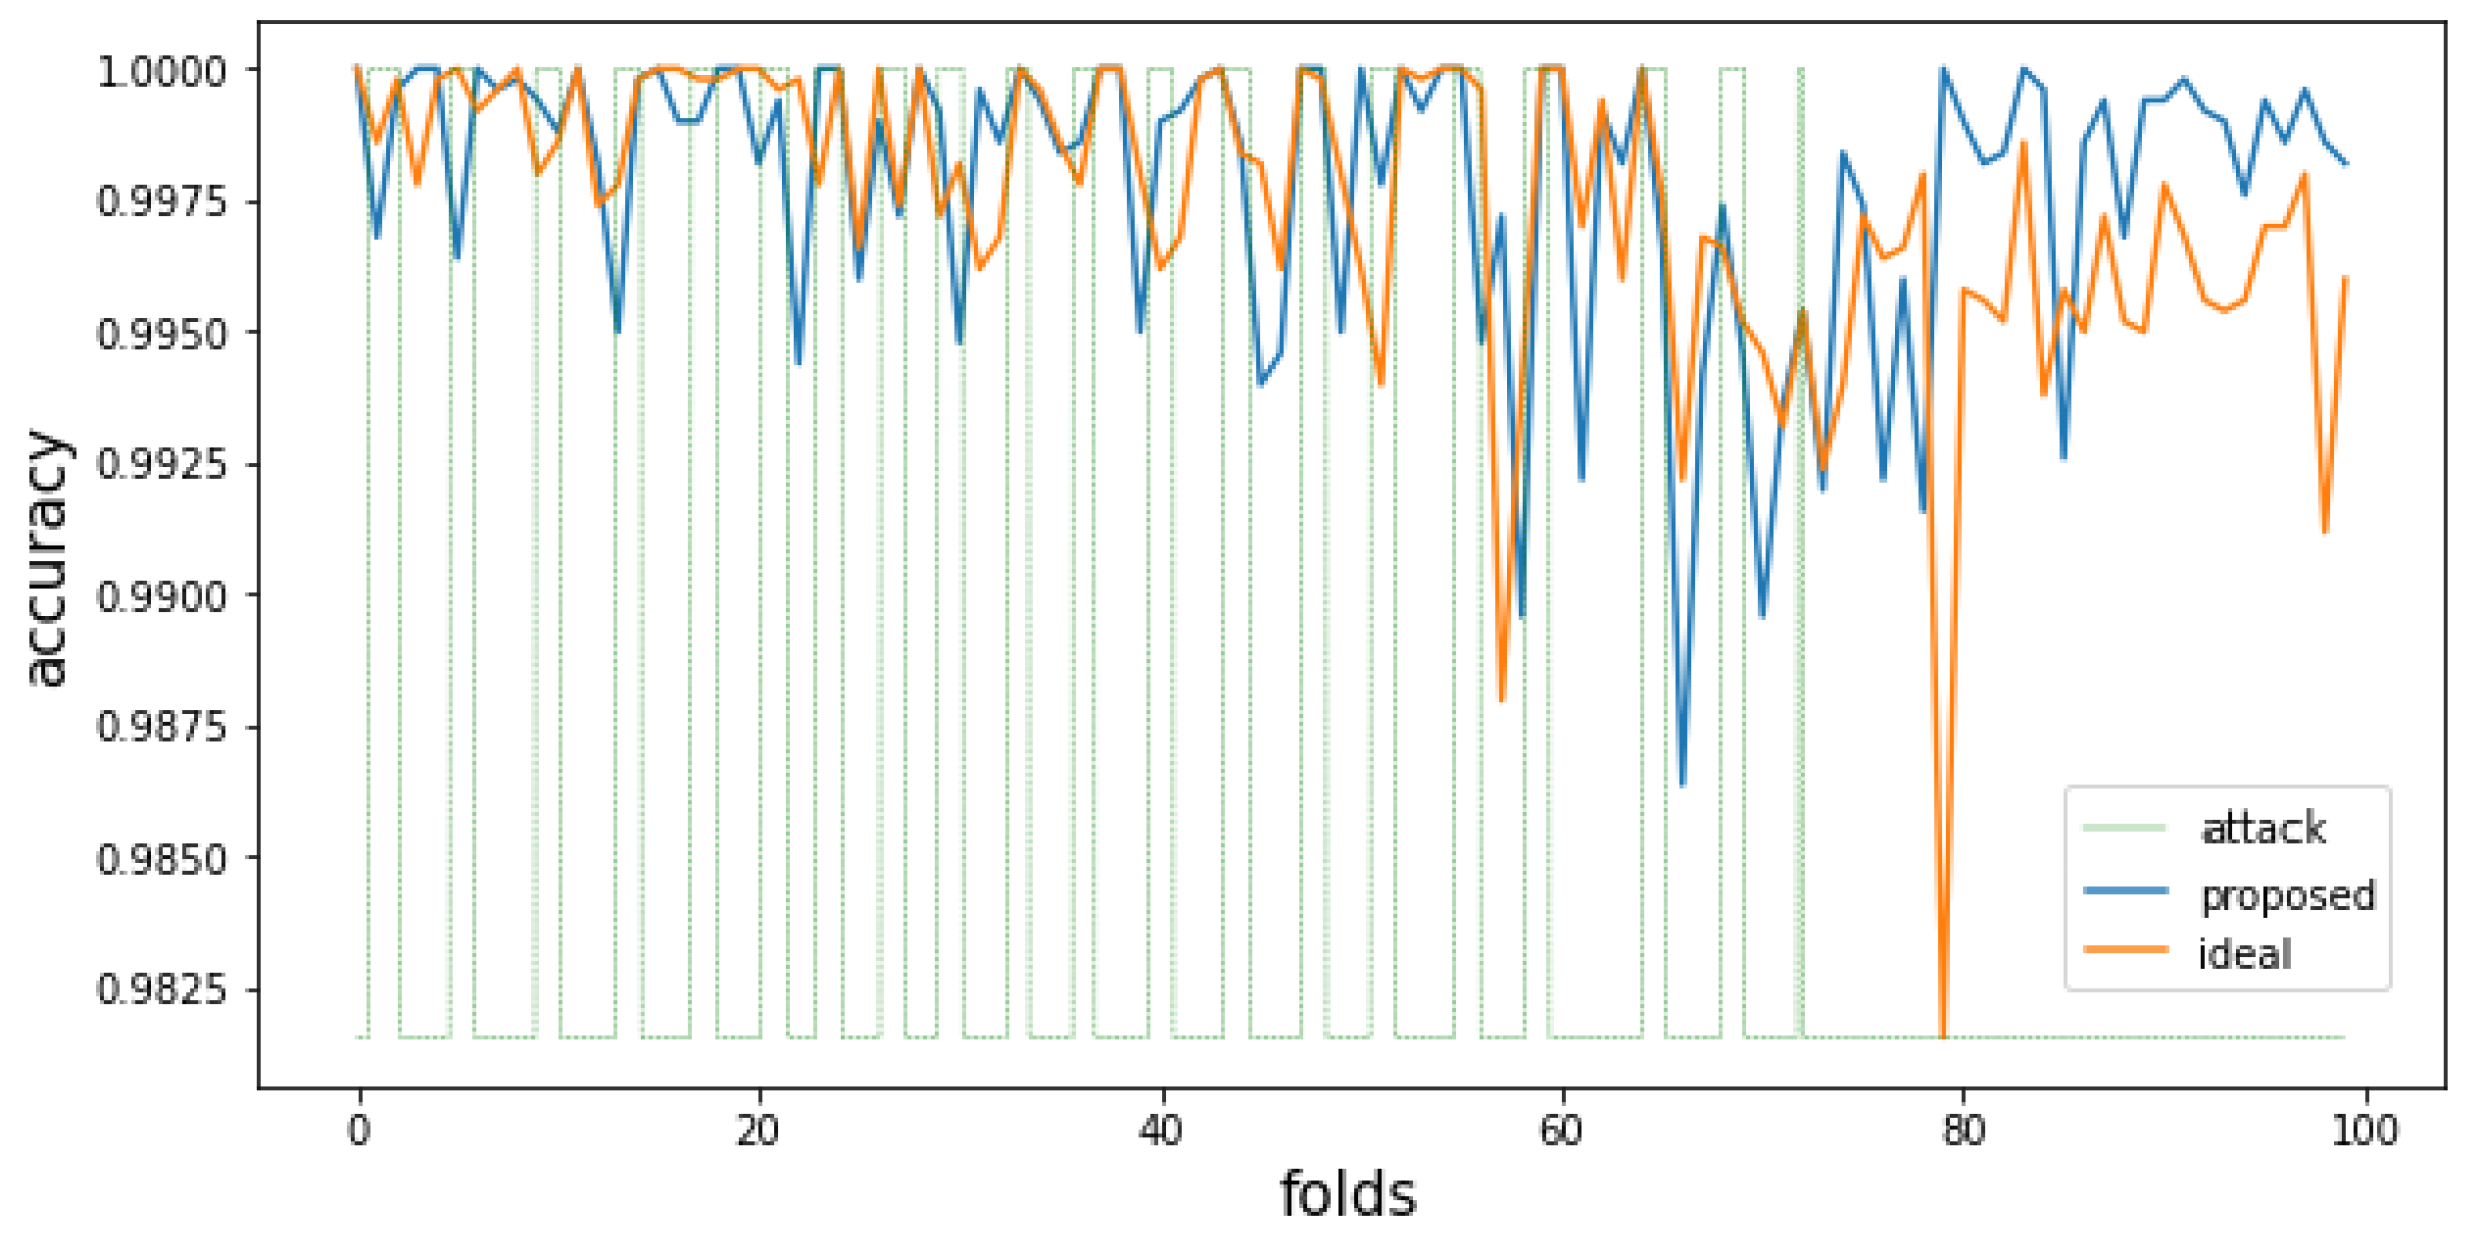
5.4. Evaluation of Attack Detection Performance and Ability to Trend Reflection

This experiment proves that the proposed methodology is capable of high-speed learning compared to a large amount of data and, at the same time, has high detection performance by constructing a high-quality, small-scale training dataset. To this end, an experiment was conducted to configure and maintain the training dataset at the level of 10% of the total dataset. In this experiment, 20,000 pieces of data, which is about 10% of the entire data, were used as the initial training dataset, and the remaining 205,711 data were used as new data by dividing the data by a specific time unit. Experiments were performed to compare the performance of the proposed method with the ideal machine learning detection method. In the ideal experiment to compare the performance of the proposed method, a greedy method was used in which all observed data up to a specific time point were used for training. The new observation data were sequentially divided into 100 folds for the experiment, with 2057 data observed per particular unit time. An experiment on the accuracy of attack detection and classification using the proposed method was performed by reflecting new observation data in the existing training data and updating the training dataset at every point in time.
The following Figure 3, Figure 4, Figure 5, Figure 6, Figure 7, Figure 8, Figure 9 and Figure 10 are graphs showing the experimental and control groups’ attack detection performance and learning time. Figure 3, Figure 5, Figure 7 and Figure 9 are graphs of the classification accuracy of the experimental group and the control group, and Figure 4, Figure 6, Figure 8 and Figure 10 show the learning time of the experimental group and the control group. In each graph, the graph of the experimental group is presented by an orange line, and a blue line indicates the graph of the control group. In addition, in the classification accuracy graph, the label of the test set is indicated by a green line, a value of 1 means attack data, and a value of 0 means normal data.
In the attack detection accuracy graph in Figure 3, the ideal approach shows higher classification performance than the proposed method. This result is predictable because the ideal approach used more training data. However, in the classification accuracy after the 86th fold, where the last attack pattern was observed, it can be confirmed that the accuracy in the ideal approach is consistently low even though only normal data is observed. This is because the data observed in the past data patterns acted as noise data in subsequent situations so that the decision boundary of the entire model was improperly formed. On the other hand, the classification accuracy of the proposed method shows higher accuracy than the ideal approach in the time after the 90th fold, even though it showed slightly lower accuracy in previous periods. This is because, among the data observed in the past, noise data in the currently observed data is removed correctly so that the training dataset is appropriately configured. Also, in Figure 4, it can be seen that the proposed method shows a constant and much faster learning time compared to the ideal approach. These results mean that the model can be trained much more effectively than learning the entire data with only 20,000 data of an appropriately organized dataset.
In Figure 3, the average difference between the two observed accuracies in the entire period of 100 folds was 0.167314%. In the section after the last 90 folds, the comparison group method showed an average attack detection accuracy of 98.89%. The proposed method showed an average attack detection accuracy of 99.34%.
Figure 5 and Figure 6 are the results of experiments performed after reducing attack data to 20% to reflect the realistic attack environment and data distribution. When the ratio of attack data is reduced, new data’s degree of trend change also decreases. Because of this, the ideal approach of learning large amounts of data shows better classification accuracy. On the other hand, in the accuracy graph of Figure 5, the proposed method shows low accuracy in the first 0–20 fold periods. This result means that the number of data was insufficient to reflect the pattern of new data. However, in the data after the 20th fold, the classification accuracies of the proposed method and the ideal approach show similar performances. This means that a sufficient number of pure data to learn the model’s decision boundary effectively has been organized. In other words, this experiment shows that the proposed method can effectively train a classification model even with a small amount of data if repeated learning is performed for a sufficiently long time. As a result of these, in Figure 4 and Figure 6, the proposed method shows a more effective learning time than the ideal approach.
Figure 7 and Figure 8 are the attack detection results for a 40,000-scale training dataset generated by the proposed method, and Figure 9 and Figure 10 are experiments that reduced the proportion of attack data to 20%. In the attack classification accuracy graph of Figure 7, where the change in data trends is significant, the difference in attack classification performance between the ideal approach and the proposed method is not significant. These results imply that it may not be appropriate to operate a training set of 40,000 for a given dataset. Similarly, in Figure 9, where the change in the data trend is small, the proposed method shows similar attack classification accuracy to the ideal approach up to about 50th fold intervals. However, the proposed method shows higher accuracy than the ideal approach after the 75th fold, where the last attack data is observed. This means that the proposed method eliminated noise data properly while at the same time enabling more accurate classification than the ideal approach in the period where the data pattern changes from attack to normal. In addition, the average classification accuracy measured by the method proposed in Figure 7 and Figure 9 is higher than the accuracy of Figure 3 and Figure 5. These results imply that considering the feature and distribution of each data in a given dataset, and itis more appropriate to operate 40,000 training sets than 20,000 training sets. As a result, if the learning dataset’s size can be adequately set considering the number of newly observed data and the number of data that can be digested every unit training time interval, the proposed method shows higher attack detection performance than simply learning large amounts of data. Figure 7 and Figure 8 show the experimental results of setting the size of the training dataset generated by the proposed method to 40,000. Figure 9 and Figure 10 show the experiment results in which the ratio of attack data was reduced to the level of 20%. In the attack classification accuracy graph of Figure 7, where the data trend changes, the ideal method has slightly higher overall detection performance, and the proposed method generates fewer false alarms in the last section by removing the noise data. In this experiment, the difference in accuracy between the proposed method and the ideal method is not significant in all folds. This result means that as the size of the training dataset of the proposed method increases, the two methodologies converge in the direction of deriving similar results. In Figure 9, where the change in data trend is small, the proposed method shows attack classification accuracy similar to the ideal method up to about 50 folds. However, after the 75th fold, where the last attack data is observed, the proposed method shows higher accuracy than the ideal method. This means that the proposed method reduces the noise data better than previous experiments, and it means that more accurate classification is possible even in the period where the data pattern changes in real-time. In other words, this result shows that it is more effective to construct a pure training dataset of 40,000 considering the size of the entire dataset, the size of the initial training data, and the degree of the data trend change. Therefore, if the number of newly observed data and the number of data covered within every unit time are adequately considered, the proposed method shows higher attack detection performance than simply learning a large amount of data.

5.5. Discussion and Limitations

The proposed method reduces the noise data from the training dataset and derives an efficient small-scale training dataset through purification. This method filters only the data that has a significant influence on forming the decision boundary of the ensemble model. These results can fundamentally improve the efficiency and performance of anomaly detection techniques using machine learning. However, some blind spots and limitations must be considered in deriving these results.
The first is the absence of a method for determining the size of an appropriate training dataset. Although the derived dataset from the proposed method makes the clear decision boundary, the size of the training dataset itself is directly related to the sensitivity to changes in the network. Therefore, when the training data is too large, a behavior different from previous patterns may be classified as noise and eliminated even if it is normal behavior. On the other hand, slow but progressive attacks, and noise may not be detected using a too-small training dataset. Therefore, it is necessary to consider how to determine the size of the training dataset by observing the number of changes in the network.
The second is a case in which meaningful data is gradually removed while the training dataset continuously removes noise data; thus, the dataset converges in a meaningless direction. For example, in the case of malicious behavior that is difficult to detect, hard voting (or soft voting) of the ensemble model may not be appropriate for attack detection. This aspect can converge in the direction where a specific label is continuously reduced in the training dataset, or the training dataset itself is over-fitting so that only a specific label is selected. This problem should be solved by considering the degree and ratio for acceptance and reflection to the new data and patterns.

6. Conclusions

This paper proposed a method of efficiently learning attack detection and classification models through ensemble-based noise reduction mechanisms using various classification models. The proposed method derived higher classification accuracy than simply using a large amount of data for learning by selecting data that could purify the decision boundary of the ensemble model by synthesizing the classification results of various models. In addition, the model can quickly reflect trends of new data by rapidly detecting and removing noise data generated by changes in data trends. This approach allows the proposed method to effectively detect abnormal behavior observed in the network in that it can save system resources while at the same time performing real-time model modifications using high-quality small datasets. In addition, the proposed methodology constructed a flexible method to which various classification models could be applied by separating the noise reduction procedure from the process of the general classification model. This has the advantage of being used not only to network data but also to classification problems with different distributions and characteristics of datasets. Thus, the proposed method is a classification approach that can be applied in all cases where the prediction of changes in data characteristics is required in an environment where data is constantly observed. Of course, the proposed method still has limitations and blind spots on the adaptability and robustness of the model and the process of finding appropriate parameters. These issues require a fundamental consideration of the distribution and characteristics of the data. Therefore, we will continue to develop the proposed methodology to determine the optimal training dataset size and appropriate new data observation frequency in future studies.

Author Contributions

Conceptualization, J.C.; methodology, J.C. and S.G.; software, S.G.; validation, J.C. and S.G.; formal analysis, J.C.; investigation, J.C. and S.G.; resources, S.G.; data curation, S.G.; writing—original draft preparation, J.C.; writing—review and editing, J.C. and S.G.; visualization, S.G.; supervision, K.C.; project administration, K.C.; funding acquisition, K.C. and J.C. All authors have read and agreed to the published version of the manuscript.

Funding

This work is supported by the Industrial Core Technology Development Program of MOTIE/KEIT, KOREA. [#10083639, Development of Camera-based Real-time Artificial Intelligence System for Detecting Driving Environment & Recognizing Objects on Road Simultaneously].

Institutional Review Board Statement

Not applicable.

Informed Consent Statement

Not applicable.

Data Availability Statement

The link to the data used in this research is described in the Reference Section ([15]).

Acknowledgments

We thank our colleagues from KETI and KEIT who provided insight and expertise that greatly assisted the research and greatly improved the manuscript.

Conflicts of Interest

The authors declare no conflict of interest.

Abbreviations

The following abbreviations are used in this manuscript:
ICSIndustrial Control System
IoTInternet of Things
ITInformation Technology
CIC-IDSCanadian Institute for Cybersecurity-Intrusion Detection System
SVMSupport Vector Machine
K-NNK-Nearest Neighbors

References

  1. Berman, D.S.; Buczak, A.L.; Chavis, J.S.; Corbett, C.L. A survey of deep learning methods for cyber security. Information 2019, 10, 122. [Google Scholar] [CrossRef] [Green Version]
  2. Chaabouni, N.; Mosbah, M.; Zemmari, A.; Sauvignac, C.; Faruki, P. Network intrusion detection for IoT security based on learning techniques. IEEE Commun. Surv. Tutor. 2019, 21, 2671–2701. [Google Scholar] [CrossRef]
  3. Lu, Y.; Da Xu, L. Internet of Things (IoT) cybersecurity research: A review of current research topics. IEEE Internet Things J. 2018, 6, 2103–2115. [Google Scholar] [CrossRef]
  4. Tomić, I.; McCann, J.A. A survey of potential security issues in existing wireless sensor network protocols. IEEE Internet Things J. 2017, 4, 1910–1923. [Google Scholar] [CrossRef]
  5. Gong, S.; Cho, J.; Lee, C. A reliability comparison method for OSINT validity analysis. IEEE Trans. Ind. Inform. 2018, 14, 5428–5435. [Google Scholar] [CrossRef]
  6. Coulter, R.; Han, Q.L.; Pan, L.; Zhang, J.; Xiang, Y. Data-driven cyber security in perspective—Intelligent traffic analysis. IEEE Trans. Cybern. 2019, 50, 3081–3093. [Google Scholar] [CrossRef] [PubMed]
  7. Xiong, X.L.; Yang, L.; Zhao, G.S. Effectiveness evaluation model of moving target defense based on system attack surface. IEEE Access 2019, 7, 9998–10014. [Google Scholar] [CrossRef]
  8. Vinayakumar, R.; Soman, K.; Poornachandran, P. Evaluation of recurrent neural network and its variants for intrusion detection system (IDS). Int. J. Inf. Syst. Model. Des. (IJISMD) 2017, 8, 43–63. [Google Scholar] [CrossRef]
  9. Borkar, A.; Donode, A.; Kumari, A. A survey on Intrusion Detection System (IDS) and Internal Intrusion Detection and protection system (IIDPS). In Proceedings of the 2017 International conference on inventive computing and informatics (ICICI), Coimbatore, India, 23–24 November 2017; pp. 949–953. [Google Scholar]
  10. Gopalakrishnan, T.; Ruby, D.; Al-Turjman, F.; Gupta, D.; Pustokhina, I.V.; Pustokhin, D.A.; Shankar, K. Deep learning enabled data offloading with cyber attack detection model in mobile edge computing systems. IEEE Access 2020, 8, 185938–185949. [Google Scholar] [CrossRef]
  11. Patel, A.; Roy, S.; Baldi, S. Wide-Area Damping Control Resilience towards Cyber-Attacks: A Dynamic Loop Approach. IEEE Trans. Smart Grid 2021, 12, 3438–3447. [Google Scholar] [CrossRef]
  12. Nilă, C.; Apostol, I.; Patriciu, V. Machine learning approach to quick incident response. In Proceedings of the 2020 13th International Conference on Communications (COMM), Bucharest, Romania, 18–20 June 2020; pp. 291–296. [Google Scholar]
  13. Cybenko, G.; Raz, G.M. Large-scale analogue measurements and analysis for cyber-security. In Data Science For Cyber-Security; World Scientific: Singapore, 2019; pp. 227–250. [Google Scholar]
  14. Sharafaldin, I.; Lashkari, A.H.; Ghorbani, A.A. Toward generating a new intrusion detection dataset and intrusion traffic characterization. ICISSp 2018, 1, 108–116. [Google Scholar]
  15. Sharafaldin, I.; Lashkari, A.H.; Ghorbani, A.A. A detailed analysis of the cicids2017 data set. In International Conference on Information Systems Security and Privacy; Springer: Berlin/Heidelberg, Germany, 2018; pp. 172–188. Available online: https://www.unb.ca/cic/datasets/ids-2017.html (accessed on 1 December 2021).
  16. Anderson, B.; McGrew, D. Machine learning for encrypted malware traffic classification: Accounting for noisy labels and non-stationarity. In Proceedings of the 23rd ACM SIGKDD International Conference on Knowledge Discovery and Data Mining, Halifax, NS, USA, 13–17 August 2017; pp. 1723–1732. [Google Scholar]
  17. Yu, Y.; Bian, N. An intrusion detection method using few-shot learning. IEEE Access 2020, 8, 49730–49740. [Google Scholar] [CrossRef]
  18. Ahmed, S.; Lee, Y.; Hyun, S.H.; Koo, I. Mitigating the impacts of covert cyber attacks in smart grids via reconstruction of measurement data utilizing deep denoising autoencoders. Energies 2019, 12, 3091. [Google Scholar] [CrossRef] [Green Version]
  19. Al-Abassi, A.; Karimipour, H.; Dehghantanha, A.; Parizi, R.M. An ensemble deep learning-based cyber-attack detection in industrial control system. IEEE Access 2020, 8, 83965–83973. [Google Scholar] [CrossRef]
  20. Jiang, W.; Chen, Z.; Xiang, Y.; Shao, D.; Ma, L.; Zhang, J. SSEM: A novel self-adaptive stacking ensemble model for classification. IEEE Access 2019, 7, 120337–120349. [Google Scholar] [CrossRef]
  21. Nancy, P.; Muthurajkumar, S.; Ganapathy, S.; Kumar, S.S.; Selvi, M.; Arputharaj, K. Intrusion detection using dynamic feature selection and fuzzy temporal decision tree classification for wireless sensor networks. IET Commun. 2020, 14, 888–895. [Google Scholar] [CrossRef]
  22. Li, L.; Yu, Y.; Bai, S.; Cheng, J.; Chen, X. Towards effective network intrusion detection: A hybrid model integrating gini index and GBDT with PSO. J. Sens. 2018, 2018, 1578314. [Google Scholar] [CrossRef] [Green Version]
  23. Oliveira, N.; Praça, I.; Maia, E.; Sousa, O. Intelligent cyber attack detection and classification for network-based intrusion detection systems. Appl. Sci. 2021, 11, 1674. [Google Scholar] [CrossRef]
  24. Ye, J.; Cheng, X.; Zhu, J.; Feng, L.; Song, L. A DDoS attack detection method based on SVM in software defined network. Secur. Commun. Netw. 2018, 2018, 9804061. [Google Scholar] [CrossRef]
  25. Sahoo, K.S.; Tripathy, B.K.; Naik, K.; Ramasubbareddy, S.; Balusamy, B.; Khari, M.; Burgos, D. An evolutionary SVM model for DDOS attack detection in software defined networks. IEEE Access 2020, 8, 132502–132513. [Google Scholar] [CrossRef]
  26. Kachavimath, A.V.; Nazare, S.V.; Akki, S.S. Distributed Denial of Service Attack Detection using Naïve Bayes and K-Nearest Neighbor for Network Forensics. In Proceedings of the 2020 2nd International Conference on Innovative Mechanisms for Industry Applications (ICIMIA), Bangalore, India, 5–7 March 2020; pp. 711–717. [Google Scholar]
  27. Tuan, T.A.; Long, H.V.; Son, L.H.; Kumar, R.; Priyadarshini, I.; Son, N.T.K. Performance evaluation of Botnet DDoS attack detection using machine learning. Evol. Intell. 2020, 13, 283–294. [Google Scholar] [CrossRef]
  28. Gu, P.; Khatoun, R.; Begriche, Y.; Serhrouchni, A. k-Nearest Neighbours classification based Sybil attack detection in Vehicular networks. In Proceedings of the 2017 Third International Conference on Mobile and Secure Services (MobiSecServ), Miami Beach, FL, USA, 11–12 February 2017; pp. 1–6. [Google Scholar]
  29. Besharati, E.; Naderan, M.; Namjoo, E. LR-HIDS: Logistic regression host-based intrusion detection system for cloud environments. J. Ambient Intell. Humaniz. Comput. 2019, 10, 3669–3692. [Google Scholar] [CrossRef]
  30. Iadarola, G.; Martinelli, F.; Mercaldo, F.; Santone, A. Towards an interpretable deep learning model for mobile malware detection and family identification. Comput. Secur. 2021, 105, 102198. [Google Scholar] [CrossRef]
Figure 1. The overall process of the network attack detection framework through the proposed high-speed noise detection and data purification methodology.
Applsci 12 01011 g001
Figure 2. Detailed procedure flow chart for the proposed network attack detection and noise data removal.
Applsci 12 01011 g002
Figure 3. Attack classification accuracy of the proposed method and the ideal method when the size of the pure dataset is 20,000.
Applsci 12 01011 g003
Figure 4. Training time per unit data input of the proposed method and the ideal method when the size of the pure dataset is 20,000.
Applsci 12 01011 g004
Figure 5. Attack classification accuracy of the proposed and ideal methods when the size of the pure dataset is 20,000 and the proportion of attack data is reduced.
Applsci 12 01011 g005
Figure 6. Training time per unit data input of the proposed method and the ideal method when the size of the pure dataset is 20,000 and the proportion of attack data is reduced.
Applsci 12 01011 g006
Figure 7. Attack classification accuracy of the proposed method and the ideal method when the size of the pure dataset is 40,000.
Applsci 12 01011 g007
Figure 8. Training time per unit data input of the proposed method and the ideal method when the size of the pure dataset is 40,000.
Applsci 12 01011 g008
Figure 9. Attack classification accuracy of the proposed and ideal methods when the size of the pure dataset is 40,000 and the proportion of attack data is reduced.
Applsci 12 01011 g009
Figure 10. Training time per unit data input of the proposed method and the ideal method when the size of the pure dataset is 40,000 and the proportion of attack data is reduced.
Applsci 12 01011 g010
Table 1. Dataset Overview.
Data TypeQuantity
Total Data225,711
Normal data97,686 (43.28%)
Attack data128,025 (56.72%)
Filtered attack data25,605
Features77
Publisher’s Note: MDPI stays neutral with regard to jurisdictional claims in published maps and institutional affiliations.

