Article

Mechanical Characteristics of Pre-Peak Unloading Damage and Mechanisms of Reloading Failure in Red Sandstone

1
School of Resource & Environment and Safety Engineering, Hunan University of Science and Technology, Xiangtan 411201, China
2
Work Safety Key Lab on Prevention and Control of Gas and Roof Disasters for Southern Goal Mines, Hunan University of Science and Technology, Xiangtan 411201, China
3
Hunan Provincial Key Laboratory of Safe Mining Techniques of Coal Mines, Hunan University of Science and Technology, Xiangtan 411201, China
*
Author to whom correspondence should be addressed.
Appl. Sci. 2022, 12(24), 13046; https://doi.org/10.3390/app122413046
Submission received: 8 November 2022 / Revised: 14 December 2022 / Accepted: 16 December 2022 / Published: 19 December 2022
(This article belongs to the Special Issue Mechanics, Damage Properties and Impacts of Coal Mining)

Abstract

:
The mining of deep coal resources occurs in a high-stress geological environment as well as an engineering environment of rock excavation and unloading. Research on the re-bearing capacity characteristics and damage mechanism of rock masses damaged by peak front unloading is critical in revealing the destabilization and rupture law of deep rock bodies. The triaxial pre-peak unloading point was controlled to prepare damaged sandstone specimens, and the RMT-150C rock mechanics test loading system and the AEwin USB-type acoustic emission monitor were used to perform uniaxial reloading tests on the pre-peak unloading-damaged sandstone and to monitor the acoustic emission signals during the rupture process. Among them, the peak front unloading point was set to 40%, 45%, 50%, 55%, 60%, 65%, 70%, 75%, 80%, 85%, and 90% of the peak strength at 10 MPa of the surrounding pressure for a total of 11 working conditions. The test results show that: (1) The degree of unloading before the peak controls the uniaxial reload deformation characteristics of sandstone. The higher the unloading point, the faster the deformation of the rock sample, even directly into the crack instability extension stage, and the sandstone deformation characteristics transform from plastic—elastic to elastic—viscous. (2) The cumulative energy characteristics of the 40% to 60% sandstone at the unloading point are comparable to those of the complete sandstone and are separated into smooth, steady growth, and secondary smooth phases. The acoustic emission energy characteristics of the 65% and 70% sandstone at the unloading point are mostly focused on during the crack expansion stage. The sandstone’s acoustic emission energy characteristics exhibit a “double peak” occurrence at 75% of the unloading point. The cumulative energy characteristics of the 80% to 90% sandstone at the unloading point reveal a “stepped” rise. (3) Sandstone’s pre-peak unloading rupture morphology influences the reload damage characteristics: 40% to 70% of the specimens at the unloading point exhibit “Y”-type double-slope shear damage features. The predominant cause of specimen damage in 75% of the specimens at the unloading point is secondary primary cracks based on the pre-peak tensile rupture pattern. The damage path of 80% to 90% of the specimens at the point of unloading occurs in shear damage along the pre-peak unloading rupture pattern. (4) A closed crack mechanics analysis model under uniaxial reload was established, and the basic solution of pseudo-force for fine microcracks subjected to far-field stress, the stress intensity factor at the crack tip, and the crack fracture angle were theoretically derived. Furthermore, the relationship between the fracture angle θ of rock compression-shear cracks, the crack angle β, and the friction coefficient f at the crack surface was clarified.

1. Introduction

The excavation and unloading of a roadway will invariably produce stress concentration in the surrounding rock in the deep high-stress environment. With increasing stress, the stress state of the rock surrounding a tunnel surpasses the ultimate bearing capacity of the rock body, resulting in fracture. The stress condition of the radial depth of the rock surrounding the roadway is close to, but not more than, the ultimate strength of the rock body to cause damage, and this portion of the unloading damage surrounding the rock body becomes the roadway’s major bearing structure. As a result, it is critical to investigate the re-bearing capability and damage mechanism of rock masses injured by peak front unloading [1,2].
To give full play to the strengthening effect of supporting structures, and to ensure the safe exploitation and utilization of underground coal resources and space, the mechanical properties of unloaded rock masses have received increasing attention [3,4,5,6,7]. Zhao et al. [8] found that the expansion spring back phenomenon occurs when a rock mass is unloaded on one side. Qian et al. [9] discovered that the interaction between cracks during confining pressure unloading is more sensitive than that during axial pressure unloading, and that crack weakening during confining pressure unloading plays a leading role in the deformation of the surrounding rock. Li et al. [10] studied the influence of intermediate principal stress on rock strength and failure mode under true triaxial unloading conditions by unloading the minimum principal stress. Meng et al. [11] analyzed the hysteresis effect of the rock stress—strain curve through cyclic loading and unloading tests under different confining pressures. Gong et al. [12] examined the strain rate effect of the impact compression strength of red sandstone via impact compression testing through red sandstone under the unloading condition of confining pressure. In a study by Xu et al. [13], based on the generalized Hooke’s law, a method for determining Poisson’s ratio of rock samples was found through changing axial stress and unloading lateral stress testing. Acoustic emission (AE) is an elastic wave generated by the initiation and expansion of cracks in rock. Acoustic emissions generated by different fracture forms in unloaded rock have different characteristics. Therefore, the changes in crack growth forms in unloaded rock can be studied according to the acoustic emission characteristics. Feng et al. [14] simulated rock mass excavation under high-stress conditions and found that there was instantaneous rebound when the minimum principal stress was unloaded, and the acoustic emission ringing times increased significantly with the increase in the second principal stress. Zhou et al. [15] used the hierarchical clustering method to divide AE events into tensile failure and shear failure, and studied the effects of unloading rate, confining pressure, and unloading time on the tension—shear ratio (the ratio of tensile failure to shear failure). Song et al. [16] studied the evolution characteristics of AE in the process of brittle rock failure under complex stress paths and found that the AE count rate of unloading failure was much higher than that of loading failure. Hou et al. [17] believed that the simultaneous occurrence of UHF, HF, MF, and LF in the AE power spectrum could be used as the basis for judging rock unloading tests.
Under the action of excavation and unloading, roadway surrounding rock masses at a certain depth range have varying degrees of unloading damage. In the process of en-gineering operations, this part of the unloading-damaged rock mass will bear vari-ous loads for lengthy periods, and the reloading mechanical properties of the un-load-ing-damaged rock mass will directly affect the stability and safety of engineering rock masses [18]. Based on current research results, the relevant studies have mainly focused on an analysis of the influence of the excavation unloading process on rock mechanical prop-erties. The common unloading mechanical test idea is as follows. First, the rock sample is loaded to a certain three-way stress state, and then the stress adjustment in the excavation process is simulated. Various stress paths are adopted to unload the rock sample until it is damaged. The deformation and failure characteris-tics of the rock during the unloading process are analyzed closely. In general, previous studies on the mechanical characteristics of excavation and the unloading of various rocks have been systematic, providing a solid theoretical basis for the stability control of roadways. However, a large number of engineering practices have shown that the damaged rock mass under un-loading is the main bearing structure when the roadway is put into use. At present, the length of the conventional support forms of the mine anchors and cables is difficult to anchor into the original stressed rock mass. Whether it is the end anchor or the whole anchor, its anchoring section is in the damaged rock mass under unloading. Therefore, it is extremely valuable to study the following two aspects to strengthen the effect of sup-porting structures: (1) the mechanical properties and reloading failure mechanism of damaged rock masses with different degrees of pre-peak unloading; and (2) the collabo-rative bearing mechanism of supporting structures and damaged rock masses under pre-peak unloading. On this basis, this pa-per closely focuses on the mechanical properties of damaged rock masses with differ-ent degrees of pre-peak unloading along with the reloading failure mechanism. First, the red sandstone samples are loaded to the state of hydrostatic pressure. Next, the triaxial unloading test is used to prepare the unloadingdamaged samples with differ-ent unloading quantities, and the uniaxial loading test is then carried out. The me-chanical properties and failure mechanism of unloading-damaged rock masses under reloading are analyzed.

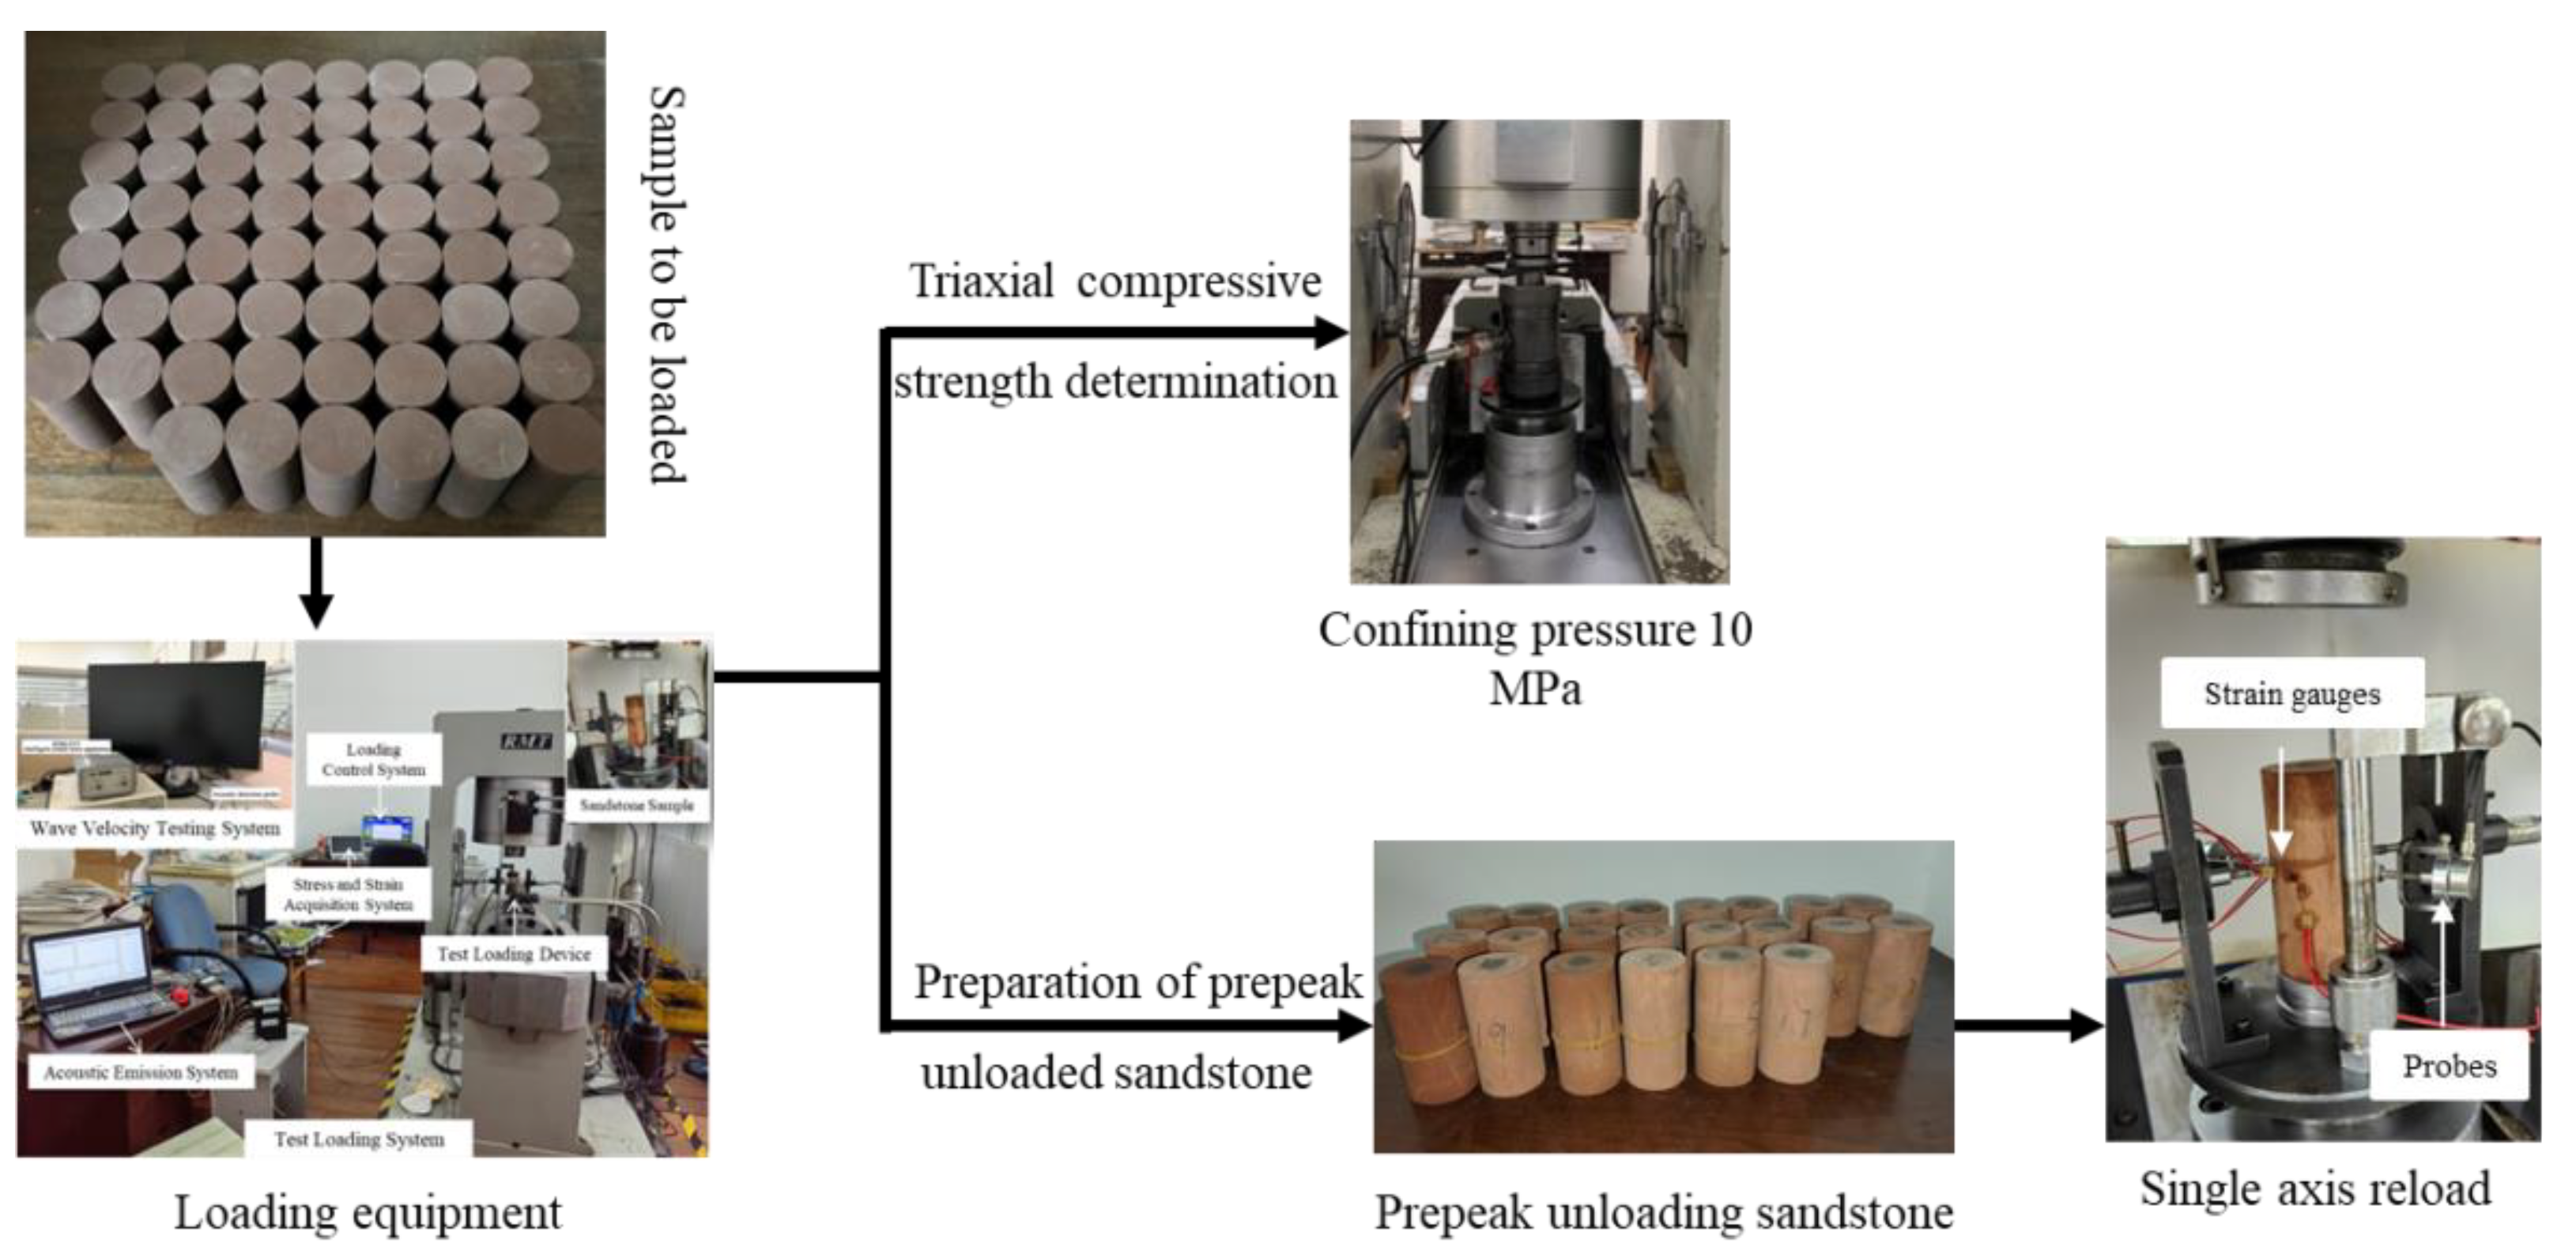
2. Experimental Procedure and Protocol Design

In this paper, considering the difficulties in sampling natural unloading-damaged rocks and managing their degree of unloading, cylindrical sandstone specimens with a diameter of 50 mm and a height of 100 mm were selected. The damaged sandstone specimens with different degrees of peak front unloading were prepared by screening with close wave velocities using the RSM-SY5 acoustic wave tester. The test operation procedure is shown in Figure 1.

2.1. Determination of Triaxial Compressive Strength under Specific Circumferential Pressure

First, a 10 MPa perimeter pressure triaxial compression test was conducted, the loading rate of both the perimeter pressure and axial pressure was 0.05 MPa/s, loaded simultaneously, and the axial pressure was continuously loaded until the specimen was damaged when the perimeter pressure was loaded to the preset value. To reduce the effect of dispersion, three sandstones were triaxially loaded, and the compressive strengths of the intact sandstones were obtained as 131.95 MPa, 131.56 MPa, and 131.28 MPa, with an average of 132.6 MPa.

2.2. Preparation of Pre-Peak Unloading-Damaged Sandstone

To simulate the unloading process of roadway excavation under a deep, highly stressful environment as closely as possible, the sandstone specimen was first loaded to the hydrostatic pressure state of σ1 = σ2 = σ3 = 20 MPa at the rate of 0.05 MPa/s. Then, the unloading of the surrounding pressure to 10 MPa was started at the rate of 0.05 MPa/s [19], which was used to simulate the unloading of the roadway excavation rock body via the surrounding pressure. The axial pressure was continuously loaded to the unloading point to simulate the in-crease in support pressure during tunnel excavation. According to the conclusion obtained from [20], after the rock load is loaded to 40% of the peak strength, new cracks appear inside the specimen and damage occurs. The axial pressure unloading point was determined to be 40%, 45%, 50%, 55%, 60%, 65%, 70%, 75%, 80%, 85%, and 90% of the triaxial peak strength at 10 MPa perimeter pressure, for a total of 11 working conditions. Three specimens were taken for each working condition, and 33 unloading-damaged specimens were cumulatively obtained.

2.3. Uniaxial Re-Load Test of Damaged Rock Samples

A uniaxial reload test was conducted on the RMT-150C rock mechanics test system from the Hunan University of Science and Technology with the stroke control loading method and the stroke rate set at 0.001 mm/s. The axial and transverse strains were measured using BX120-3AA strain gauges and the DH3816N static stress–strain testing and analysis system, with the strain gauges in vertical and horizontal groups. One group of strain gauges was applied to the center of the damaged sandstone, and one group was applied to the left and right sides of the rock sample. To monitor the acoustic emission signal when the damaged sandstone was reloaded, acoustic emission probes were pasted on both sides of the damaged sandstone with the appropriate amount of coupling agent before loading and staggered with the strain gauges. The acoustic emission probes were connected to the AEwin USB acoustic emission system channel by number to collect the acoustic emission signal generated by the reloading process of the damaged sandstone in real-time.

2.4. Uniaxial Loading Test on Intact Sandstone

Another group of intact sandstones was taken for a uniaxial loading test, and the loading method, strain, and acoustic emission signal acquisition were the same as in the uniaxial reload test of the damaged rock samples. The difference in damage deformation between the natural undamaged rock samples and the damaged rock samples was compared.

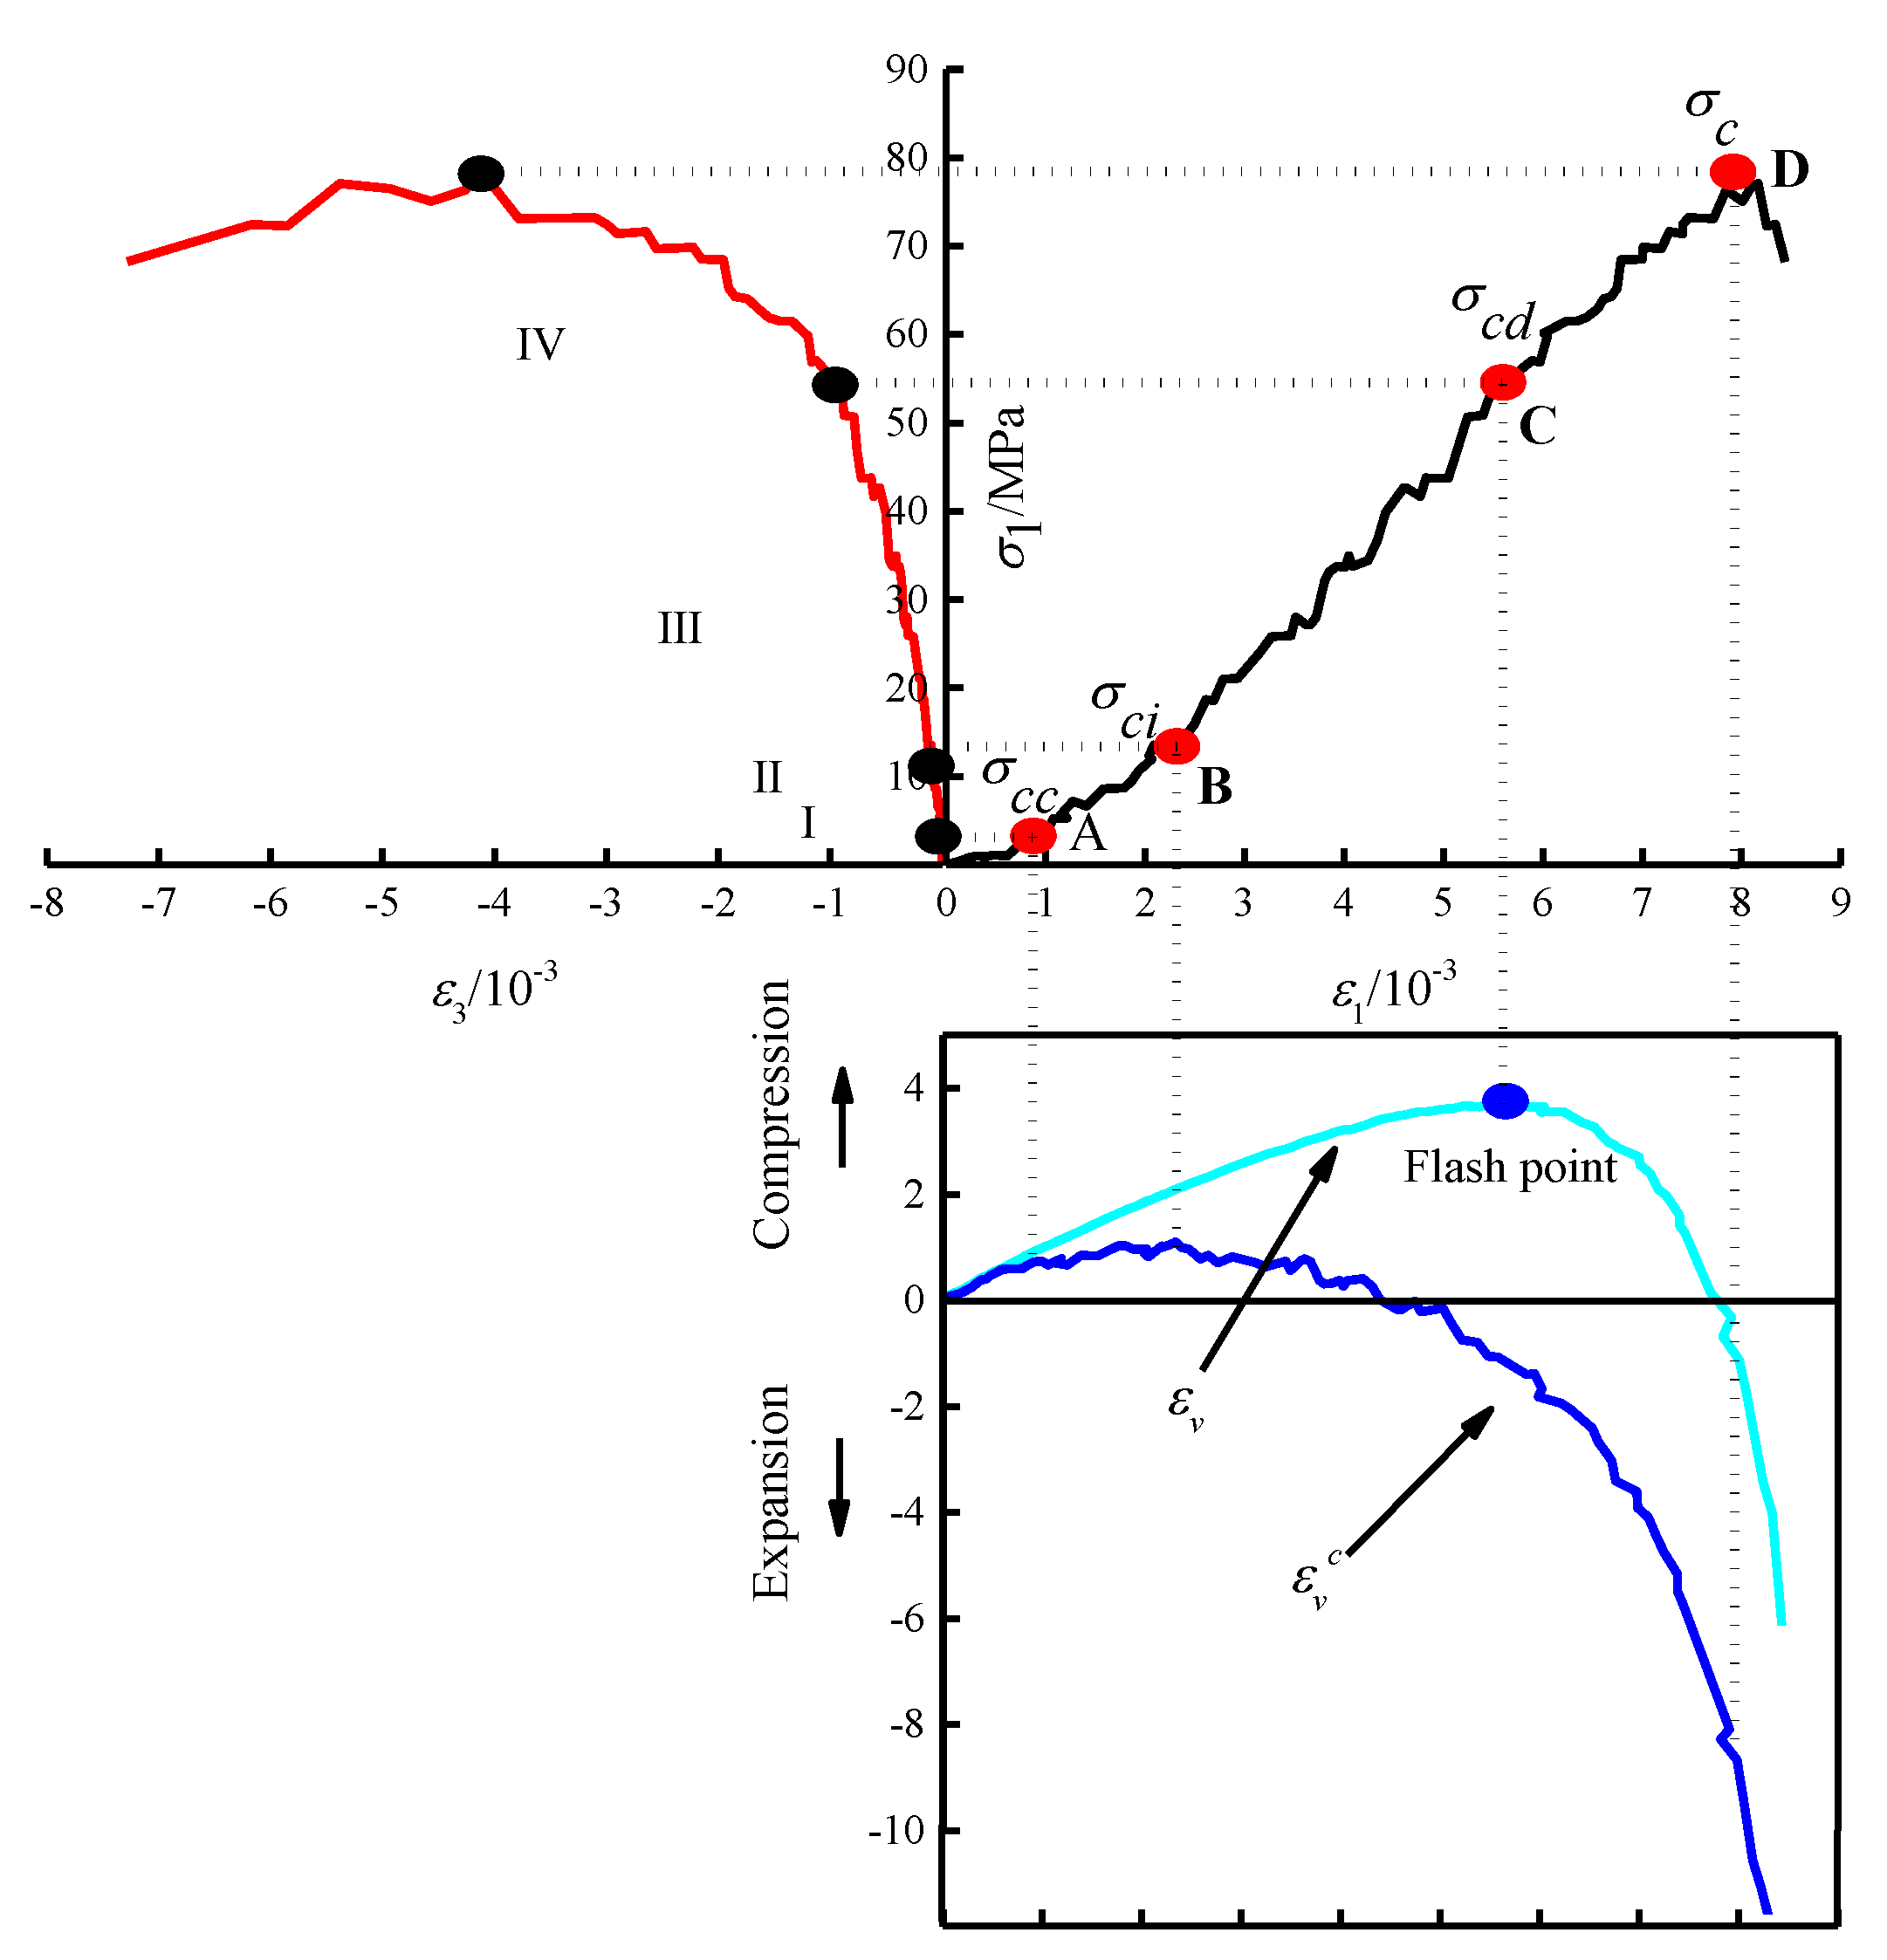
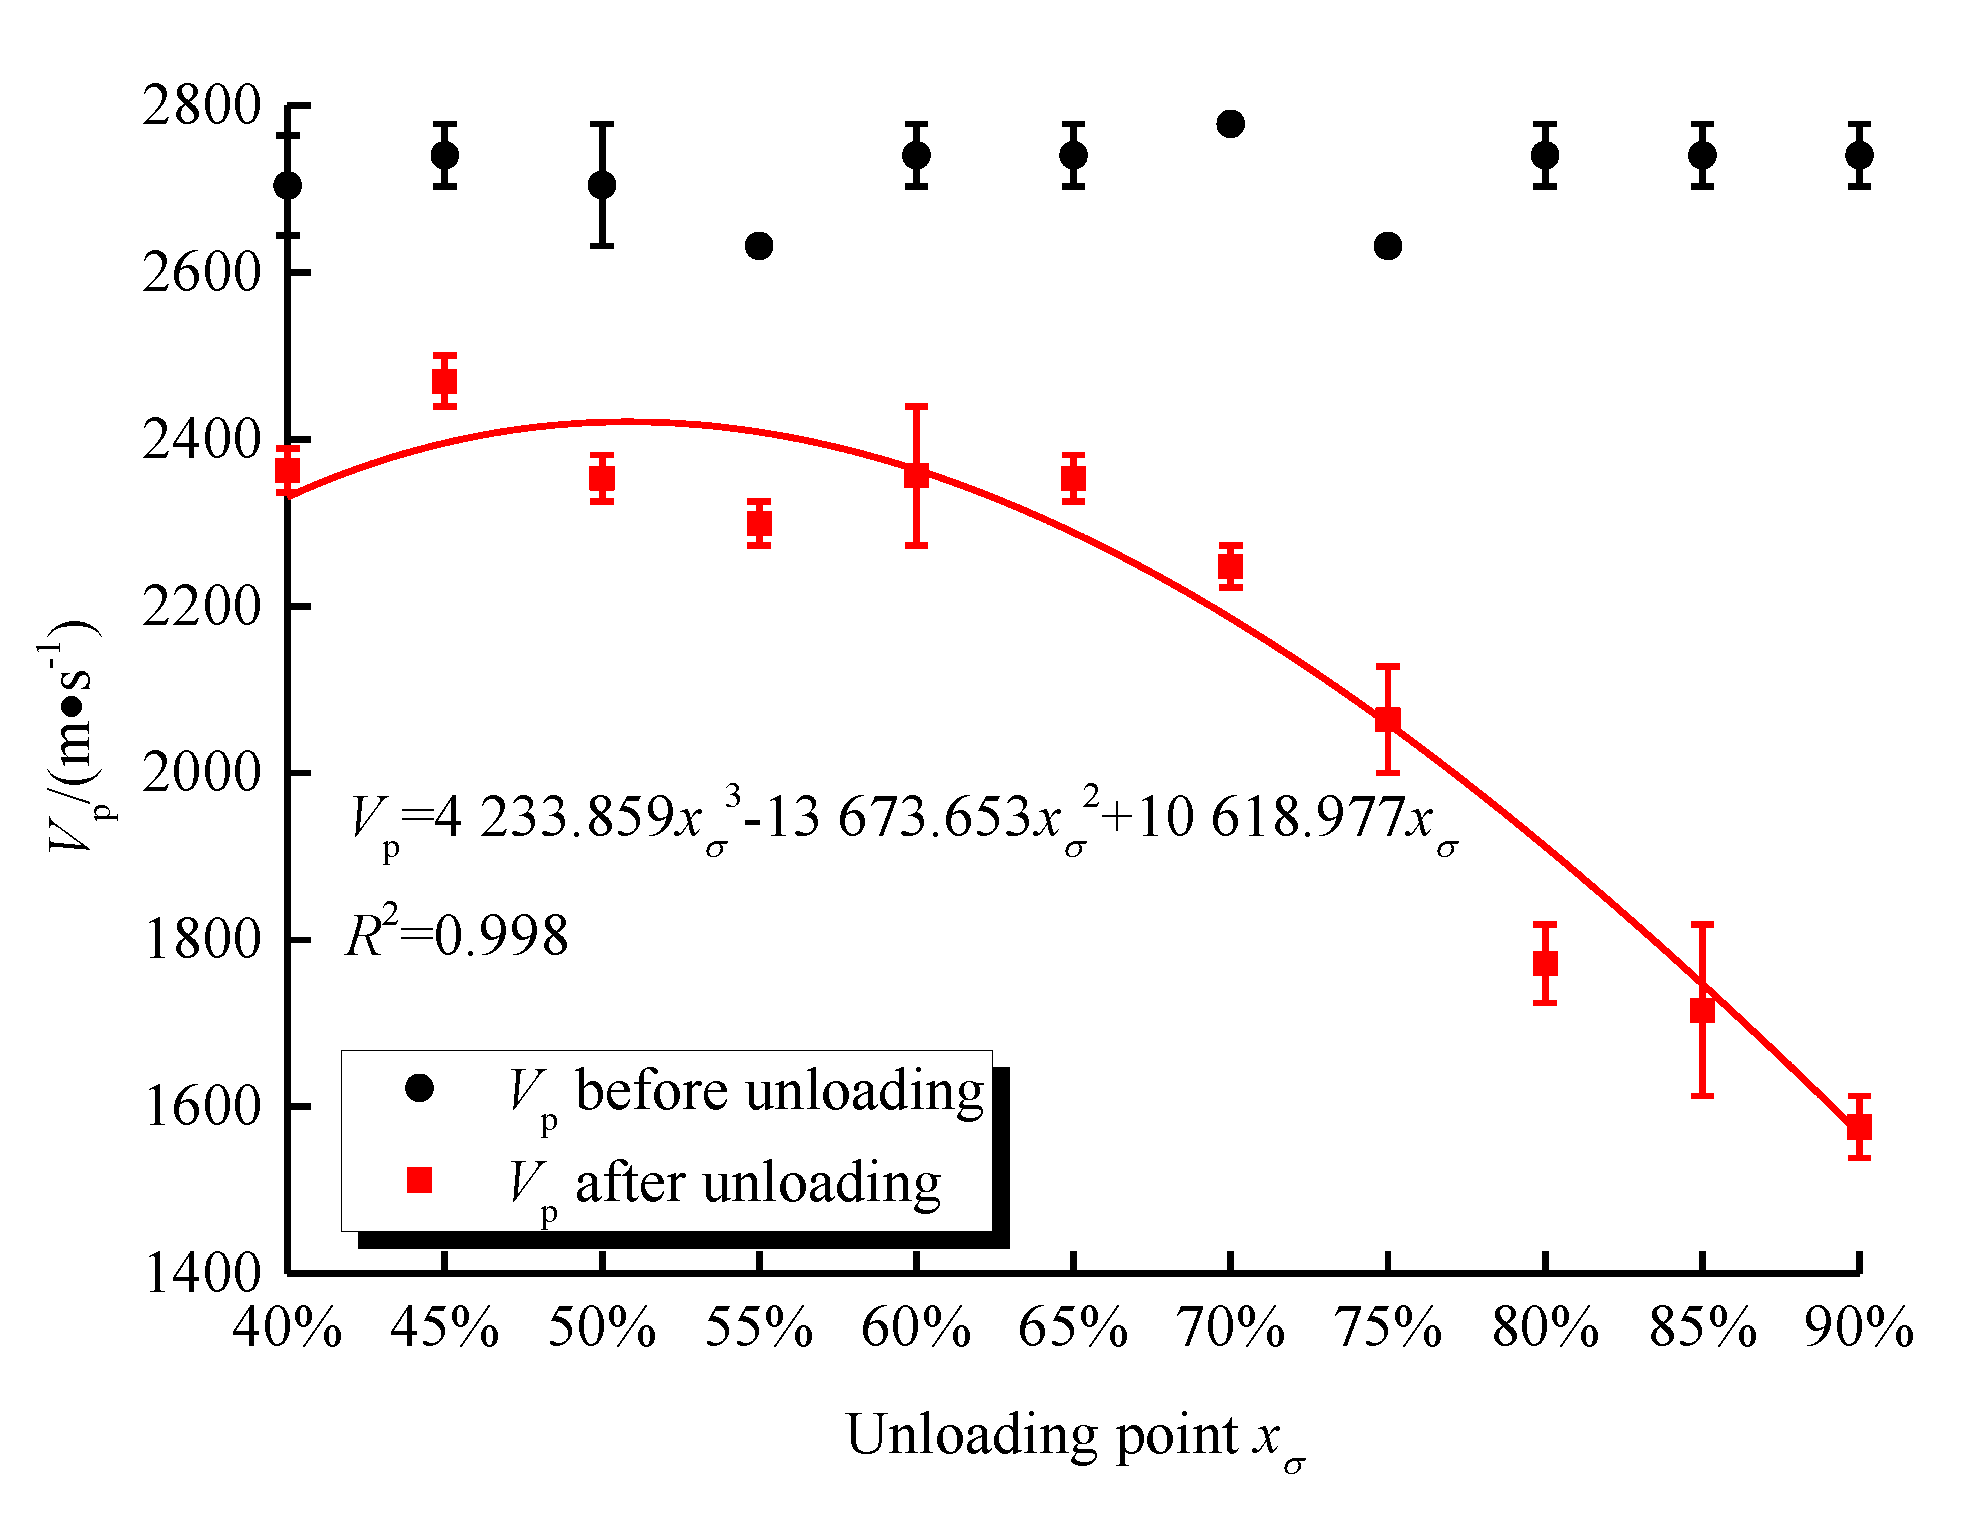
3. Identification of Feature Intensity

The whole process of the deformation of rock specimens under uniaxial loading can be roughly divided into five stages: pore compacting stage, linear elastic deformation stage, crack stable expansion stage, crack unstable expansion stage, and post-peak deformation stage, of which, the pore compacting stage and linear elastic deformation stage rocks do not produce damage. It is usually considered that the beginning of the crack stable expansion stage is the starting point of damage produced within the rock. Therefore, accurate identification of the characteristic strength is the focus when analyzing the degree of damage in sandstone.
The crack volumetric strain method [21] can accurately determine the characteristic strength of rocks. For uniaxial rock mechanics tests, volumetric strain εv can be calculated from εaxial and εlateral measured in the test as follows:
ε v = ε a x i a l + 2 ε l a t e r a l
The crack volume strain εvc is the volume strain εv minus the elastic volume strain εve, which can be expressed as:
ε v c = ε v ε v e
where the elastic volume strain εve is the strain caused by the elastic deformation of the rock mass, which can be solved by the elastic modulus E and Poisson’s ratio μ through elastic mechanics as follows:
ε v e = 1 2 μ E σ 1
Bringing Equation (3) into Equation (2), the solution of the crack volume strain εvc is obtained as:
ε v c = ε v 1 2 μ E σ 1
The evolution curves of volume strain and fracture volume strain during the uniaxial loading stress–strain of intact sandstone were plotted based on the calculated results of Equations (1)–(4), as shown in Figure 2.
The principle of dividing the stress–strain curve by the fracture volume strain method is as follows:
(I) Pore compression and density stage (OA section): The primary crack closes slowly under axial load, with the axial strain dominating and the radial strain almost not generated; the compression rate of the crack volume strain decreases, and the point where the reduced rate tends to level off for the first time is point A. The stress level corresponding to point A is the crack closure strength σcc.
(II) Linear elastic deformation stage (AB section): The axial strain and the radial strain grow in an approximately linear pattern with the increase in stress; no nascent cracks are generated in this stage, and the crack volume strain is almost unchanged.
(III) Crack stable extension stage (BC section). After the loading exceeds point B, the crack inside the rock starts to sprout, and the point where the crack volume strain starts to tilt in the negative direction is point B. The stress level corresponding to point B is the crack initiation strength σci. Namely:
σ c i = σ ε v c max
(IV) Crack instability expansion stage (CD section): After the loading exceeds point C, the crack inside the rock expands rapidly, the dominant strain changes from the axial strain to the radial strain, leading to an inflection point in the volume strain curve, and the rock starts to enter the expansion stage, which is the C point and also the expansion point. The stress level corresponding to the C point is the damage strength (also called the expansion strength) σcd. Namely:
σ c d = σ ε v max
(V) Post-peak deformation stage (section after point D): In the post-peak stage, the rock penetration rupture surface is formed and the fracture volume strain expands violently until the specimen is destroyed. The stress corresponding to the beginning of this stage is the peak strength σc. Namely:
σ c = σ 1 max

4. Re-Bearing Capacity Characteristics of Damaged Sandstone

Combined with Figure 2, the characteristic strength of damaged sandstone can be theoretically calculated according to Equations (5)–(7). Table 1 lists the characteristic strengths of the damaged sandstone under uniaxial reloading at different peak front unloading points.

4.1. Damaged Sandstone Stress–Strain Characteristics

Figure 3 gives the uniaxial reload stress–strain comparison curves of the damaged sandstone. From the uniaxial reload characteristic curves of the rock samples, it can be seen that the sandstones damaged at different unloading points show three different deformation characteristics. When the stress increases to a certain value, the curve becomes a straight line, it then turns into a downward bending curve, like an S-shaped curve, and then falls instantly, showing the deformation characteristics of a plasticelastic–plastic body. After experiencing more than 75% of the peak strength damage of the rock sample curve, there is the beginning of a very small section of almost negligible straight line part, and then an inelastic curve part quickly appears and continues to creep, revealing the elastic–viscous body deformation characteristics.

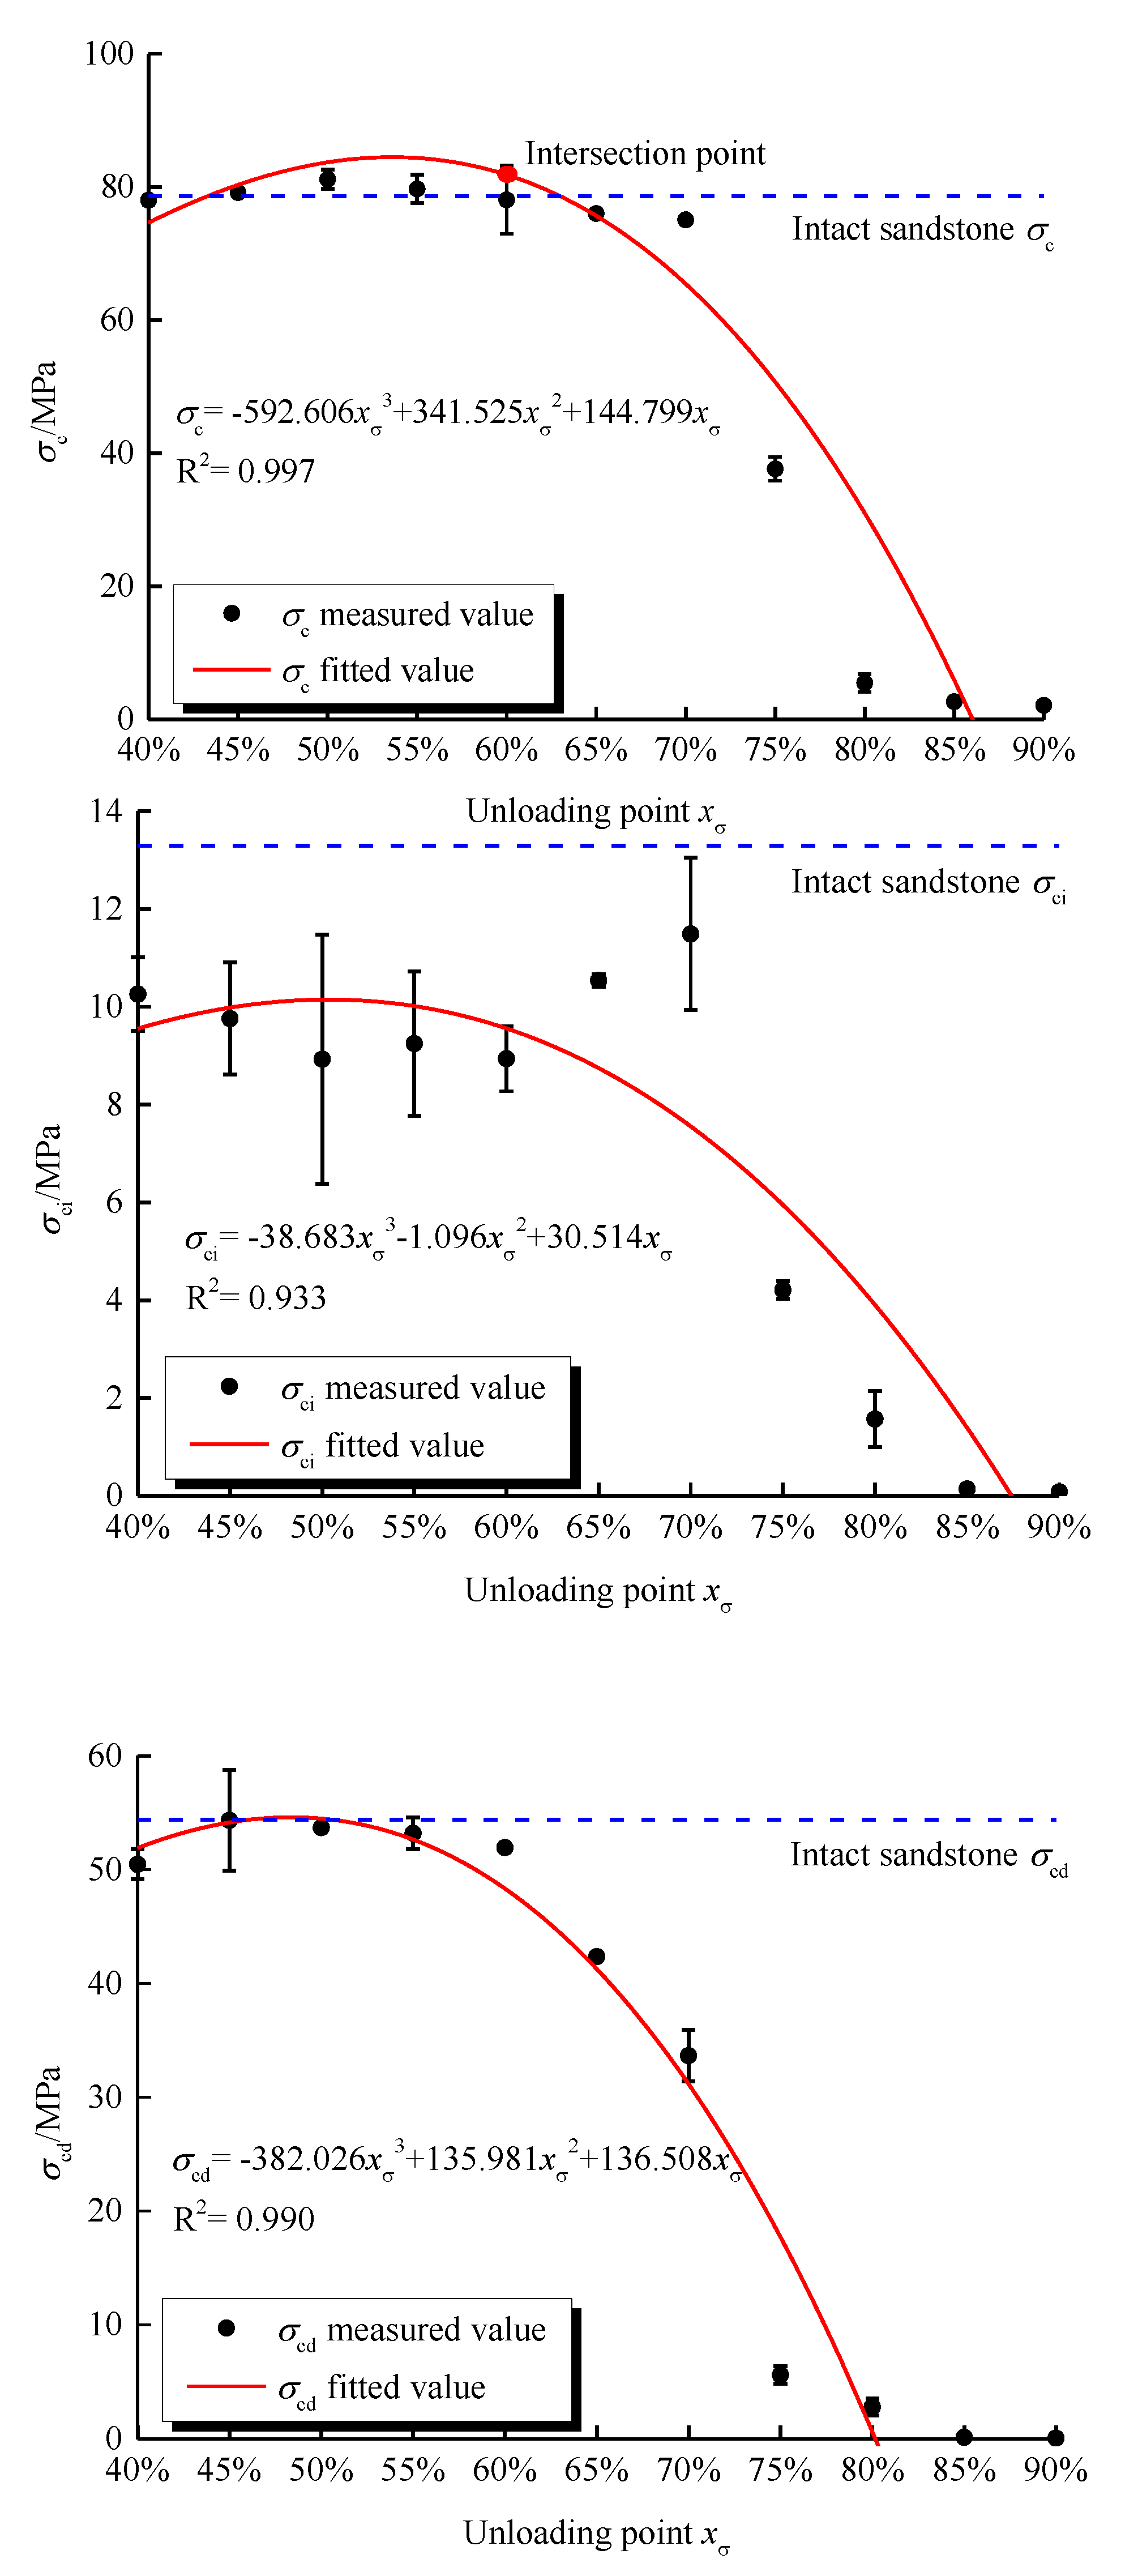
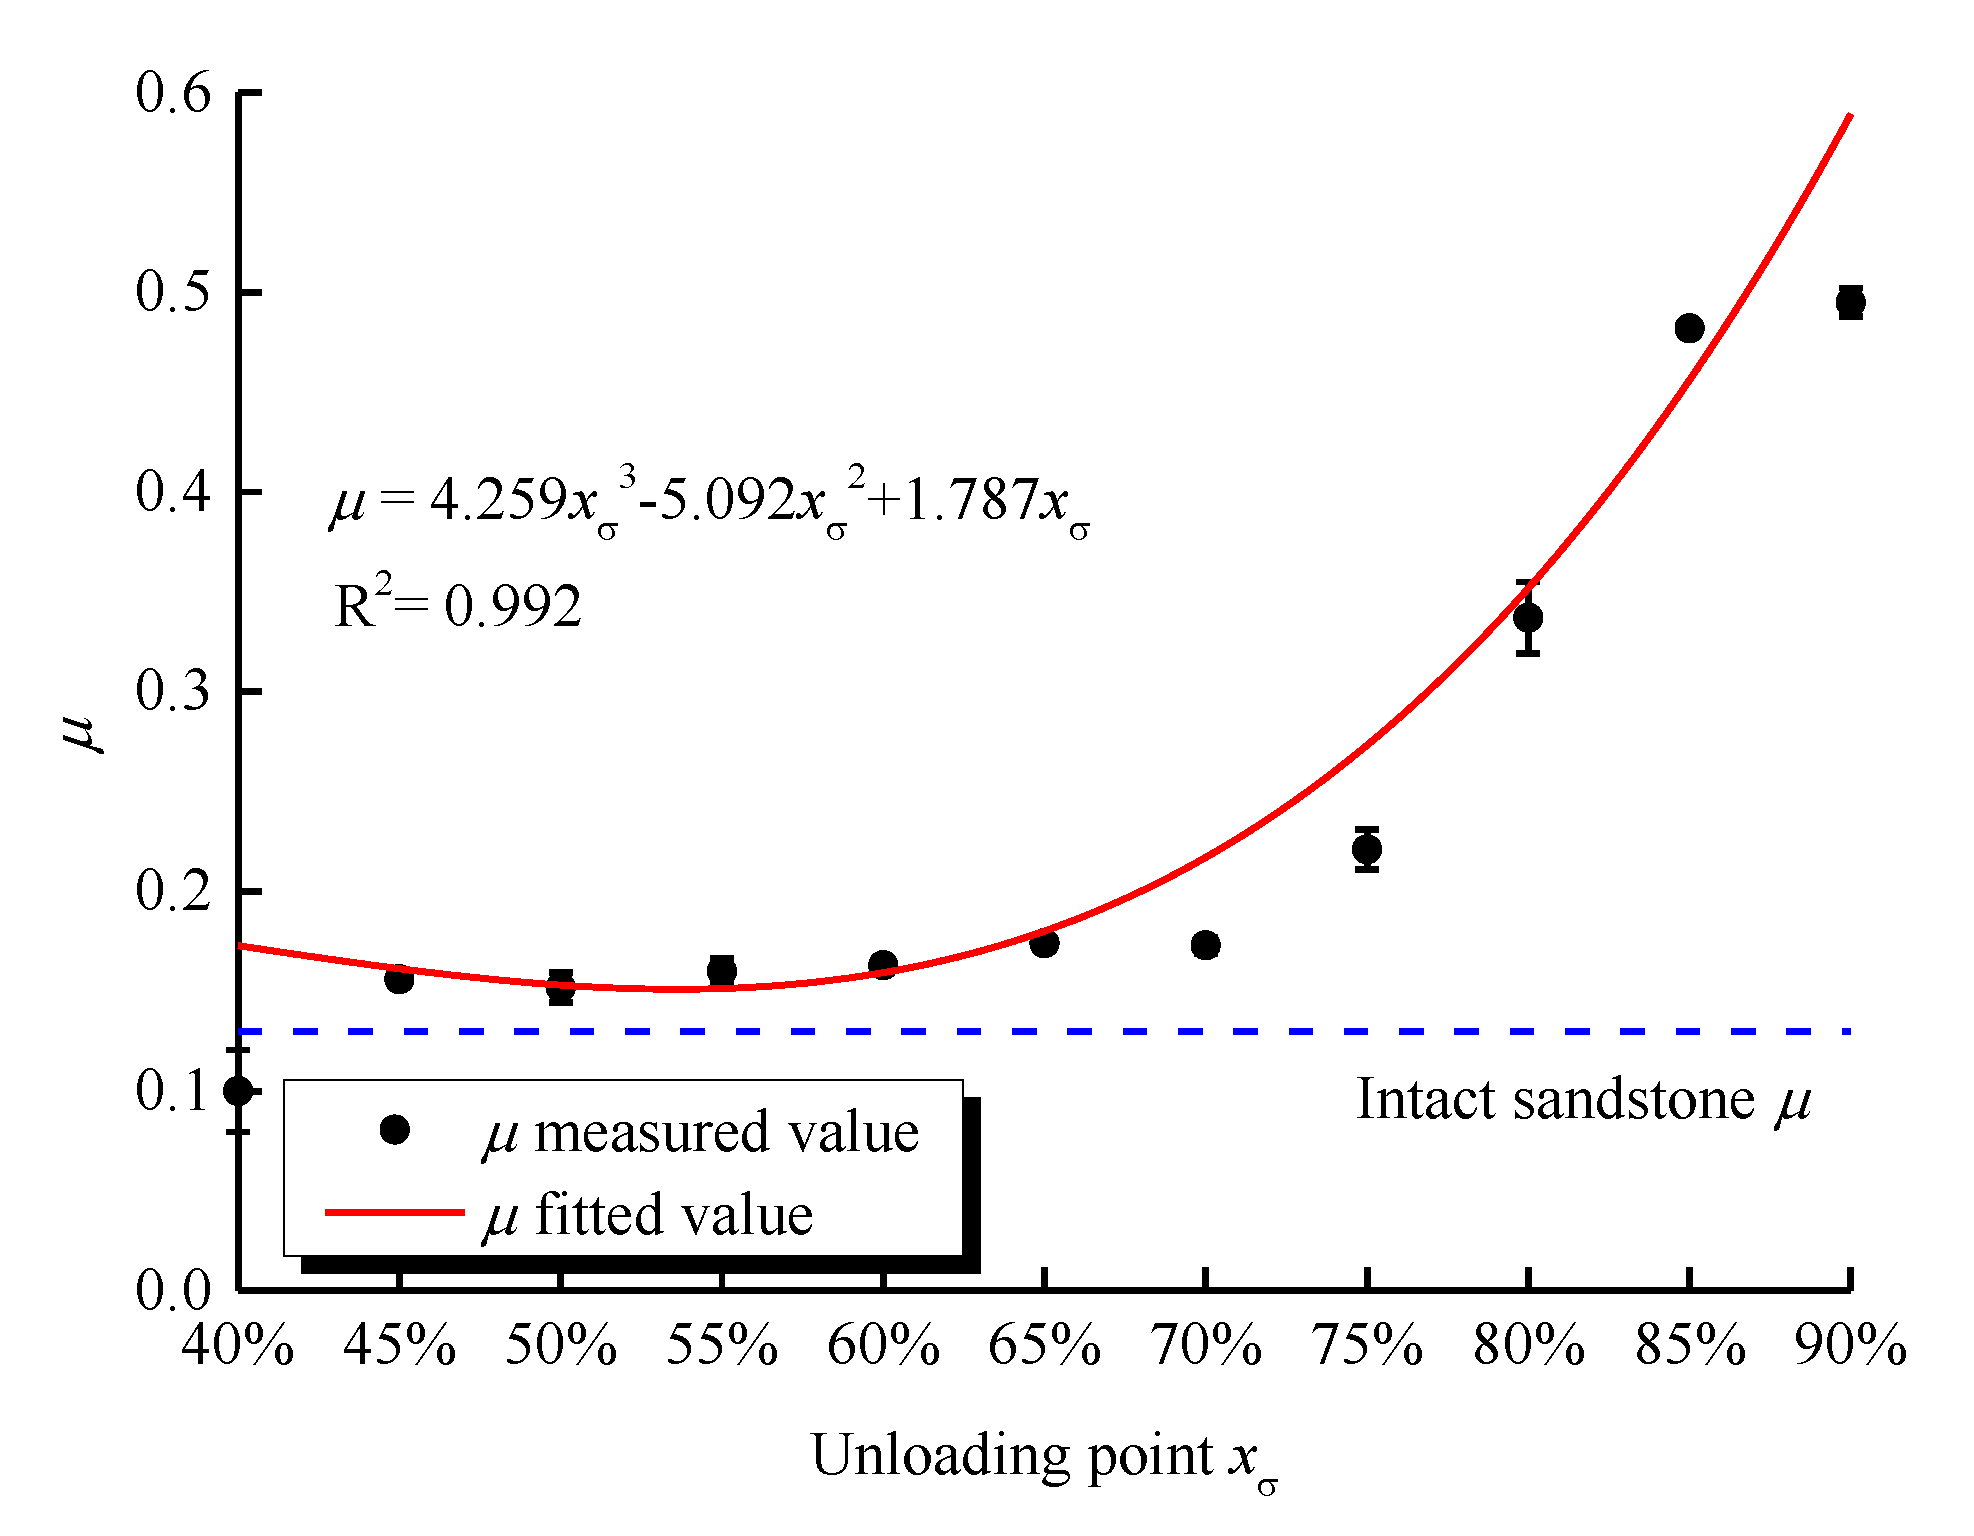
4.2. Damaged Sandstone Characteristic Stress and Poisson’s Ratio Analysis

Figure 4 shows the relationship curves between initiation stress σci, damage stress σcd, peak stress σc, and the unloading point, while Figure 5 shows the relationship curves between Poisson’s ratio μ and the unloading point. It can be found that, on the whole, there is an obvious decreasing trend of the crack initiation stress, damage stress, and peak stress of the damaged sandstone with the increase in the unloading point. However, before the unloading point of 70%, the peak stress curve experienced a small increase and then decrease, and the peak stresses at 40%, 45%, 50%, and 55% of the unloading point were larger than the peak stresses of the intact sandstone. In addition, the peak stresses were comparable to the peak stresses of the intact sandstone only at 60% of the unloading point, indicating that the sandstone had initial damage. The lower peak unloading point compressed the original fracture of the specimen, and the peak stresses appeared to increase instead of decrease. Compared with the intact sandstone, the crack initiation stress σci and the damage stress σcd at different unloading points of the damaged sandstone were reduced. It is noteworthy that the damage stress and crack initiation stress curves completely overlap at 85% and 90% of the unloading point, indicating that the highly damaged specimens have a higher degree of internal crack development and do not go through the crack stable extension stage during the uniaxial reloading process, but directly enter the crack unstable extension stage until damage. From the relationship curve between the Poisson’s ratio and the unloading point in Figure 5, it can be seen that, with the increase in the unloading point, the Poisson’s ratio is increasing, and at 85% and 90% of the unloading point, the Poisson’s ratio is close to 0.5. In elastic mechanics, a Poisson’s ratio of 0.5 indicates that the material is incompressible in the elastic stage, i.e., the damaged sandstone at 85% and 90% of the unloading point does not experience an elastic stage in the uniaxial reloading process, which is different from not experiencing a crack stable expansion phase, as mentioned above.

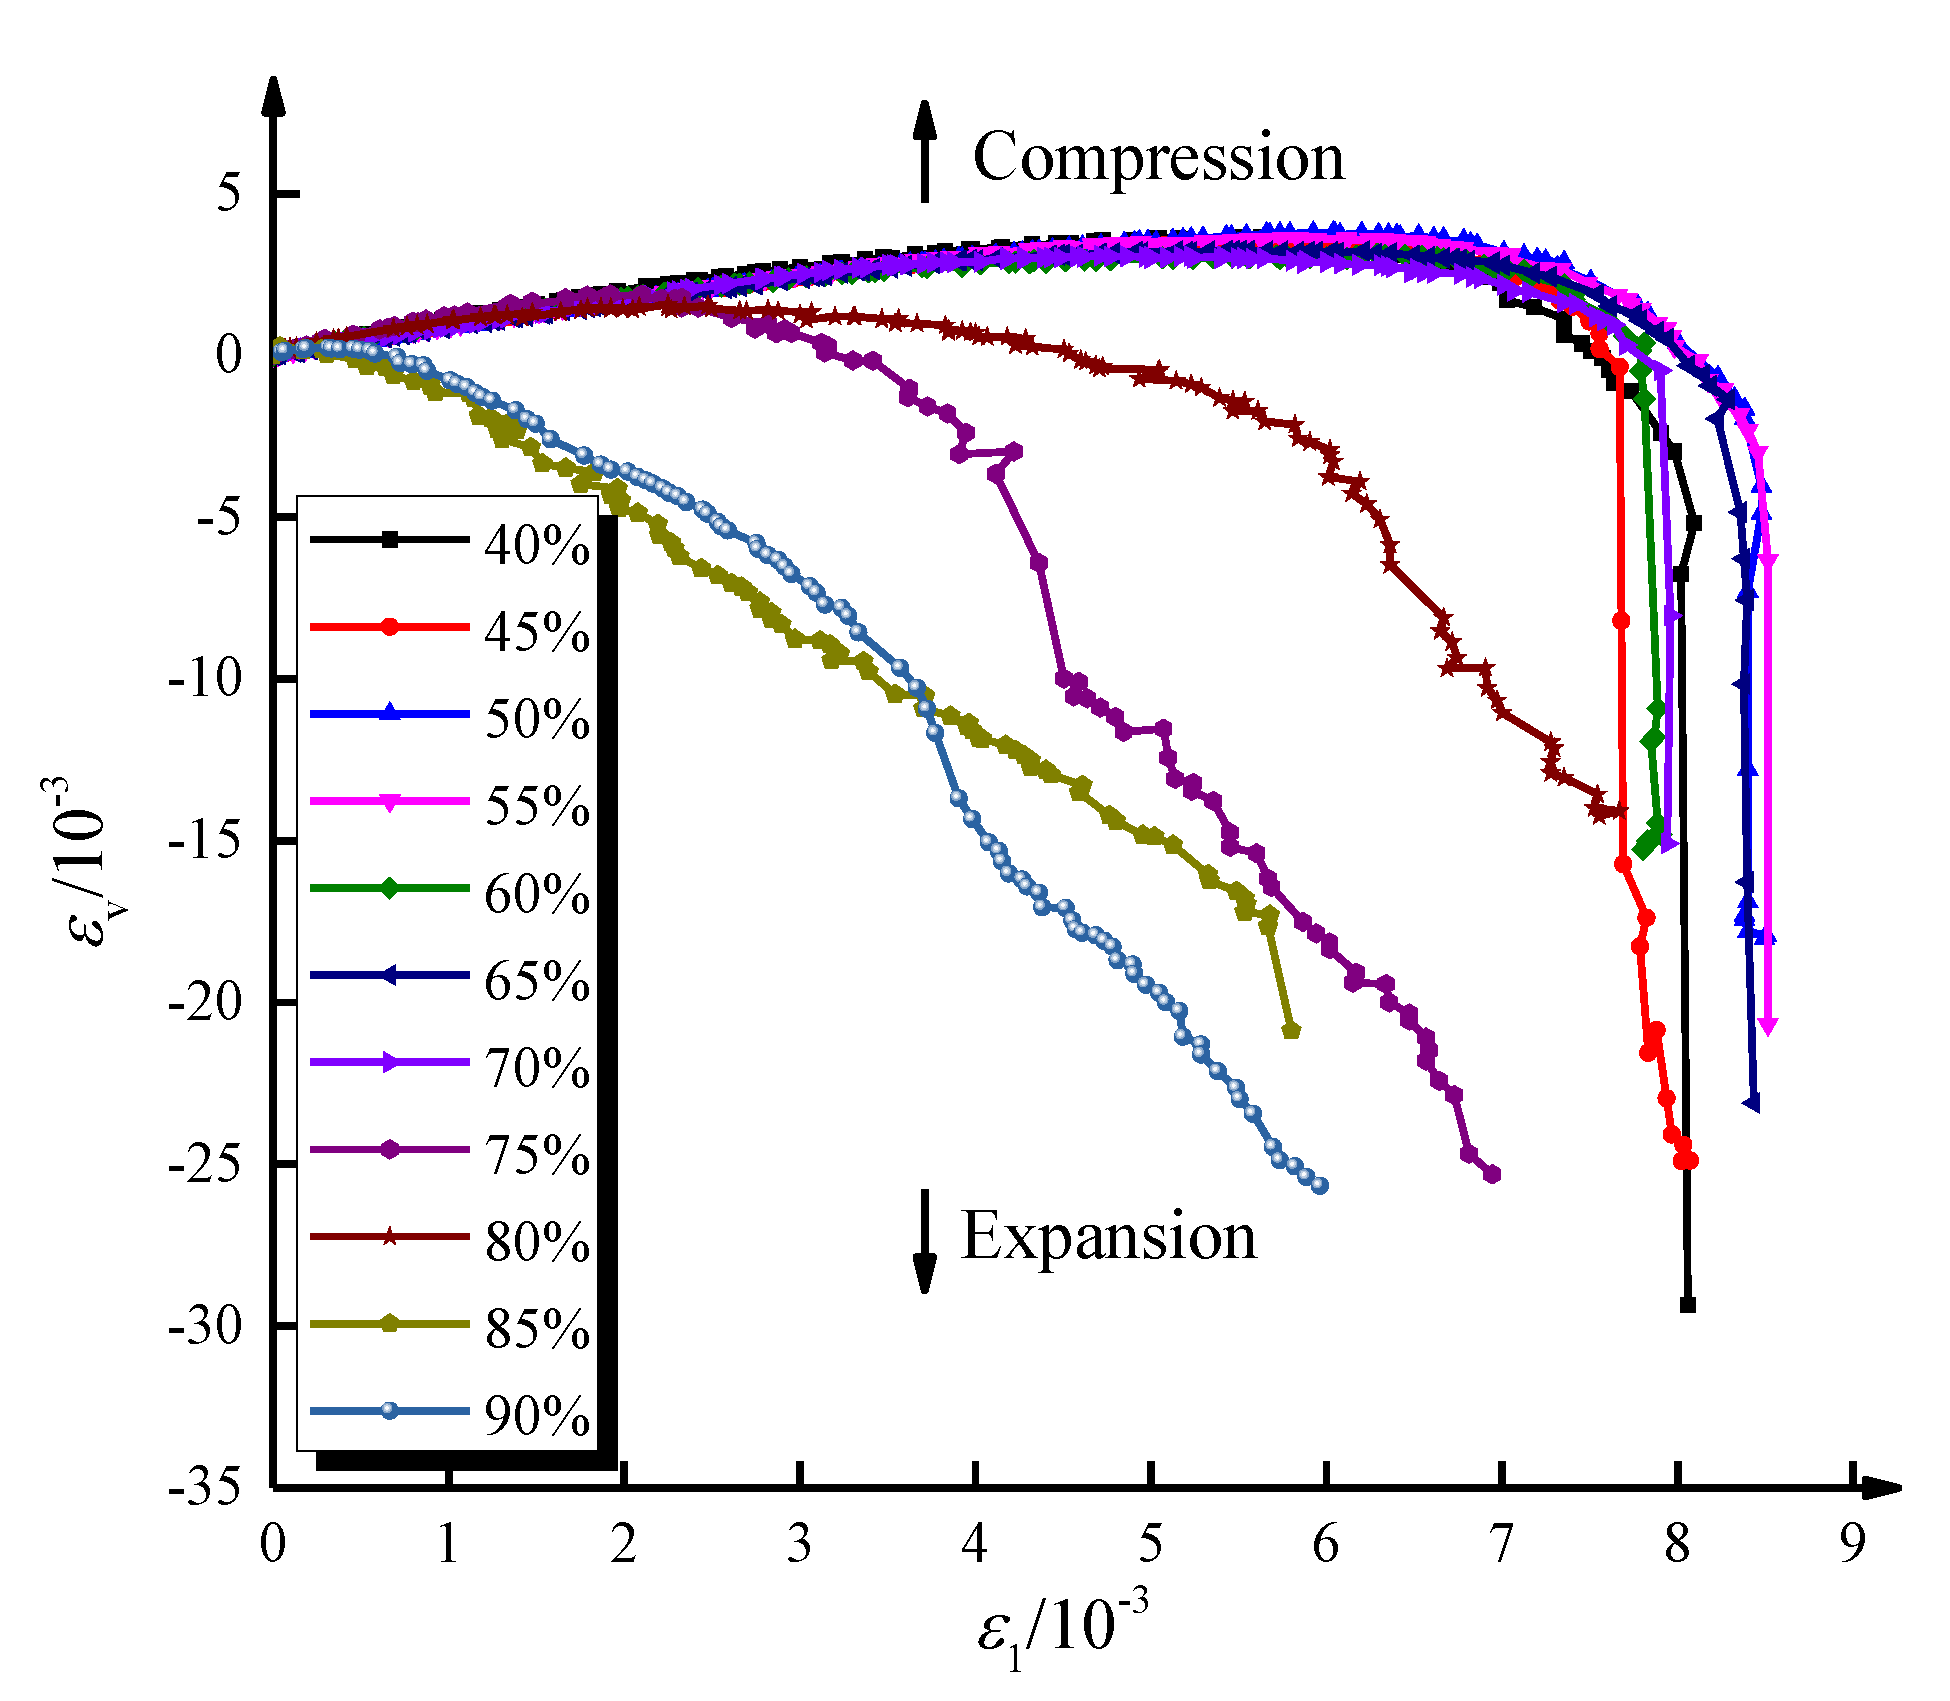
4.3. Damaged Sandstone Volumetric Strain Characteristics Analysis

Figure 6 shows the volumetric strain characteristic curves of the damaged sandstone during uniaxial reloading. In the figure, the positive value indicates the volume compression of the specimen, and the negative value refers to the volume expansion. It can be seen that the characteristics of the volume strain curves from 40% to 70% of the unloading point are similar. In the uniaxial reloading process, with the increase in axial stress, the rock sample is mainly deformed in compression and the volume strain increases slowly, during which the deformation of the damaged rock sample goes through the pore compacting stage, the linear elastic stage, and the crack stable expansion stage until the volume strain reaches the expansion point. The deformation of the rock sample then enters the crack unstable expansion stage, the strain is transformed from compression to expansion, and the volume strain curve drops rapidly. The characteristics of the 75% and 80% volume strain curves at the unloading point are similar. Compared with the characteristic curves of the 40% to 70% volume strain curves at the unloading point, the rock sample enters the crack unstable extension stage more rapidly after experiencing a short pore compression, linear elastic stage, and crack stable extension stage during the uniaxial reloading process. The 85% and 90% volume strain curves at the unloading point have similar characteristics, and the overall volume strain is negative, indicating that the rock sample does not go through the pore compacting stage, the linear elastic stage, or the crack stable extension stage, but enters the crack unstable extension stage directly, and the radial strain generated by the crack tensioning is dominant. These details need to be further discussed in conjunction with the crack volume strain characteristics.

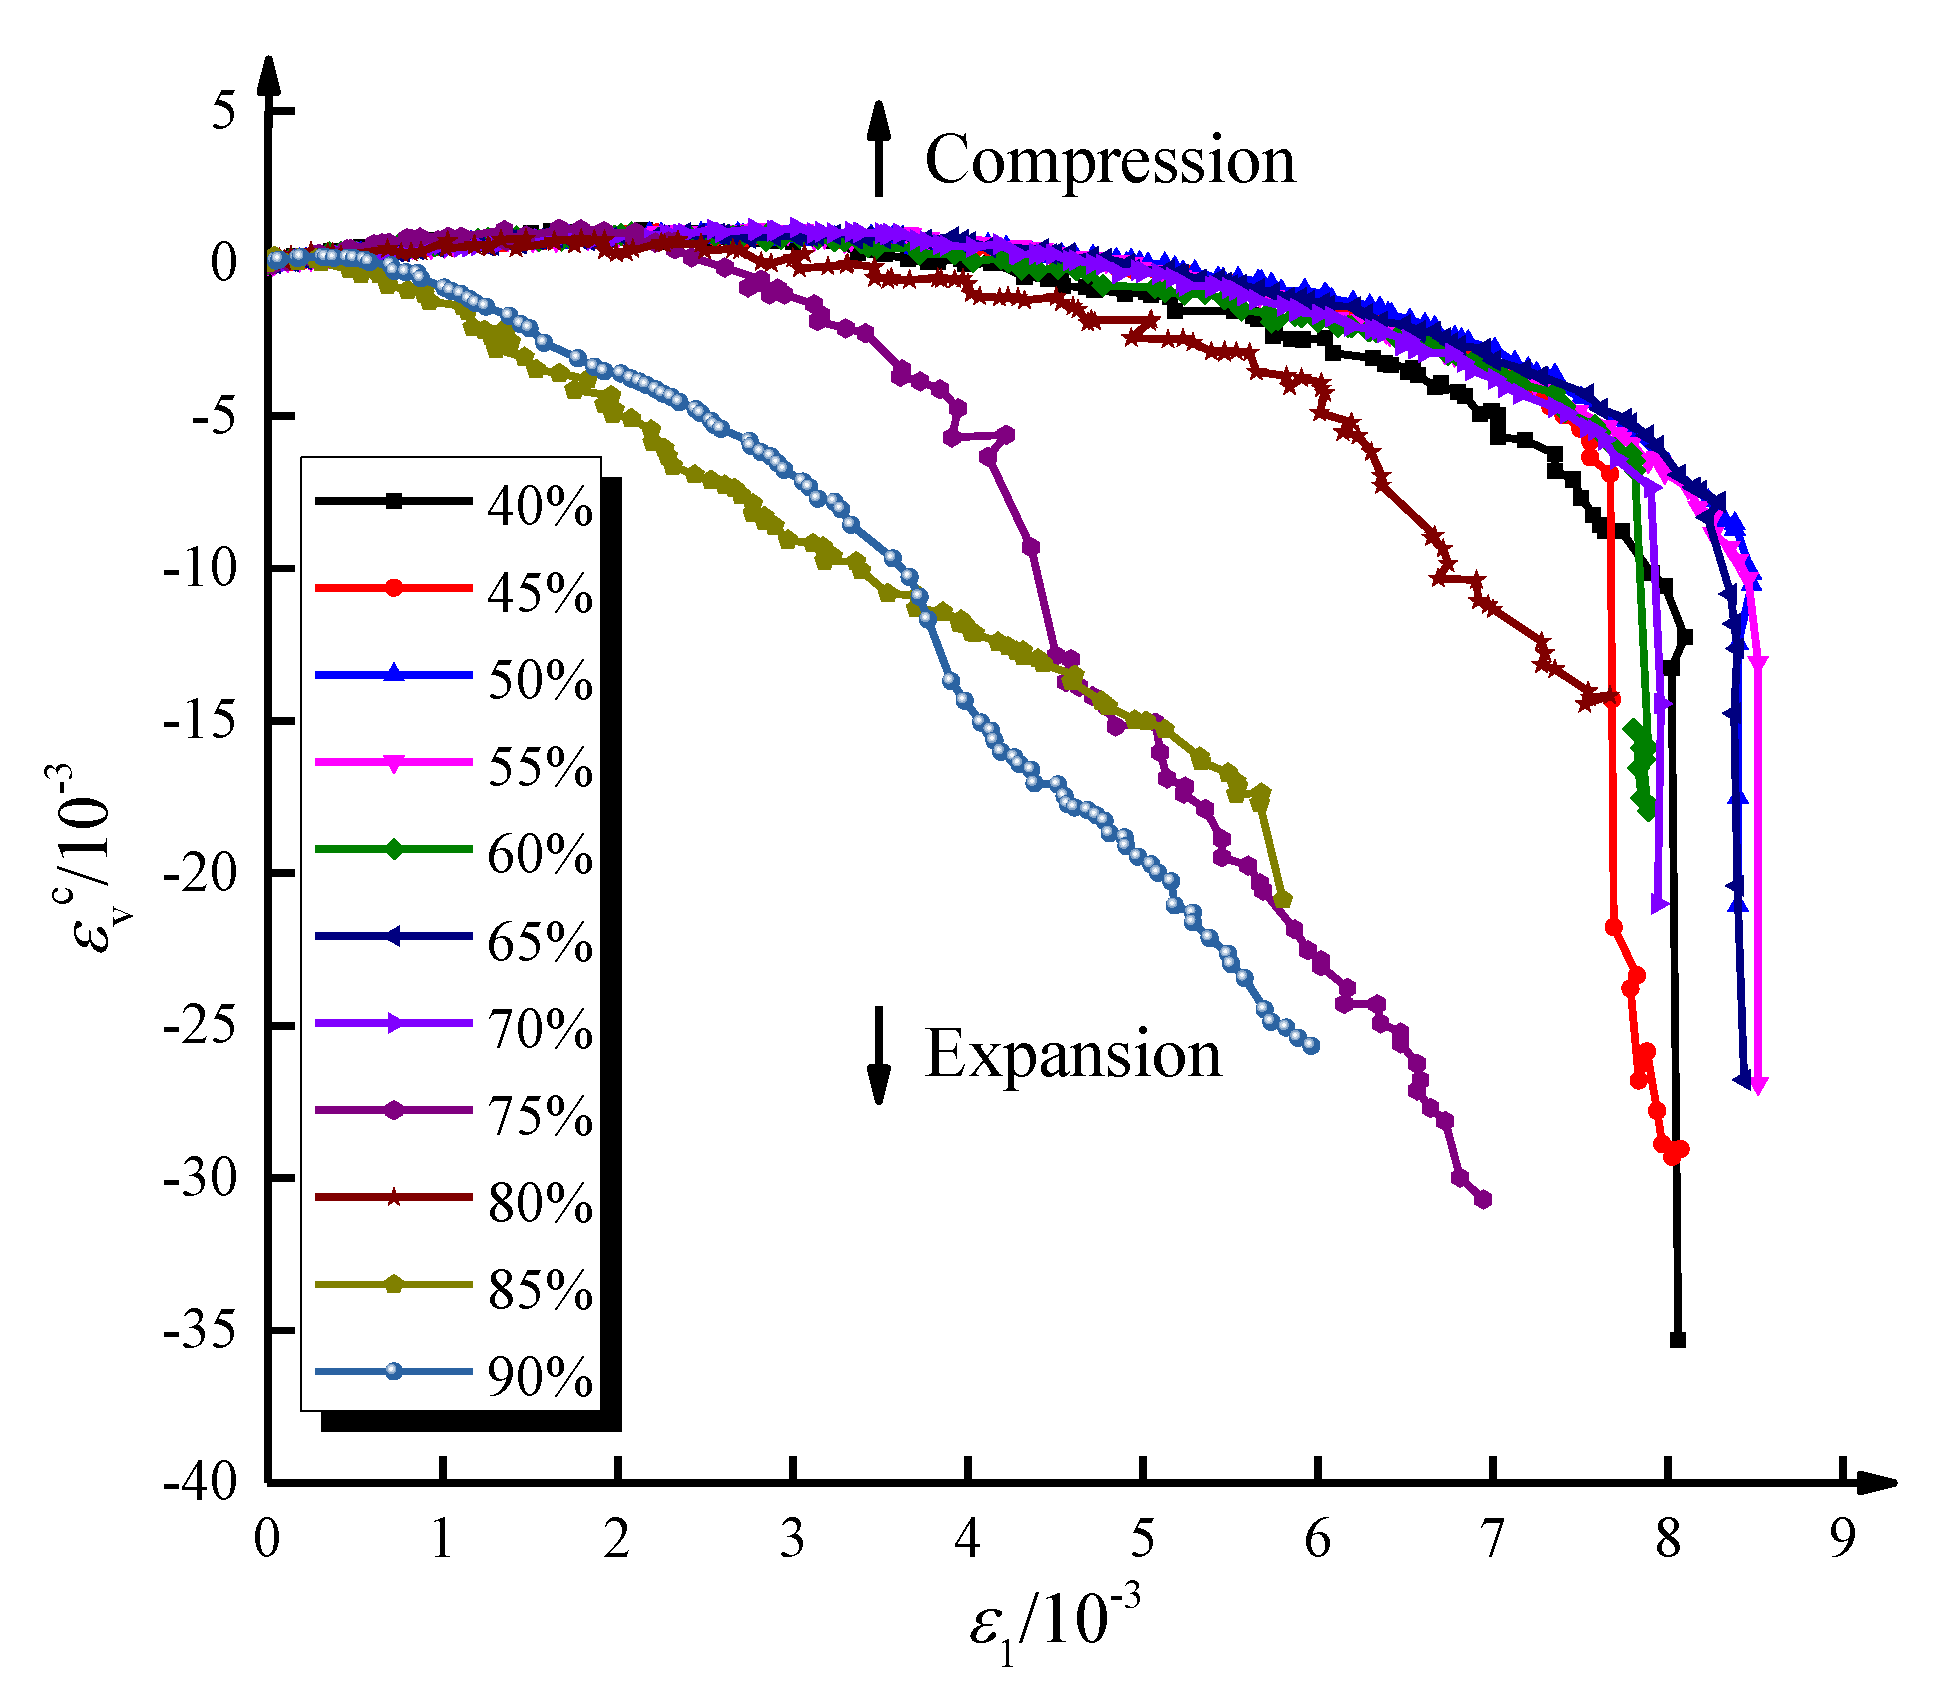
4.4. Damaged Sandstone Crack Volume Strain Characteristics Analysis

Figure 7 further shows the crack volume strain characteristic curves of damaged sandstone. It can be seen from the figure that the crack volume strain curve is different from the volume strain curve in that the crack volume strain is zero in the pore compacting stage and in the linear elastic stage, while the crack volume strain starts to tilt in the negative direction as the rock sample deformation enters the crack stable extension stage. Combined with the analysis in Figure 4 and Figure 5, it can be seen that the 75% and 80% damaged rock samples in the uniaxial reloading process went through the pore compacting stage, the linear elastic stage, and the crack stable extension stage, but they were significantly shorter than those of the 40% to 70% damaged rock samples at the unloading point. The 85% and 90% crack volume strain curves at the unloading point showed an overall decreasing trend and a larger decreasing rate, indicating that the rock samples did not go through the pore compacting stage, the linear elastic stage, or the crack stable extension stage, and directly entered the crack unstable extension stage.

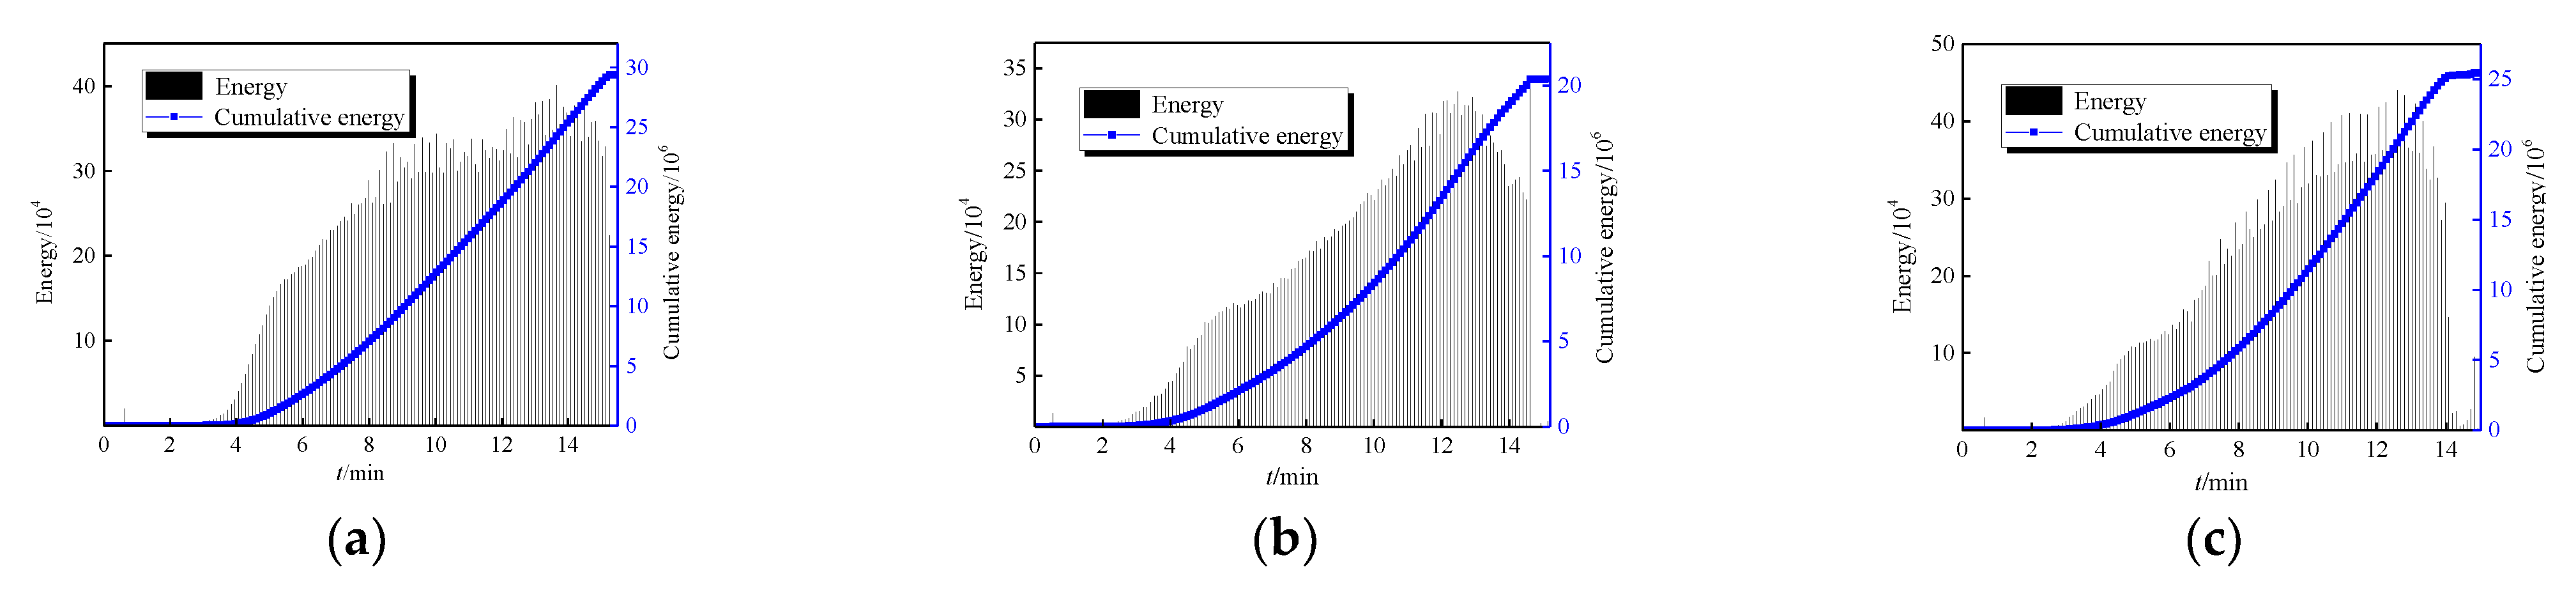
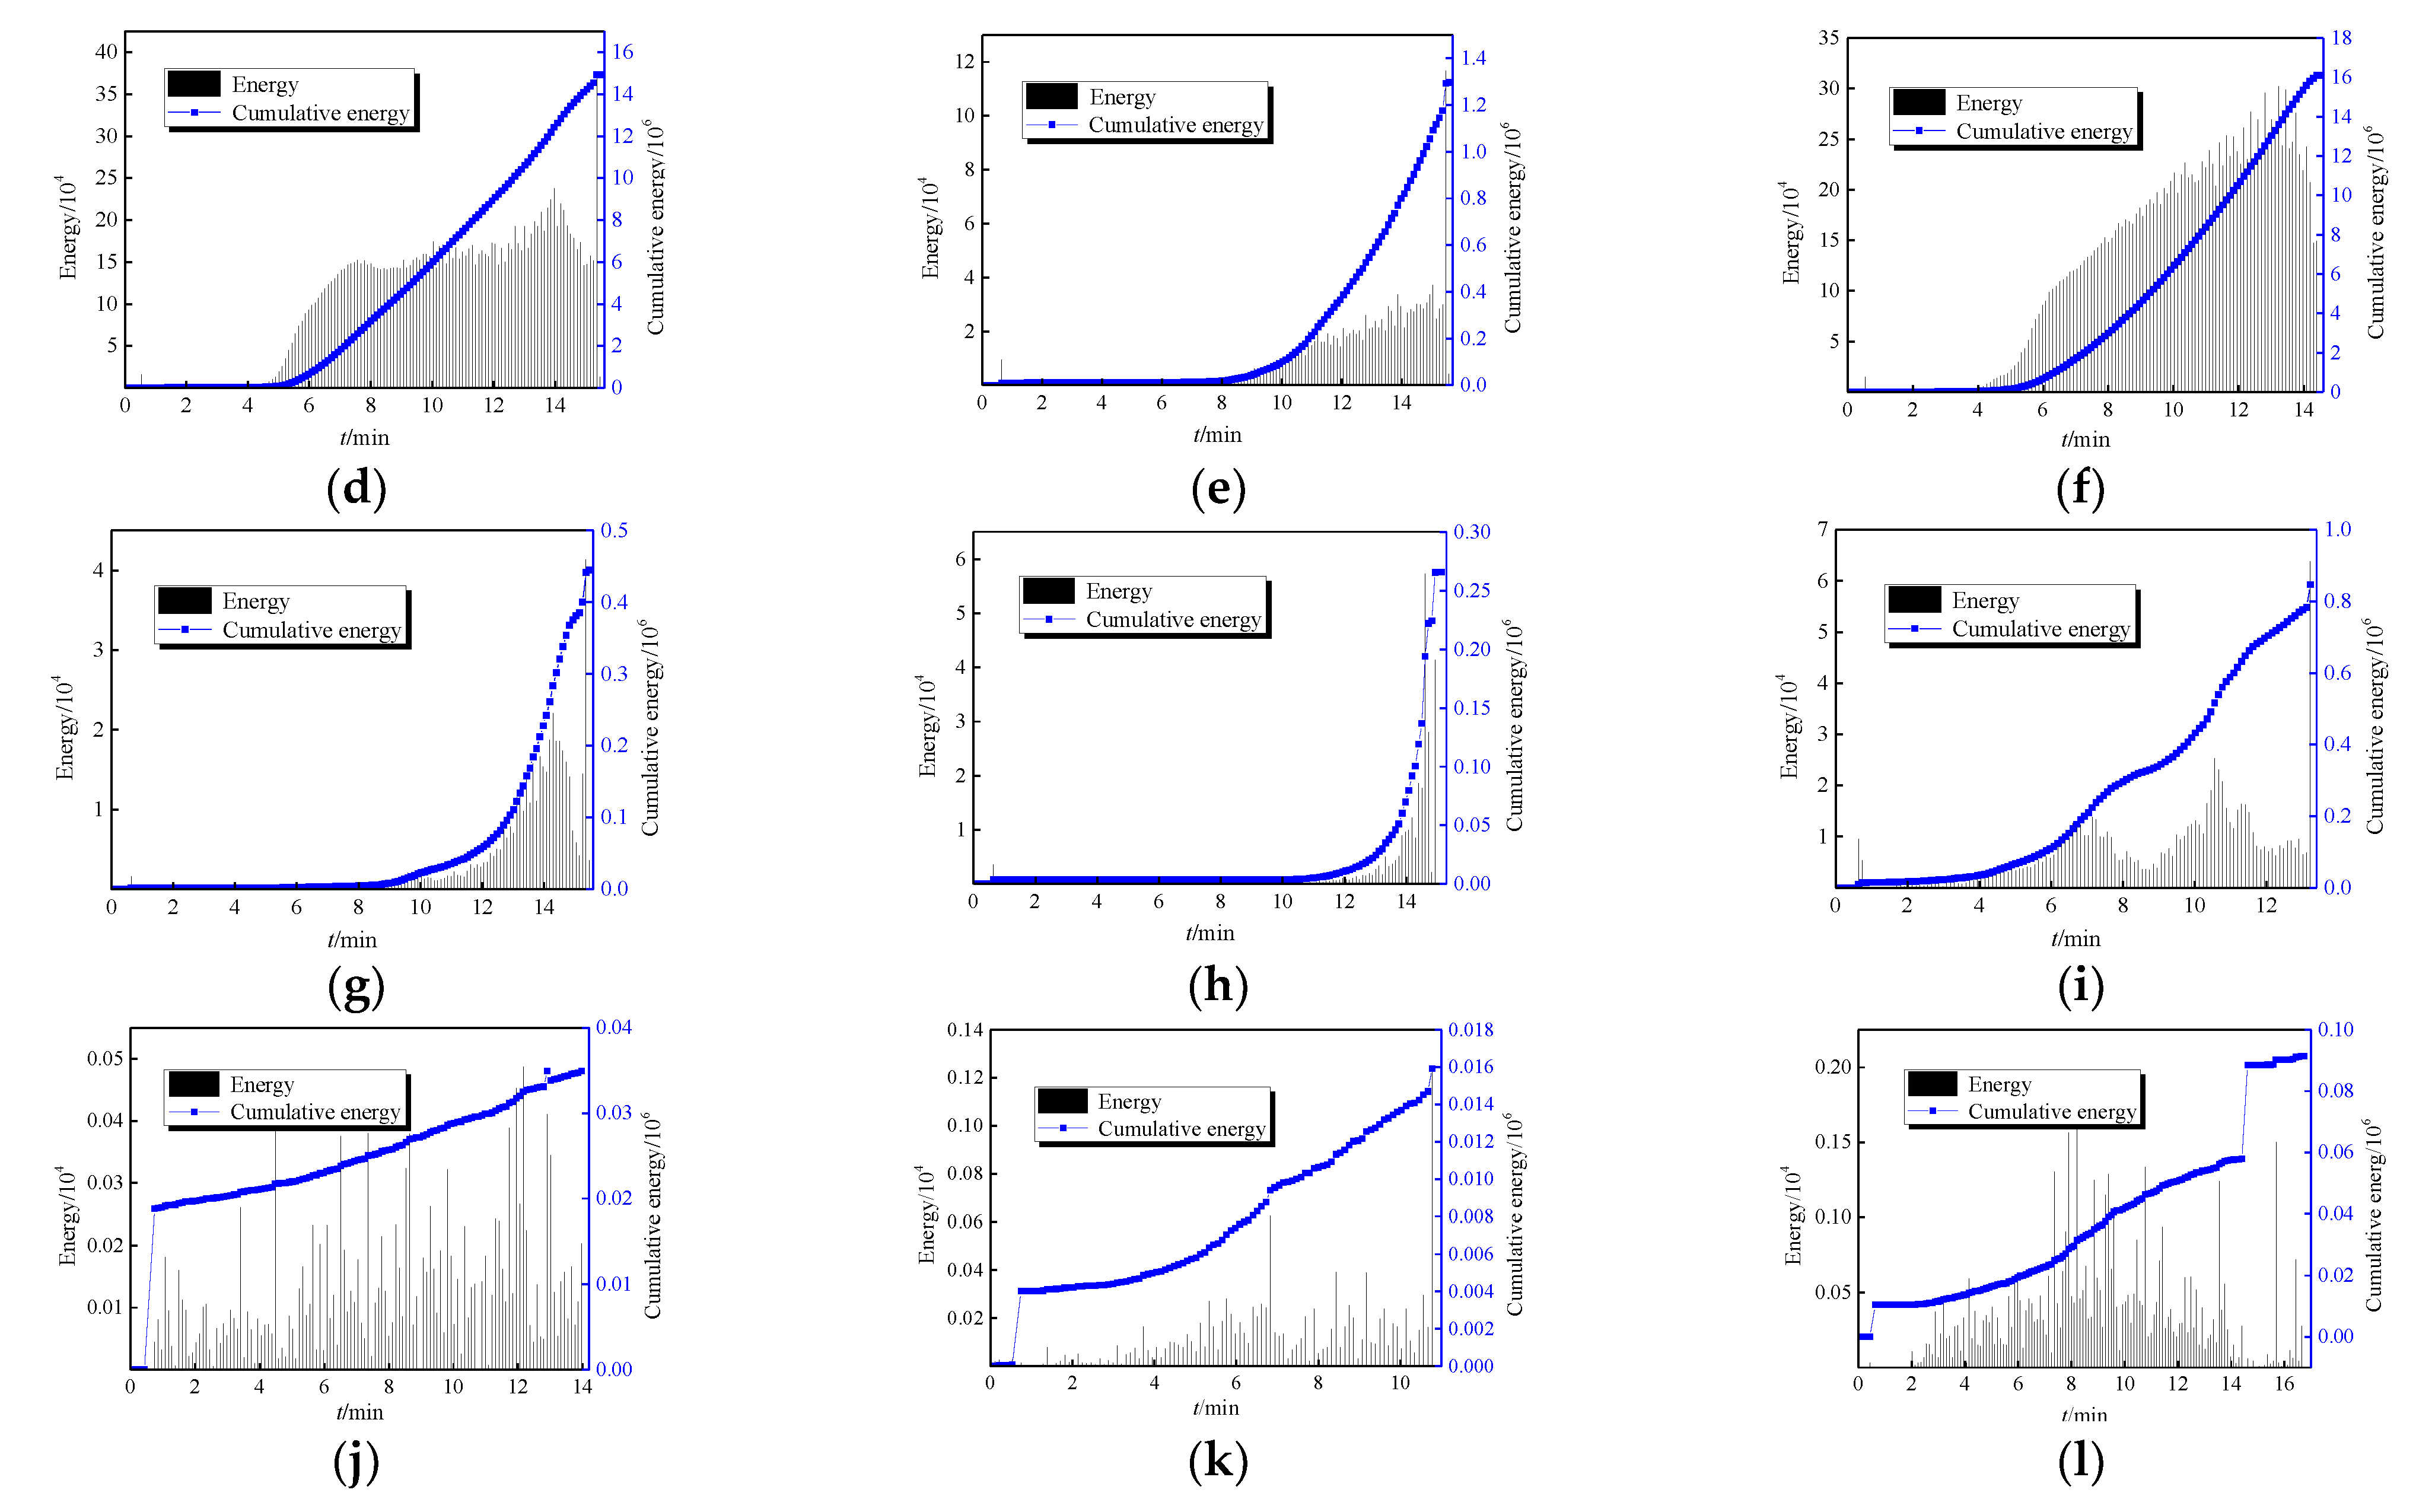
5. Acoustic Emission Characteristics

The uniaxial reload process of the damaged sandstone was monitored using an acoustic emission system. Figure 8 shows the relationship curves of AE energy and ac-cumulated energy with time. From Figure 8a, it can be seen that the intact sandstone does not produce damage in the pore compacting stage or the linear elastic stage, and the acoustic emission energy changes very slightly, fluctuating around the zero value. In the fracture initiation and stable expansion stages, the load exceeds the initiation strength, the internal fractures of the rock start to fracture and expand, and the acoustic emission energy increases by jumps. In the unstable expansion stage of the fractures, the load exceeds the damage strength, and the existing fractures expand rapidly. In the unstable extension stage, the load exceeds the damage strength, and the existing fractures expand rapidly and penetrate, developing into a fracture network and leading to the formation of macroscopic rupture, while the acoustic emission energy increases intensively and stably. From Figure 8b–f, it can be seen that the cumulative energy characteristics of the 40–60% damaged sandstone at the unloading point are similar to those of the intact sandstone and can be roughly divided into three stages (i.e., smooth stage, stable growth stage, and secondary smooth stage), indicating that the 40–60% damaged sandstone at the unloading point has the same uniaxial reload process as the intact sandstone, and the rock undergoes the pore compacting stage, the linear elastic stage, the crack stable extension stage, and the crack unstable extension stage. From Figure 8g,h, it can be observed that the characteristics of acoustic emission energy at 65% and 70% of the unloading point are similar, and there is almost no acoustic emission energy generation before the axial load reaches the crack initiation strength. Combined with Figure 4 and Figure 5, we can see that, compared with 40–60% of the unloading point, the crack initiation strength of the 65% and 70% damaged sandstone at the unloading point has increased, while the damage strength decreases; therefore, the time to produce acoustic emission energy characteristics is significantly shorter and mainly concentrated in the crack extension stage before the macroscopic damage to the rock occurs. From Figure 8i, it can be noted that the acoustic emission energy characteristics of the 75% damaged sandstone at the unloading point show the phenomenon of “double peaks”; combined with Figure 4, it can be seen that the crack initiation strength of the 75% damaged sandstone at the unloading point is similar to the damage strength, which means that the first peak point is when the load exceeds the crack initiation strength, and the second peak point is when the load exceeds the crack initiation strength and the fracture inside the rock starts to crack. As mentioned in Section 4.3, the 75% damaged sandstone at the uniaxial reload process, after briefly experiencing the pore compacting stage, the linear elastic stage, and the crack stable expansion stage, enters the crack unstable expansion stage more rapidly, leading to the generation of the “double peak” phenomenon of acoustic emission energy characteristics. From Figure 8j–l, it can be seen that at 80% to 90% of the unloading point, the rock sample has macroscopic cracks that are not penetrated, and the crack initiation strength and damage strength coincide completely when the uniaxial reloading is carried out. Once the load is applied, it enters the crack unstable extension stage, and the acoustic emission energy characteristics are very active, with the cumulative energy characteristics showing an obvious “step-type” growth.

6. Damage Pattern and Re-Load Damage Mechanism

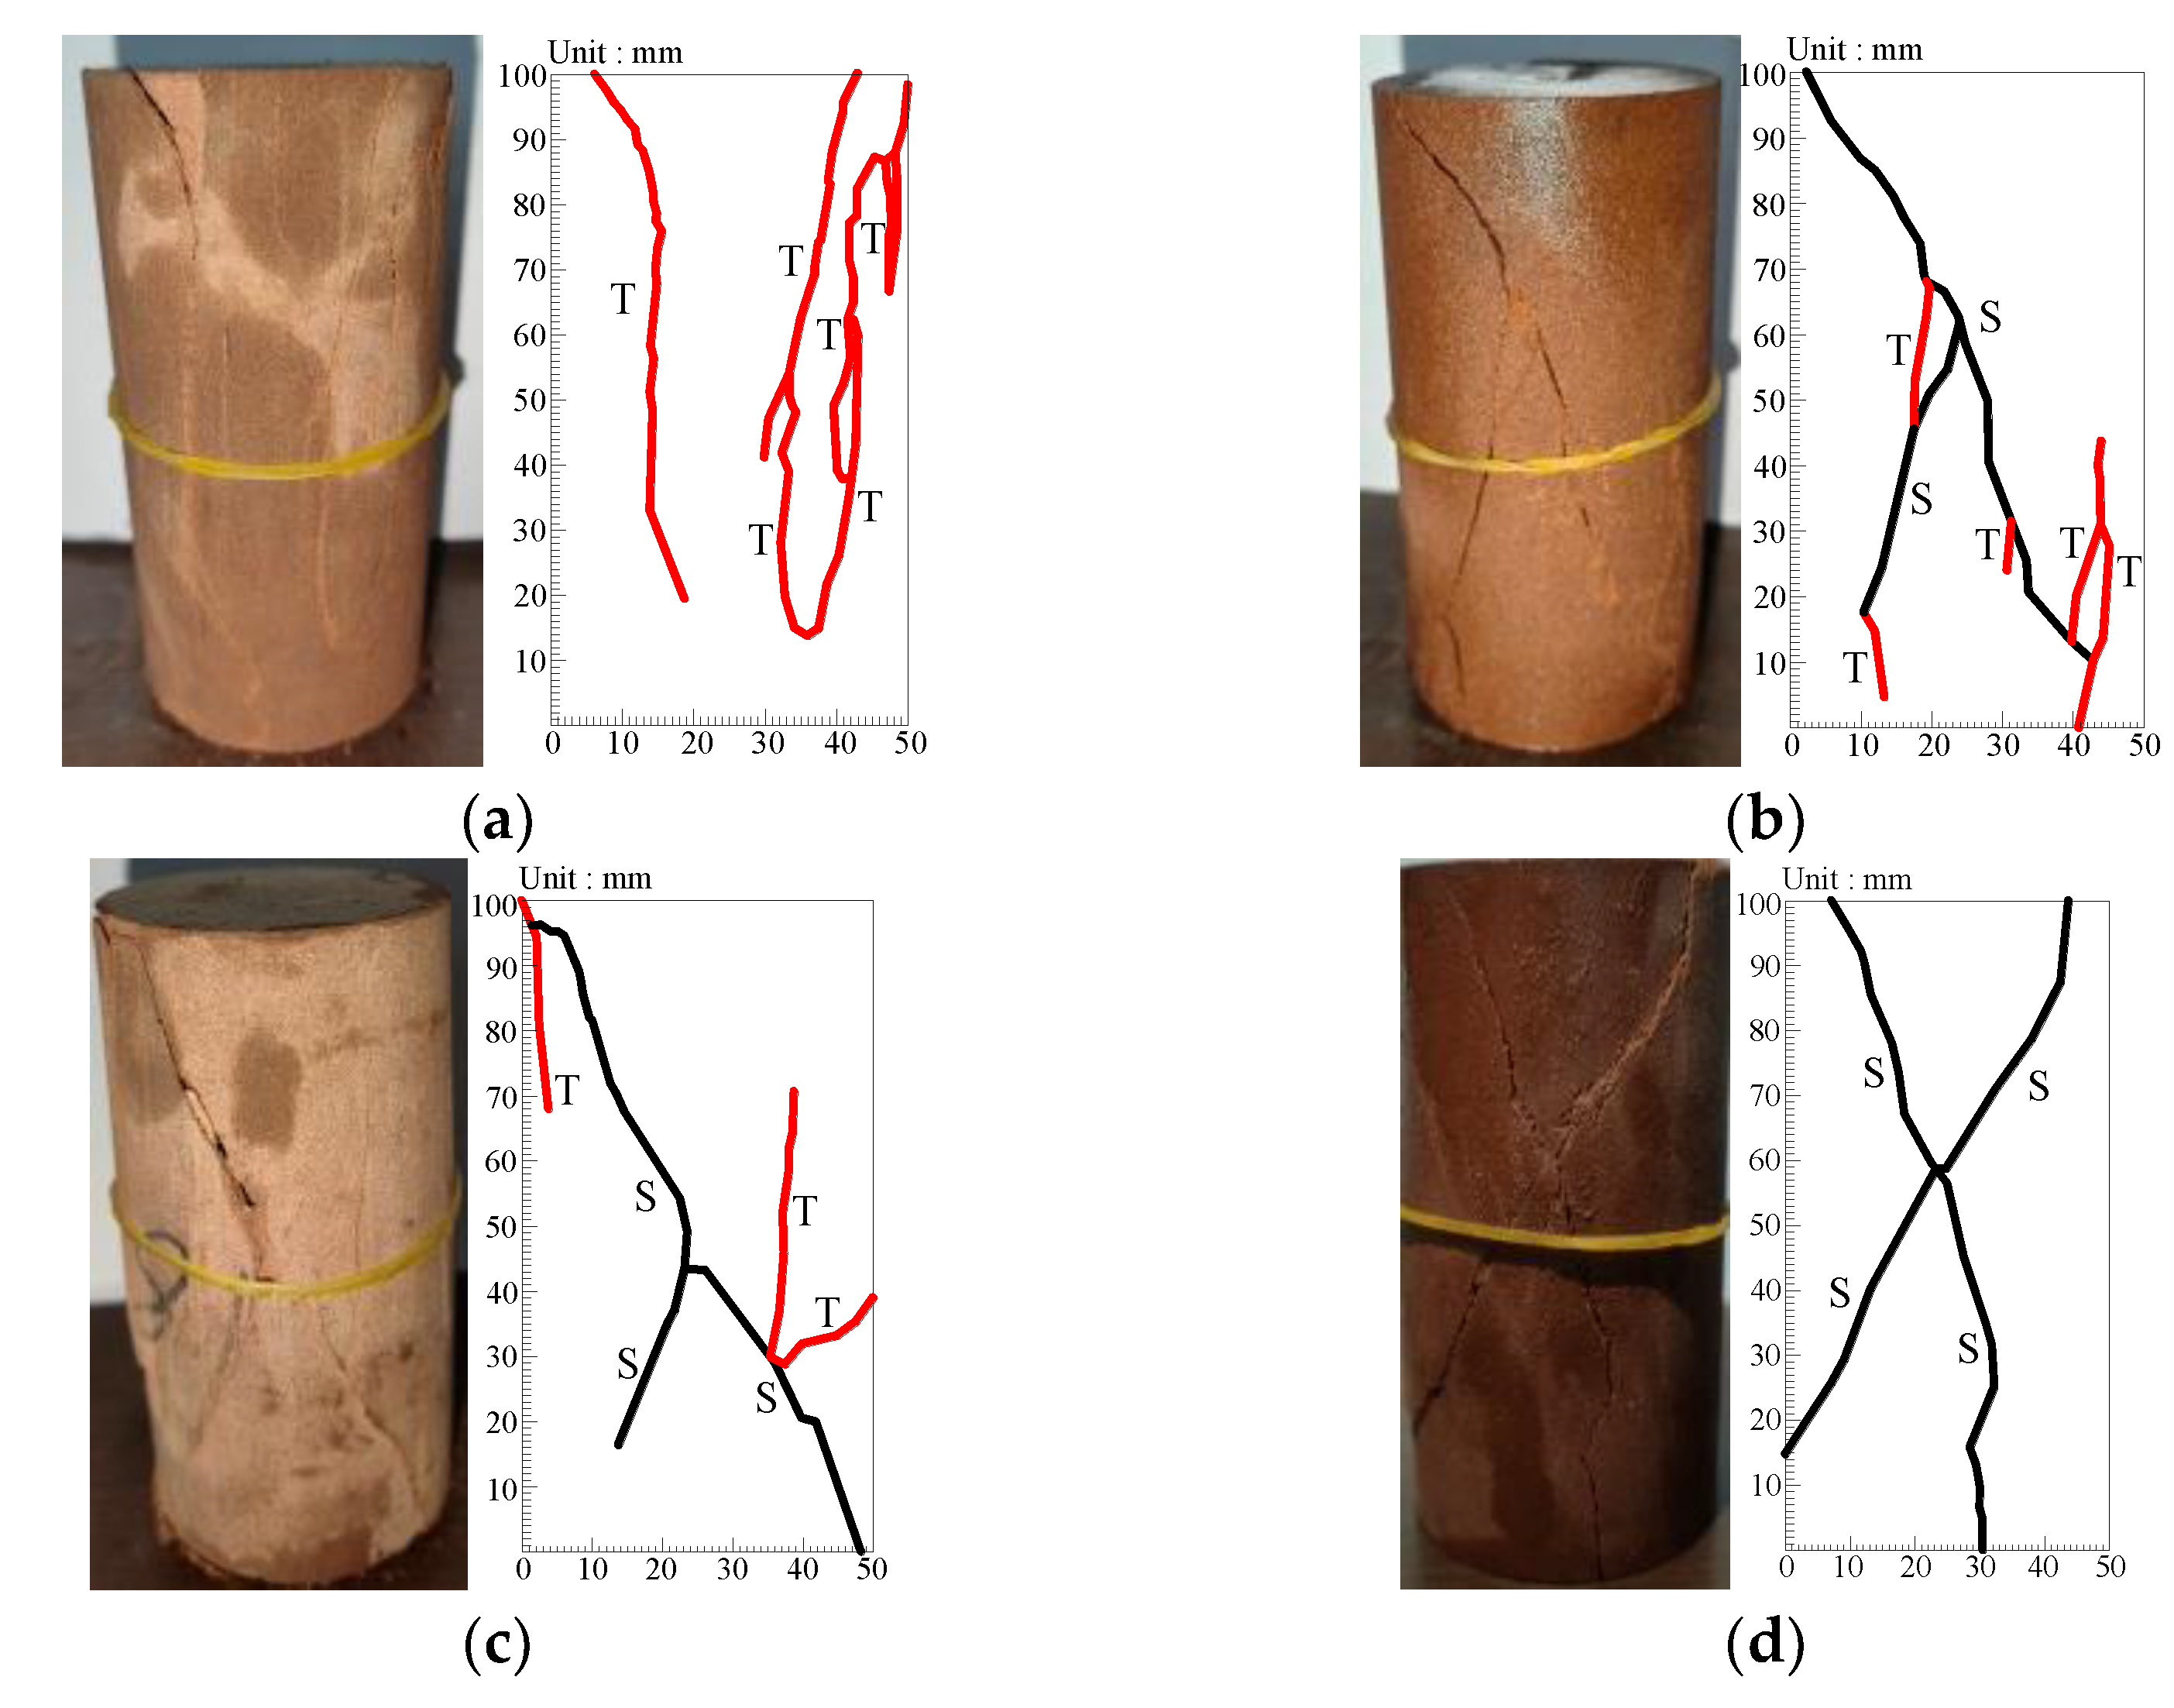
6.1. Pre-Peak Unloading Rupture Pattern

After the sandstone underwent triaxial peak front unloading, the rupture pattern had four cases: (1) 40% to 70% of the specimens at the unloading point did not produce damage or cracking; (2) 75% of the specimens at the unloading point produced multiple longitudinal splitting cracks; (3) 80% and 85% of the specimens at the unloading point showed a single shear tilt rupture crack; (4) 90% of the specimens at the unloading point showed an “X”-shaped shear fracture, and cracks were observed in 90% of the specimens at the discharge point. Figure 9 gives the rupture morphology characteristics of the sandstone damaged by unloading before 75% to 90% of the unloading point. It can be observed that the main rupture morphology of the sandstone during the unloading before the peak presents tensile rupture, mixed tensile and shear rupture, and shear rupture. The rupture pattern of the sandstone at 75% of the unloading point is mainly tensile rupture (Figure 9a). With the increase in the unloading point, the rupture pattern gradually transitions to shear ruptures, as the rupture pattern of the sandstone at 80% and 85% of the unloading point changes to mixed tensile and shear rupture mode (Figure 9b,c). When the unloading point reaches 90%, the rock sample shows a pure shear “X” rupture feature (Figure 9d).
Figure 10 displays the shift in wave velocity before and after unloading the sandstone peak. Before unloading, the propagation velocity of ultrasonic waves in the specimen is between 2.6 km/s and 2.8 km/s. After unloading, the propagation velocity of ultrasonic waves in the damaged specimen has a cubic polynomial relationship with the unloading amount. The wave velocity shift amplitude of 40~70% of the specimen at the unloading point is smaller, between 2.2 km/s and 2.4 km/s. The wave velocity shift of the specimen at the unloading point higher than 70% is significant, and the higher the unloading point, the smaller the wave velocity, which corresponds to the analysis of the pre-peak fracture morphology of the sandstone.

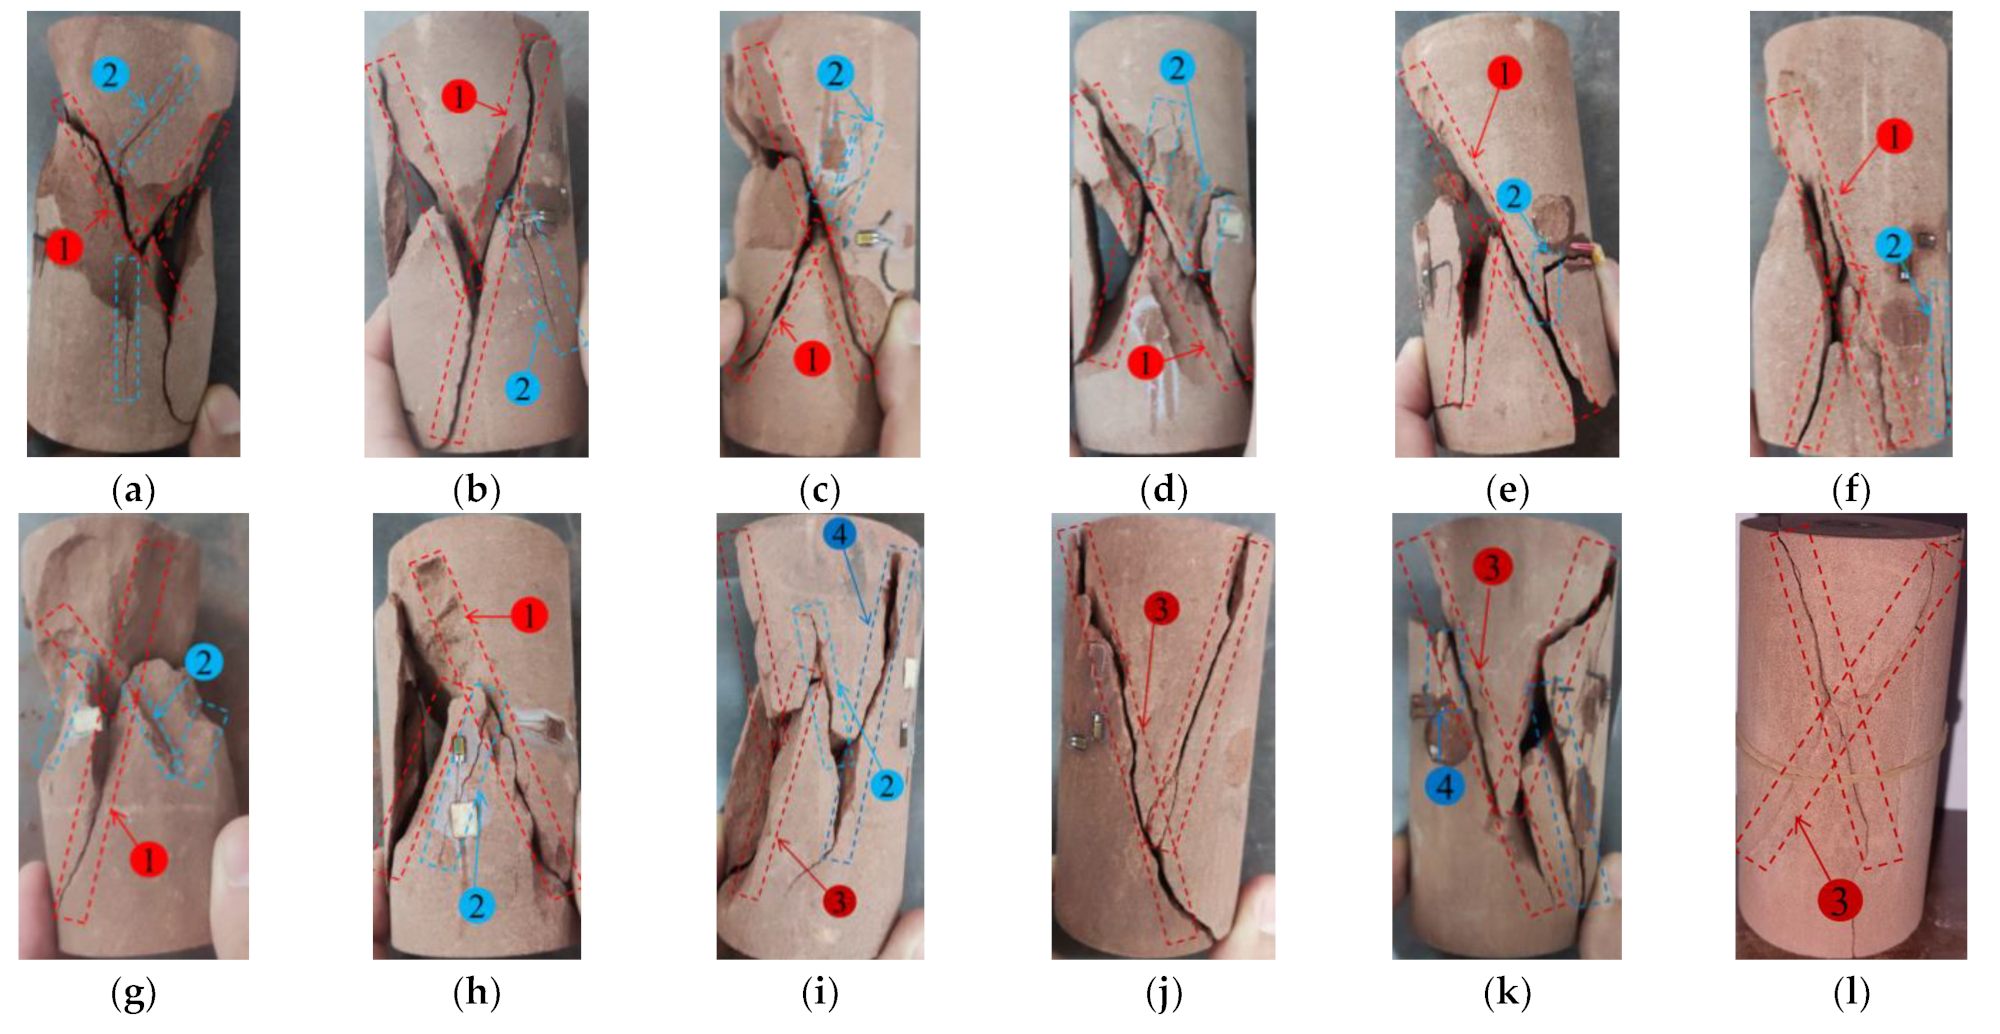
6.2. Re-Load Damage Characteristics of Peak Front Unloading Sandstone

Figure 11 shows the comparison of unloading sandstone reloaded before the peak with the intact sandstone uniaxial damage characteristics. In the figure: the newborn primary crack is the through crack that is newly produced after uniaxial loading, causing damage to the sandstone specimen; the newborn secondary crack is the newly produced run-through crack after uniaxial loading; the secondary primary crack is the crack produced after uniaxial reload before the peak unloading, causing damage to the sandstone specimen; and the secondary secondary crack is the crack produced after uniaxial reload before the peak unloading and is not through.
It can be seen from Figure 11 that the reload damage characteristics show obvious variability with the change in the unloading degree before the peak. Among them, the reload damage characteristics of the 40–70% unloading point specimens are consistent with the uniaxial compression damage characteristics of the intact sandstone, and the new primary cracks show obvious “Y”-type double-slope shear damage characteristics, while there are a small number of new secondary cracks accompanied by new primary cracks (Figure 11a–h). Of the specimens at the unloading point, 75% developed secondary primary and secondary secondary cracks based on the pre-peak tensile rupture pattern. The secondary primary cracks were the main cause of the damage to the specimens, while a small number of new secondary cracks were accompanied by secondary primary cracks (Figure 11i). The damage characteristics of 80–90% of the specimens (Figure 11j–l) at the unloading point are in full agreement with the pre-peak unloading rupture pattern in Figure 9b–d, indicating that the pre-peak unloading rupture pattern determines the damage mode of the uniaxial reload of the sandstone.

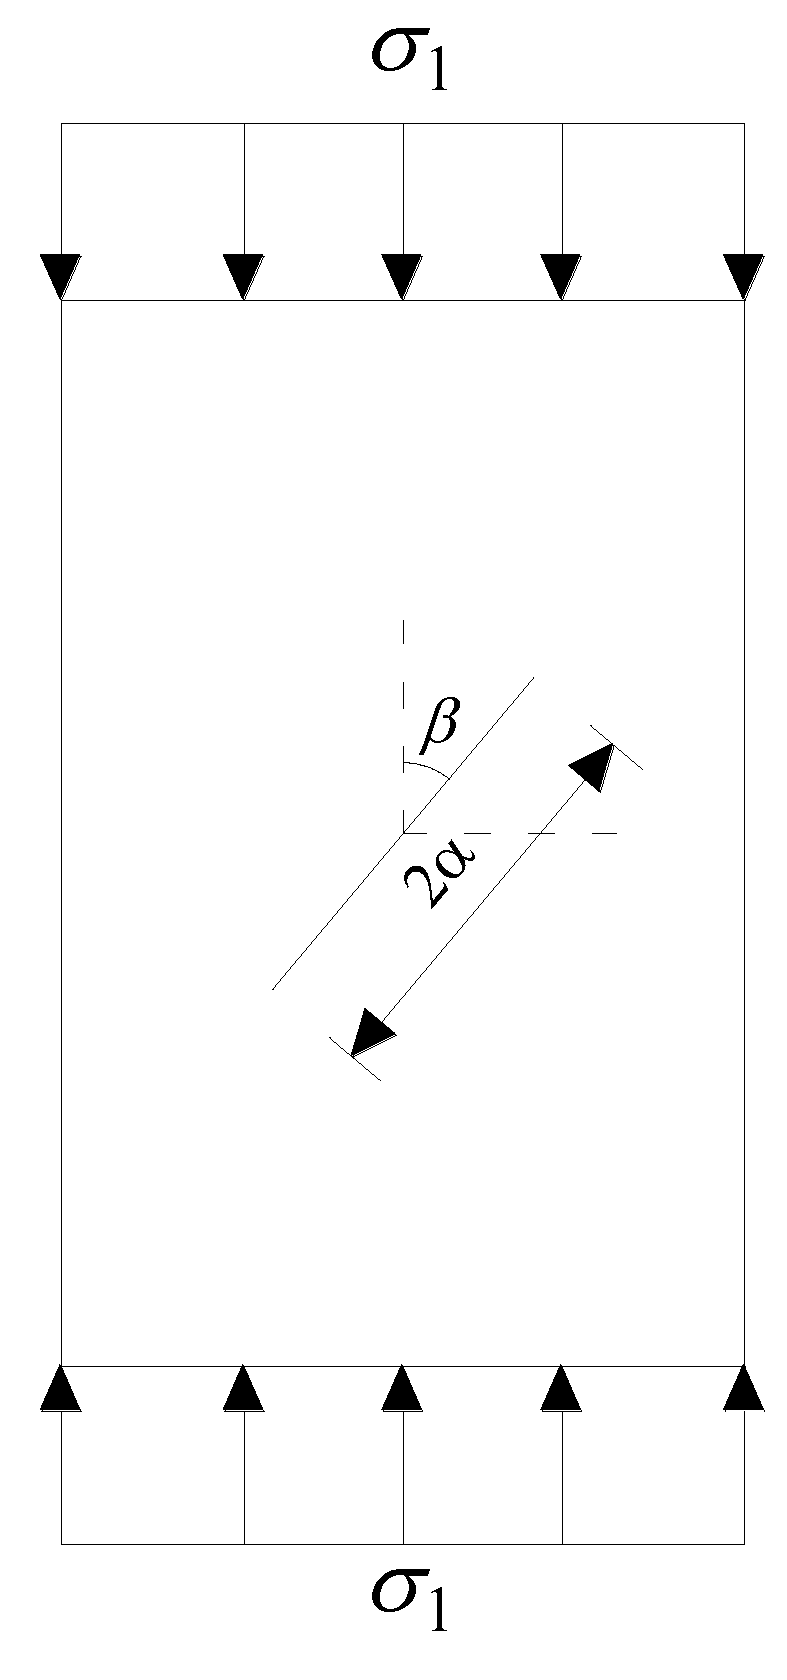
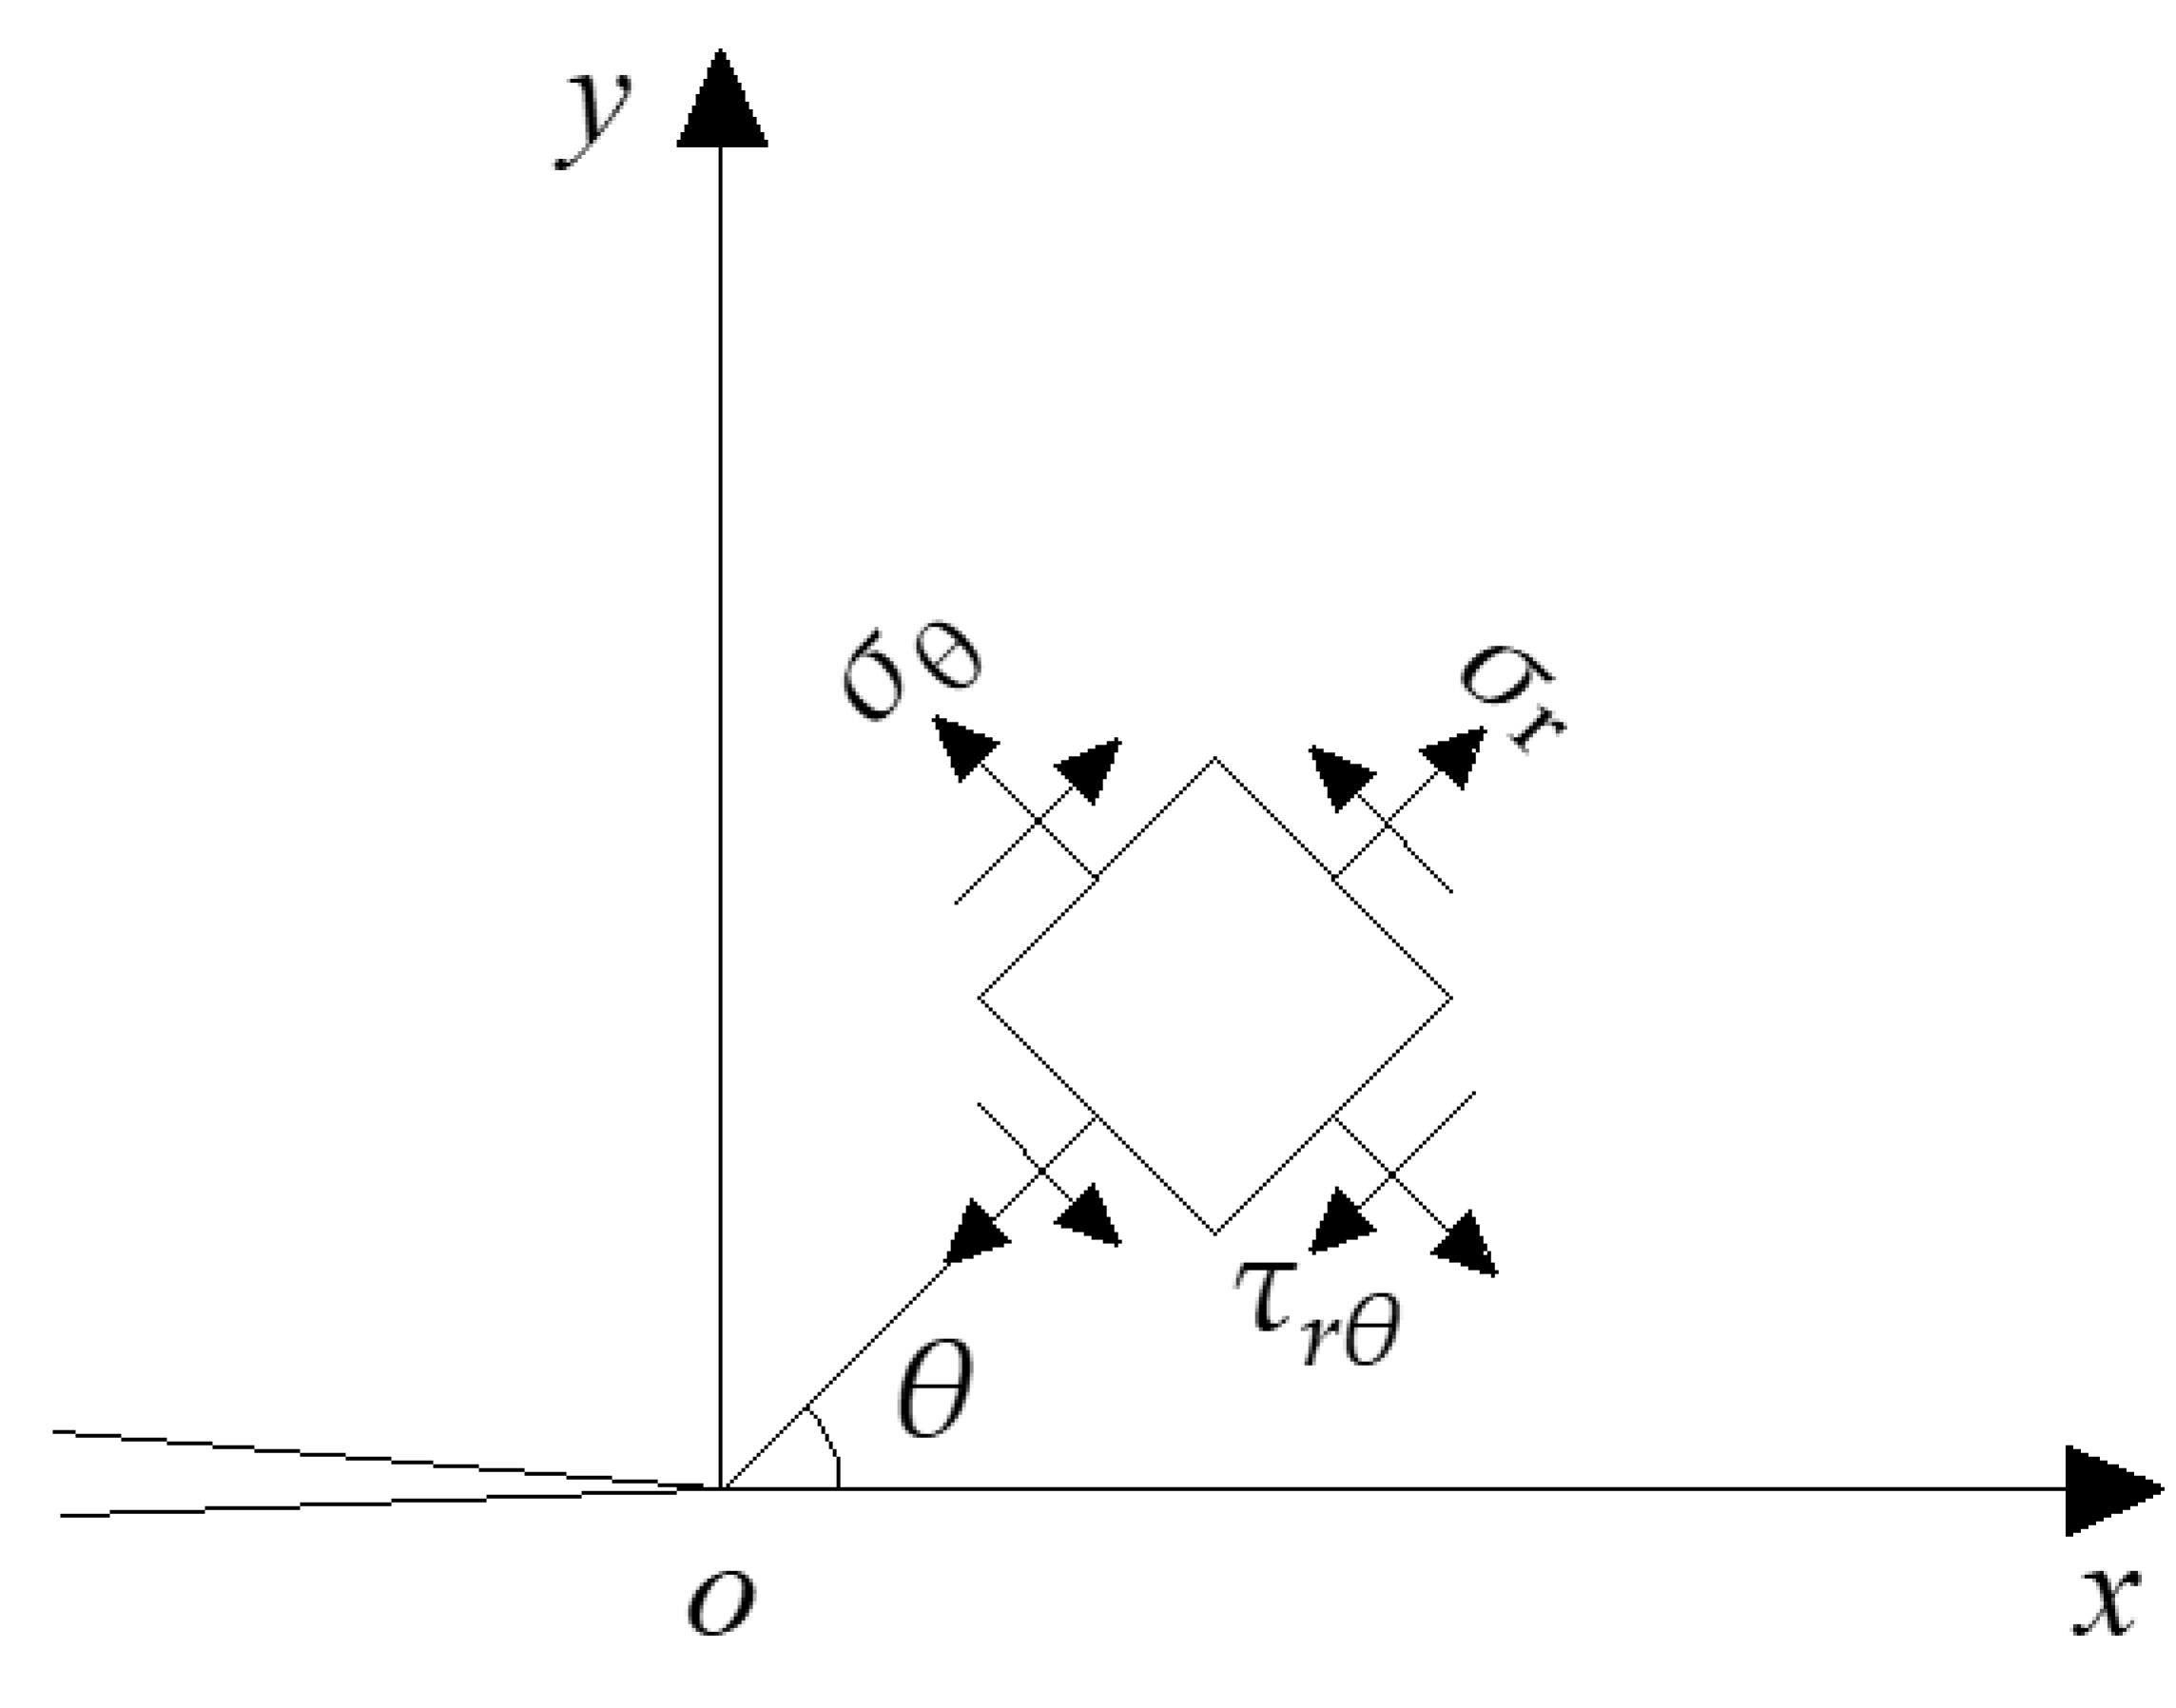
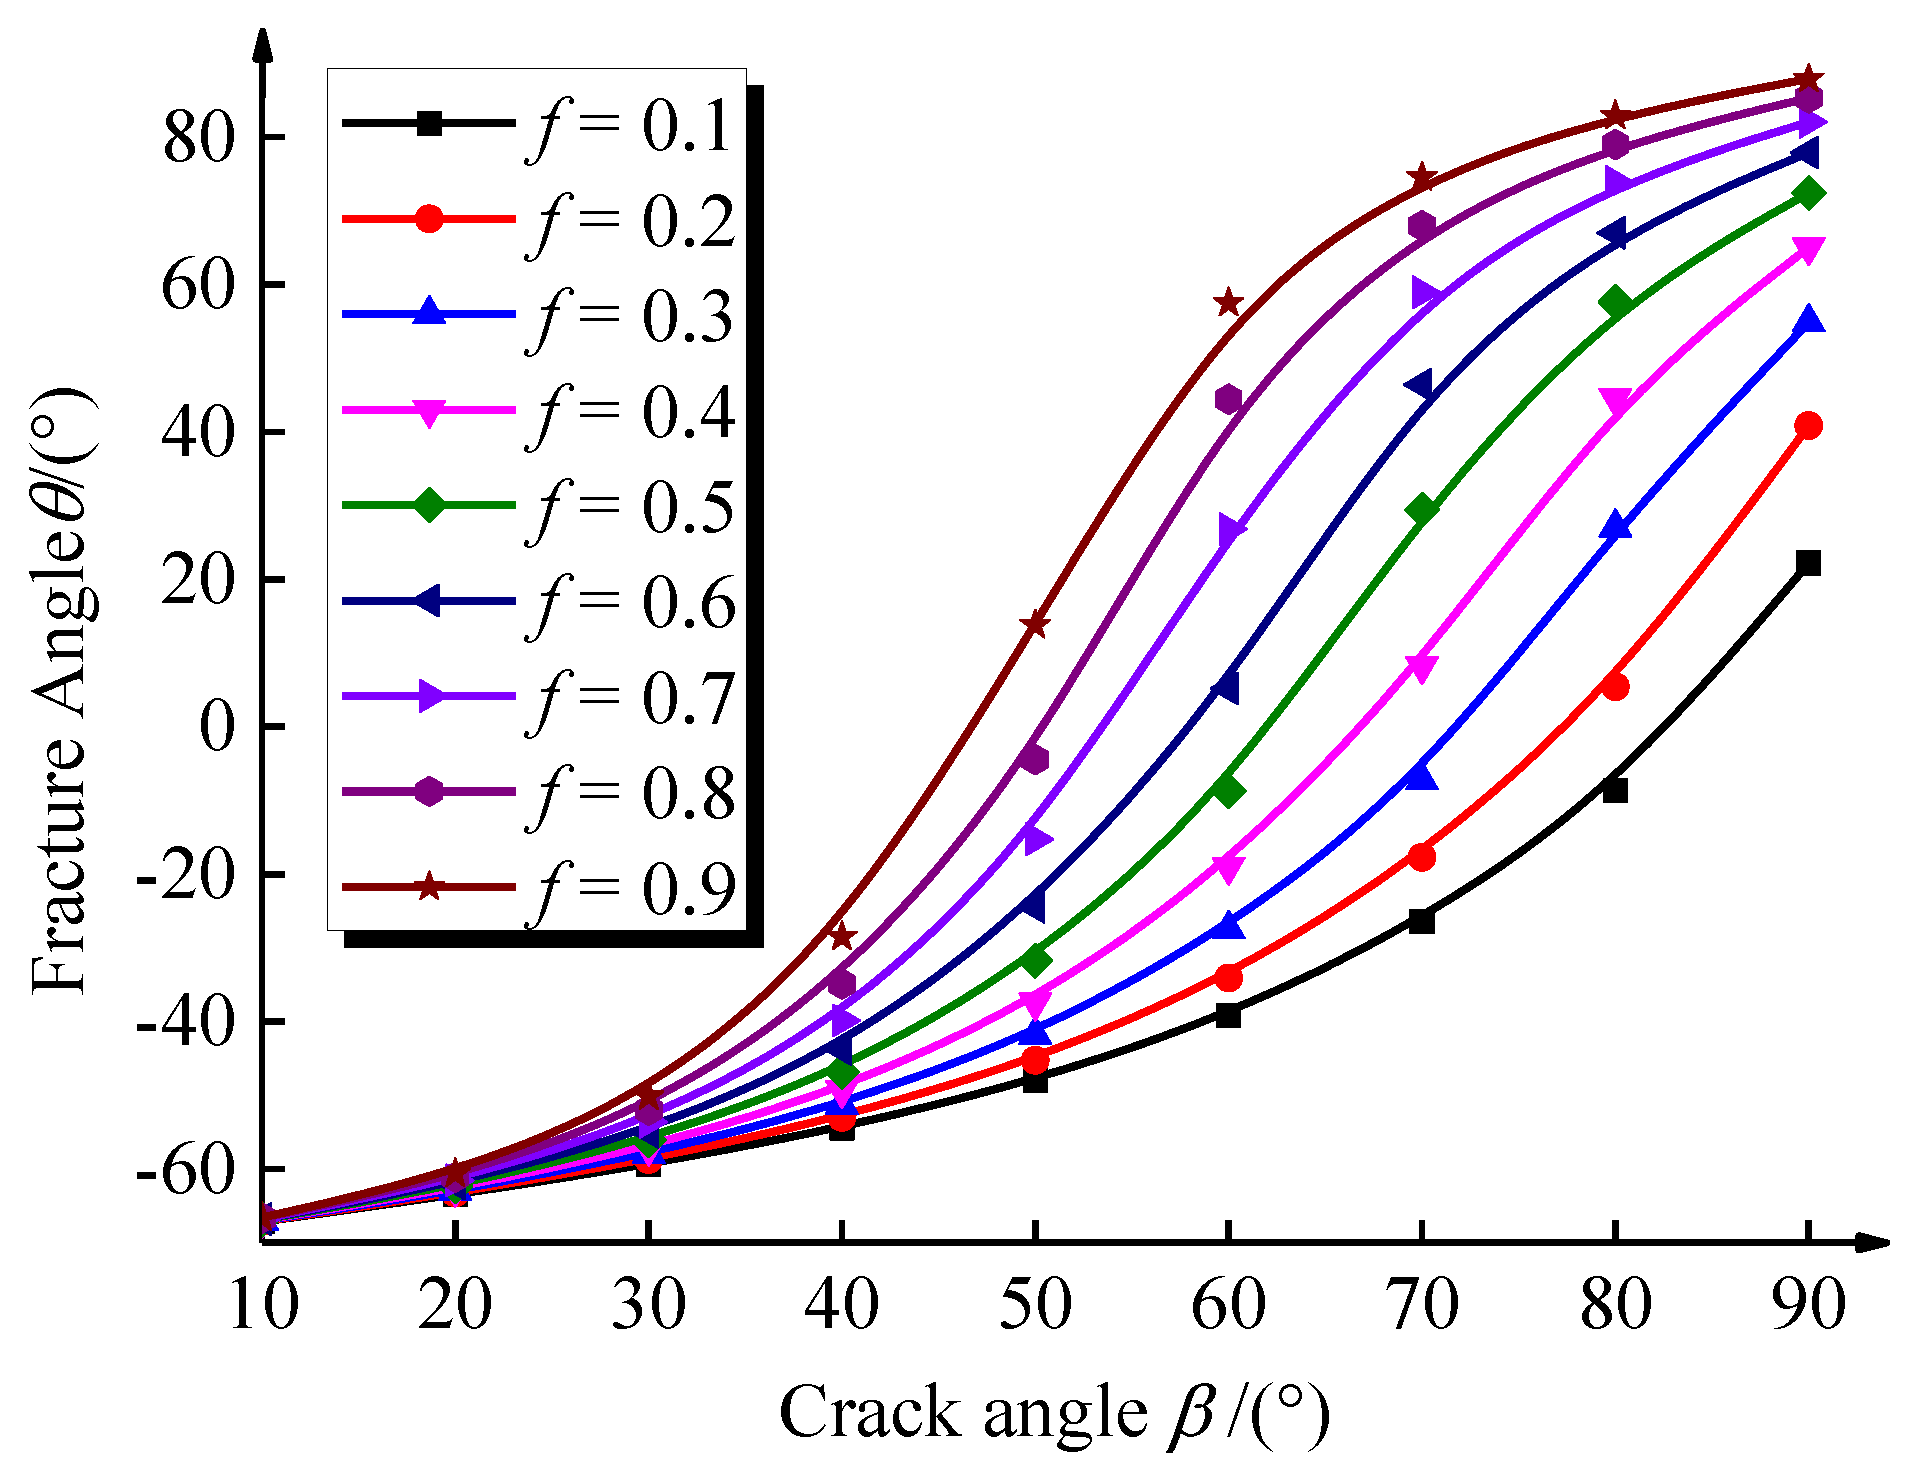
6.3. Reload Damage Mechanism of Sandstone before Peak Unloading

Studies have shown that the macroscopic damage of rock mechanical properties manifests on the micro and fine upper scales as the sprouting, expansion, and penetration of pores or microcracks [22,23]. A large number of microfractures exist inside the sandstone after peak front unloading, which will cause the closure of microfractures under compressive stress during uniaxial reloading, and the contact of crack surfaces with each other will produce frictional restraint to impede the slip between crack surfaces.
Suppose there is a crack 2a in length within the infinite rock slab, with the upper and lower edges subjected to a uniform uniaxial compressive stress σ1, and the angle between the central crack direction and the direction of action of σ1 is β (called the crack angle), as shown in Figure 12.
According to the pseudo-force method [24], while considering the frictional constraint effect on the crack surface, the force of the far-field stress on the crack surface can be calculated as:
P = σ 1 sin 2 β
Q = σ 1 sin β cos β
τ = f P
τ e f = Q τ τ < Q 0 τ > Q
where P is the normal pseudo-force acting on the crack surface; Q represents the tangential pseudo-force acting on the crack surface; τ denotes the sliding friction between the upper and lower surfaces of the crack; f refers to the friction coefficient on the crack surface, and τef is the effective shear stress.
Using the Muskhelishvili complex potential theory, the basic solution for the cracked surface subjected to pseudo-forces can be obtained as [25]:
φ ( z ) = z P + i Q τ 2 z 2 a 2 ψ ( z ) = z P i Q τ 2 z 2 a 2
where φ(z) and ψ(z) represent complex potential functions in the plane; z denotes the independent variable, indicating the length from any point on the crack to the endpoint; a stands for the crack half-length, and i is a constant.
The stress intensity factor can be calculated by the following equation:
K = K i K = 2 2 π lim z ± a z ± a φ ( z ) = P + i Q τ π a
where K and K are the stress intensity factors of type I and type II crack tips, respectively.
From Equation (13), the crack tip stress intensity factors K and K are:
K = P π a
K = Q τ π a
The planar composite crack stress component problem is put into polar coordinates and solved as shown in Figure 13. We then have:
σ r = 1 2 2 π r K 3 cos θ + K 3 cos θ 1 sin θ 2 σ θ = 1 2 2 π r cos θ 2 K 1 + cos θ 3 K sin θ τ r θ = 1 2 2 π r cos θ 2 K sin θ + K 3 cos θ 1
where θ and r are the angle and distance between a point of the crack and the polar coordinates, respectively; and σθ, σr, and τ represent the circumferential stress, radial stress, and shear stress, respectively.
Numerous experimental results show that the direction of composite crack cracking is the direction where the circumferential stress σθ reaches its maximum value. Therefore, according to the basic assumption of the maximum circumferential stress criterion [26], an axial shear stress intensity factor Kτ is introduced:
K τ = lim a 0 2 π r τ r θ = cos θ 2 K 2 sin θ + K 2 3 cos θ 1
We then have:
τ r θ = 1 2 π r K τ
The fracture angle θ is determined by the following equation:
K τ θ | θ = θ 0 = 0
Obtaining:
K sin θ + K 3 cos θ 1 = 0
Substituting Equations (8), (9), (14), and (15) into Equation (20), the fracture angle can be found to satisfy the following equation:
1 3 cos θ sin θ = sin 2 β sin β cos β f sin 2 β
From Equation (21), it can be seen that the fracture angle θ of the rock compression shear crack is influenced by the crack angle β and the friction coefficient f of the crack face. This interrelationship is plotted as a curve, as shown in Figure 14.

7. Conclusions

(1) The uniaxial reload deformation characteristics of sandstone are controlled by the degree of unloading before the peak. Sandstone with 40% to 70% of the unloading point is similar to intact sandstone, showing plastic-elastic deformation characteristics. The sandstone at 75% of the unloading point goes through the pore compacting stage, the linear elastic stage, and the crack stable extension stage, significantly shorter than those at 40% to 70% of the unloading point, and enters the crack unstable extension stage more quickly, showing plastic-elastic-plastic body deformation characteristics. With the increase in the unloading point to 90%, the sandstone directly enters the crack unstable extension stage, showing the elastic-viscous body deformation characteristics.
(2) The reload sandstone acoustic emission characteristics before peak unloading coincide with the deformation characteristics. The cumulative energy characteristics of the sandstone at 40% to 60% of the unloading point are similar to those of the intact sandstone and can be roughly divided into three stages: smooth, stable growth, and secondary smooth. The damage intensity of the sandstone at 65% and 70% of the unloading point decreases, and the acoustic emission energy characteristics are mainly concentrated in the crack expansion stage. The crack initiation strength of the sandstone at 75% of the unloading point is similar to the damage strength, and the acoustic emission energy characteristics reveal a “double peak” phenomenon. The crack initiation intensity and damage intensity of the sandstone at 80–90% of the unloading point overlap, the acoustic emission energy characteristics are active, and the cumulative energy characteristics show a “stepped” growth.
(3) The pre-peak unloading rupture pattern of the sandstone determines the reload damage characteristics. In uniaxial reloading, 40% to 70% of the unloading point specimens are consistent with the damage characteristics of intact sandstone, and the new primary cracks show “Y”-type double-slope shear damage characteristics. The secondary primary crack and a secondary secondary crack developed based on the tensile rupture pattern before the peak in 75% of the specimens at the unloading point, and the secondary primary crack was the main cause of the damage to the specimens. The damage path of 80% to 90% of the specimens at the unloading point occurs in shear damage along the pre-peak unloading rupture morphology.
(4) A closed crack mechanics analysis model under uniaxial reload was established, while the basic solution of pseudo-force for fine microcracks subjected to far-field stress and the stress intensity factor at the crack tip and the crack fracture angle were theoretically derived. Further, the relationship between the fracture angle θ of rock compression-shear cracks, the crack angle β, and the friction coefficient f at the crack surface was clarified.

Author Contributions

Conceptualization, Y.Z. and P.L.; methodology, Y.Z. and P.W.; software, C.M.; validation, Y.Z. and P.L.; formal analysis, H.R.; investigation, H.R. and X.W.; writing—original draft preparation, P.L.; writing—review and editing, P.L. and C.M.; supervision, Y.Z. and P.W.; funding acquisition, Y.Z. All authors have read and agreed to the published version of the manuscript.

Funding

The work presented in this paper was financially supported by the National Natural Science Foundation of China (Grant No. 52274119, 52174110), the Natural Science Foundation of Hunan Province (No. 2021JJ30273), and the Open Research Fund Program of Hunan Provincial Key Laboratory of Safe Mining Techniques of Coal Mines, Hunan University of Science and Technology (No. 969-E22227).

Informed Consent Statement

Informed consent was obtained from all subjects involved in the study.

Data Availability Statement

Data available on request due to privacy restrictions.

Conflicts of Interest

The authors declare no conflict of interest.

References

  1. Qiu, S.L.; Feng, X.T.; Xiao, J.Q.; Zhang, C.Q. An Experimental Study on the Pre-Peak Unloading Damage Evolution of Marble. Rock Mech. Rock Eng. 2014, 47, 401–419. [Google Scholar] [CrossRef]
  2. Li, J.L.; Zhu, Z.H.; Yu, L.Y.; Bai, J.W.; Sui, B.; Meng, Q.B.; Zhang, Z.Q. Dissipative Characteristics Investigation of Marble During Reloading Process Considering Pre-Peak Unloading Damage. Chin. J. Rock Mech. Eng. 2020, 39, 2429–2438. [Google Scholar]
  3. Zhou, Z.L.; Pi, Z.Z.; Jing, Y.; Wang, S.F. Responses of Pre-Holed Granite under Coupled Biaxial Loading and Unloading Stress Condition. Minerals 2022, 12, 372. [Google Scholar] [CrossRef]
  4. Zivaljevic, S.; Tomanovic, Z. Loading History Effect on Time-dependent Deformations after Unloading—reversible Creep of Soft Rock (marl). Mech. Time-Depend Mater. 2022, 26, 499–530. [Google Scholar] [CrossRef]
  5. Dai, B.; Zhao, G.Y.; Konietzky, H.; Wasantha, P.L.P. Experimental and Numerical Study on the Damage Evolution Behaviour of Granitic Rock during Loading and Unloading. KSCE J. Civ. Eng. 2018, 22, 3278–3291. [Google Scholar] [CrossRef]
  6. Huang, X.; Liu, Q.S.; Liu, B.; Pan, Y.C.; Liu, J.P. Experimental Study on the Dilatancy and Fracturing Behavior of Soft Rock Under Unloading Conditions. Int. J. Civ. Eng. 2017, 15, 921–948. [Google Scholar] [CrossRef]
  7. Li, J.Z.; Guo, P.H.; Yuan, A.Y.; Zhu, C.Q.; Zhang, T.; Chen, D.H. Failure Characteristics Induced by Unloading Disturbance and Corresponding Mechanical Mechanism of the Coal-seam Floor in Deep Mining. Arab. J. Geosci. 2021, 14, 1170. [Google Scholar] [CrossRef]
  8. Zhao, G.M.; Liu, C.Y.; Xu, W.S.; Meng, X.R. Experimental Study on the Failure Characteristics of High Stress Unloading Rock Mass Induced by Disturbance. J. China Coal Soc. 2021, 46, 412–423. [Google Scholar]
  9. Zhou, X.P.; Qian, Q.H.; Zhang, Y.X. The Constitutive Relation of Crack-Weakened Rock Masses under Axial-Dimensional Unloading. Acta Mech. Solida Sin. 2008, 21, 221–231. [Google Scholar] [CrossRef]
  10. Li, X.B.; Du, K.; Li, D.Y. True Triaxial Strength and Failure Modes of Cubic Rock Specimens with Unloading the Minor Principal Stress. Rock Mech. Rock Eng. 2015, 48, 2185–2196. [Google Scholar] [CrossRef]
  11. Meng, Q.B.; Liu, J.F.; Ren, L.; Pu, H.; Chen, Y.L. Experimental Study on Rock Strength and Deformation Characteristics Under Triaxial Cyclic Loading and Unloading Conditions. Rock Mech. Rock Eng. 2021, 54, 777–797. [Google Scholar] [CrossRef]
  12. Gong, F.Q.; Zhong, W.H.; Gao, M.Z.; Si, X.F.; Wu, W.X. Dynamic Characteristics of High Stressed Red Sandstone Subjected to Unloading and Impact Loads. J. Cent. South Univ. 2022, 29, 596–610. [Google Scholar] [CrossRef]
  13. Xu, X.T.; Huang, R.Q.; Li, H.; Huang, Q.X. Determination of Poisson’s Ratio of Rock Material by Changing Axial Stress and Unloading Lateral Stress Test. Rock Mech. Rock Eng. 2015, 48, 853–857. [Google Scholar] [CrossRef]
  14. Jiang, Q.; Feng, X.T.; Li, S.J.; Su, G.S.; Xiao, Y.X. Cracking-restraint Design Method for Large underground Caverns with Hard Rock under High Geostress Condition and Its Practical Application. Chin. J. Rock Mech. Eng. 2019, 38, 1081–1101. [Google Scholar]
  15. Wang, C.S.; Zhou, H.W.; Wang, R.; Wang, Z.H.; He, S.S.; Liu, J.F. Failure Characteristics of Beishan Granite under Unloading Confining Pressures. Chin. J. Geotech. Eng. 2019, 41, 329–337. [Google Scholar]
  16. Fu, J.X.; Song, W.D.; Tan, Y.Y. Experimental Study of the Characteristics of Strength and AE of Diorite Porphyrite under Complex Loading and Unloading Path. Chin. J. Rock Mech. Eng. 2016, 35, 3858–3867. [Google Scholar]
  17. Hou, Z.Y.; Xiao, F.K.; Liu, G.; Bashkov, O.V.; Lyu, L. Mechanical Properties and Acoustic Emission Characteristics of Unloading Instability of Sandstone under High Stress. Minerals 2022, 12, 722. [Google Scholar] [CrossRef]
  18. Fan, Z.Q.; Jin, Z.H.; Johnson, S.E. Modelling petroleum migration through microcrack propagation in transversely isotropic source rocks. Geophys. J. Int. 2012, 190, 179–187. [Google Scholar] [CrossRef] [Green Version]
  19. Hou, G.Y.; Liang, J.P.; Zhou, M.H.; Cui, Y.K. Effect of Unloaing Velocity on Surrounding Rock Deformation. J. China Coal Soc. 2019, 44, 1011–1019. [Google Scholar]
  20. Martin, C.D.; Chandler, N.A. The progressive fracture of Lacdu Bonnet granite. Int. J. Rock Mech. Min. Sci. Geomech. Abstr. 1995, 32, 41. [Google Scholar]
  21. Zhao, Y.G.; Huang, L.Q.; Li, X.B. Identification of Stages before and after Damage Strength and Peak Strength Using Acoustic Emission Tests. Chin. J. Geotech. Eng. 2022, 44, 1908–1916. [Google Scholar]
  22. Sha, Z.H.; Hai, P.; Xu, J.C.; Ni, H.Y.; Guo, S.R. Effects of Accumulated Damage on the Dynamic Properties of Coal Measures Sandstone. Minerals 2022, 12, 810. [Google Scholar] [CrossRef]
  23. Jin, Z.H.; Johnson, S.E.; Fan, Z.Q. Subcritical propagation and coalescence of oil-filled cracks: Getting the oil out of low-permeability source rocks. Geophys. Res. Lett. 2010, 37, 1. [Google Scholar] [CrossRef] [Green Version]
  24. Wang, B.L.; Mai, Y.W. Fracture of a Piezoelectric Material Layer Bonded by Two Elastic Layers. Int. J. Eng. Sci. 2002, 40, 1697–1727. [Google Scholar] [CrossRef]
  25. Zheng, A.X.; Luo, X.Q. Research on Combined Fracture Criterion of Rock under Compression-shear Stress. Rock Soil Mech. 2015, 36, 1892–1898. [Google Scholar]
  26. Wang, J.J.; Huang, S.Y.; Guo, W.L.; Zhao, T.L. Compression-shear Tension Fracture Criteria for Rock-like Materials Considering Geometric Characteristics of Cracks and T-str. Chin. J. Geotech. Eng 2020, 42, 1622–1631. [Google Scholar]
Figure 1. Experimental flow chart.
Applsci 12 13046 g001
Figure 2. Identification of stress–strain curves of intact sandstone specimens and their characteristic strengths.
Applsci 12 13046 g002
Figure 3. Uniaxial reload stress–strain curve of damaged sandstone.
Applsci 12 13046 g003
Figure 4. Relationship curve between characteristic stress and unloading point.
Applsci 12 13046 g004
Figure 5. Relationship curve between Poisson’s ratio μ and unloading point xσ.
Applsci 12 13046 g005
Figure 6. Volume strain characteristic curves of damaged sandstone.
Applsci 12 13046 g006
Figure 7. Volume strain characteristic curves of damaged sandstone cracks.
Applsci 12 13046 g007
Figure 8. Acoustic emission energy and cumulative energy versus time curve including unloading points: (a) 0%, (b) 40%, (c) 45%, (d) 50%, (e) 55%, (f) 60%, (g) 65%, (h) 70%, (i) 75%, (j) 80%, (k) 85%, (l) 90%.
Applsci 12 13046 g008aApplsci 12 13046 g008b
Figure 9. Morphological characteristics of sandstone pre-peak unloading rupture including unloading points: (a) 75%, (b) 80%, (c) 85%, (d) 90%.
Applsci 12 13046 g009
Figure 10. Wave velocity variation diagram of sandstone before and after peak unloading.
Applsci 12 13046 g010
Figure 11. Re-bearing and uniaxial damage characteristics of pre-peak unloading sandstone: (1) newborn primary crack; (2) newborn secondary crack; (3) secondary primary crack; (4) secondary secondary crack.
Applsci 12 13046 g011
Figure 12. Mechanical analysis model of closed cracks under uniaxial compressive stress.
Applsci 12 13046 g012
Figure 13. Polar components of crack tip stress.
Applsci 12 13046 g013
Figure 14. Single-axis re-load crack closure expansion law.
Applsci 12 13046 g014
Table 1. Characteristic strengths of sandstone under uniaxial reloading with different peak front unloading point damage.
Test TypeUnloading Pointσci
/MPa
σcd
/Mpa
σc
/Mpa
Single-axis/13.3054.4078.63
Single-axis after injury40%10.2650.4778.93
45%9.7654.3579.15
50%8.9353.7081.16
55%9.2553.2079.70
60%8.9451.9578.06
65%10.5442.3676.01
70%11.4933.6575.05
75%4.215.6337.65
80%1.572.825.50
85%0.140.142.68
90%0.080.082.14
Publisher’s Note: MDPI stays neutral with regard to jurisdictional claims in published maps and institutional affiliations.

