Abstract
Indoor Air Quality (IAQ) is a public and occupational health concern, as we are exposed to air pollutants daily given that we spend a great amount of our time in indoor environments. IAQ can be affected by numerous factors, from outdoor pollutants that get indoors through ventilation to building materials, furnishings, and activities carried by the building occupants. Exposure to air pollutants has been linked to a panoply of adverse effects on our health, well-being, and performance. The aim of this study was to assess the IAQ in grocery stores (GSs) in the municipality of Cascais in the Lisbon metropolitan area (Portugal) to characterize the workers’ occupational exposure to air pollutants. The study was conducted in 13 small “family” grocery stores. The IAQ monitoring campaign was conducted using low-cost sensor technologies and focused on several parameters, namely: carbon dioxide (CO2), volatile organic compounds (VOCs), particulate matter (PM10 and PM2.5), temperature (T), and relative humidity (RH). Overall, the IAQ of the studied GSs complied with Portuguese legislation, except for PM2.5, where 23% of GSs presented levels above the established limit value. The mean inhaled dose of workers during a workday was estimated to be 157.7 ± 57.2 μg for PM2.5 and 165.8 ± 56.0 μg for PM10. The IAQ assessment allowed the identification of the best strategies to improve worker experience in indoor workplace environments.
1. Introduction
Unlike other resources, air is not scarce, rather, its vulnerability lies mainly in its risk of deterioration [1]. Indoor Air Quality (IAQ) has a significant impact on our well-being and health, with several adverse impacts on health being found, such as respiratory and cardiovascular illnesses, among others [2]. Indoor air hosts a complex mixture of non-biological and biological contaminants along with outdoor and indoor pollutants. Outdoor pollutants are mainly associated with vehicular traffic and industrial activities, whereas indoor pollutants are influenced by the behavior of occupants, building and furniture materials, consumer and cleaning products, and pollutants that manage to get inside through ventilation systems [2,3,4,5].
Changes in lifestyle have made us more subjected to these pollutants, as we spend most parts of our days in indoor environments (for instance, for Portuguese children, it is estimated that they spend 86% of their time indoors [6]), from public to private environments, namely home, workplace, leisure, building and commuting, where we are exposed to a panoply of pollutants that may negatively affect health welfare and productivity [3,7].
Studies by the United States Environmental Protection Agency (EPA) ranked indoor air pollution as a top five environmental risk to public health [8]. Efforts have been done to understand IAQ complexity and its impact on human health specially focused on exposure levels in different environments and activities [9,10].
As a result of the energy crisis in the 1970s, many changes in building design have been implemented, including in construction and operation, focused on making buildings as airtight as possible, to prevent “leaks” and minimize thermal energy losses. Moreover, along with these building design advancements, numerous new sources of air pollutants emerged, based, for example, on changes in lifestyle and building materials used. A change in composition and complexity of pollutants in the indoor air has been acknowledged, due, for example, to the use of more synthetic materials and chemicals in construction, decoration, cleaning agents, and consumer products [7,11]. These changes have led to low ventilation rates that impact IAQ since it promotes the indoor accumulation of pollutants, which leads to high indoor pollution levels, often 2 to 5, or even 100, times higher than the levels found in outdoor environments [7]. Moreover, indoor exposure to different indoor air pollutants may have a significant impact on occupants’ health, even at low concentrations [12]. Therefore, in the 1980s, IAQ started to be an issue of public interest when buildings’ occupants started to exhibit several sick building syndromes and efforts were conducted to understand, minimize, and/or correct those issues.
According to the United Nations Environment Programme, in 2020, IAQ was responsible for nearly 3.2 million premature deaths, and, in 2021, around 4 million [13].
In 2020, the Eurostat statistical atlas estimated that a regular person has an average duration of working life in the European Union of 35.2 years, while in Portugal, the estimative is 38.2 years [14]. Considering that an adult spends around 8 h per day at work (5 days of the week), and considering the lifetime working period, a Portuguese individual spends, on average, around 71,800 h (considering 47 working weeks per year) at work, and in some cases, even more, depending on the profession and type of work. Therefore, IAQ at workplaces may have a significant impact on worker well-being, productivity, and health due to prolonged exposure [15]. It is also important to highlight that, according to the International Labour Organization (ILO), it is estimated that around 2.3 million people endure work-related accidents and diseases every year, with around 160 million a victim of work-related illnesses [16].
Workplaces, such as shopping malls, retail stores, and supermarkets, have been studied extensively regarding IAQ [17,18,19,20,21], however, there are very few studies of grocery stores available [22,23].
The goal of the present study is to understand the IAQ (based on a multi-parameter approach) that workers in grocery stores are exposed to while working, including its compliance with relevant Portuguese legislation and international guidelines, and to define the best practices to minimize worker exposure in those workplaces. The information gathered in this study also increases the available knowledge in the field of health and safety in this type of workplace environment.
2. Materials and Methods
2.1. Study Sites and Characterisation of the Grocery Stores
The study was carried out in 13 grocery stores (GSs) in the municipality of Cascais, in the Lisbon District (Portugal). Cascais has a population of about 200,000 people. The municipality is divided into four parishes: Alcabideche, Carcavelos e Parede, Cascais e Estoril, and São Domingos de Rana. The study area has a moderate Mediterranean climate influenced by the Atlantic Ocean.
A total of 13 small “family” GSs participated voluntarily in the study, and the GSs were randomly selected from the different parishes. The location of the studied GSs is shown in Figure 1.
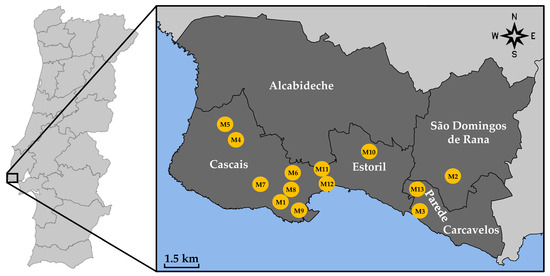
Figure 1.
Locations of the 13 studied GSs in the Cascais municipality (delimitation defined by dark grey area), within the Lisbon metropolitan area.
A survey was applied to characterize each GS in terms of the type of facilities, products, sales, and storage area, cleaning period and products, working days and hours, ventilation strategies, and the number of employees and clients per day. Regarding ventilation, it is important to highlight that, since there is a high flow of customers going in and out throughout the day, many of the GSs kept their doors open, and in the case of the ones that did not keep the door open, the door was constantly opening. Table S1 (in the Supplementary Information section) provides an overview of the characteristics of the studied GSs.
2.2. IAQ Monitoring Equipment
Indoor levels of air pollutants and comfort parameters were monitored using air quality monitoring units (MBs) based on low-cost sensors. The MBs collected real-time data of CO2, PM2.5, PM10, VOCs, RH, and T, with a 5 min monitoring frequency. These MBs were already applied with success in previous studies [10]. Figure S1 (in the Supplementary Information section) provides a description of the layout of the different sensors and components in the MBs. The sensors used in the MBs were (i) an SCD30 for CO2 (with a measuring range of 400–10,000 ppm, and accuracy of ±30 ppm), (ii) a MiCS-VZ-89TE for VOCs (with a measuring range of 0–1000 ppb in isobutylene), (iii) an HPMA115s0 for PM2.5 and PM10 (with a measuring range of 0–1000 μg.m−3, and an accuracy of 15%), and (iv) an SHT31 for temperature (T) and relative humidity (RH) (precision: ±2% RH and ±0.3 °C). After being plugged in, the MBs sent data to an online platform instantaneously via wireless, which stored the data in a cloud. Simultaneously, the data were available visually online in real time. A total of three MBs were used in this study, with the following ID: AirQ1 (A), AirQ2 (B), and AirQ3 (C).
The hardware platform that was used to manage all sensors was running by an Arduino bootloader on an ATSAMD21G18A Cortex-M0+ processor, which was responsible for measuring all the sensors, controlling airflow, and interacting with the GSM Modem (Quectel M66). Open software libraries were used to drive the used low-cost sensors, namely, for CO2, Sparkuns SCD30 (available online: https://github.com/sparkfun/SparkFun_SCD30_Arduino_Library, accessed on 2 November 2021) and for comfort parameters, Adafruits SHT31 (available online: https://github.com/adafruit/Adafruit_SHT31, accessed on 2 November 2021). For PM2.5 and PM10 (sensor HPMA115s0) and VOCs (sensor MiCS-VZ-89TE), the used libraries were developed in-house since no open-source libraries were available from mainstream hardware developers.
The performance and data reliability (Table 1) were assessed by inter-comparison with reference real-time instruments (using a monitoring frequency of 5 min), namely, a DustTrak DRX monitor (8533 model, TSI, Shoreview, MN, USA) to assess PM2.5 and PM10, and a Graywolf (IQ-610 probe, WolfSense Solutions, Shelton, CT, USA) to assess CO2, VOCs, T, and RH. Table 1 presents the intercomparison results, including the correction factors (m and b) applied to each MB.

Table 1.
Intercomparison results between MBs and the reference equipment for all the studied parameters. RMSE stands for root mean square error (assessed as described elsewhere [24]). Range REF stands for the range of the pollutant as measured by the reference equipment (REF).
Very strong correlations were obtained (R2 ranging from 0.80–1.00) for all the parameters, except for VOCs, which was considered moderate for AirQ1 (0.43) and strong for AirQ2 and AirQ3 (0.64 and 0.68, respectively).
The raw monitoring data were downloaded from the online platform and, afterward, the correction factors of each sensor and each MB were applied to the raw data, by using Microsoft Excel.
2.3. Monitoring Campaign
The MBs were placed in pre-determined locations in each GS, namely, the register, the fruits and vegetable area, or the storage area. The monitoring campaign took place between November 2021 and February 2022. The MBs were placed in each grocery store at a height of around 1.20 m for a period of 2 to 5 days. The placement and number of monitoring boxes allocated to each store were determined by the size of the GS and the existence of a storage area. Table S2 provides the location of each MB within the studied GSs.
According to the Instituto Português do Mar e Atmosfera (IPMA), November had a mean air temperature of 11.2 ± 1.2 °C (ranging from 5.8 ± 2.1 °C to 16.6 ± 0.3 °C), December had a mean air temperature of 11.7 ± 1.2 °C (ranging from 7.7 ± 1.6 °C to 15.7 ± 1.8 °C), January had a mean air temperature of 9.7 ± 0.8 °C (ranging from 4.0 ± 0.5 °C to 15.3 ± 2.2 °C), and February had a mean air temperature of 11.3 ± 1.3 °C (ranging from 5.3 ± 0.3 °C to 17.4 ± 3.0 °C) [25,26,27,28].
2.4. Statistical Analysis
Data treatment was done by using Microsoft Excel. The statistical analysis of data was performed using IBM SPSS Statistics 28 software. Normality testing was done using the Shapiro–Wilk test, where only CO2 was found not to have a normal distribution. The statistical analysis was done by using ANOVA, except for CO2, which was done with the Mann–Whitney and Kruskal–Wallis tests (for non-parametric data). All data analysis was done focusing only on the occupied period.
2.5. Exposure to PM and Inhaled Dose by Workers
Worker exposure to particulate matter (E, μg.m−3.h) incorporates both the concentration and the duration of the exposure, and it is assessed by multiplying the daily mean concentration monitored (Cj) in the GS by time spent in the GS by the worker (tj), namely, E = Cj.tj. The potential inhaled dose (D, μg), which is the amount of a contaminant that is absorbed in the body of an exposed individual over a specific period (tj), was calculated by multiplying the exposure by the Inhalation Rate (IR, m3.h−1) [6,10,29,30].
IR differs between different age groups and the different activities that individuals are performing. These values can vary from 0.3 m3.h−1 (for children and young people resting) to 2 m3.h−1 (for adults engaged in sports). Based on our study population, the activity may be characterized as a non-sedentary job and the population is between young adults (19–40 years) and middle adulthood (41–65 years) with an IR of 0.94 m3.h−1 and 1.01 m3.h−1, respectively [30]. Therefore, to calculate the potential inhaled dose of GS workers, a mean IR of 0.975 m3.h−1 was considered.
3. Results and Discussions
Table S1 shows that the total area of the studied GSs ranged from 30 m2 to 200 m2 and that the number of employees also varied, with eight GSs (corresponding to 61.5%) having two employees, three GSs (23.1%) having three employees and one GS (7.7%) having seven employees. One GS (7.7%) did not disclose this information. The daily volume of customers of the studied GSs ranged from 10 to 250 customers per day.
The results displayed below only apply to the occupied period in the GSs since it represents the relevant period to assess worker exposure to air pollutants.
3.1. Comfort Parameters
3.1.1. Temperature
Figure 2 represents the mean levels of temperature assessed in the studied GSs during the working period, where the mean temperature level was 20.4 ± 1.2 °C, ranging from a maximum value of 23.8 ± 0.8 °C (GS M5, Location A) and a minimum of 18.4 ± 1.1 °C (GS M11, Location B).
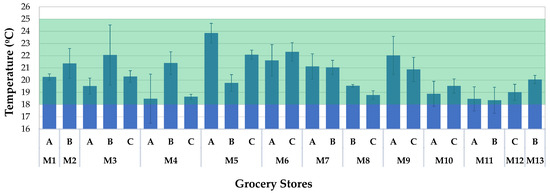
Figure 2.
Temperature levels assessed in all locations of the studied GSs. The green area represents the acceptable range (18–25 °C) for workplaces defined by Portuguese Legislation [31].
The guideline ISO 7730 establishes the optimal temperature range for indoor environments and, in winter, this range is between 20 and 24 °C [32]. Considering this range, 62% of the GSs presented mean levels within this acceptable range, while the remaining 38% showed mean temperature levels below the minimum threshold of 20 °C (namely, M4, M10, M11, and M12), which highlights the lack of heating during the cold period when the monitoring occurred.
Considering the Portuguese Decree-Law nr 243/86 of 20 August—Article 11th [31], which states that workplaces, as well as common facilities, must offer good temperature and humidity conditions, with the workplace temperature being between 18 °C and 22 °C (except for specific conditions that may reach 25 °C), all the studied GSs had mean temperature levels within the permitted range.
The type of facilities of the GSs showed to have a significant impact on temperature levels (ANOVA: F(2,22) = 3.665, p-value = 0.042), however, when performing the post hoc test to understand the differences between the influence of the different type of facilities on temperature levels, no significant difference was found (p-value for all the cases was above p-value > 0.050).
3.1.2. Relative Humidity
Figure 3 presents the mean RH levels found in each location of all the studied GSs, where a mean overall value of 51 ± 6% was found, ranging from 39.3 ± 3.5% (M4, Location C) to 64.7 ± 5.5% (M10, Location A).
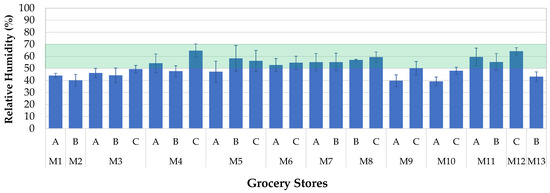
Figure 3.
Relative humidity levels assessed in all locations of the studied GSs. The green area represents the acceptable range (50–70%) for workplaces defined by Portuguese Legislation [31].
ISO 7730 establishes the optimal RH range to be between 30% and 70% [32]. Considering this range, all the studied GSs presented mean RH levels within the acceptable range. However, the Portuguese Decree-Law nr 243/86 of 20 August—Article 11th [31] establishes that the relative humidity range in workplaces, as well as common facilities, should be between 50 and 70% (green area of Figure 3). Considering this range, 7 out of 13 GSs (53%) presented mean values within this range, while the remaining GSs were always below the lower recommended limit value of 50% (M1, M2, M3, M9, M10, and M13).
3.2. Carbon Dioxide
Figure 4 presents the CO2 levels measured in all the studied locations of the GSs, where the mean CO2 level assessed was 486 ± 90 ppm, ranging from 365 ± 16 (GS 11, Location B) to 864 ± 178 (GS 4, Location B). It is important to highlight that since CO2 is only produced by occupants, this parameter is often used as an indicator of ventilation and occupancy [33]. Moreover, all the 13 studied GSs had only natural ventilation.
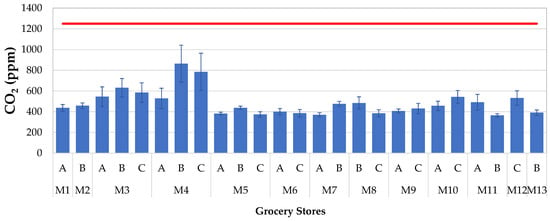
Figure 4.
CO2 levels assessed in all locations of the studied GSs. The red line represents the limit value of 1250 ppm established by Portuguese legislation [34].
Portuguese legislation (Portaria n.° 138-G/2021, de 1 de julho) [34] establishes a limit value of 1250 ppm and all GSs presented mean levels below that threshold, which was expected since the doors are mostly open during working hours, promoting good circulation of air. Studies focusing on working environments also found similar results. For instance, a study in a copy center in Aveiro, Portugal, found similar values to the present study, with CO2 levels also below the LV, with a mean level of 552 ± 65 ppm [35]. A study performed in 14 retail stores from Texas and Pennsylvania in the US also found that the average CO2 levels varied between 381 ppm and 716 ppm in all retail stores [36]. Conversely, studies conducted in residential settings showed higher levels of CO2, mainly due to the poor ventilation conditions of such spaces. For instance, a study carried out during the sleeping period of couples found levels of 1911 ± 894 ppm, which are considered very high (and above the LV), and those values were due to the type of ventilation used in bedrooms [9]. Similarly, a study carried out in Elderly Care Centers in Lisbon also found higher values of CO2 in bedrooms, with all of them exceeding the LV, with an average value of 1755 ppm [37].
The number of clients per day in each GS was found to have a significant impact on the mean CO2 levels registered in the GSs (Kruskal–Wallis Test: χ2(2) = 9.902, p-value = 0.007), with the levels found in the GSs with fewer than 100 clients per day (412 ± 13 ppm) being significantly lower than the levels found in GSs with more than 200 clients per day (636 ± 80 ppm) (p-value = 0.009, by pair-wise comparison). The size of the GSs was also found to significantly influence the indoor levels of CO2, with GSs with selling areas of below 110 m2 having lower levels (421 ± 14 ppm) than GSs with selling areas of more than 110 m2 (546 ± 40) (Mann–Whitney U Test: U = 127.000, p-value = 0.007). Since CO2 is mainly produced by human breathing, it is expected that indoor environments with higher numbers of occupants may have higher CO2 levels. Moreover, the size of the selling area of the GSs may also be an indicator of the number of clients (bigger areas may have more clients), which explains the impact of the selling area on CO2 levels. Despite the CO2 levels being below the LV in all cases, this fact also highlights that workers may be exposed to higher levels of CO2 in GSs with larger selling areas and with higher numbers of clients.
The statistical analysis also revealed that the cleaning procedure also influenced the CO2 levels, GSs that did the cleaning daily at closing having lower mean levels of CO2 (422 ± 13 ppm) than GSs that did the cleaning daily at opening or more times per day (537 ± 39 ppm) (Mann–Whitney U Test: U = 116.000, p-value = 0.033). The type of products used for cleaning also proved to have a significant impact on CO2 levels (Kruskal–Wallis Test: χ2(2) = 6.846, p-value = 0.033), with the levels of CO2 in GSs that used products of domestic use being significantly lower (425 ± 16 ppm) than GSs that used products of domestic use but designated as environmentally friendly (587 ± 25 ppm).
However, the interpretation of these results is not direct and these influences may incorporate the contribution of the size of the selling area and the number of clients per day (since bigger spaces implemented cleaning more frequently and used specific types of products).
3.3. Volatile Organic Compounds
All assessed mean levels of VOCs at all GSs were below the limit value of 262 ppb (corresponding to 600 µg.m−3) established by Portuguese legislation [34], as shown in Figure 5. The overall mean of VOCs at all GSs was 51.2 ± 20.6 ppb, ranging from 11.1 ± 12.7 ppb (at GS2, Location B) to 109.5 ± 18.6 ppb (at GS10, Location C).
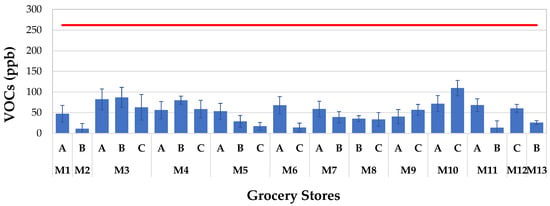
Figure 5.
VOC levels assessed in all locations of the studied GSs. The red line represents the limit value of 262 ppb established by Portuguese legislation [34].
The cleaning procedure was revealed to have a significant impact on the mean VOC levels found in the GSs, with GSs that did the cleaning daily at closing having significantly lower mean VOCs levels (37.6 ± 20.8 ppb) than GSs that did the cleaning daily at opening or more times per day (61.8 ± 24.0 ppb) (ANOVA: F(1,23) = 7.003, p-value = 0.014). The type of products used for cleaning also showed to have a significant impact on VOC levels (ANOVA: F(2,22) = 3.497, p-value = 0.048). However, when performing the post hoc test to understand the differences between the influence of the different types of used products on VOC levels, no significant difference was found (the p-value for all the cases was above 0.050). The biggest difference was found for GSs that used products of domestic use (38.9 ± 21.7 ppb) and GSs that used products of domestic use but designated as environmentally friendly (77.3 ± 12.7 ppb) (p-value = 0.057).
Similarly to with CO2, it was also found that the number of clients had an impact on the VOCs levels found in the GSs (ANOVA: F(2,22) = 5.800, p-value = 0.009), with GSs that had fewer than 100 clients per day being significantly lower (36.8 ± 20.0 ppb) that GSs that had more than 200 clients per day (75.2 ± 21.5 ppb) (p-value = 0.009). GSs with selling areas equal or below to 110 m2 were also found to have significantly lower levels (36.0 ± 18.2 ppb) than GSs that had selling areas of higher than 110 m2 (51.2 ± 25.3 ppb) (ANOVA: F(1,23) = 12.109, p-value = 0.002).
3.4. Particulate Matter
Figure 6 and Figure 7 present the mean PM2.5 and PM10 levels assessed in each studied location of all the GSs, respectively. Regarding PM2.5, 23.1% of the 13 GSs presented mean PM2.5 levels above the limit value of 25 μg.m−3 established by Portuguese legislation [34], namely, M3, M9, and M10. Considering PM10, all GSs presented mean values below the limit value of 50 μg.m−3 established by Portuguese legislation [34].
Considering World Health Organization (WHO) air quality guidelines, which establish guideline values of 5 μg.m−3 and 15 μg.m−3 for PM2.5 and PM10, respectively, all the GSs presented PM2.5 levels above the guideline value and only four GSs presented PM10 levels below the PM10 guideline value (M2, M4, M5, and M12).
The variability of indoor particle levels was found to be high among the studied GSs, with mean levels of 20.2 ± 7.3 μg.m−3 (ranging from 1.4 μg.m−3 to 278.5 μg.m−3) for PM2.5 and 21.3 ± 7.2 μg.m−3 (ranging from 2.9 μg.m−3 to 279.0 μg.m−3) for PM10. It is important to highlight that these levels were obtained with the monitoring instruments in different locations and GSs. Sudden increases in PM concentrations indoors are typically due to indoor activities [38]. Additionally, the movement of people in these environments is high since there are always clients coming in and out of the store and, therefore, the possibility of resuspension of dust is elevated [33]. GS stores with selling areas of more than 100 m2 proved to have significantly higher levels of PM2.5 (24.0 ± 10.8 μg.m−3) and PM10 (24.9 ± 10.7 μg.m−3) when compared with GSs with lower selling areas (PM2.5: 16.5 ± 4.8 μg.m−3, ANOVA: F(1,23) = 4.816, p-value = 0.039; PM10: 24.0 ± 10.8 μg.m-3, ANOVA: F(1,23) = 4.760, p-value = 0.040).
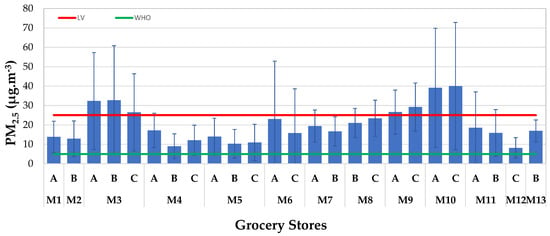
Figure 6.
PM2.5 levels assessed in all locations of the studied GSs. The red line represents the limit value (LV) of 25 µg.m−3 established by Portuguese legislation [34] and the green line represents the air quality guideline of 5 µg.m−3 established by the WHO [39].
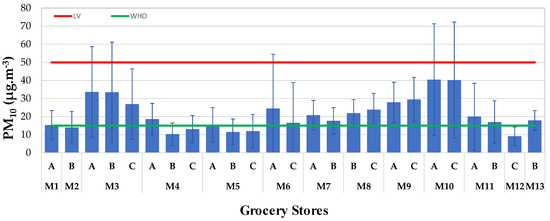
Figure 7.
PM10 levels assessed in all locations of the studied GSs. The red line represents the limit value (LV) of 50 µg.m−3 established by Portuguese legislation [34] and the green line represents the air quality guideline of 15 µg.m−3 established by the WHO [39].
Similar results were found in a study in classrooms in France, with mean PM2.5 levels of 22 ± 8 μg.m−3, ranging from 10 to 47 μg.m−3 [40]. In contrast, less-crowded environments have a lower possibility of resuspension of particles. Therefore, for example, a study in elderly care centers in Lisbon assessed lower PM10 levels, ranging from 11 μg.m−3 to 19 μg.m−3 [33].
In relation to the influence of other GS characteristics, no other significant impacts were found on either PM2.5 or PM10. However, some studies showed that some activities in houses had peak concentrations of PM, such as during the preparation of breakfast, tea, and toast, and natural-gas burning, as well as other types of cooking [41,42,43]. Some retail environments have different indoor spaces within and with different associated activities, which can promote different emissions of pollutants (including particulate matter, from fine to ultrafine particles) [44]. This is the case for some of the studied GSs, which have different areas within, such as a bakery or coffee shop, that may promote higher levels of PM when compared with GSs without those types of facilities.
Exposure to PM and Inhaled Dose by Workers
The exposure to and the associated potential inhaled dose of PM in the GSs during working hours (8 h) are described in Table 2. Exposure to PM10 and PM2.5 were estimated to be 170.0 ± 57.4 μg.m−3.h and 161.7 ± 58.7 μg.m−3.h, respectively. Figure 8 presents PM2.5 exposure levels of workers at all studied locations of the GSs, considering a working period of 8 h.

Table 2.
PM10 and PM2.5 exposure and correspondent potential inhaled dose during the working period at the studied GSs.
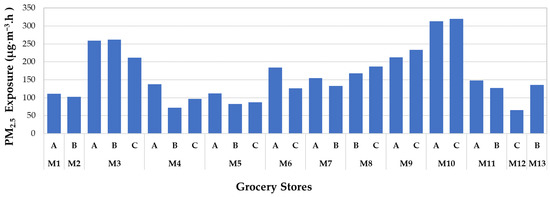
Figure 8.
PM2.5 exposure levels of workers at all studied locations of the GSs, considering a working period of 8 h.
The exposure levels found were higher than those found in the bedrooms of university student residences, which were 62.9 ± 24.3 μg.m−3.h and 76.3 ± 26.3 μg.m−3.h for PM2.5 and PM10, respectively [10]. Another study carried out in the bedrooms of couples in Lisbon dwellings during sleeping periods estimated exposures to PM2.5 and PM10 of 113.6 ± 64.8 μg.m−3.h and 148.1 ± 84.8 μg.m−3.h, respectively [9]. In a study on children’s exposure and dose assessment to PM in Lisbon (which accounted for the period spent in school as well), higher values were found, namely, 218 μg.m−3.h and 404 μg.m−3.h for PM2.5 and PM10, during weekdays, respectively [6].
The inhaled dose depends on the activity performed and the inhalation rate of the person. For the present study, the individual’s inhalation rate was considered to be 0.975 m3.h−1 (active person) and the mean inhalation dose of the workers of the studied GSs was 157.7 ± 57.2 μg for PM2.5 (ranging from 63.4 μg at M12 to 312.3 μg at M10, location C) and 165.8 ± 56.0 μg for PM10 (ranging from 71.4 μg at M12 to 315.3 μg at M10, location A). The study focusing on children found that the average daily amount inhaled was 243.5 μg and 382.2 μg for PM2.5 and PM10, respectively, which may be explained because schools typically have more sources of PM [6], such as chalk [45].
3.5. Discussion
The present study presents some limitations such as: (i) the impossibility of performing measurements near the breathing zone, which would be the best approach, in order to assess human exposure; (ii) the location of the MBs, since MB had to be connected to power lines and, therefore, occasionally, had to stay lower or above the breathing zone; and (iii) the lack of studies available in grocery stores did not allow a comparison of the present results with similar micro-environments.
It is also important to highlight that the use of low-cost sensors in such studies relies on the performance of the sensors, their specifications, and the environmental conditions under which they are used. Despite the inter-comparison with reference real-time instruments allowing us to obtain calibration factors with R2 above 0.90 (except for VOCs), which were applied afterward to the raw data, the inter-comparison procedure was done only before the monitoring campaign. However, during the monitoring campaign (which took three months), the sensors may have changed slightly in performance. Therefore, in future studies, it is important to evaluate the performance of the sensors during several moments of the monitoring campaign to understand if the calibrations should be updated from time to time.
Regarding the hourly variability of IAQ parameters, this was found mainly with T and CO2, as shown by Figure S2 (in the supplementary section), which provides the hourly variability of all studied parameters for the GS M4, at location B.
Overall, the only air pollutant that showed levels above the limit value established by the IAQ Portuguese legislation was PM2.5. Regarding comfort parameters, around half of the studied grocery stores showed relative humidity levels below the lower limit value (50%) established by Portuguese legislation.
A large proportion of the indoor particles may come from indoor sources, such as cooking, cleaning, and resuspension of particles, due to the movement of the occupants. As it was possible to observe in the results, an association between the levels of particulate matter and the selling area (which may indicate a higher movement of clients) was found, which can indicate higher levels of resuspension of particles in GSs with bigger selling areas. Since some human activities may influence PM levels, for GSs with a bakery or coffee shop, along with facilities related to the consumption of food, some suggestions to reduce the PM levels may be: (1) change from fuel-based combustion stoves (such as gas) to electric ones; and (2) the installation of exhaust fans vented to the outside when preparing the foods. Moreover, the installation of local air purifiers can help to filter PM in the air and to reduce the levels of this pollutant. However, it is crucial to maintain the equipment, namely, to replace the filter regularly to achieve good results. These strategies may promote the reduction of PM levels due to specific facilities of the GSs.
4. Conclusions
This study aimed to assess indoor air quality in small grocery stores in the Lisbon metropolitan area. This information focused on indoor air pollutants and thermal comfort parameters, allowing an assessment of worker exposure to the air pollutants in their work environment to be performed.
Overall, all the studied GSs complied with Portuguese legislation regarding IAQ, except for fine particulate matter (PM2.5), where 3 out of the 13 GSs exceeded the limit value established by the Portuguese legislation. Regarding comfort parameters, around half of the studied grocery stores showed relative humidity levels below the lower limit value (50%) established by Portuguese legislation.
Based on the characterization of IAQ at these specific micro-environments, some control measures could be identified to reduce the levels of PM. The results of this study are a valuable contribution to the provision of IAQ characterization in grocery stores, a micro-environment that has been neglected in the literature. Further work should focus on the workers' perception of IAQ and comfort parameters and potentially evaluate how they influence their performance and welfare.
Supplementary Materials
The following supporting information can be downloaded at: https://www.mdpi.com/article/10.3390/app122412940/s1, Figure S1: Layout of the different low-cost sensors and components within the MB, where uP stands for microcontroller; Figure S2: Example of the hourly variability of the GS M4, at location B; Table S1: Summary of the characteristics of the studied GSs, including cleaning procedures and opening periods. N/A—not available information; TS/SS—technical sheet/safety sheet; Table S2: Details of the performed monitoring campaign, including monitoring period and locations of the MBs within the GSs.
Author Contributions
T.B., M.A.-S. and N.C. were responsible for the study design; D.S. and C.D. were responsible for the creation of the IAQ monitoring units based in low-cost sensors; T.B. and N.C. performed the data and results’ analysis, including statistical analysis and creation of figures; T.B. wrote the original draft; M.A.-S. and N.C. contributed to the review and editing of the original draft. All authors have read and agreed to the published version of the manuscript.
Funding
N. Canha acknowledges the funding by national funds through FCT-Fundação para a Ciência e Tecnologia, I.P. (Portugal) for his contract 2021.00088.CEECIND and for the project HypnosAir (PTDC/CTA-AMB/3263/2021). FCT support is also acknowledged by the C2TN/IST authors (UIDB/04349/2020 + UIDP/04349/2020). H&TRC authors gratefully acknowledge the FCT/MCTES national support through the UIDB/05608/2020 and UIDP/05608/2020.
Data Availability Statement
The data that support the findings of this study are available upon request to the corresponding author.
Conflicts of Interest
The authors declare no conflict of interest.
References
- APA Air and Noise | Relatório Do Estado Do Ambiente. Available online: https://rea.apambiente.pt/environment_area/air?language=en (accessed on 5 October 2022).
- Vardoulakis, S.; Giagloglou, E.; Steinle, S.; Davis, A.; Sleeuwenhoek, A.; Galea, K.S.; Dixon, K.; Crawford, J.O. Indoor Exposure to Selected Air Pollutants in the Home Environment: A Systematic Review. Int. J. Environ. Res. Public Health 2020, 17, 8972. [Google Scholar] [CrossRef] [PubMed]
- Cincinelli, A.; Martellini, T. Indoor Air Quality and Health. Int. J. Environ. Res. Public Health 2017, 14, 1286. [Google Scholar] [CrossRef] [PubMed]
- Marć, M.; Śmiełowska, M.; Namieśnik, J.; Zabiegała, B. Indoor Air Quality of Everyday Use Spaces Dedicated to Specific Purposes—a Review. Environ. Sci. Pollut. Res. 2018, 25, 2065–2082. [Google Scholar] [CrossRef] [PubMed]
- MacNeill, M.; Kearney, J.; Wallace, L.; Gibson, M.; Héroux, M.E.; Kuchta, J.; Guernsey, J.R.; Wheeler, A.J. Quantifying the Contribution of Ambient and Indoor-Generated Fine Particles to Indoor Air in Residential Environments. Indoor Air 2014, 24, 362–375. [Google Scholar] [CrossRef]
- Faria, T.; Martins, V.; Correia, C.; Canha, N.; Diapouli, E.; Manousakas, M.; Eleftheriadis, K.; Almeida, S.M. Children’s Exposure and Dose Assessment to Particulate Matter in Lisbon. Build. Environ. 2020, 171, 106666. [Google Scholar] [CrossRef]
- Mannan, M.; Al-Ghamdi, S.G. Indoor Air Quality in Buildings: A Comprehensive Review on the Factors Influencing Air Pollution in Residential and Commercial Structure. Int. J. Environ. Res. Public Health 2021, 18, 3276. [Google Scholar] [CrossRef]
- US EPA Why Indoor Air Quality Is Important to Schools | US EPA. Available online: https://www.epa.gov/iaq-schools/why-indoor-air-quality-important-schools (accessed on 6 October 2022).
- Canha, N.; Alves, A.C.; Marta, C.S.; Lage, J.; Belo, J.; Faria, T.; Cabo Verde, S.; Viegas, C.; Alves, C.; Almeida, S.M. Compliance of Indoor Air Quality during Sleep with Legislation and Guidelines – A Case Study of Lisbon Dwellings. Environ. Pollut. 2020, 264, 114619. [Google Scholar] [CrossRef]
- Ramos, J.; Belo, J.; Silva, D.; Diogo, C.; Almeida, S.M.; Canha, N. Influence of Indoor Air Quality on Sleep Quality of University Students in Lisbon. Atmos. Pollut. Res. 2022, 13, 101301. [Google Scholar] [CrossRef]
- Jones, A.P. Indoor Air Quality and Health. Atmos. Environ. 1999, 33, 4535–4564. [Google Scholar] [CrossRef]
- Simoni, M.; Jaakkola, M.S.; Carrozzi, L.; Baldacci, S.; Di Pede, F.; Viegi, G. Indoor Air Pollution and Respiratory Health in the Elderly. Eur. Respir. J. 2003, 21, 15S–20S. [Google Scholar] [CrossRef]
- United Nations Environment Programme (UNEP) Seven Things You Should Know about Household Air Pollution. Available online: https://www.unep.org/news-and-stories/story/seven-things-you-should-know-about-household-air-pollution (accessed on 24 August 2022).
- World Economic Forum How Long Is the Average Working Life in Your Country? | World Economic Forum. Available online: https://www.weforum.org/agenda/2020/07/europe-eu-work-working-life-duration-countries-comparison (accessed on 7 September 2022).
- Mujan, I.; Anđelković, A.S.; Munćan, V.; Kljajić, M.; Ružić, D. Influence of Indoor Environmental Quality on Human Health and Productivity - A Review. J. Clean. Prod. 2019, 217, 646–657. [Google Scholar] [CrossRef]
- International Labour Organization World Statistic. Available online: https://www.ilo.org/moscow/areas-of-work/occupational-safety-and-health/WCMS_249278/lang--en/index.htm (accessed on 7 September 2022).
- Li, W.-M.; Lee, S.C.; Chan, L.Y. Indoor Air Quality at Nine Shopping Malls in Hong Kong. Sci. Total Environ. 2001, 273, 27–40. [Google Scholar] [CrossRef] [PubMed]
- Robert, L.; Guichard, R.; Klingler, J.; Cochet, V.; Mandin, C. Indoor Air Quality in Shopping and Storage Areas. Indoor Air 2021, 31, 1238–1251. [Google Scholar] [CrossRef]
- Robert, L.; Guichard, R.; Klingler, J. Work Exposure to VOC in Storage Areas of Retail Stores. Ann. Work Expo. Heal. 2021, 65, 319–331. [Google Scholar] [CrossRef] [PubMed]
- Lindberg, U.; Fahlén, P.; Axell, M.; Fransson, N. Thermal Comfort in the Supermarket Environment – Multiple Enquiry Methods and Simultaneous Measurements of the Thermal Environment. Int. J. Refrig. 2017, 82, 426–435. [Google Scholar] [CrossRef]
- Almutairi; Alsanad; Alhelailah Evaluation of the Indoor Air Quality in Governmental Oversight Supermarkets (Co-Ops) in Kuwait. Appl. Sci. 2019, 9, 4950. [CrossRef]
- Chan, W.R.; Cohn, S.; Sidheswaran, M.; Sullivan, D.P.; Fisk, W.J. Contaminant Levels, Source Strengths, and Ventilation Rates in California Retail Stores. Indoor Air 2015, 25, 381–392. [Google Scholar] [CrossRef] [PubMed]
- Chan, W.R.; Sidheswaran, M.; Sullivan, D.P.; Cohn, S.; Fisk, W.J. Cooking-related PM2.5 and Acrolein Measured in Grocery Stores and Comparison with Other Retail Types. Indoor Air 2016, 26, 489–500. [Google Scholar] [CrossRef]
- Borrego, C.; Costa, A.M.; Ginja, J.; Amorim, M.; Coutinho, M.; Karatzas, K.; Sioumis, T.; Katsifarakis, N.; Konstantinidis, K.; De Vito, S.; et al. Assessment of Air Quality Microsensors versus Reference Methods: The EuNetAir Joint Exercise. Atmos. Environ. 2016, 147, 246–263. [Google Scholar] [CrossRef]
- IPMA Boletim Climático Portugal Continental - Dezembro 2021. Available online: https://www.ipma.pt/resources.www/docs/im.publicacoes/edicoes.online/20220107/zbvqFuHJAcgoIQtzVatZ/cli_20211201_20211231_pcl_mm_co_pt.pdf (accessed on 14 October 2022).
- IPMA Boletim Climático Portugal Continental - Novembro 2021. Available online: https://www.ipma.pt/resources.www/docs/im.publicacoes/edicoes.online/20211207/EflJizZEllJqeKWDmYro/cli_20211101_20211130_pcl_mm_co_pt.pdf (accessed on 14 October 2022).
- IPMA Boletim Climático Portugal Continental - Fevereiro 2022. Available online: https://www.ipma.pt/resources.www/docs/im.publicacoes/edicoes.online/20220310/SwIlXADgyXIcWQnvaLam/cli_20220201_20220228_pcl_mm_co_pt.pdf (accessed on 17 October 2022).
- IPMA Boletim Climático Portugal Continental - Janeiro 2022. Available online: https://www.ipma.pt/resources.www/docs/im.publicacoes/edicoes.online/20220204/FGdTvyAzNYKcsCOxBZMy/cli_20220101_20220131_pcl_mm_co_pt.pdf (accessed on 17 October 2022).
- Gardner, D.E.; Kirkpatrick, D.T. Respiratory Tract. In Encyclopedia of Toxicology; Elsevier: Amsterdam, The Netherlands, 2005; pp. 665–698. ISBN 9780123694003. [Google Scholar]
- Buonanno, G.; Giovinco, G.; Morawska, L.; Stabile, L. Tracheobronchial and Alveolar Dose of Submicrometer Particles for Different Population Age Groups in Italy. Atmos. Environ. 2011, 45, 6216–6224. [Google Scholar] [CrossRef]
- DRE Decreto-Lei n.o 243/86 | DRE. Available online: https://dre.pt/dre/detalhe/decreto-lei/243-1986-219080 (accessed on 14 July 2022).
- ISO 7730; Ergonomics of the Thermal Environment—Analytical Determination and Interpretation of Thermal Comfort Using Calculation of the PMV and PPD Indices and Local Thermal Comfort Criteria. International Organization for Standardization: Geneva, Switzerland, 2005.
- Almeida-Silva, M.; Almeida, S.M.; Pegas, P.N.; Nunes, T.; Alves, C.A.; Wolterbeek, H.T. Exposure and Dose Assessment to Particle Components among an Elderly Population. Atmos. Environ. 2015, 102, 156–166. [Google Scholar] [CrossRef]
- Portaria n.o 138-G/2021 | DRE. Available online: https://dre.pt/dre/detalhe/portaria/138-g-2021-166296490?_ts=1657497600034 (accessed on 6 September 2022).
- Vicente, E.D.; Ribeiro, J.P.; Custódio, D.; Alves, C.A. Assessment of the Indoor Air Quality in Copy Centres at Aveiro, Portugal. Air Qual. Atmos. Heal. 2017, 10, 117–127. [Google Scholar] [CrossRef]
- Zhao, M.; Kim, Y.-S.; Srebric, J. Occupant Perceptions and a Health Outcome in Retail Stores. Build. Environ. 2015, 93, 385–394. [Google Scholar] [CrossRef]
- Almeida-Silva, M.; Wolterbeek, H.T.; Almeida, S.M. Elderly Exposure to Indoor Air Pollutants. Atmos. Environ. 2014, 85, 54–63. [Google Scholar] [CrossRef]
- Morawska, L.; Ayoko, G.A.; Bae, G.N.; Buonanno, G.; Chao, C.Y.H.; Clifford, S.; Fu, S.C.; Hänninen, O.; He, C.; Isaxon, C.; et al. Airborne Particles in Indoor Environment of Homes, Schools, Offices and Aged Care Facilities: The Main Routes of Exposure. Environ. Int. 2017, 108, 75–83. [Google Scholar] [CrossRef]
- WHO Global Air Quality Guidelines. Available online: https://apps.who.int/iris/handle/10665/345329 (accessed on 1 February 2022).
- Canha, N.; Mandin, C.; Ramalho, O.; Wyart, G.; Ribéron, J.; Dassonville, C.; Hänninen, O.; Almeida, S.M.; Derbez, M. Assessment of Ventilation and Indoor Air Pollutants in Nursery and Elementary Schools in France. Indoor Air 2016, 26, 350–365. [Google Scholar] [CrossRef]
- Wallace, L. Indoor Sources of Ultrafine and Accumulation Mode Particles: Size Distributions, Size-Resolved Concentrations, and Source Strengths. Aerosol Sci. Technol. 2006, 40, 348–360. [Google Scholar] [CrossRef]
- Wierzbicka, A.; Bohgard, M.; Pagels, J.H.; Dahl, A.; Löndahl, J.; Hussein, T.; Swietlicki, E.; Gudmundsson, A. Quantification of Differences between Occupancy and Total Monitoring Periods for Better Assessment of Exposure to Particles in Indoor Environments. Atmos. Environ. 2015, 106, 419–428. [Google Scholar] [CrossRef]
- Canha, N.; Lage, J.; Galinha, C.; Coentro, S.; Alves, C.; Almeida, S. Impact of Biomass Home Heating, Cooking Styles, and Bread Toasting on the Indoor Air Quality at Portuguese Dwellings: A Case Study. Atmosphere 2018, 9, 214. [Google Scholar] [CrossRef]
- Zaatari, M.; Nirlo, E.; Jareemit, D.; Crain, N.; Srebric, J.; Siegel, J. Ventilation and Indoor Air Quality in Retail Stores: A Critical Review (RP-1596). HVAC&R Res. 2014, 20, 276–294. [Google Scholar] [CrossRef]
- Canha, N.; Almeida, S.M.; Freitas, M.D.C.; Trancoso, M.; Sousa, A.; Mouro, F.; Wolterbeek, H.T. Particulate Matter Analysis in Indoor Environments of Urban and Rural Primary Schools Using Passive Sampling Methodology. Atmos. Environ. 2014, 83, 21–34. [Google Scholar] [CrossRef]
Publisher’s Note: MDPI stays neutral with regard to jurisdictional claims in published maps and institutional affiliations. |
© 2022 by the authors. Licensee MDPI, Basel, Switzerland. This article is an open access article distributed under the terms and conditions of the Creative Commons Attribution (CC BY) license (https://creativecommons.org/licenses/by/4.0/).