
An Enhanced Water Quality Index for Water Quality Monitoring Using Remote Sensing and Machine Learning


Abstract
:1. Introduction
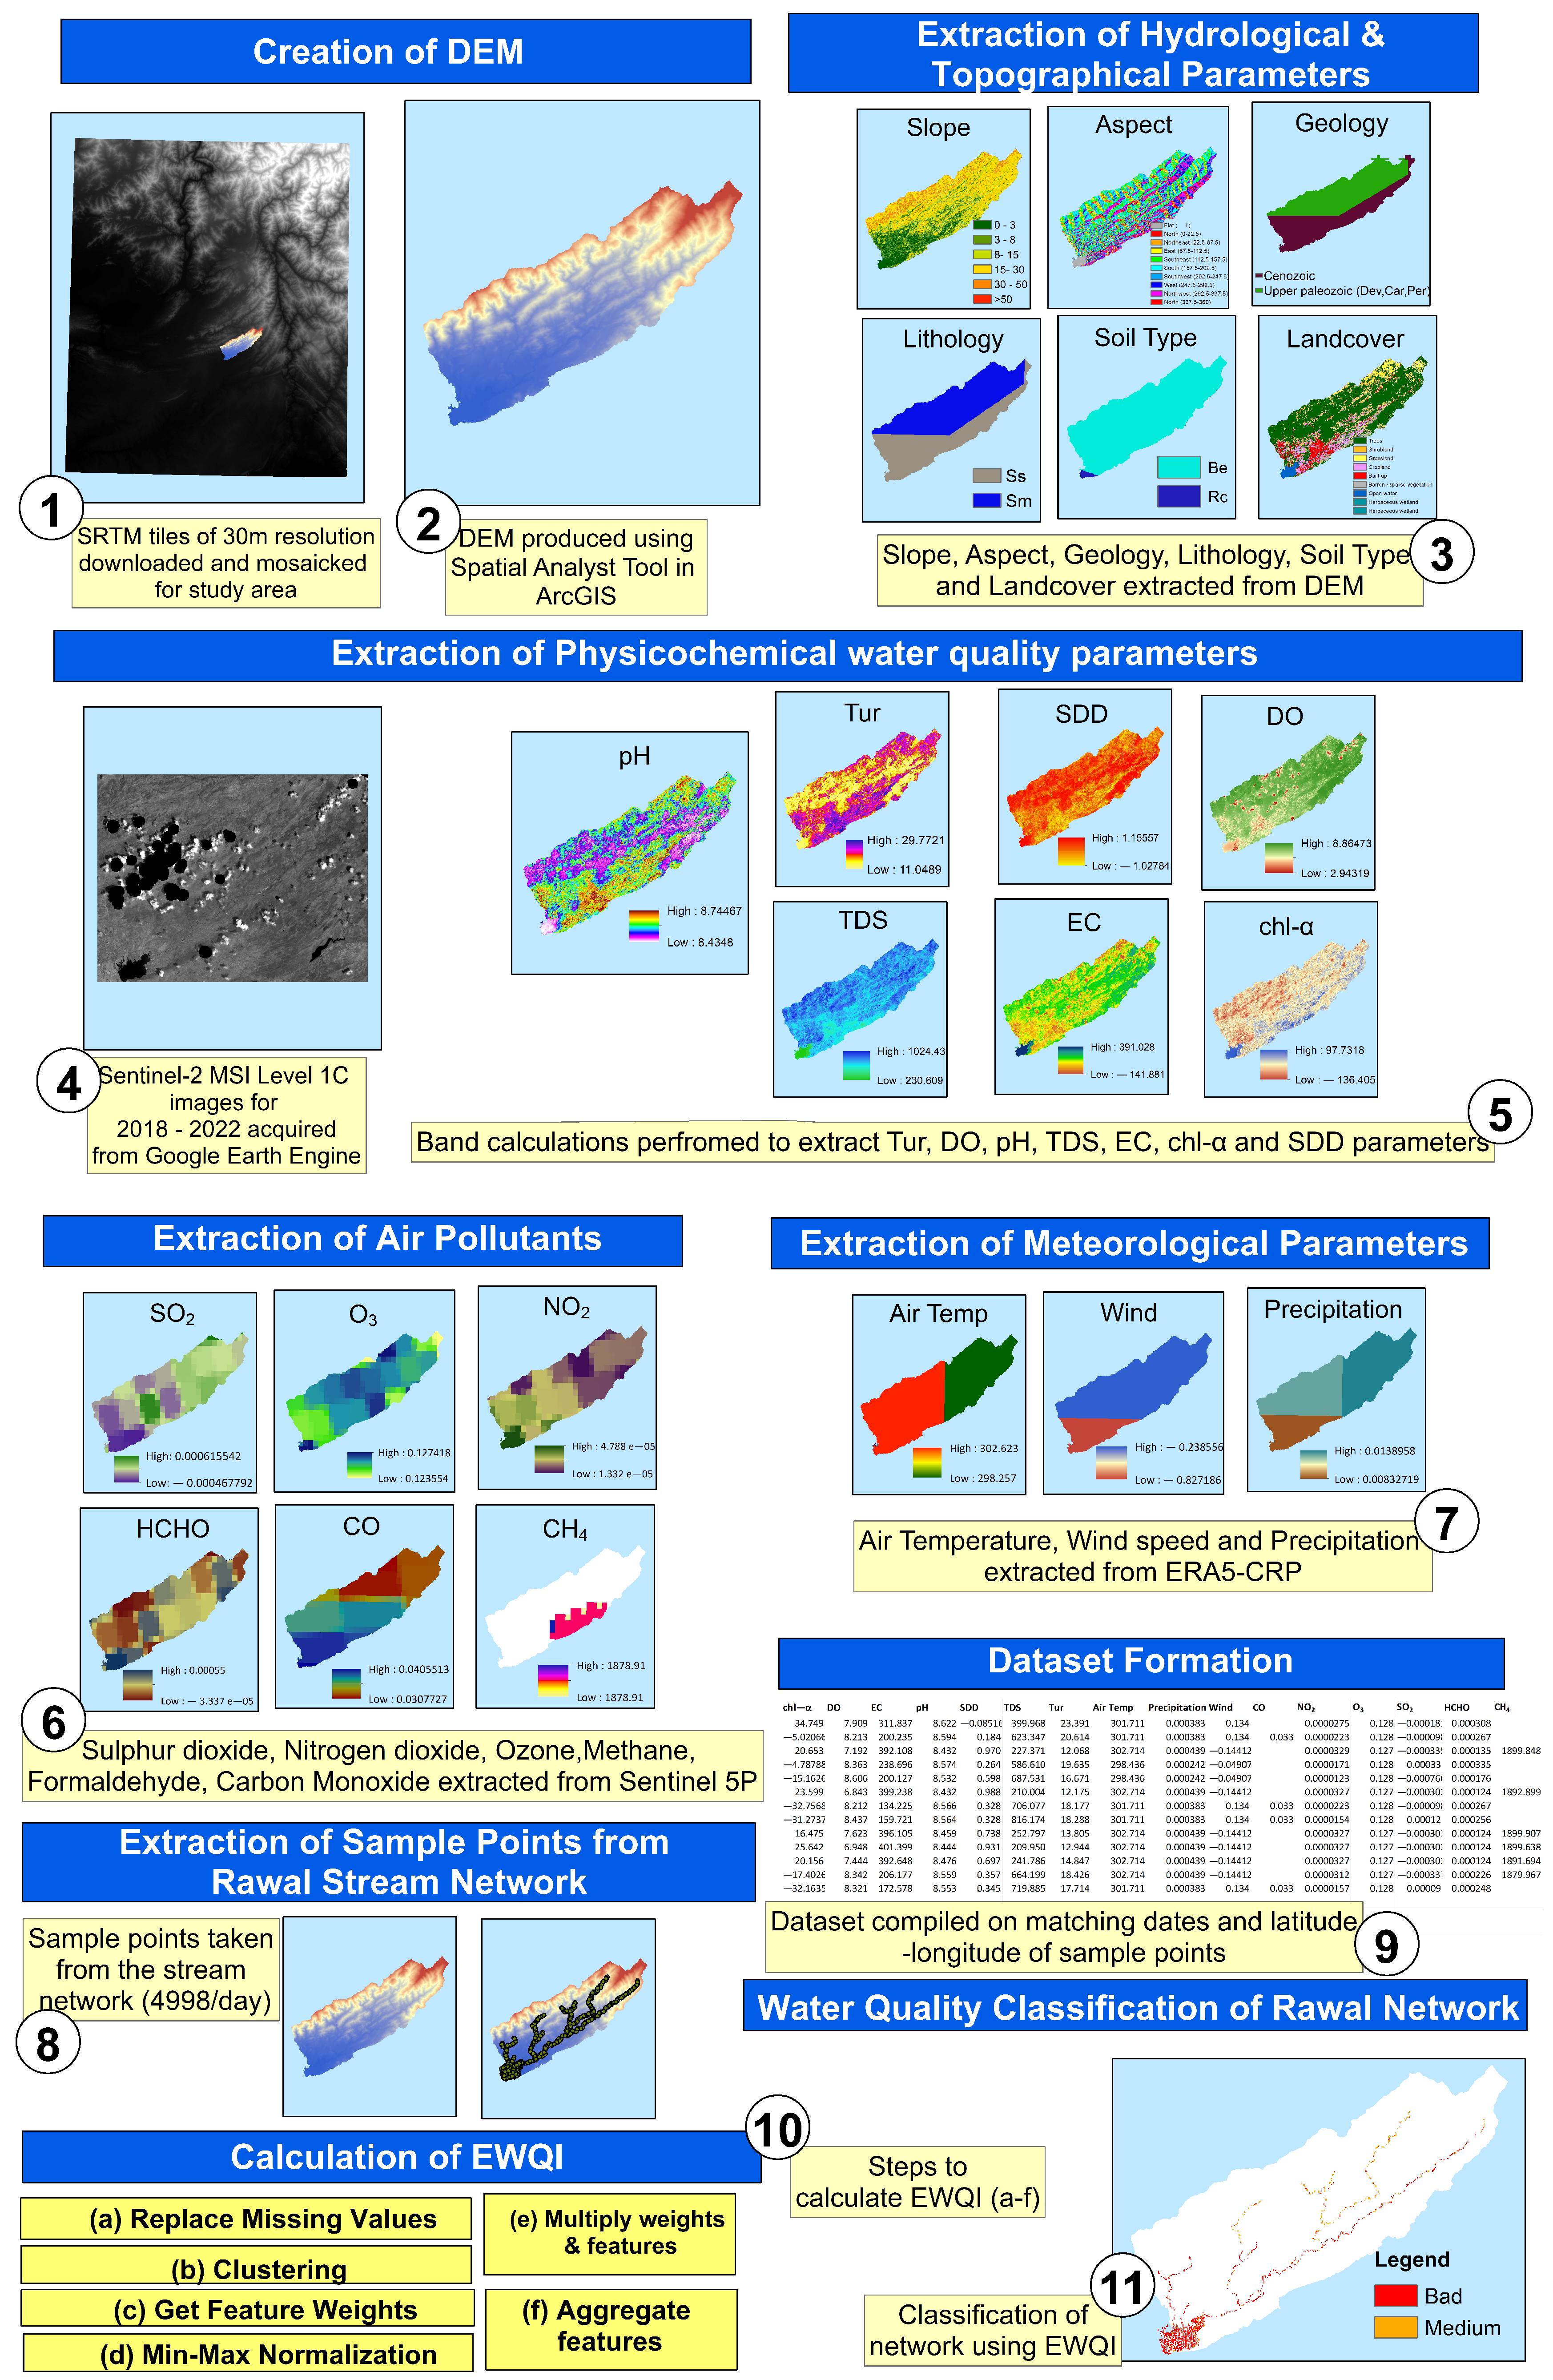
- Twenty-two parameters are extracted for the stream network of the Rawal watershed that include seven water quality parameters, six air pollutants and three meteorological and six hydrological/topographical parameters pertaining to the years (2018–2022) for the monsoon months of June to September.
- A multimodal indexing technique, EWQI, is proposed that involves five steps: parameter selection, sub-index calculation, weight assignment, aggregation of sub-indices and classification using a machine learning approach for weight assignment, sub-index calculation and remote sensing technology for parameter selection to extract twenty-two multimodal parameters.
2. Literature Review
3. Enhanced Water Quality Index
3.1. Parameter Selection
3.2. Sub-Index Calculation
3.3. Weight Assignment
3.4. Sub-Indices Aggregation
3.5. Classification
4. Methodology
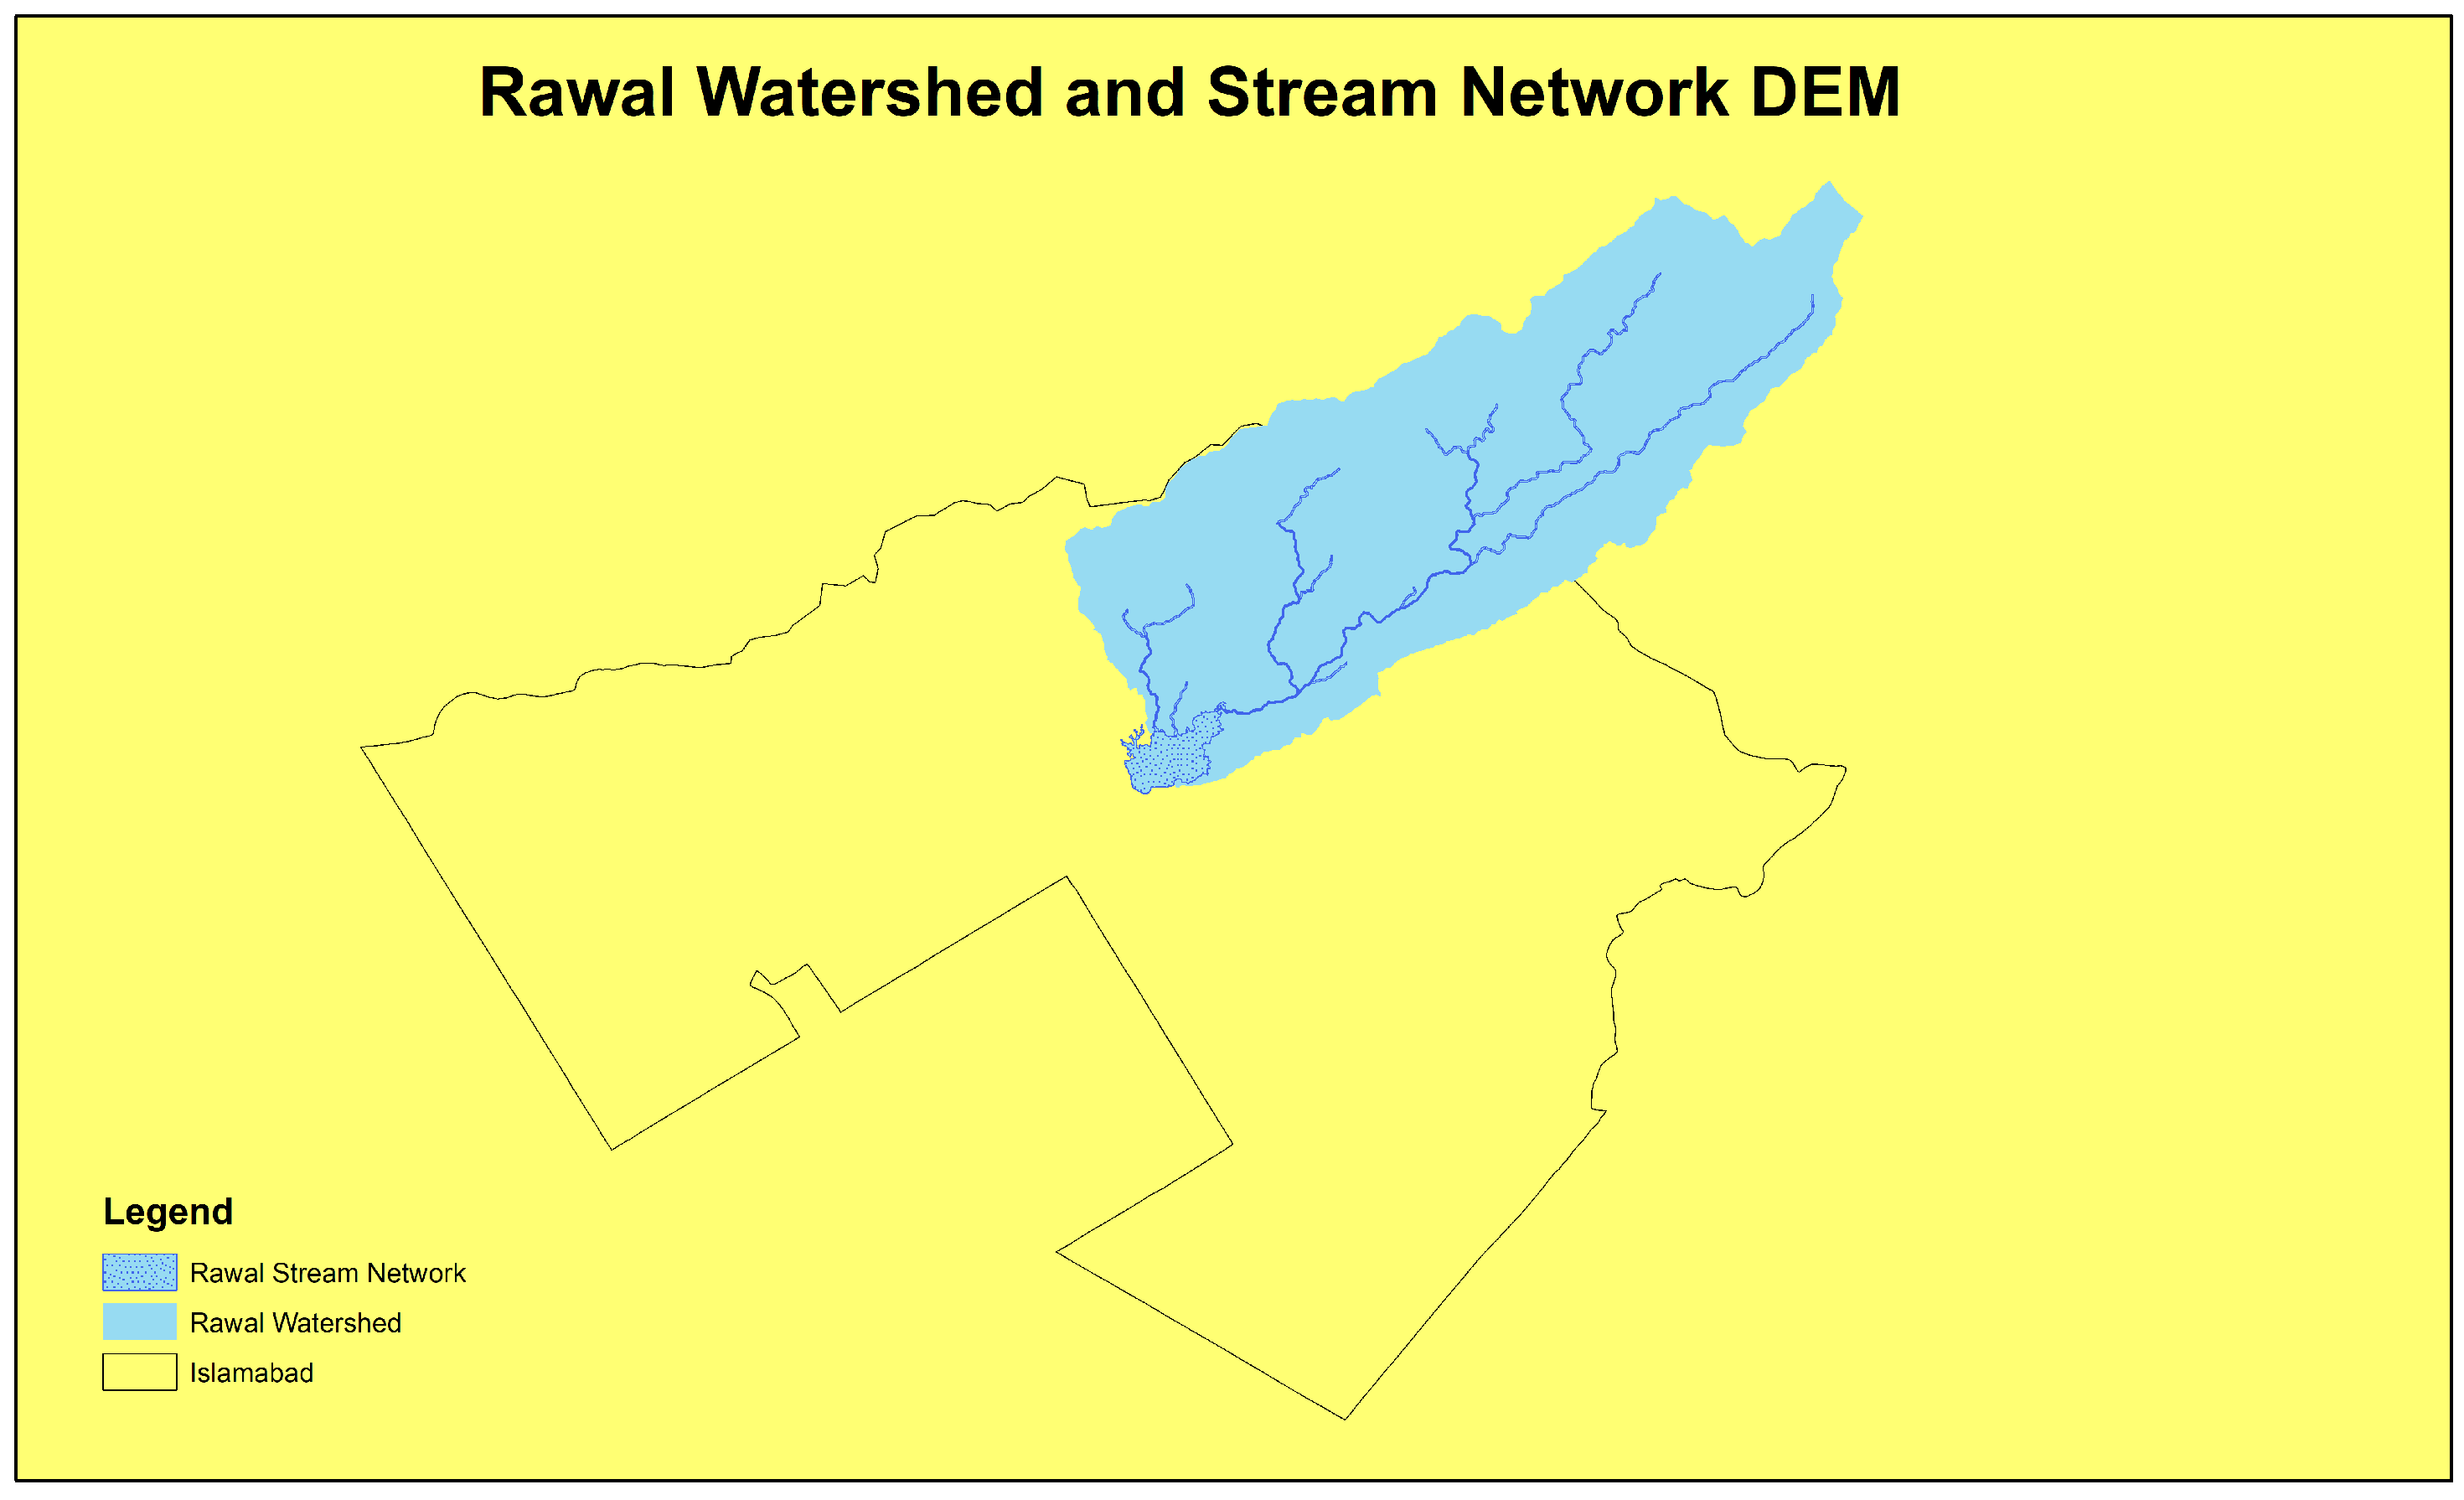
4.1. Study Area
4.2. Data Acquisition
4.2.1. Physico-Chemical Parameters
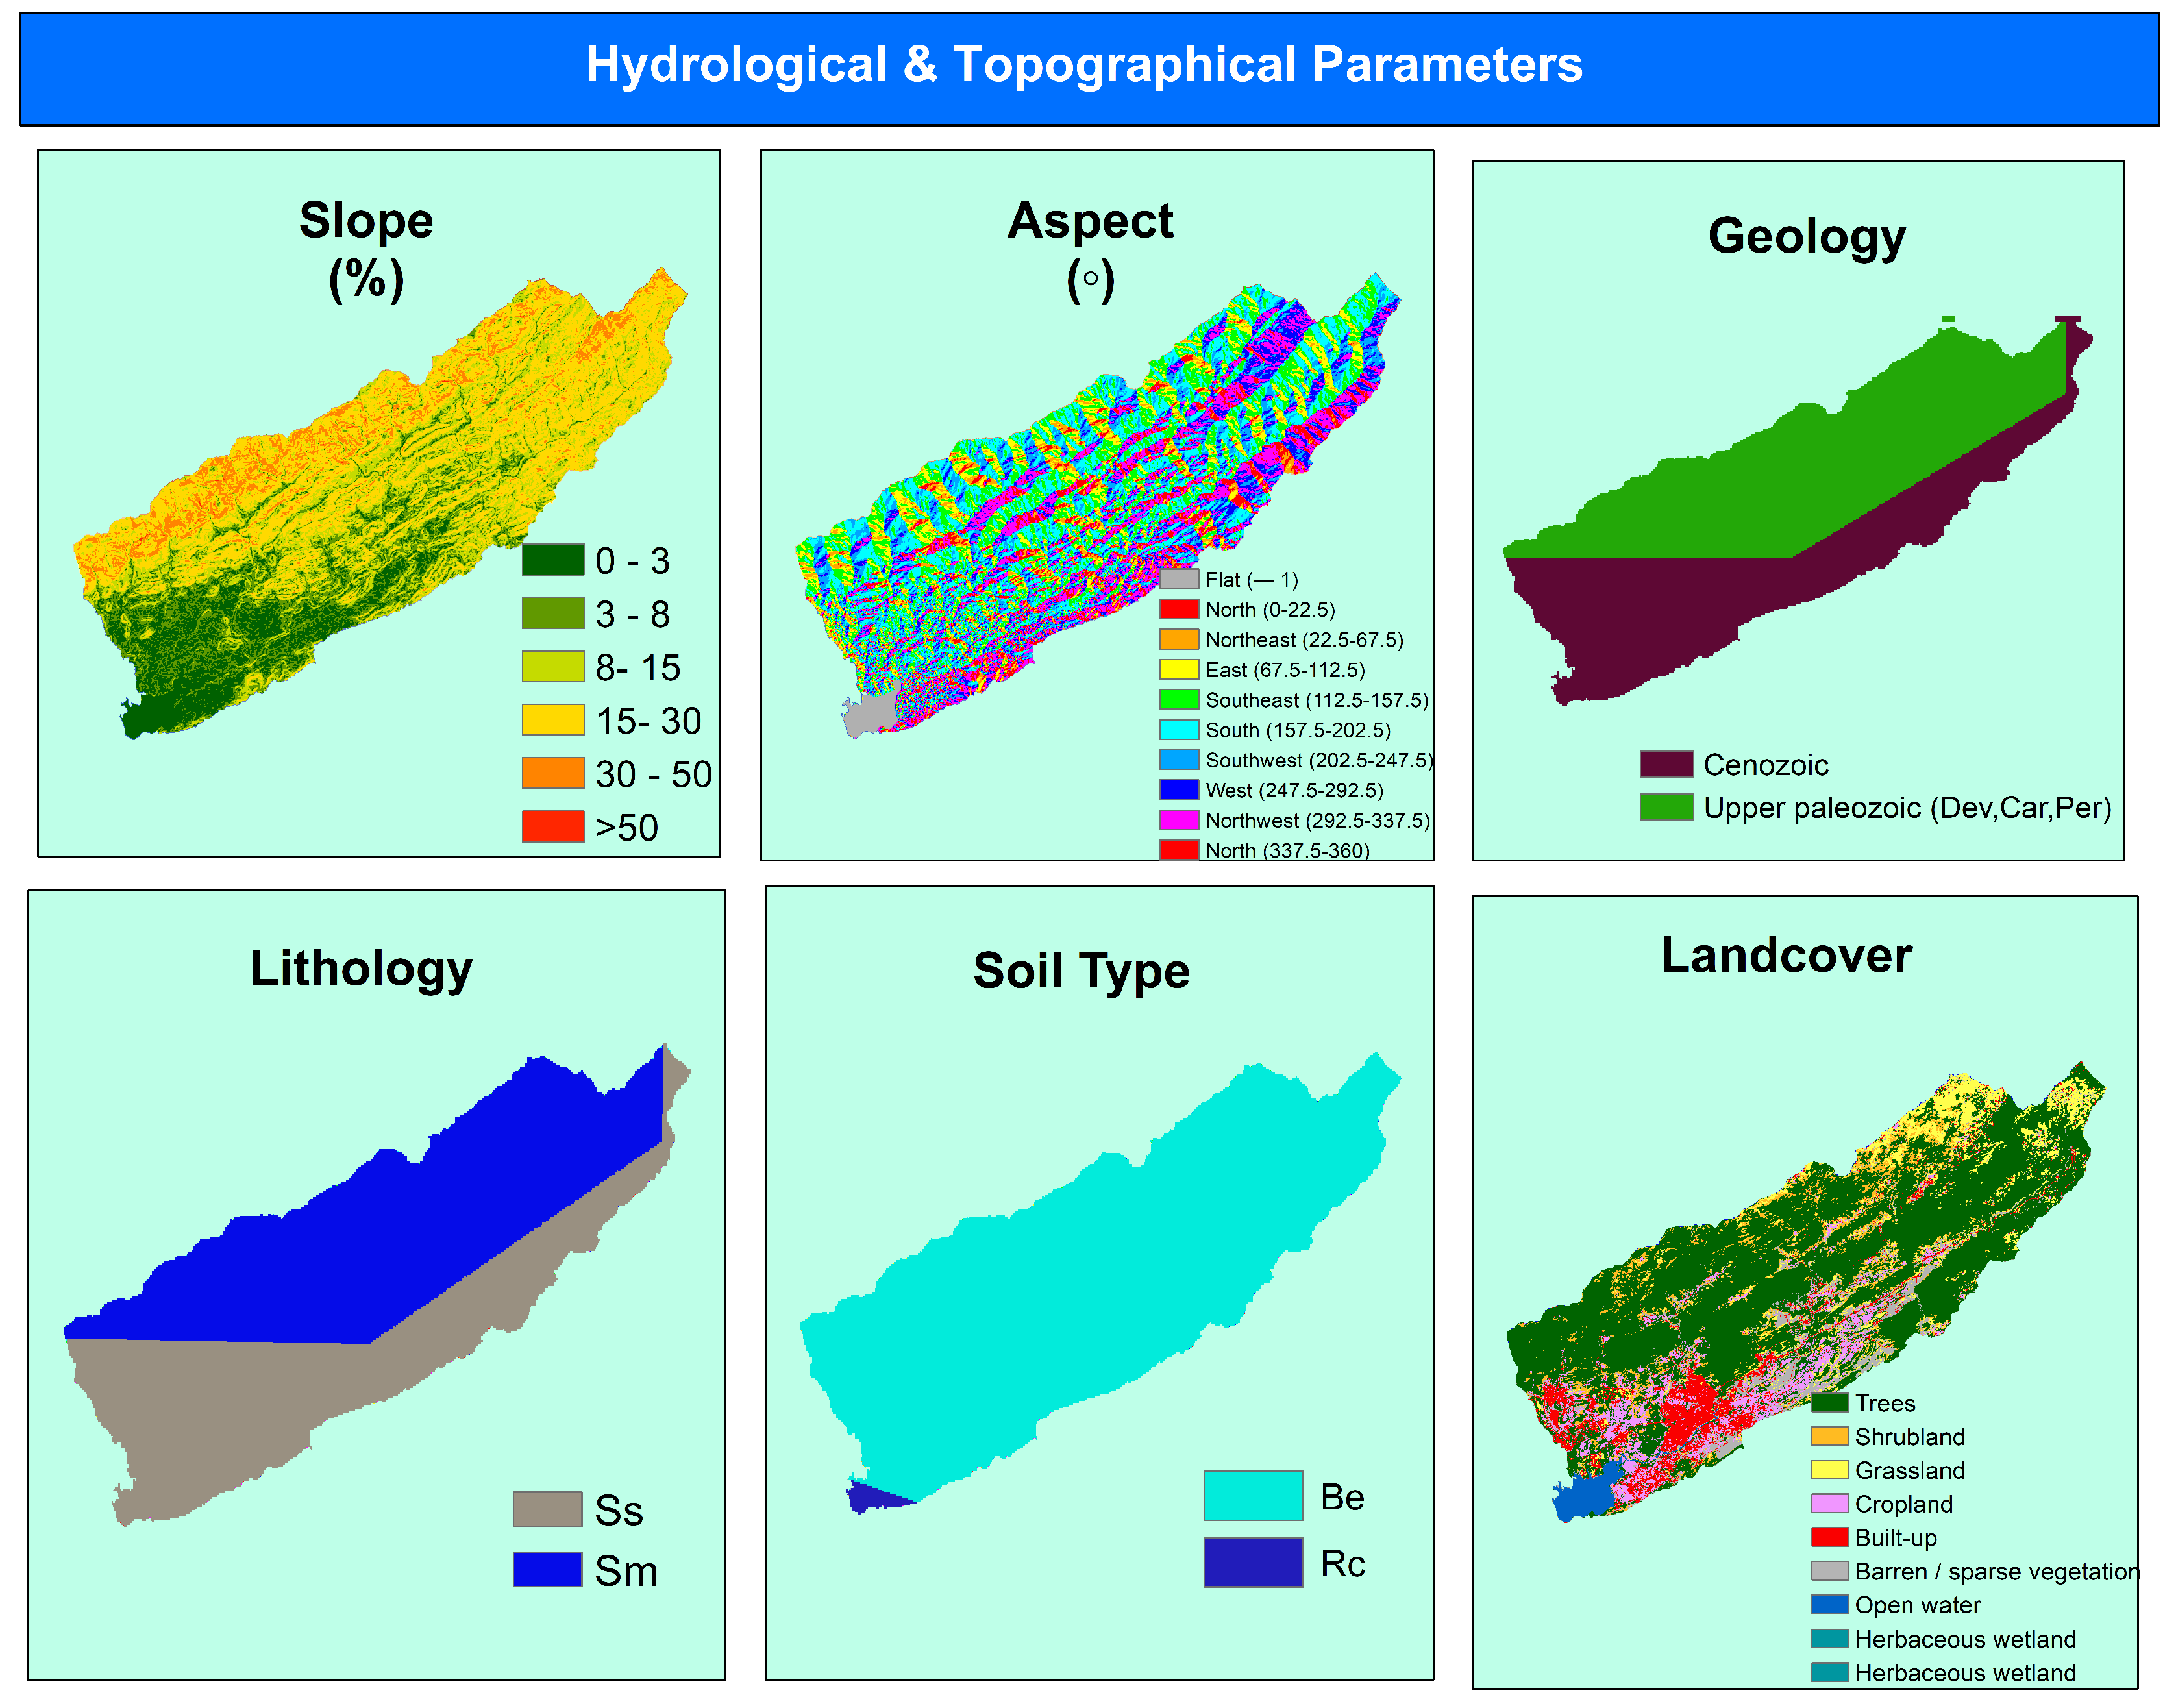
4.2.2. Hydrological and Topographical Parameters
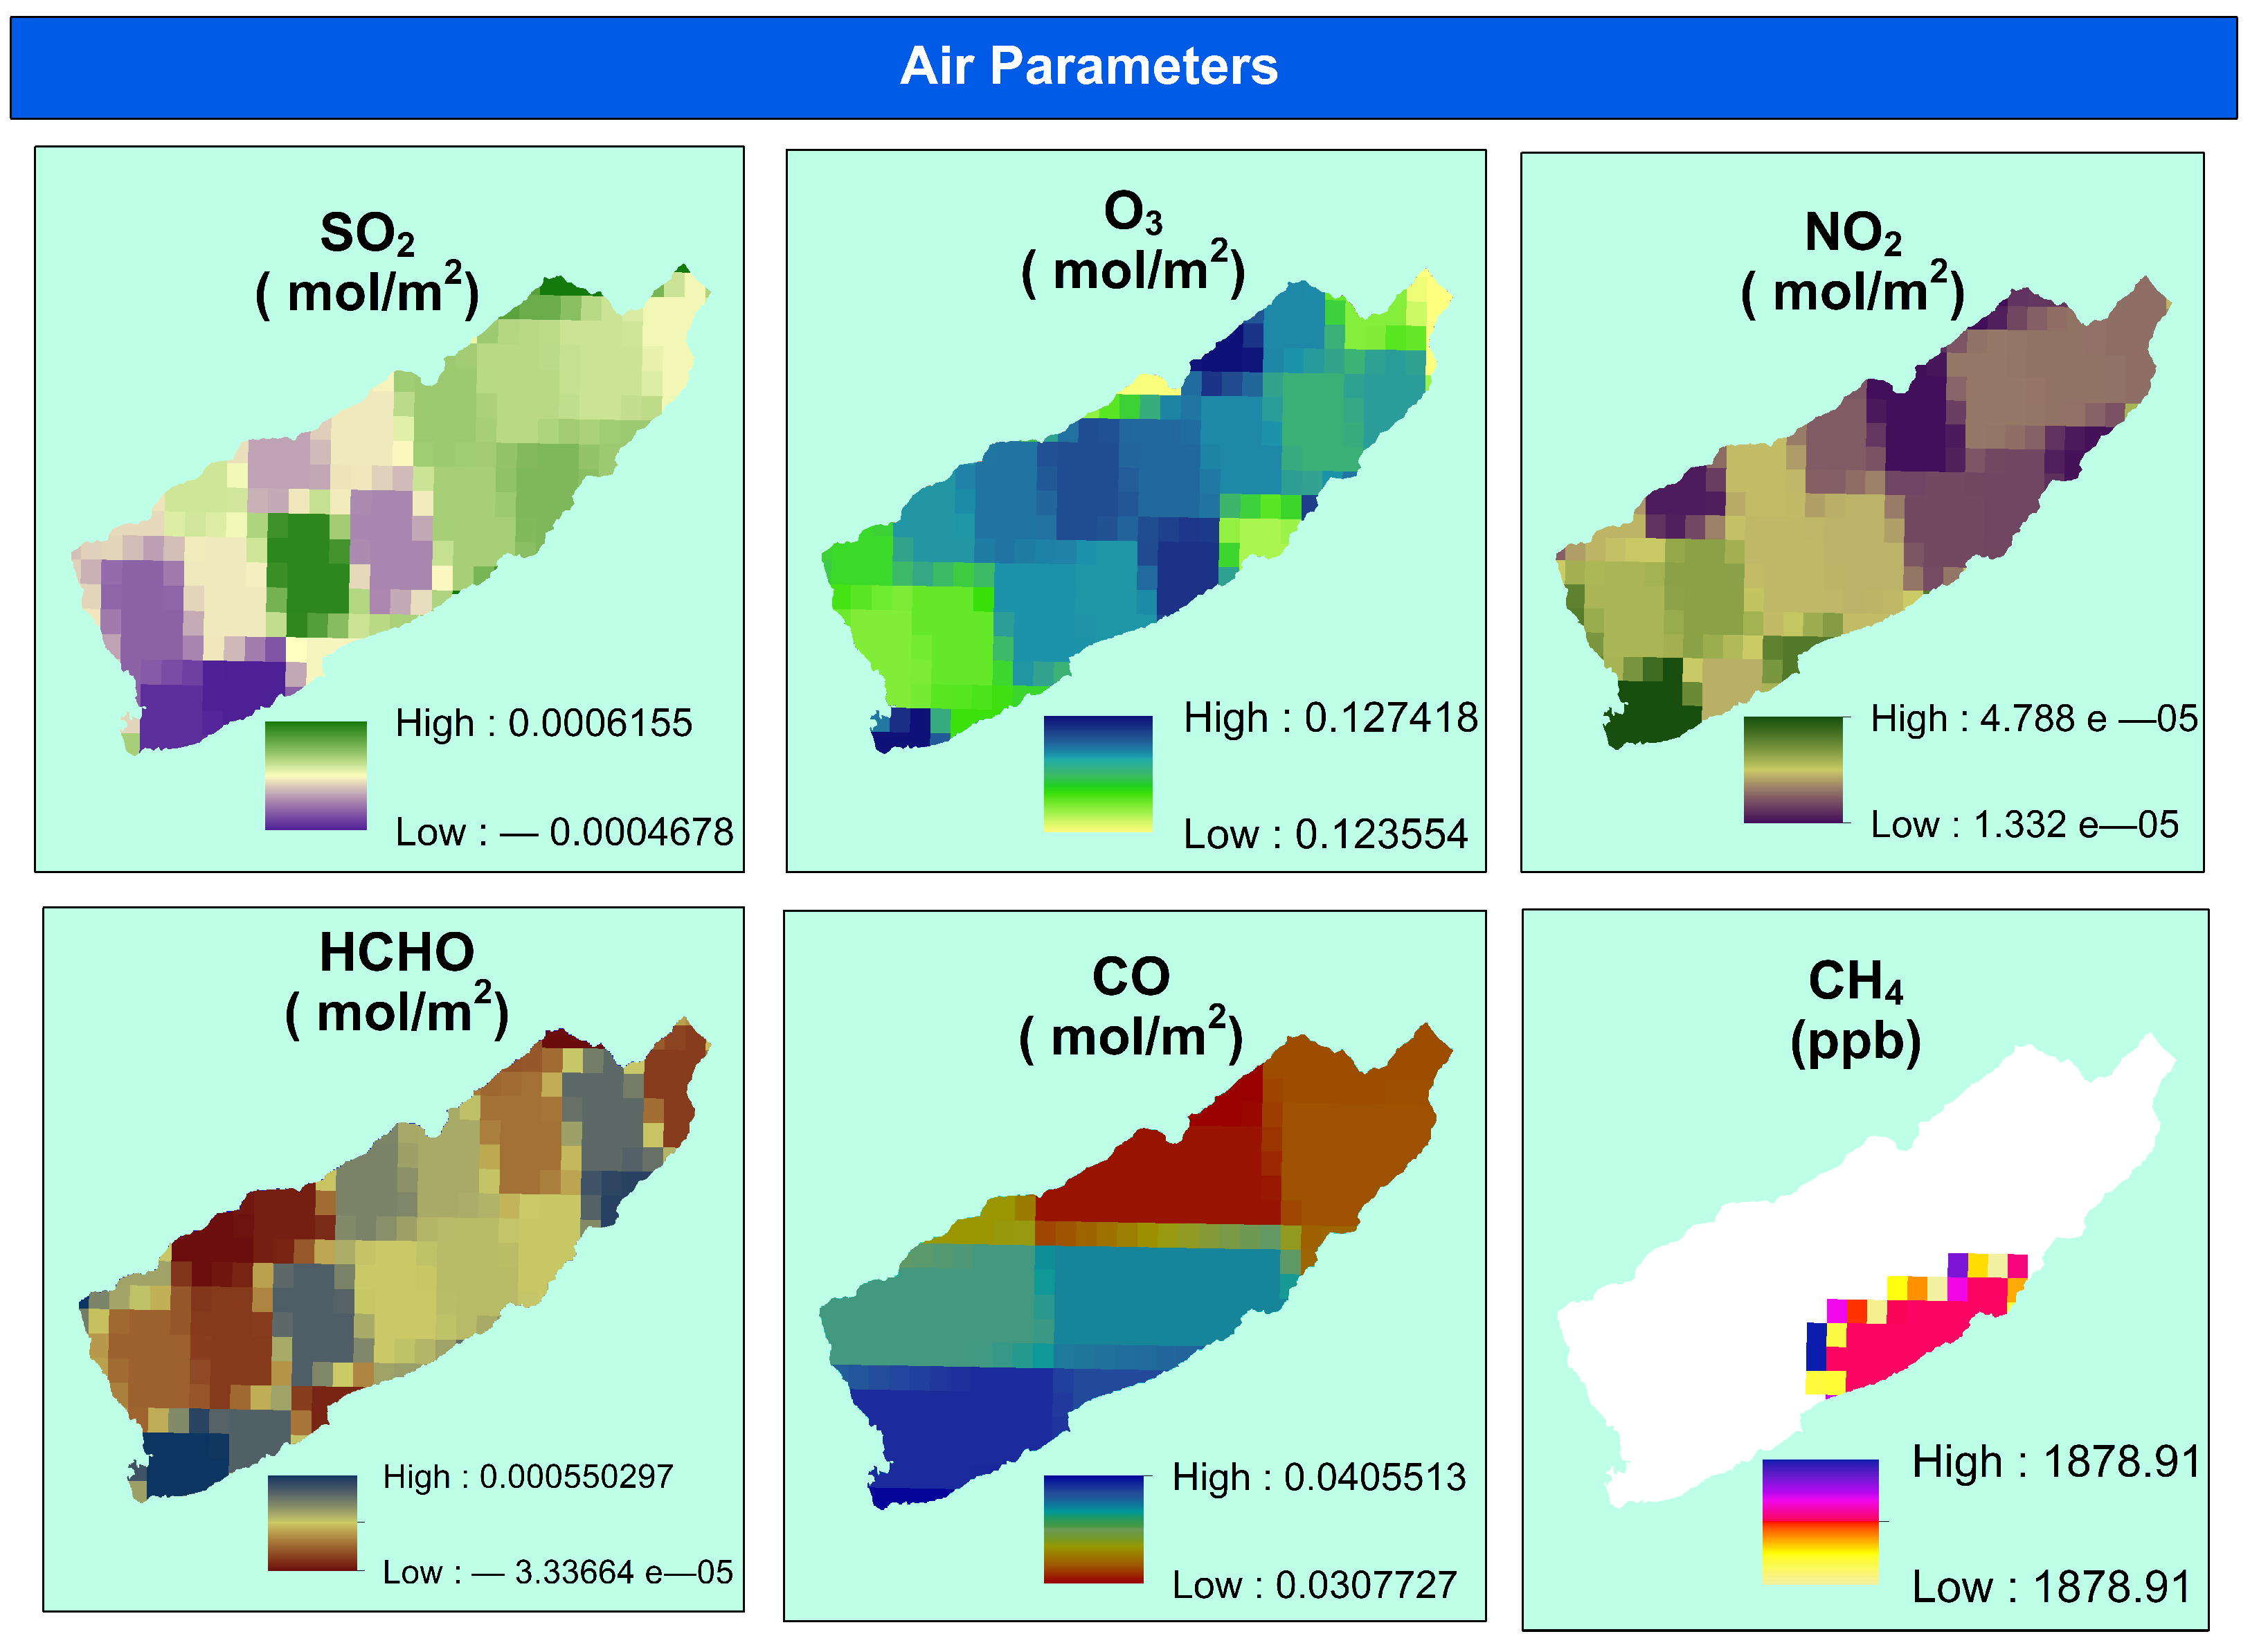
4.2.3. Air Parameters
4.2.4. Meteorological Parameters
4.3. Data Preprocessing
- Replacing the missing values: The missing values are replaced using imputation techniques. The numerical data is imputed with the average or mean. The categorical data is imputed using the most frequent value method.
- Replacing the categorical data: The categorical data is converted to numeric form by using the encoding technique. For example, geology (Cenozoic: 1, Upper Paleozoic (Dev, Car, Per): 2), soil type (Be: 1, Rc: 2), lithology (Ss: 1, Sm: 2) and land cover/land use (trees: 10, shrubland: 20, grassland: 30, cropland: 40, built-up: 50, barren/sparse vegetation: 60, snow and ice: 70, open water: 80, herbaceous wetland: 90).
- Splitting the dataset: The data are split into train and test sets with a 60:40 ratio.
5. Results and Discussion
6. Conclusions
Author Contributions
Funding
Institutional Review Board Statement
Informed Consent Statement
Data Availability Statement
Acknowledgments
Conflicts of Interest
Abbreviations
| Enhanced Water Quality Index | EWQI |
| LightGBM | LGBM |
| CatBoost | CatB |
| National Sanitation Foundation WQI | NSFWQI |
| Water Quality Index | WQI |
| Canadian Council of Ministers of the Environment Water Quality Index | CCME |
| Oregon Water Quality Index | OWQI |
| Total Dissolved Solids | TDS |
| Electrical Conductivity | EC |
| Secchi Disk Depth | SDD |
| Dissolved Oxygen | DO |
| Turbidity | Tur |
| chlorophyll- | chl- |
| Sentinel-2 Multispectral Imager | S2-MSI |
| Level 1C | L1C |
| Carbon Monoxide | CO |
| Nitrogen Dioxide | |
| Ozone | |
| Sulphur Dioxide | |
| Formaldehyde | HCHO |
| Methane | |
| Sentinel-5 Precursor Level 2 | S5P-L2 |
| TROPOspHeric Monitoring Instrument | TROPOMI |
| ERA5 Climate Reanalysis Project | ERA5-CRP |
| Digital Elevation Model | DEM |
| Shuttle Radar Topography Mission | SRTM |
| Minimum Operator Index | MOI |
| Top of Atmosphere | TOA |
| Siliciclastic Sedimentary Consolidated | Ss |
| Mixed Sedimentary Consolidated | Sm |
| parts per million | ppm |
| XGBoost | XGB |
| Random Forest | RF |
| LightGBM | LGBM |
| CatBoost | CatB |
| AdaBoost | AdaB |
References
- Yang, X.E.; Wu, X.; Hao, H.L.; He, Z.L. Mechanisms and assessment of water eutrophication. J. Zhejiang Univ. Sci. B 2008, 9, 197–209. [Google Scholar] [CrossRef] [Green Version]
- Doney, S.C.; Fabry, V.J.; Feely, R.A.; Kleypas, J.A. Ocean acidification: The other CO2 problem. Annu. Rev. Mar. Sci. 2009, 1, 169–192. [Google Scholar] [CrossRef] [Green Version]
- Board, O.S.; National Research Council. Clean Coastal Waters: Understanding and Reducing the Effects of Nutrient Pollution; National Academies Press: Washington, DC, USA, 2000. [Google Scholar]
- Puczko, K.; Jekatierynczuk-Rudczyk, E. Extreme hydro-meteorological events influence to water quality of small rivers in urban area: A case study in Northeast Poland. Sci. Rep. 2020, 10, 1–14. [Google Scholar] [CrossRef] [PubMed]
- Yang, X.; Zheng, Y.; Geng, G.; Liu, H.; Man, H.; Lv, Z.; He, K.; de Hoogh, K. Development of PM2.5 and NO2 models in a LUR framework incorporating satellite remote sensing and air quality model data in Pearl River Delta region, China. Environ. Pollut. 2017, 226, 143–153. [Google Scholar] [CrossRef] [PubMed]
- McClelland, N.I. Water Quality Index Application in the Kansas River Basin; US Environmental Protection Agency: Washington, DC, USA, 1974; Volume 74.
- Canadian Council of Ministers of the Environment. Canadian Water Quality Guidelines for the Protection of Aquatic Life: CCME Water Quality Index 1.0, User’s Manual; Canadian Council of Ministers of the Environment: Winnipeg, MB, Canada, 2001. [Google Scholar]
- Cude, C.G. Oregon water quality index a tool for evaluating water quality management effectiveness 1. J. Am. Water Resour. Assoc. 2001, 37, 125–137. [Google Scholar] [CrossRef]
- Ahmed, M.; Mumtaz, R.; Hassan Zaidi, S.M. Analysis of water quality indices and machine learning techniques for rating water pollution: A case study of Rawal Dam, Pakistan. Water Supply 2021, 21, 3225–3250. [Google Scholar] [CrossRef]
- House, M.; Newsome, D. Water quality indices for the management of surface water quality. In Urban Discharges and Receiving Water Quality Impacts; Elsevier: Amsterdam, The Netherlands, 1989; pp. 159–173. [Google Scholar]
- Nives, S.G. Water quality evaluation by index in Dalmatia. Water Res. 1999, 33, 3423–3440. [Google Scholar]
- Jonnalagadda, S.; Mhere, G. Water quality of the Odzi River in the eastern highlands of Zimbabwe. Water Res. 2001, 35, 2371–2376. [Google Scholar] [CrossRef]
- Pesce, S.F.; Wunderlin, D.A. Use of water quality indices to verify the impact of Córdoba City (Argentina) on Suquía, River. Water Res. 2000, 34, 2915–2926. [Google Scholar] [CrossRef]
- Sargaonkar, A.; Deshpande, V. Development of an overall index of pollution for surface water based on a general classification scheme in Indian context. Environ. Monit. Assess. 2003, 89, 43–67. [Google Scholar] [CrossRef]
- Ott, W.R. Environmental Indices: Theory and Practice. 1978. Available online: https://www.osti.gov/biblio/6681348 (accessed on 3 September 2022).
- Bouza-Deaño, R.; Ternero-Rodríguez, M.; Fernández-Espinosa, A. Trend study and assessment of surface water quality in the Ebro River (Spain). J. Hydrol. 2008, 361, 227–239. [Google Scholar] [CrossRef]
- Smith, D.G. A better water quality indexing system for rivers and streams. Water Res. 1990, 24, 1237–1244. [Google Scholar] [CrossRef]
- Brown, R.M.; McClelland, N.I.; Deininger, R.A.; O’Connor, M.F. A water quality index—Crashing the psychological barrier. In Indicators of Environmental Quality; Springer: Berlin/Heidelberg, Germany, 1972; pp. 173–182. [Google Scholar]
- Lermontov, A.; Yokoyama, L.; Lermontov, M.; Machado, M.A.S. River quality analysis using fuzzy water quality index: Ribeira do Iguape river watershed, Brazil. Ecol. Indic. 2009, 9, 1188–1197. [Google Scholar] [CrossRef]
- Dinius, S. Design of An Index of Water Quality. J. Am. Water Resour. Assoc. 1987, 23, 833–843. [Google Scholar] [CrossRef]
- Soumaila, K.I.; Niandou, A.S.; Naimi, M.; Mohamed, C.; Schimmel, K.; Luster-Teasley, S.; Sheick, N.N. A systematic review and meta-analysis of water quality indices. J. Agric. Sci. Technol. B 2019, 9, 1–14. [Google Scholar]
- Said, A.; Stevens, D.K.; Sehlke, G. An innovative index for evaluating water quality in streams. Environ. Manag. 2004, 34, 406–414. [Google Scholar] [CrossRef]
- Liou, S.M.; Lo, S.L.; Wang, S.H. A generalized water quality index for Taiwan. Environ. Monit. Assess. 2004, 96, 35–52. [Google Scholar] [CrossRef]
- Gitau, M.W.; Chen, J.; Ma, Z. Water quality indices as tools for decision making and management. Water Resour. Manag. 2016, 30, 2591–2610. [Google Scholar] [CrossRef]
- Srebotnjak, T.; Carr, G.; de Sherbinin, A.; Rickwood, C. A global Water Quality Index and hot-deck imputation of missing data. Ecol. Indic. 2012, 17, 108–119. [Google Scholar] [CrossRef]
- Selvam, S.; Manimaran, G.; Sivasubramanian, P.; Balasubramanian, N.; Seshunarayana, T. GIS-based evaluation of water quality index of groundwater resources around Tuticorin coastal city, South India. Environ. Earth Sci. 2014, 71, 2847–2867. [Google Scholar] [CrossRef]
- Wu, Z.; Wang, X.; Chen, Y.; Cai, Y.; Deng, J. Assessing river water quality using water quality index in Lake Taihu Basin, China. Sci. Total. Environ. 2018, 612, 914–922. [Google Scholar] [CrossRef] [PubMed]
- Karunanidhi, D.; Aravinthasamy, P.; Subramani, T.; Muthusankar, G. Revealing drinking water quality issues and possible health risks based on water quality index (WQI) method in the Shanmuganadhi River basin of South India. Environ. Geochem. Health 2021, 43, 931–948. [Google Scholar] [CrossRef] [PubMed]
- Silvert, W. Fuzzy indices of environmental conditions. Ecol. Model. 2000, 130, 111–119. [Google Scholar] [CrossRef]
- Khan, F.I.; Abbasi, S. Multivariate hazard identification and ranking system. Process. Saf. Prog. 1998, 17, 157–170. [Google Scholar] [CrossRef]
- Ahmed, M.; Mumtaz, R.; Baig, S.; Zaidi, S.M.H. Assessment of correlation amongst physico-chemical, topographical, geological, lithological and soil type parameters for measuring water quality of Rawal watershed using remote sensing. Water Supply 2022, 22, 3645–3660. [Google Scholar] [CrossRef]
- Swamee, P.K.; Tyagi, A. Improved method for aggregation of water quality subindices. J. Environ. Eng. 2007, 133, 220–225. [Google Scholar] [CrossRef]
- Ali, M.; Qamar, A.M.; Ali, B. Data analysis, discharge classifications, and predictions of hydrological parameters for the management of Rawal Dam in Pakistan. In Proceedings of the 2013 12th International Conference on Machine Learning and Applications, Miami, FL, USA, 4–7 December 2013; Volume 1, pp. 382–385. [Google Scholar]
- Van Zyl, J.J. The Shuttle Radar Topography Mission (SRTM): A breakthrough in remote sensing of topography. Acta Astronaut. 2001, 48, 559–565. [Google Scholar] [CrossRef]
- Sentinel-2 MSI: Multispectral Instrument, Level-1c|Earth Engine Data Catalog|Google Developers. Available online: https://developers.google.com/earth-engine/datasets/catalog/COPERNICUS_S2 (accessed on 26 October 2022).
- Digital Soil Map. Available online: https://worldmap.harvard.edu/data/geonode:DSMW_RdY (accessed on 26 October 2022).
- GeoTypes. Available online: http://geotypes.net/downloads.html (accessed on 26 October 2022).
- Esa Worldcover 10 m V100|Earth Engine Data Catalog|Google Developers. Available online: https://developers.google.com/earth-engine/datasets/catalog/ESA_WorldCover_v100 (accessed on 26 October 2022).
- Sentinel-5P OFFL CO: Offline Carbon Monoxide|Earth Engine Data Catalog|Google Developers. Available online: https://developers.google.com/earth-engine/datasets/catalog/COPERNICUS_S5P_OFFL_L3_CO (accessed on 26 October 2022).
- Sentinel-5P OFFL NO2: Offline Nitrogen Dioxide|Earth Engine Data Catalog|Google Developers. Available online: https://developers.google.com/earth-engine/datasets/catalog/COPERNICUS_S5P_OFFL_L3_NO2 (accessed on 26 October 2022).
- Sentinel-5P OFFL O3: Offline Ozone|Earth Engine Data Catalog|Google Developers. Available online: https://developers.google.com/earth-engine/datasets/catalog/COPERNICUS_S5P_OFFL_L3_O3 (accessed on 26 October 2022).
- Sentinel-5P OFFL SO2: Offline Sulfur Dioxide|Earth Engine Data Catalog|Google Developers. Available online: https://developers.google.com/earth-engine/datasets/catalog/COPERNICUS_S5P_OFFL_L3_SO2 (accessed on 26 October 2022).
- Sentinel-5P OFFL HCHO: Offline Formaldehyde|Earth Engine Data Catalog|Google Developers. Available online: https://developers.google.com/earth-engine/datasets/catalog/COPERNICUS_S5P_OFFL_L3_HCHO (accessed on 26 October 2022).
- Sentinel-5P OFFL CH4: Offline Methane|Earth Engine Data Catalog|Google Developers. Available online: https://developers.google.com/earth-engine/datasets/catalog/COPERNICUS_S5P_OFFL_L3_CH4 (accessed on 26 October 2022).
- ERA5 Daily Aggregates—Latest Climate Reanalysis Produced by ECMWF/Copernicus Climate Change Service|Earth Engine Data Catalog|Google Developers. Available online: https://developers.google.com/earth-engine/datasets/catalog/ECMWF_ERA5_DAILY (accessed on 26 October 2022).
- Khattab, M.F.; Merkel, B.J. Application of Landsat 5 and Landsat 7 images data for water quality mapping in Mosul Dam Lake, Northern Iraq. Arab. J. Geosci. 2014, 7, 3557–3573. [Google Scholar] [CrossRef]
- Abdullah, H.S. Water Quality Assessment for Dokan Lake Using Landsat 8 Oli Satellite Images. Ph.D. Thesis, University of Sulaimani, Sulaymaniyah, Iraq, 2015. [Google Scholar]
- Lim, J.; Choi, M. Assessment of water quality based on Landsat 8 operational land imager associated with human activities in Korea. Environ. Monit. Assess. 2015, 187, 1–17. [Google Scholar] [CrossRef]
- Deutsch, E.; Alameddine, I.; El-Fadel, M. Developing Landsat Based Algorithms to Augment in Situ Monitoring of Freshwater Lakes and Reservoirs. In Proceedings of the 11th International Conference on Hydroinformatics, New York, NY, USA, 17–21 August 2014; Volume 1. [Google Scholar]
- Van Geffen, J.; Boersma, K.F.; Eskes, H.; Sneep, M.; Ter Linden, M.; Zara, M.; Veefkind, J.P. S5P TROPOMI NO2 slant column retrieval: Method, stability, uncertainties and comparisons with OMI. Atmos. Meas. Tech. 2020, 13, 1315–1335. [Google Scholar] [CrossRef] [Green Version]
- De Smedt, I.; Theys, N.; Yu, H.; Danckaert, T.; Lerot, C.; Compernolle, S.; Van Roozendael, M.; Richter, A.; Hilboll, A.; Peters, E.; et al. Algorithm theoretical baseline for formaldehyde retrievals from S5P TROPOMI and from the QA4ECV project. Atmos. Meas. Tech. 2018, 11, 2395–2426. [Google Scholar] [CrossRef] [Green Version]
- Garane, K.; Koukouli, M.E.; Verhoelst, T.; Lerot, C.; Heue, K.P.; Fioletov, V.; Balis, D.; Bais, A.; Bazureau, A.; Dehn, A.; et al. TROPOMI/S5P total ozone column data: Global ground-based validation and consistency with other satellite missions. Atmos. Meas. Tech. 2019, 12, 5263–5287. [Google Scholar] [CrossRef]
- Theys, N.; De Smedt, I.; Yu, H.; Danckaert, T.; van Gent, J.; Hörmann, C.; Wagner, T.; Hedelt, P.; Bauer, H.; Romahn, F.; et al. Sulfur dioxide retrievals from TROPOMI onboard Sentinel-5 Precursor: Algorithm theoretical basis. Atmos. Meas. Tech. 2017, 10, 119–153. [Google Scholar] [CrossRef] [Green Version]
- Magro, C.; Nunes, L.; Gonçalves, O.C.; Neng, N.R.; Nogueira, J.M.; Rego, F.C.; Vieira, P. Atmospheric trends of CO and CH4 from extreme wildfires in Portugal using Sentinel-5P TROPOMI level-2 data. Fire 2021, 4, 25. [Google Scholar] [CrossRef]
- Hersbach, H.; Bell, B.; Berrisford, P.; Hirahara, S.; Horányi, A.; Muñoz-Sabater, J.; Nicolas, J.; Peubey, C.; Radu, R.; Schepers, D.; et al. The ERA5 global reanalysis. Q. J. R. Meteorol. Soc. 2020, 146, 1999–2049. [Google Scholar] [CrossRef]
- United States Geological Survey. Earthexplorer. Available online: https://earthexplorer.usgs.gov/ (accessed on 4 October 2022).
- ArcGIS Pro. Available online: https://www.esri.com/en-us/arcgis/products/arcgis-pro/overview (accessed on 4 October 2022).
- Patel, V.; Parikh, P. Assessment of seasonal variation in water quality of River Mini, at Sindhrot, Vadodara. Int. J. Environ. Sci. 2013, 3, 1424–1436. [Google Scholar]
- Huang, H.; Legarsky, J.J.; Gudimetla, S.; Davis, C.H. Post-classification smoothing of digital classification map of St. Louis, Missouri. In Proceedings of the 2004 IEEE International Geoscience and Remote Sensing Symposium, Anchorage, AK, USA, 20–24 September 2004; Volume 5, pp. 3039–3041. [Google Scholar]


| Index | No. of Parameters | WQI Value | Rating Class | Equation | Reference |
|---|---|---|---|---|---|
| WAWQI | 10 | [18] | |||
| 0 to 25 | Excellent | n = the number of parameters, | |||
| 25 to 50 | Good | = quality rating of the nth parameter, | |||
| 51 to 75 | Fair | = unit weight of the nth parameter | |||
| 76 to 100 | Poor | ||||
| 101 to 150 | Very Poor | ||||
| Above 150 | Unfit for Drinking | ||||
| NSFWQI | 9 | [6] | |||
| 90 to 100 | Excellent | n = the number of parameters, | |||
| 70 to 90 | Good | = quality rating of the nth parameter, | |||
| 50 to 70 | Medium | = unit weight of the nth parameter | |||
| 25 to 50 | Bad | ||||
| 0 to 25 | Very Bad | ||||
| CCME | 47 | [7] | |||
| 95.0 to 100.0 | Excellent | = No. of Failed/ Total variables × 100 | |||
| 80.0 to 94.9 | Good | = No. of Failed/ Total tests × 100 | |||
| 65.0 to 79.9 | Fair | = amount by which objectives not met | |||
| 45.0 to 64.9 | Marginal | ||||
| 0.0 to 44.9 | Poor | ||||
| OWQI | 8 | OWQI = | [8] | ||
| to 100 | Excellent | n = number of parameters, | |||
| 85 to 89 | Good | = SI is the sub-index for the ith parameter | |||
| 80 to 84 | Fair | ||||
| 60 to 79 | Poor | ||||
| less than 60 | Very Poor | ||||
| MOI | 8 | MOI = | [17] | ||
| 80 to 100 | Eminently suitable for all uses | n = number of parameters, | |||
| 60 to 79 | Suitable for all uses | = SI is the sub-index for the nth parameter | |||
| 40 to 59 | Main use may be compromised | ||||
| 20 to 39 | Unsuitable for several uses | ||||
| 0 to 19 | Totally unsuitable for many uses |
| Category | Type of Data | Sources |
|---|---|---|
| Physicochemical Parameters | TDS pH EC SDD DO Tur chl- | SRTM DEM S2-MSI L1C [35] |
| Hydrological and Topographical Parameters | Slope Aspect | SRTM DEM |
| Soil Type | SRTM DEM Digital Soil Map [36] | |
| Geology Lithology | SRTM DEM GeoTypes [37] | |
| Land use/Land Cover | SRTM DEM ESA Worldcover [38] | |
| Air Parameters | CO | SRTM DEM Earth Engine [39] |
| SRTM DEM S5P-L2 TROPOMI Earth Engine [40] | ||
| SRTM DEM S5P-L2 TROPOMI Earth Engine [41] | ||
| SRTM DEM S5P-L2 TROPOMI Earth Engine [42] | ||
| HCHO | SRTM DEM S5P-L2 TROPOMI Earth Engine [43] | |
| SRTM DEM S5P-L2 TROPOMI Earth Engine [44] | ||
| Meteorological Parameters | Air Temperature Wind Speed Total Precipitation | SRTM DEM ERA5-CRP Earth Engine [45] |
| Parameter | Adapted Equations | Reference | RMSE |
|---|---|---|---|
| Tur | 35.121 − 14.489 ((R3)/(R4)) − 0.911 (R8a) | [46] | 7.65 NTU |
| pH | 8.790 + 0.141 (R11) − 0.228 (R3/R4) | [47] | 3.36 |
| EC | 422.034 − 1080.365 (R11) | [47] | 228.7 mS/cm |
| chl- | 54.658 + 520.451 (R2) − 1221.89 (R3) + 611.115 (R4) − 198.199 (R8a) | [48] | 10.15 mg/L |
| DO | 10.841 − 0.682 ((R1)/(R8a)) − 0.002 ((R2)/(R8a) + (B2)) | [47] | 2.82 mg/L |
| TDS | 120.750 + 264.752 (R8a/R1) | [47] | 111.92 mg/L |
| SDD | 0.2 + 1.4 ln (R2/R4) | [49] | 0.22 m |
| Feature Weighting Method | No. of Parameters | Score | Accuracy | |
|---|---|---|---|---|
| XGB | 20 | chl-: 0.00183 DO: 0.07315 EC: 0.19124 pH: 0.04043 SDD: 0.12290 TDS: 0.08795 Tur: 0.00593 Air Temperature: 0.00382 Precipitation: 0.02134 Wind: 0.01571 CO: 0.00534 | : 0.03497 : 0.02866 : 0.00398 HCHO: 0.01529 : 0.00246 Aspect: 0.00316 Slope: 0.00147 Lithology: 0.33722 Landcover: 0.00314 | 98.46% |
| RF | 22 | chl-: 0.04159 DO: 0.08917 EC: 0.13447 pH: 0.09033 SDD: 0.06160 TDS: 0.11201 Tur: 0.04504 Air Temperature: 0.00448 Precipitation: 0.00896 Wind: 0.00844 CO: 0.01142 | : 0.02785 : 0.03457 : 0.00452 HCHO: 0.01582 : 0.00056 Aspect: 0.00520 Slope: 0.00955 Lithology: 0.14103 Soil Type: 0.00087 Landcover: 0.01397 Geology: 0.13857 | 98.83% |
| LGBM | 21 | chl-: 269.00000 DO: 1092.00000 EC: 790.00000 pH: 1181.00000 SDD: 1287.00000 TDS: 777.00000 Tur: 221.00000 Air Temperature: 337.00000 S9: 325.00000 Wind: 325.00000 CO: 676.00000 | : 790.00000 : 1072.00000 : 287.00000 HCHO: 735.00000 : 98.00000 Aspect: 390.00000 Slope: 489.00000 Lithology: 482.00000 Soil Type: 9.00000 Landcover: 368.00000 | 99.11% 2 |
| CatB | 22 | chl-: 1.96433 DO: 10.02918 EC: 12.98044 pH: 6.98978 SDD: 6.19110 TDS: 5.29395 Tur: 3.04026 Air Temperature: 1.40388 Precipitation: 1.21085 Wind: 1.76956 CO: 2.32570 | : 3.83250 : 5.40983 : 1.50510 HCHO: 3.38323 : 0.13716 Aspect: 1.13175 Slope: 1.91270 Lithology: 11.99015 Soil Type:0.10634 Landcover: 1.96139 Geology: 15.43083 | 99.34% 1 |
| AdaB | 16 | DO: 0.08000 EC: 0.10000 pH: 0.08000 SDD: 0.10000 TDS: 0.12000 Precipitation: 0.04000 Wind: 0.02000 CO: 0.04000 | : 0.04000 : 0.06000 : 0.06000 HCHO: 0.02000 Slope: 0.10000 Lithology: 0.02000 Landcover: 0.04000 Geology: 0.08000 | 85.49% |
| Feature Weighting Method | No. of Parameters | Score | Accuracy | |
|---|---|---|---|---|
| CatB | 7 | chl-: 8.99274, DO: 24.24110, EC: 22.92371, pH: 10.68041, SDD: 12.36481, TDS: 13.93459, Tur: 6.86264 | 78% | |
| LGBM | 16 | chl-: 604.00000 DO: 1325.00000 EC: 993.00000 pH: 1468.00000 SDD: 1212.00000 TDS: 1131.00000 Tur: 494.00000 Air Temperature: 311.00000 | Precipitation: 298.00000 Wind Speed: 301.00000 CO: 718.00000 : 973.00000 : 1021.00000 : 311.00000 HCHO: 785.00000 : 55.00000 | 81.88% |
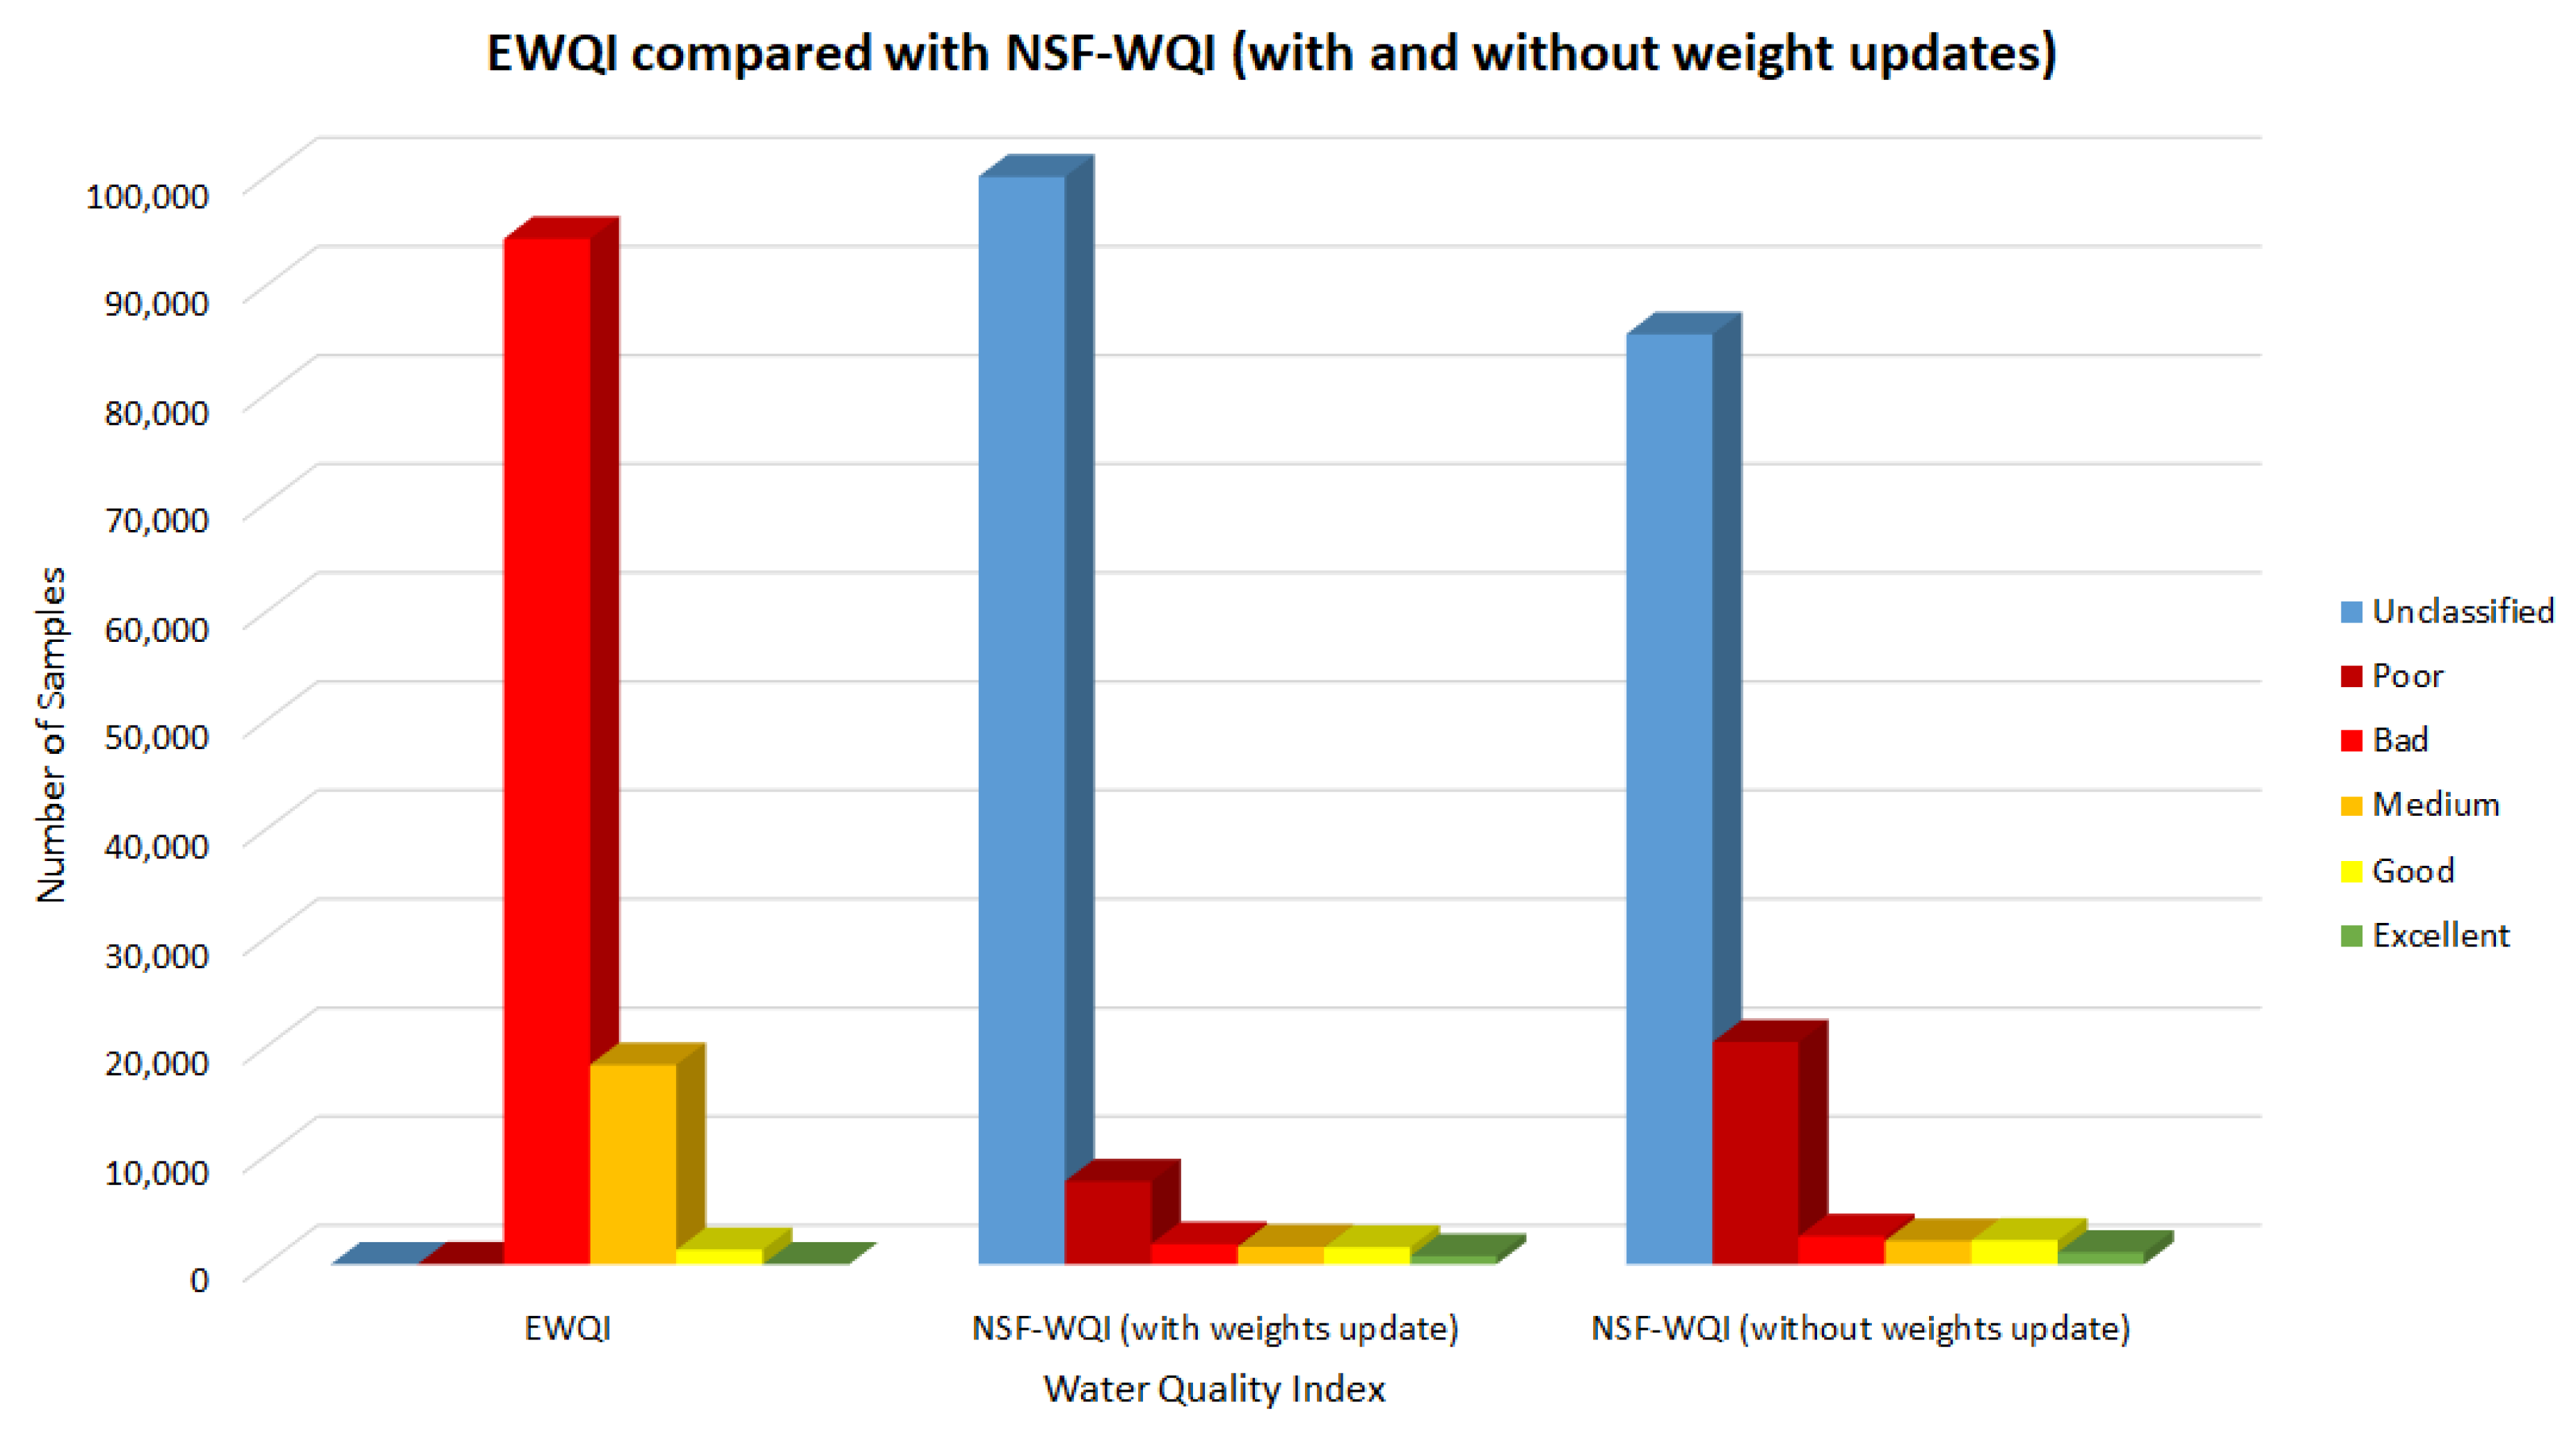
| Method | Relative Weights () | Class | No. of Samples | |
|---|---|---|---|---|
| CatB | = 0.019643 = 0.100292 = 0.129804 | = 0.023257 = 0.038325 = 0.054098 | Bad | 94,282 |
| = 0.069898 = 0.061911 = 0.052939 = 0.030403 | = 0.015051 = 0.033832 = 0.001372 = 0.011317 | Medium | 18,336 | |
| = 0.014039 = 0.012108 | = 0.019127 = 0.119901 = 0.001063 | Good | 1332 | |
| = 0.017696 | = 0.019614 = 0.154308 | Poor | 6 | |
| LGBM | = 0.022417 = 0.091 = 0.065833 = 0.098417 = 0.10725 | = 0.056333 = 0.065833 = 0.089333 = 0.023917 = 0.06125 | Bad | 94,103 |
| = 0.06475 = 0.018417 = 0.028083 = 0.027083 = 0.027083 | = 0.008167 = 0.0325 = 0.04075 = 0.040167 = 0.00075 = 0.030667 = 0 | Medium | 19,853 | |
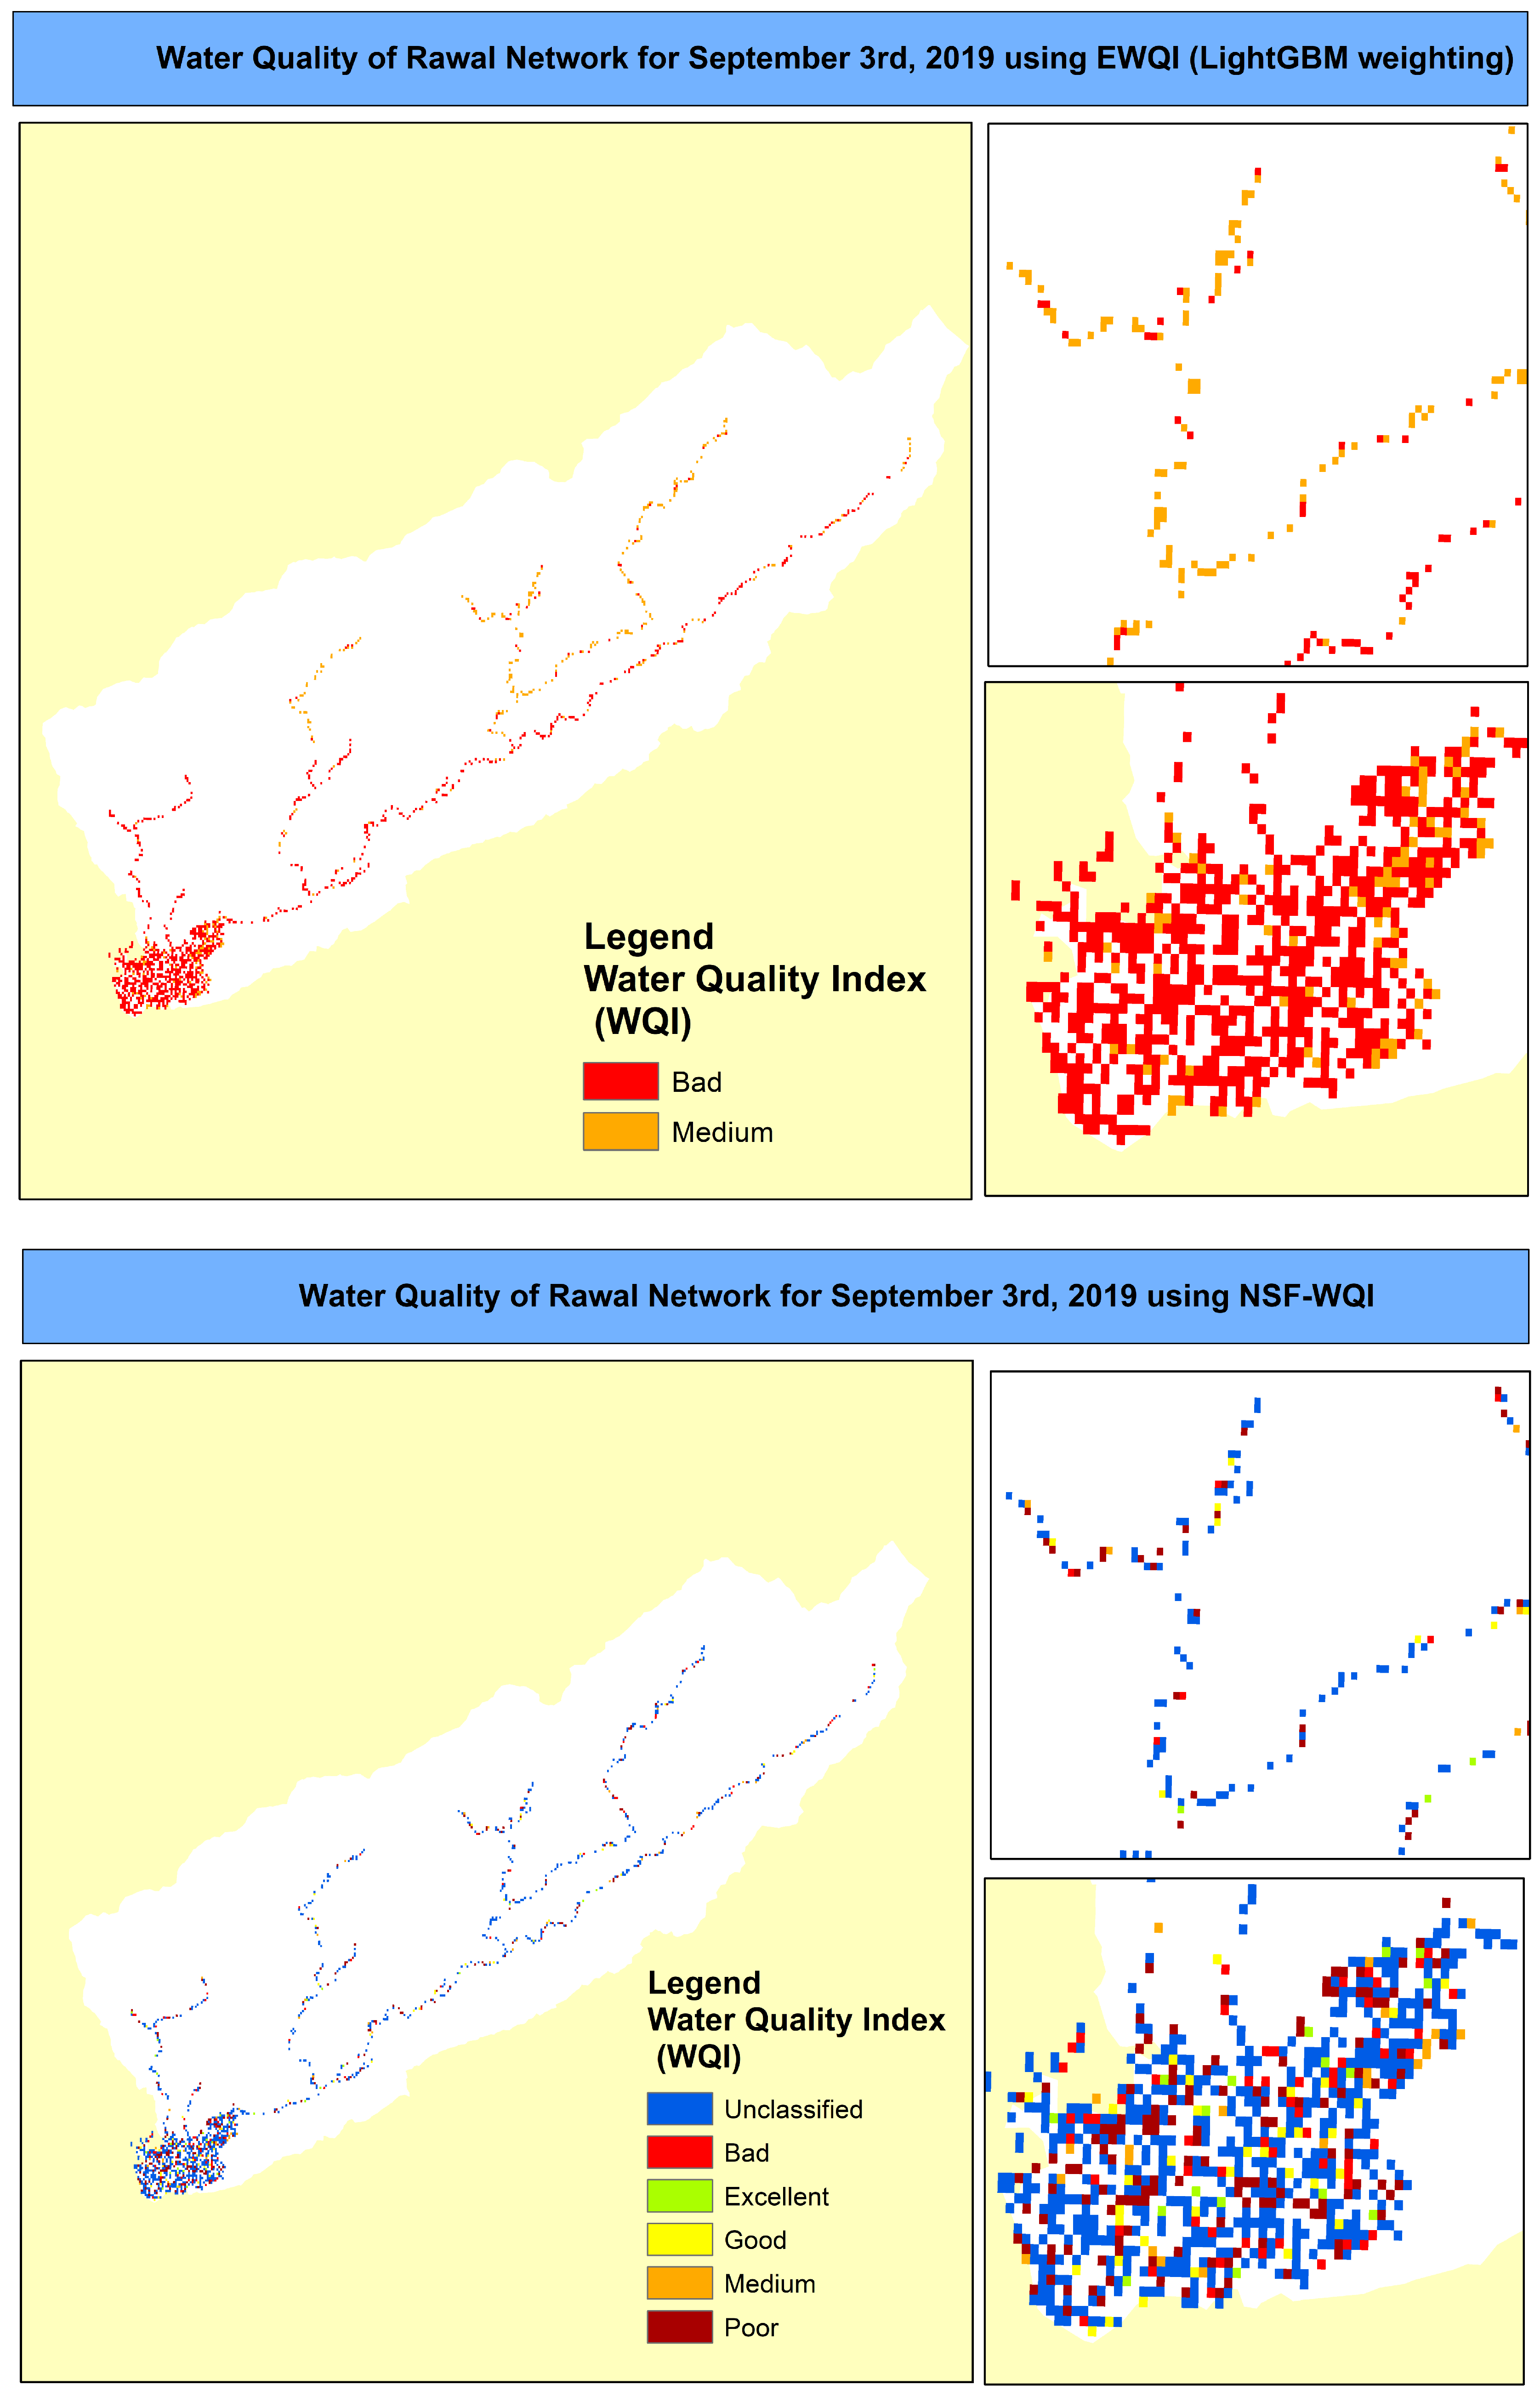
| Test Set | Parameters | Method | Class | Samples |
|---|---|---|---|---|
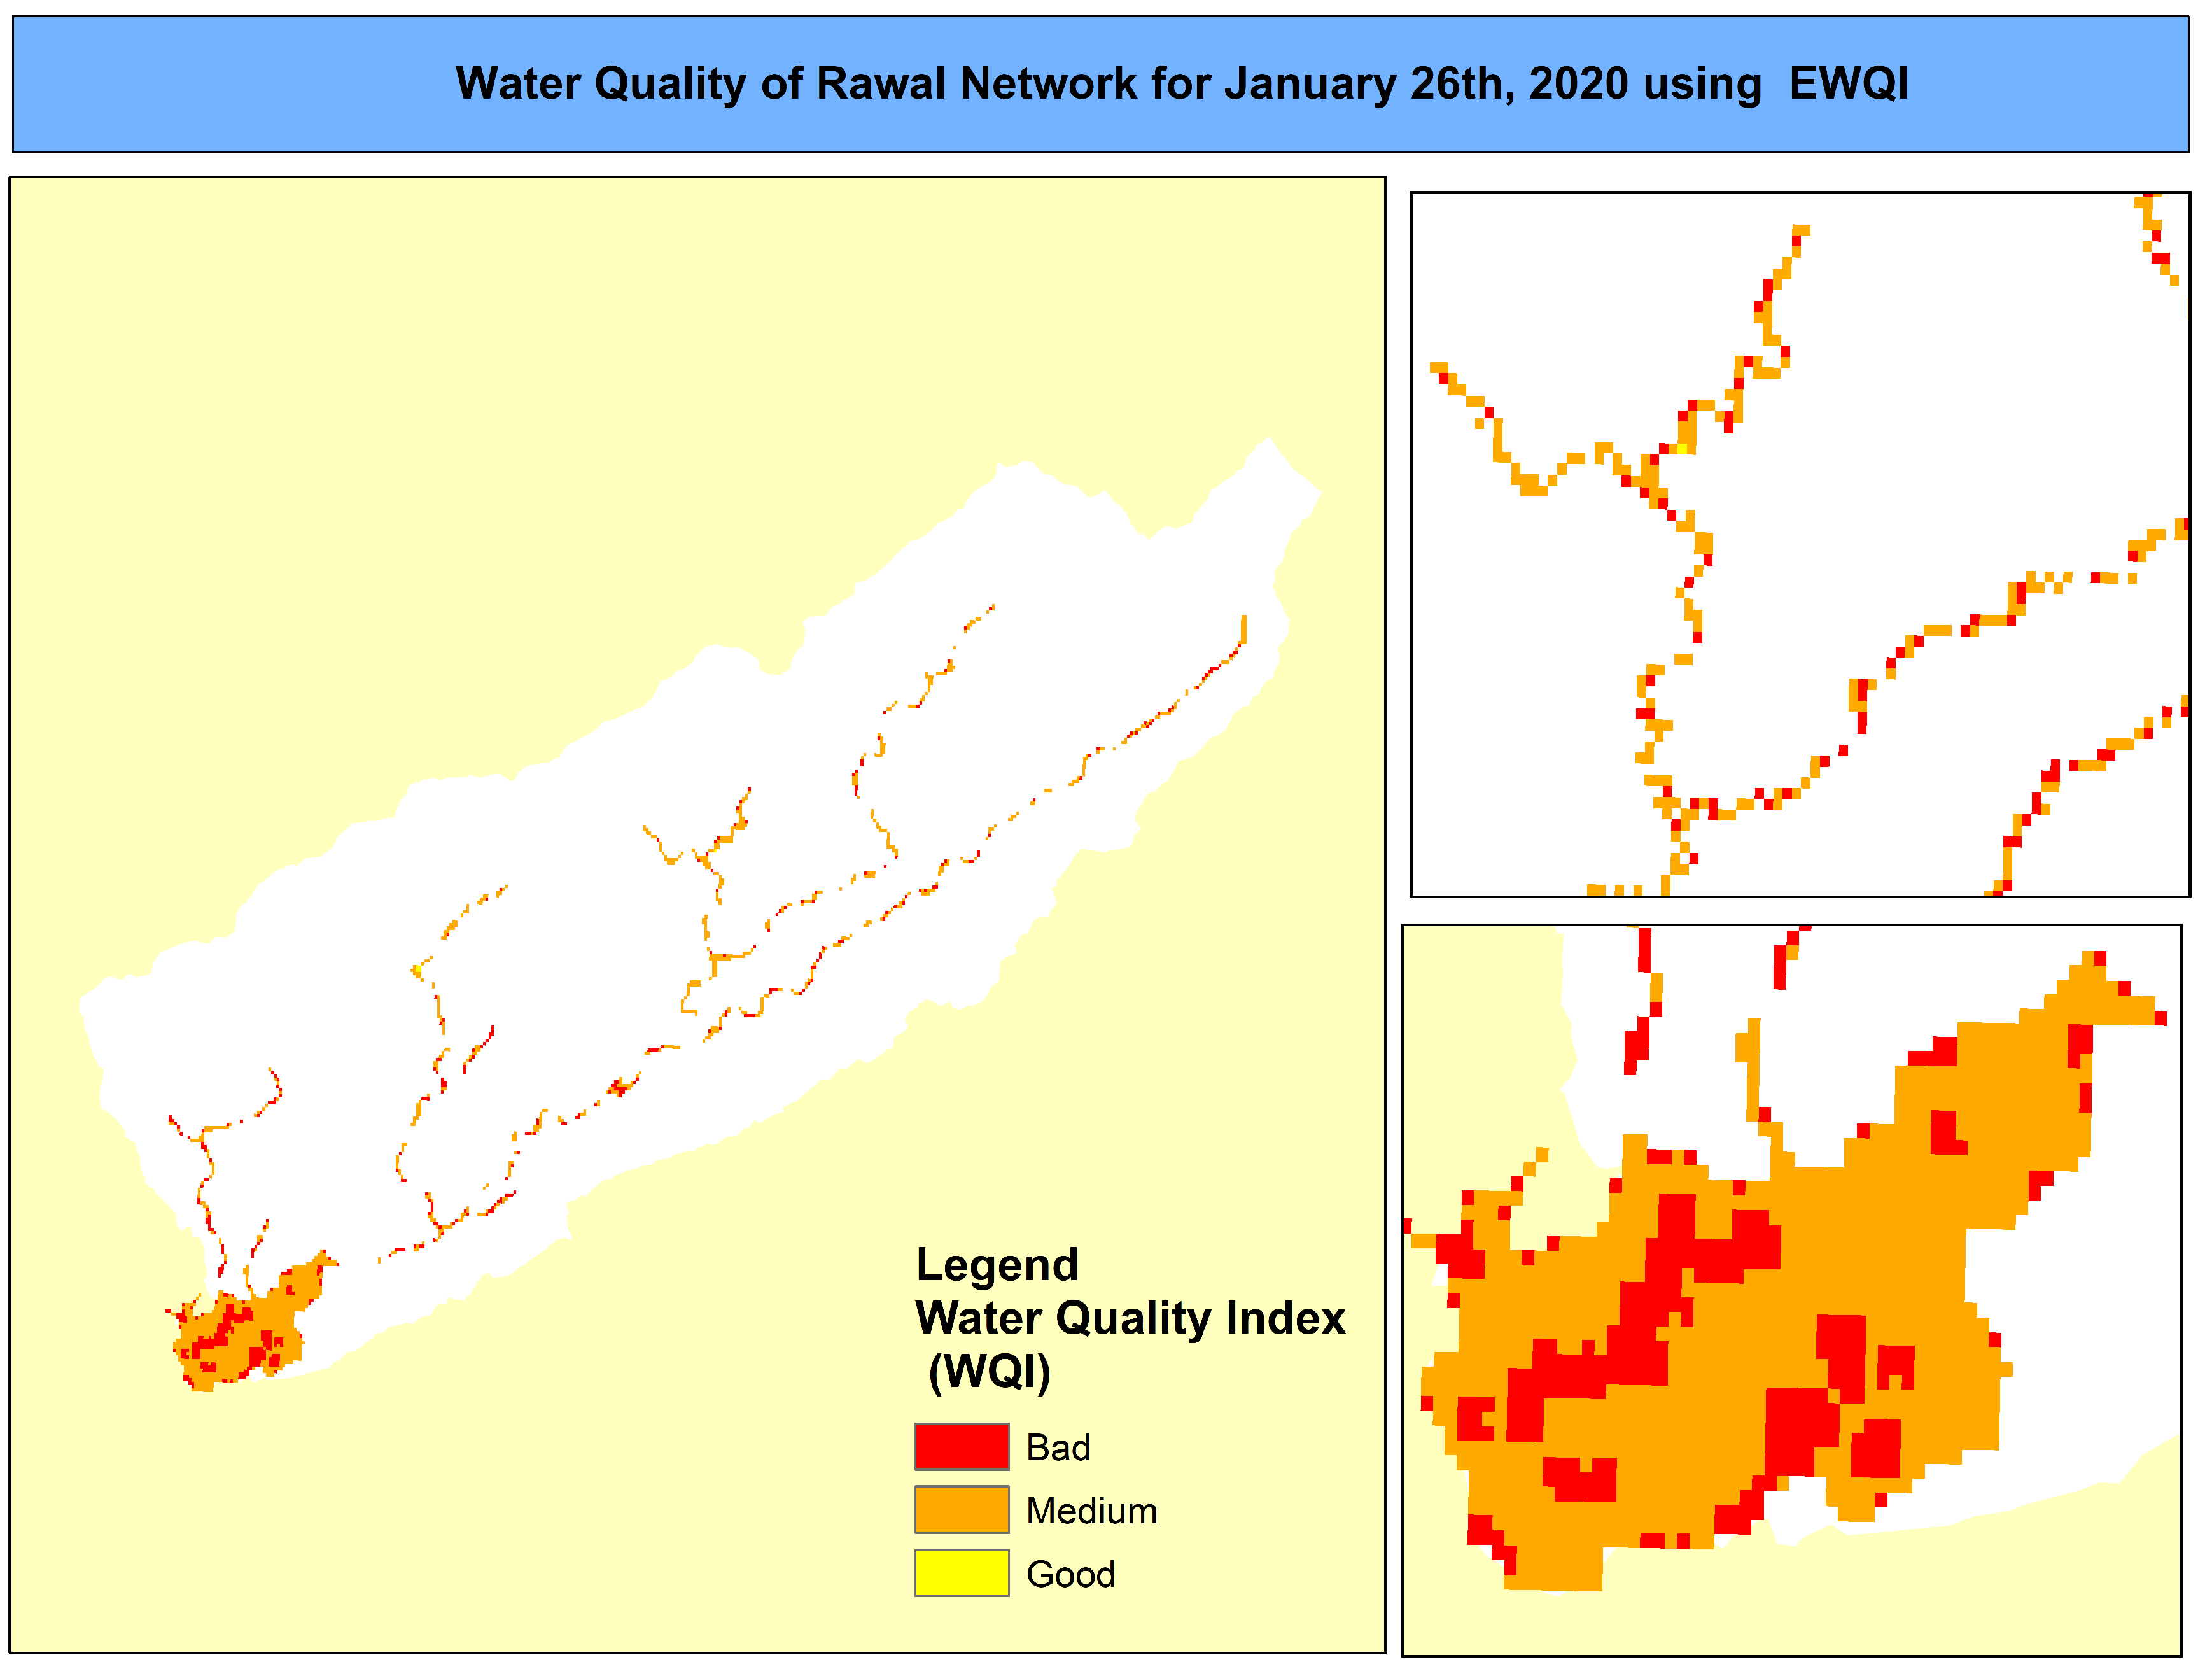
| 26 January 2020 | 21 | EWQI (LGBM) | Medium | 2856 |
| Bad | 2137 | |||
| Good | 4 | |||
| 7 | NSFWQI | Unclassified | 4998 | |
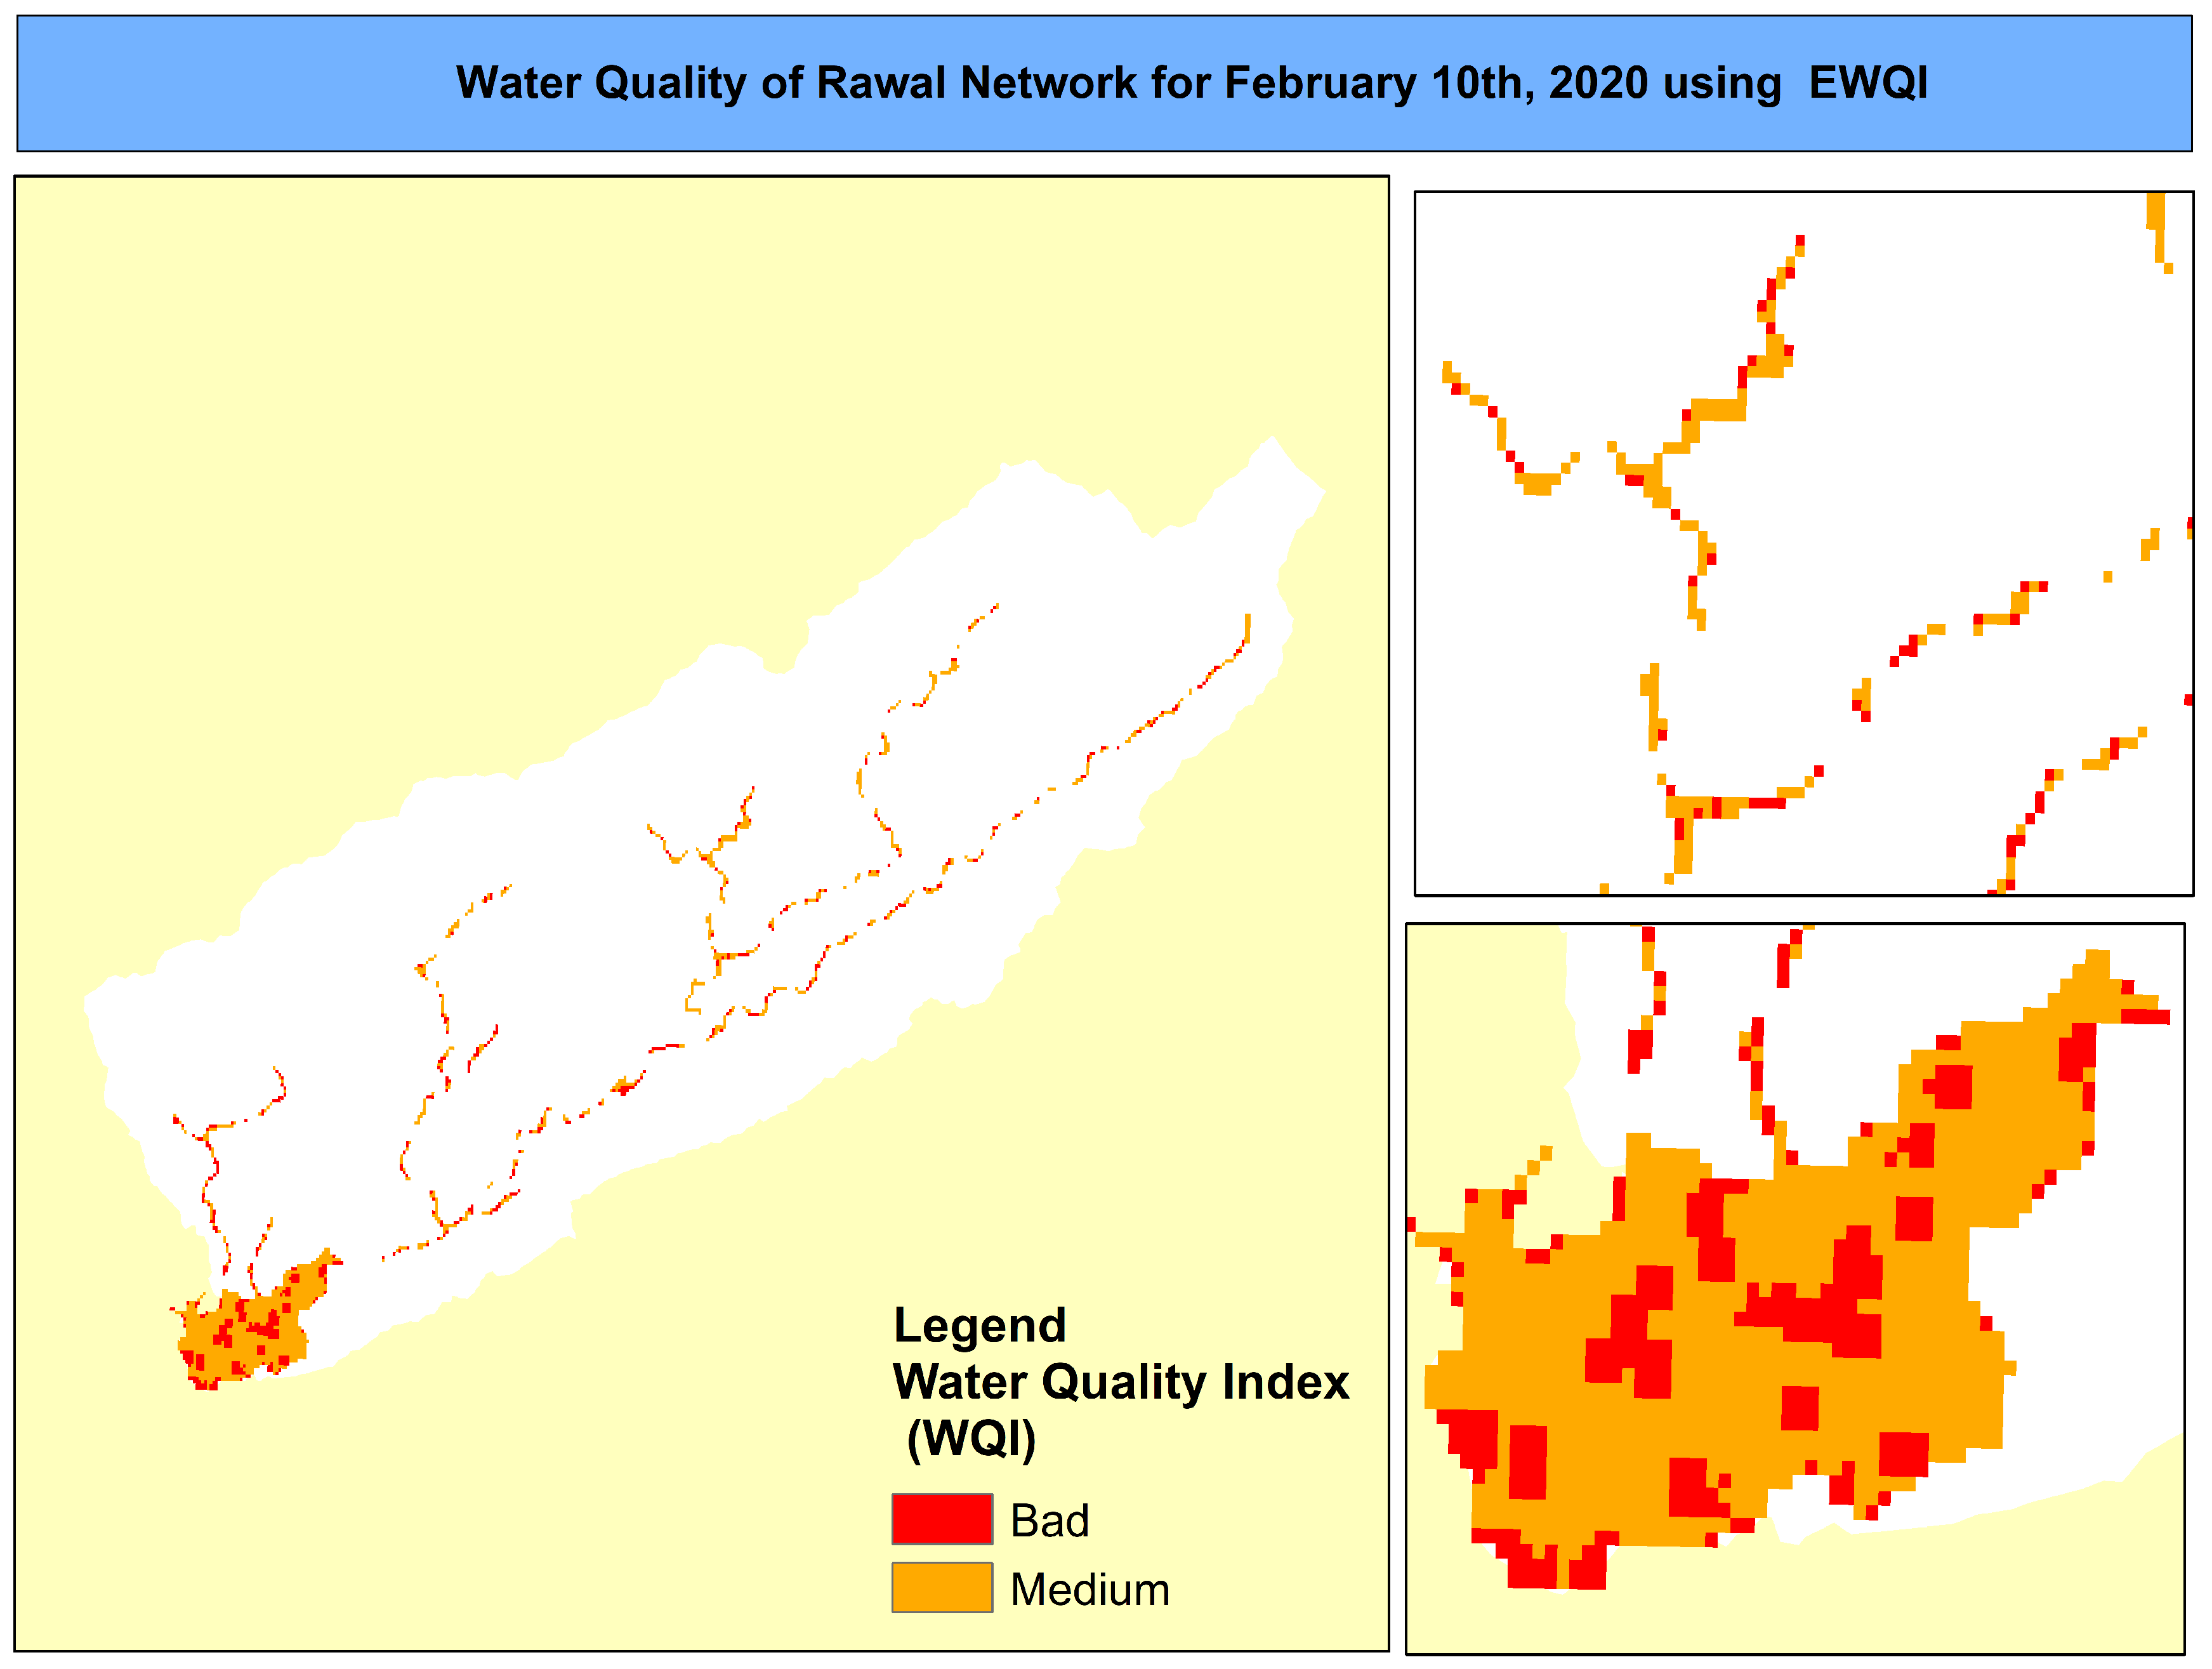
| 10 February 2020 | 21 | EWQI (LGBM) | Medium | 2537 |
| Bad | 2461 | |||
| 7 | NSFWQI | Unclassified | 4998 | |
| 1 March 2020 | 22 | EWQI (LGBM) | Medium | 2551 |
| Bad | 2447 | |||
| 7 | NSFWQI | Unclassified | 4998 | |
| 10 April 2020 | 21 | EWQI (LGBM) | Medium | 4081 |
| Bad | 917 | |||
| 7 | NSFWQI | Unclassified | 4998 | |
| 26 November 2020 | 17 | EWQI (LGBM) | Medium | 2030 |
| Bad | 2968 | |||
| 7 | NSFWQI | Unclassified | 4998 | |
| 6 December 2020 | 16 | EWQI (LGBM) | Medium | 846 |
| Bad | 4152 | |||
| 7 | NSFWQI | Unclassified | 4998 |
Publisher’s Note: MDPI stays neutral with regard to jurisdictional claims in published maps and institutional affiliations. |
© 2022 by the authors. Licensee MDPI, Basel, Switzerland. This article is an open access article distributed under the terms and conditions of the Creative Commons Attribution (CC BY) license (https://creativecommons.org/licenses/by/4.0/).
Share and Cite
Ahmed, M.; Mumtaz, R.; Anwar, Z. An Enhanced Water Quality Index for Water Quality Monitoring Using Remote Sensing and Machine Learning. Appl. Sci. 2022, 12, 12787. https://doi.org/10.3390/app122412787
Ahmed M, Mumtaz R, Anwar Z. An Enhanced Water Quality Index for Water Quality Monitoring Using Remote Sensing and Machine Learning. Applied Sciences. 2022; 12(24):12787. https://doi.org/10.3390/app122412787
Chicago/Turabian StyleAhmed, Mehreen, Rafia Mumtaz, and Zahid Anwar. 2022. "An Enhanced Water Quality Index for Water Quality Monitoring Using Remote Sensing and Machine Learning" Applied Sciences 12, no. 24: 12787. https://doi.org/10.3390/app122412787
APA StyleAhmed, M., Mumtaz, R., & Anwar, Z. (2022). An Enhanced Water Quality Index for Water Quality Monitoring Using Remote Sensing and Machine Learning. Applied Sciences, 12(24), 12787. https://doi.org/10.3390/app122412787