Abstract
The main objective of the present work is to evaluate the stochastic seismic response of a large-span continuous girder high-speed railway (CGHSR) bridge subjected to fully non-stationary seismic excitation. The stochastic ground motion is determined by a fully non-stationary ground acceleration model with both the time-varying intensity and frequency content. The stochastic seismic analysis of the large-span CGHSR bridge under a tri-directional earthquake, taking into consideration the wave passage effect, is performed using the pseudo excitation method (PEM) in frequency domain and the Monte Carlo sampling (MCS) method in time domain. A framework is proposed to determine the pseudo static displacement for the PEM under fully non-stationary seismic excitation, using the proper orthogonal decomposition (POD). A comparative study on the stochastic seismic response of the bridge is conducted using both the fully and modulated non-stationary ground acceleration. The results show that the structural nodal displacements estimated by the PEM agree well with those obtained by the MCS method. The proposed POD-based method works well in estimating the structural quasi-static displacement. Ignoring the frequency non-stationarity of the earthquake may underestimate the quasi-static displacement caused by the surface waves.
1. Introduction
Social and economic development requires faster and safer transportation systems. It becomes a prior alternative to construct high-speed railways (HSRs) to satisfy the strong mobility of both people and goods in modern societies [1,2]. In recent decades, the construction of the China HSR has been experiencing a golden period since the approbation of a series of national plans. According to these plans, four east-west lines and four north-south lines, which are also called “four vertical and four horizontal corridors”, have been built and cover a vast area in China [3,4,5]. Elevated bridges account for most of the length of the HSR networks due to its standardized design procedure, high smoothness, and shortcut construction. For instance, the continuous girder HSR (CGHSR) bridge accounts for approximately 70% of the Beijing-Shanghai HSR line in China and approximately 75% of the Taipei-kaohsiung line in Taiwan [6,7]. Simultaneously, China is most likely to be seriously attacked by frequent earthquakes, such as the 2008 Wenchuan earthquake (M8.0), 2013 Yaan earthquake (M7.0), and 2017 Jiuzhaigou earthquake (M7.0) [8,9]. As for the Wenchuan earthquake, it damaged over 6410 bridges that were difficult to repair [6]. Therefore, it is significant to investigate the seismic behavior of the CGHSR bridge to ensure the normal operation of the HSR line.
Earthquake ground motion is one of the typical stochastic excitations that can be determined by proper statistics [10]. Many meaningful research studies have been conducted on the stochastic seismic analysis of bridges. Harichandran et al. [11] studied the stationary and non-stationary seismic response of large-span bridges and proposed a general spatially varying earthquake ground motion model. Zanardo et al. [12] carried out a study of the simply supported bridges, considering spatially varying earthquake ground motion. Lin et al. [13] investigated non-stationary seismic responses under multiple seismic random excitations. Jangid [14] studied the stochastic response of bridges isolated by friction pendulum system and compared the non-stationary response of the bridge with that corresponding to the stationary case. Zhang et al. [15] comparatively analyzed a high-pier railway bridge under stationary and non-stationary spatially varying earthquake excitations. Su et al. [16] studied the non-stationary stochastic seismic response of a large-span bridges with local plastic deformations using an efficient explicit time-domain method. However, most of the non-stationary seismic stochastic analysis focused on the large-span cable supported bridges. In addition, to simplify the stochastic seismic analysis, the time-dependent uniformly modulated function, which can only represent the intensity of non-stationarity, is utilized in most of the research to model the ground motion. Due to the different arrival times of the push, shear and surface waves that vary significantly in frequency content, the frequency non-stationarity should be considered to give a more realistic depiction of the ground motion. Moreover, as the large-span CGHSR bridge is more rigid, to avoid excessive vertical deflection under the rail loads, the seismic performance may be different from other large-span flexible bridges. Therefore, it is of great significance to analyze the stochastic seismic performance of a large-span CGHSR bridge under fully non-stationary seismic excitations.
As the ground motion is treated as a stochastic process due to its random characteristics, the random vibration method (RVM) has been widely accepted to analyze the seismic performance of large-scale structures [17,18]. The Monte Carlo sampling (MCS) method is one of the most commonly used RVMs due to its versatility and simplicity [19,20]. As for stochastic seismic analysis, the random ground motion can be generated based on the prescribed statistics. Then, the problem becomes deterministic, and an ensemble of solutions can be obtained. Thus, the statistics of the ensemble can be extracted [21]. Due to the straightforwardness of the MCS method, the reliable statistics of stochastic responses can be obtained using the large sampling size. Hence, the MCS method can be utilized to give reference solutions for checking the results obtained by other methods [22]. A large number of simulations can result in an excessive computational burden and renders the MCS method computationally time-demanding [23]. To improve the computational efficiency of the stochastic analysis, Lin [24] proposed the pseudo excitation method (PEM), which is well known as the fast complete quadratic combination method. To consider the more complicate non-stationary case, the PEM has been extended to analyze multi-support structures under non-stationary seismic excitations, for which the wave passage effect and the coherency between input excitations are included [25,26]. With the aid of the PEM, stochastic analysis under stationary and non-stationary excitations can be transformed into harmonic and deterministic transient analyses, which can be solved easily with direct integration [27]. In addition, meaningful work has been conducted to make the PEM more attractive for engineering practice [15,28,29]. Currently, PEM is one of the basic tools for the stochastic seismic analysis of structures and is applied extensively in the civil engineering industry [30,31]. As for the modulated non-stationary seismic excitation, the pseudo static displacement of PEM is usually simplified based on the slowly time-varying characteristics of the modulating function. However, this slowly time-varying characteristic is not applicable for fully non-stationary seismic excitation. Hence, the expression of pseudo static displacement should be reconsidered for PEM under fully non-stationary seismic excitation.
Following the above discussions, the non-stationary stochastic seismic analysis of a large-span CGHSR bridge is conducted here. The evolutionary power spectral density (EPSD), taking into consideration both the time-dependent intensity and frequency content, is utilized in order to characterize the fully non-stationary seismic excitation. The PEM is performed to efficiently analyze the non-stationary seismic response of the CGHSR bridge under tri-directional non-stationary multiple excitations. A framework is proposed to determine the pseudo static displacement using the proper orthogonal decomposition (POD) under fully non-stationary seismic excitation. The stochastic responses obtained by PEM are validated using the MCS method. In addition, according to the energy conservation principle, an equivalent modulated EPSD is derived, corresponding to the fully non-stationary one. Using the fully and equivalent modulated ground acceleration models, the stochastic seismic response of the bridge is analyzed and contrasted.
2. Analysis Methodology
2.1. Equation of Structural Motion
In the global coordinate system, the motion equation for a structural system that has n degrees of freedom (DoFs) subjected to support motions can be represented as the following partitioned matrix form [32]:
where subscript s represents the slave DoFs; subscript b represents the master DoFs; , and represent the mass, damping and stiffness matrices, respectively; represents the seismic forces at structural supports; , and represent the vector of the nodal acceleration, velocity and displacement, respectively, in the global coordinate system; and represent the coupled damping and stiffness matrices, respectively; T denotes transpose.
Furthermore, the nodal absolute displacement can be split into the quasi-static displacement and the dynamic displacement .
The quasi-static displacement is caused by the non-uniform displacements of the supports and can be solved by:
where is the static influence matrix. The dynamic displacement satisfies the following equation [26]:
According to Equation (4), the dynamic displacement can be obtained in terms of the acceleration time-histories of each support.
2.2. Stochastic Analysis Using the PEM
As for the structural system with m supports, the cross-EPSD matrix of the fully non-stationary seismic excitations can be represented as:
where represents the circular frequency; is the auto-EPSD matrix at ith support; is the cross-EPSD matrix between ith and jth supports and can be obtained by [33]:
where denotes the coherence function between ith and jth spatial supports. The sub-matrix element is determined by two horizontal and a vertical component of the ground motion.
As for tri-directional ground motions, the horizontal components are assumed to be the same when there exists strong correlation between the horizontal ground motions. Here, and is given by [32]:
According to the Equations (5) and (6), the EPSD matrix can be rewritten as:
The elements in can be represented by the product of the lagged coherence part and the wave passage effect , represents the spatial distance between ith and jth supports and is the apparent wave velocity and taken as 50 m/s in this work [34]. Thus, the coherence matrix can be represented by:
where is the lagged coherence matrix; is the coherence phase matrix; denotes the element-wise production. Taking the first support along the direction of propagation as the reference node, the time delay of the motion at jth support to the reference node can be represented as . Then, the phase angle caused by the wave passage effect can be denoted as [27]. As the lagged coherence matrix is the diagonally dominant non-negative definite matrix, the eigenvalue decomposition (EVD) of the can be shown as:
where r is the rank of the lagged coherence matrix; represents the lth eigenvalue; represents the lth normalized eigenvector. Denote as [27]:
According to Equation (12), the coherence matrix can be rewritten as:
Thus, the Equation (9) can be rewritten as:
The Harichandran-Vanmarcke model is selected as the lagged coherence function here [35]:
where , , , and are the empirical model parameters given in [26,35], which are adopted here just as an example.
To solve Equation (4), the ground motion at the right-hand side can be replaced by the following pseudo excitation:
where the lth pseudo excitation vector can be represented by:
To ease the usage of the PEM, Equation (4) can be decomposed and rewritten as state-space representation under lth pseudo excitation:
where ; and ; and represent the ith modal frequency and damping ratio, respectively; represents the modal matrix. The numerical solution of Equation (21) is:
In Equation (22), the first part, at the right-hand side, can be solved by the precise integration method, while the second part is solved by second-order Newton-Cotes integration methods to improve the accuracy [36,37].
where is the uniform step size of the integral interval , ; ; the sub-points in the integral interval is .
Consider that the ground motion is determined by the following modulated EPSD [27]:
where is a slowly varying modulation function; is the power spectral density of a stationary stochastic process. Thus, the pseudo static displacement under the lth pseudo excitation can be simplified as [27]:
However, as for fully non-stationary seismic excitation, the frequency content has obvious time-varying characteristics. The pseudo static displacement should be reconsidered and calculated with direct integral using Equation (20):
With the aid of POD, the non-separable matrix can be decomposed as [38]:
where is the real time function and represents the orthonormal bases. To give the analytical solution of Equation (26), the following sum of sine function is considered to fit the time function :
Substituting Equations (27) and (28) to Equation (26), the pseudo static displacement can be represented as:
As the integral in Equation (29) has the analytical solution, the pseudo static displacement for fully non-stationary seismic excitation can also have a similar form as Equation (25). Note that and is selected here to reach a compromise between the computational efficiency and the accuracy. This POD-based pseudo static displacement determination framework is summarized in Table 1.

Table 1.
The POD-based pseudo static displacement determination framework.
Finally, the pseudo nodal absolute displacement under the lth pseudo excitation can be represented as the summation of the and . Then, the EPSD of the nodal absolute displacement can be calculated by:
The flow chart of the stochastic analysis of the CGHSR bridge under fully non-stationary seismic excitation using PEM is shown in Figure 1.
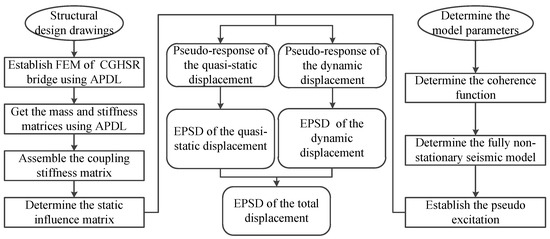
Figure 1.
The calculation flow chart using the PEM.
2.3. Stochastic Analysis Using the MCS Method
To obtain the statistical moments and the mean peak values of the structural responses, a sufficient number of ground motions should be generated, first using the specific fully non-stationary EPSD model and the coherence function through numerical simulation [19]. Once the ground motion samples are obtained, the structural responses in Equations (3) and (4) can be obtained using the numerical integral method. The spectral representation method (SRM) is widely used in engineering practice due to its accuracy and simplicity and is therefore adopted here [39,40]. Several efforts have been made to generate a multivariate non-stationary process via FFT [39,41,42,43,44]. Here, the POD-based method proposed by Huang [41] is adopted to generate the fully non-stationary seismic excitation due to its performance in terms of the accuracy, easy implementation and fewer matching items. Consider the ground motion characterized by the cross-EPSD in Equation (5) with the coherence matrix shown in Equation (11), then the cross-EPSD matrix can be rewritten as Equation (9). As the is the Hermitian matrix with non-negative definite property, the coherence matrix can be decomposed as [42]:
According to the cross-EPSD and coherence matrices, the cross-correlation matrix can be given by [45]:
where is the time lag. Taking only the correlation in spatial distributions of the ground motion into account, the fully non-stationary seismic excitation can therefore be divided into three independent 1D components in tri-directions. With the aid of the POD, the EPSD matrix can be factorized as [40]:
The final expression of the generated samples for structural stochastic analysis using MCS method can be give as [40]:
where is the frequency resolution; represents the cutoff frequency; denotes the number of discretized frequencies; ; are random phase angles subject to uniform distribution on . Based on the generated acceleration samples, the dynamic displacement in Equation (4) can be solved using numerical integral methods. Meanwhile, the frequency-domain integral method can be utilized to identify the displacement of the ground motion using the generated ground acceleration samples [46,47]. Then, the quasi-static displacement can be directly solved using Equation (3). Thus, the large number of solutions provide statistical samples to obtain the statistics of the structural responses.
3. Stochastic Seismic Response of the Large-Span CGHSR Bridge
3.1. Finite Element Model (FEM) of the CGHSR Bridge
A large-span CGHSR bridge is employed here, with a total span of 268 m, consisting of a cast-in-place, pre-stressed concrete box girder made of C55, with three spans of (68 + 132 + 68) m [48]. The bridge configuration is presented, in detail, in Figure 2. The single-box, single-cell continuous girder with variable height and cross-section is 8.5 m wide, while the maximum and minimum girder height is 9.6 m and 5.6 m, respectively. The girder soffit varies in terms of a quadratic parabola. Four solid reinforced concrete shaft piers made of C35 concrete consist of the substructure of the CGHSR bridge. Spherical steel bearings are utilized to connect the girder and piers, the prototype of which is shown in Figure 2. The fixed bearing is employed at the top of 2# pier, while others remain unfixed. The total weight of the CGHSR bridge is 214,800 kN.
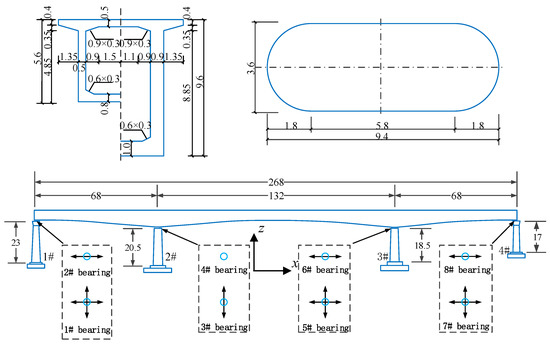
Figure 2.
The structure layout of the CGHSR bridge (unit: m).
The 3D model of the bridge, shown in Figure 2, is developed using MATLAB, based on the FEM method. In contrast to the general highway and railway bridge, the HSR bridge is well-designed, with a more rigid and relatively strong structure to ensure safety and comfort in the operating of high-speed trains on the railway line. The following assumptions are considered to reasonably simplify the FEM and highlight the main objective of this work, as much as possible: (i) the bridge structure is within the elastic range under seismic excitation; (ii) the stiffness contribution of the auxiliary structures such as curbs, parapet walls, deck pavement, and electric system, are ignored, whereas the mass of these facilities is added in the model. Linear elastic material is employed. The Young’s modulus and Poisson ratio of concrete are taken as 3.45 × 10⁴ MPa and 0.2, respectively [49,50]. The girder and piers are modelled by elastic beam elements. The fixed boundary conditions are adopted to the bottom of pier 1# to pier 4#. The whole model consists of 67 nodes and 374 DoFs.
The modal analysis was conducted based on the initial FEM. For brevity, Table 2 lists only the first ten natural frequencies and vibration modes of the bridge. More details of the FEM can be found in [48].

Table 2.
Summary of the first 10 modes of the CGHSR bridge.
As shown in Table 2, most of the numerical results are close to the design value, which to some extent verify the validity of the developed FEM. The first natural frequency of the bridge, corresponding to the symmetric lateral bending vibration of the girder, is 1.1291 Hz. This indicates that the CGHSR bridge is much more rigid than other large-span highway or railway continuous girder bridges [15,51]. Figure 3 schematically shows several typical modes.
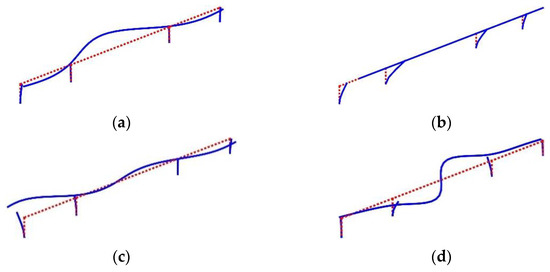
Figure 3.
Several typical mode shapes of the CGHSR bridge: (a) First-order; (b) Second-order; (c) Fourth-order; (d) Seventh-order.
To conduct the stochastic analysis of the bridge, the mass and stiffness matrices of the bridge are also verified using the following conditions:
3.2. Determination of the Static Influence Matrix
Consider that the sub-matrix of belongs to the DoFs of the ith supports; thus, only the DoFs of the connected node j have non-zero elements in matrix .
where ; and represent the translational and rotational DoFs of the free nodes. The non-zero elements can be determined according to Figure 4.

Figure 4.
Non-zero elements in : (a) Ubx = 1; (b) Uby = 1; (c) Ubz = 1.
As shown in Figure 4a, if the ith support translates one unit in x direction, the connected node j can translate in x direction and rotate around y-axis. Figure 4b,c show the cases when the ith support translates one unit in y and z directions, respectively. Thus, matrix can be represented by:
Taking all the supports into account, the coupled stiffness matrix can be assembled based on Equation (40). Then, the static influence matrix can be obtained with Equation (3). If all supports are assumed to translate one unit along the x, y or z direction, the structural nodal displacement will translate one unit in the corresponding direction. Hence, the reliability of the obtained can be validated as follows.
where is the DoFs of the ith node in direction.
3.3. Fully Non-Stationary Ground Acceleration Model
Consider the ground motion , defined as the following sigma-oscillatory Gaussian process [10]:
where the component processes are independent uniformly modulated processes with zero mean; is the deterministic time-modulating function of the pth component process admitting the following representation [10]:
where and are positive constants; is the positive integer; is the “arrival time” of the pth sub-process; and is the unit step function. The auto-correlation function of the pth zero-mean stationary Gaussian process is defined as [10]:
and its power spectral density (PSD) function is:
where is the frequency bandwidth; is the predominant (or central) frequency of the process. From Equation (42), the EPSD function of is:
The parameters of the sigma-oscillatory process model are shown in Table 3. Figure 5 shows the EPSD of the fully non-stationary seismic excitation using the parameters in Table 3.

Table 3.
Parameters of the fully non-stationary ground acceleration model.
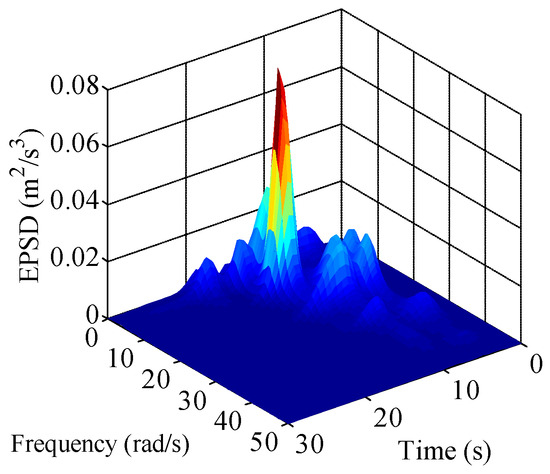
Figure 5.
Analytical EPSD of the fully non-stationary ground acceleration.
As shown in Figure 5, the frequency content shifts towards the lower range as time elapses, indicating that the surface waves arriving last have a lower frequency than the push and shear waves, which arrive much earlier. Equation (46) reproduces both the intensity and frequency non-stationary characteristics of the real earthquake record. To analyze the structural responses under the seismic excitation that only considering the non-stationarity of the intensity, an equivalent modulated non-stationary ground acceleration model, corresponding to the fully non-stationary model, can be derived following the energy conservation principle. The modulated non-stationary ground acceleration model is represented by:
where is the parameter that ensures the energy conservation; and are the time-modulating function and PSD function, which can be obtained with the following steps:
Step I: Using the MCS method to generate a large number of ground acceleration samples, according to the fully non-stationary ground acceleration model in Equation (46). Here, 500 samples are generated using the MCS method.
Step II: As for each generated sample, estimate its time-modulating function using the Kernel regression method and the PSD using the Pwelch method.
Step III: Calculating the ensemble average of the estimated time-modulating functions and the PSDs, which represent the and , respectively.
Step IV: Conducting double integration of in Equation (47) and the EPSD in Equation (46), which represent the total energy of the ground acceleration. Then, determine by following the energy conservation principle.
The total energy of the analytical EPSD of the fully non-stationary ground acceleration is 75,281 cm2/s2, while the total energy is 33,133 cm2/s2 for . Then, is 2.272, based on the energy conservation between the EPSD in Equations (46) and (47). Figure 6 shows the estimated modulated non-stationary ground acceleration model.
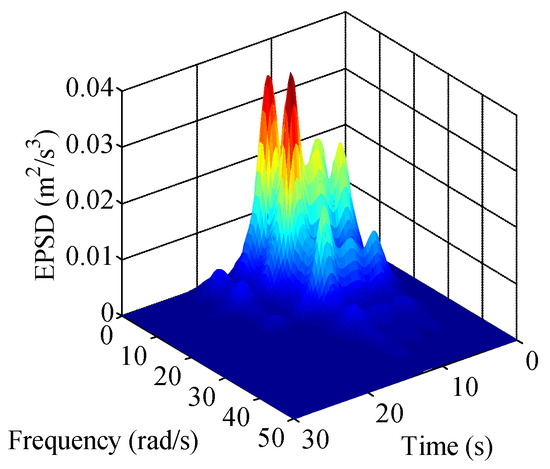
Figure 6.
Estimated modulated non-stationary ground acceleration model.
As shown in Figure 6, the modulated non-stationary model captures the time-varying intensity (or intensity non-stationarity) of the earthquake ground motion. However, the frequency contents remain unchanged as time released.
3.4. Structural Stochastic Seismic Response
The structural seismic responses are analyzed using both the PEM and MCS method. The obtained results are cross-checked against each other. To utilize the MCS method, 500 samples of the fully non-stationary tri-directional seismic excitations are first generated with the fully non-stationary EPSD in Equation (46). Figure 7 shows one of the generated seismic excitation samples.
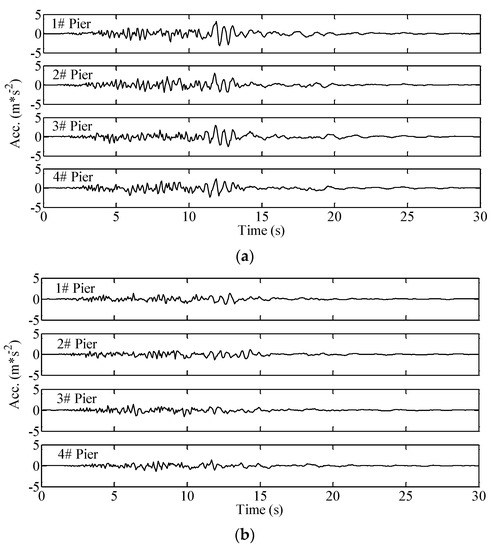
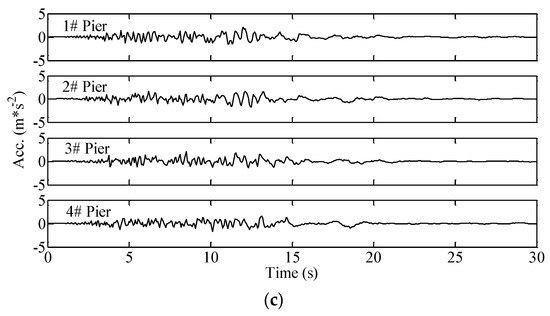
Figure 7.
A sample of the fully non-stationary tri-directional seismic excitations: (a) Seismic excitations in x direction; (b) Seismic excitations in y direction; (c) Seismic excitations in z direction.
The auto-/cross-correlation functions are estimated using the generated samples. Meanwhile, the estimated correlation functions are compared with the target ones to validate the reliability of the generated samples, as shown in Figure 8.
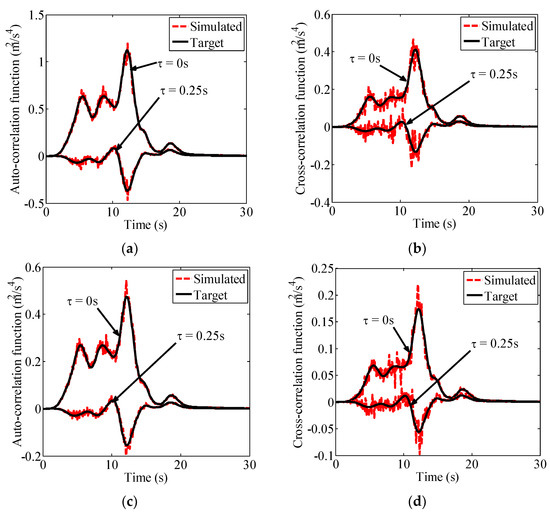
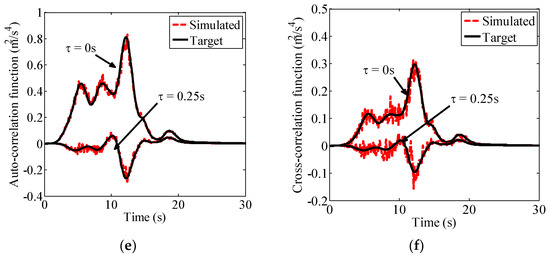
Figure 8.
The estimated correlation functions with the target ones: (a) x direction (Auto-correlation); (b) x direction (Cross-correlation); (c) y direction (Auto-correlation); (d) y direction (Cross-correlation); (e) z direction (Auto-correlation); (f) z direction (Cross-correlation).
From Figure 8, it is seen that the estimated correlation functions generally agree well with the target ones, indicating the reliability of the generated fully non-stationary tri-directional seismic excitations. Then, the structural stochastic response (quasi-static and dynamic displacement) can be calculated using the MCS method in time domain. To facilitate the comparison of the structural stochastic response obtained using the MCS and PEM methods, the time-dependent response root mean square (RMS) is derived as [52]:
where the EPSD of the structural response in Equation (31) can be transformed into the time-dependent response RMS; the response RMS is utilized for the following illustrations of the structural stochastic analysis. Using the PEM and MCS method, the nodal absolute displacement RMS of the bridge girder is obtained, respectively, and shown in Figure 9 and Figure 10.
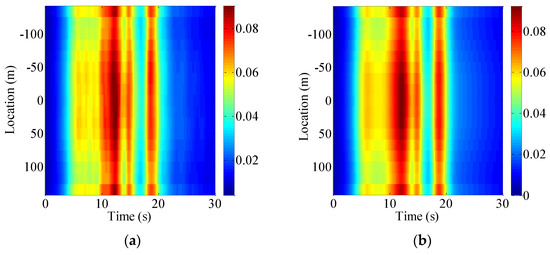
Figure 9.
Time-dependent absolute displacement RMS of the girder in z direction (Vertical): (a) MCS; (b) PEM (Unit: m).
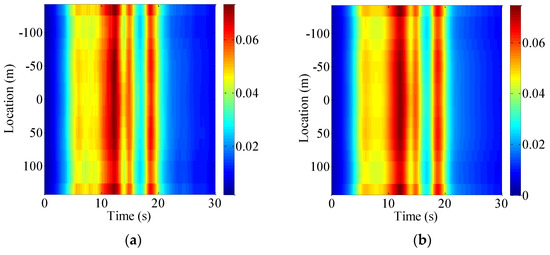
Figure 10.
Time-dependent absolute displacement RMS of the girder in y direction (Transversal): (a) MCS; (b) PEM (Unit: m).
As shown in Figure 9 and Figure 10, the time-dependent absolute displacement RMS obtained by the MCS method generally agree well with that by PEM, validating the reliability of the estimated results. It is evident that the z direction value is relatively larger than that in the y direction. It can also be observed that the nodal absolute displacement RMS is time-varying due to the non-stationary effects of the ground motion. Furthermore, the time-dependent absolute displacement RMS at the mid-span is shown in Figure 11.
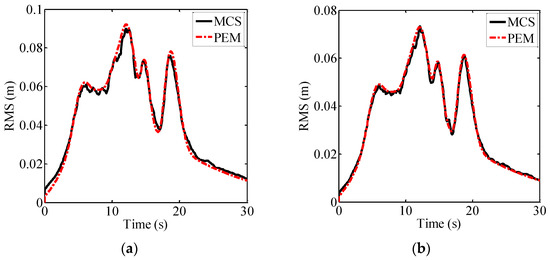
Figure 11.
Time-dependent absolute displacement RMS at the mid-span: (a) Vertical (z direction); (b) Transversal (y direction).
As shown in Figure 11, the maximum displacement RMS at the mid-span is 0.092 m in the z direction and decreases to 0.073 m in the y direction. It is easy to see that the maximum displacement RMS occurs at t = 12.1 s, which roughly coincides with the occurrence time of the maximum value in the fully non-stationary EPSD model in Figure 5. Furthermore, the displacement RMS has a noticeable increase after t = 16.8 s and reaches the second peak value, 0.078 m, in the z direction and 0.061 m in the y direction, respectively, at t = 18.6 s. This phenomenon is caused by the arrived surface waves from t = 16 s to 20 s in Figure 5. Note that the second peak values of the absolute displacement RMS are more than 80 percent of the maximum in both directions, indicating that the structural seismic response caused by the last arrived surface waves should be carefully considered. Furthermore, the time-dependent dynamic displacement RMS of the girder is also shown in Figure 12 and Figure 13.
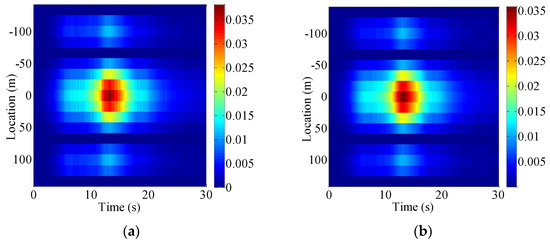
Figure 12.
Time-dependent dynamic displacement RMS of the girder in z direction (Vertical): (a) MCS; (b) PEM (Unit: m).
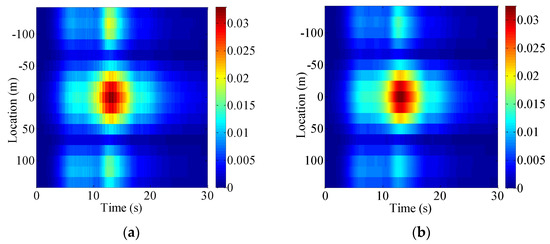
Figure 13.
Time-dependent dynamic displacement RMS of the girder in y direction (Transversal): (a) MCS; (b) PEM (Unit: m).
As shown in Figure 12 and Figure 13, the time-dependent dynamic displacement RMS obtained by the MCS method fits well with that obtained by the PEM, indicating that the quasi-static displacement obtained by the PEM and MCS methods also agree well with each other. Thus, the reliability of the proposed POD-based method in Table 1 is validated. The vertical dynamic displacement is evidently relatively larger than that in the transversal direction. In addition, the time-dependent dynamic displacement RMS at the mid-span is shown in Figure 14.
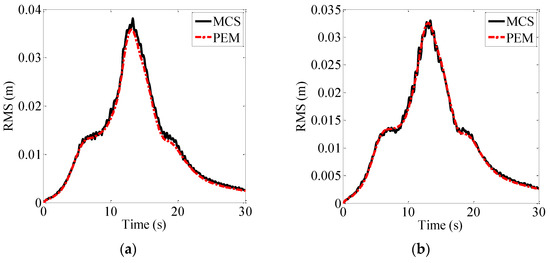
Figure 14.
Time-dependent absolute displacement RMS at the mid-span: (a) Vertical (z direction); (b) Transversal (y direction).
In Figure 14, the maximum values of the dynamic displacement RMS in both directions are close to each other (0.036 m in z direction and 0.033 m in y direction). It can also be concluded that the structural dynamic and quasi-static displacement contributes almost the same to the nodal absolute displacement of the CGHSR bridge. Moreover, as there is no obvious increase in the dynamic displacement RMS from t = 16 s to 20 s, the second peak value for the absolute displacement is mainly caused by the quasi-static displacement. Hence, it is significant to determine the quasi-static displacement reasonably when considering the fully non-stationary seismic excitation. Meanwhile, the structural stochastic response is also estimated under the equivalent modulated non-stationary seismic excitation, as shown in Figure 15.
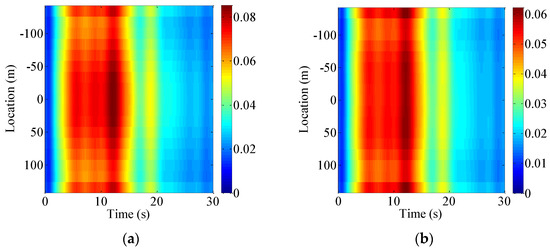
Figure 15.
Time-dependent absolute displacement RMS (Modulated non-stationary): (a) Vertical (z direction); (b) Transversal (y direction) (Unit: m).
The time-dependent absolute displacement RMS is estimated using the PEM in Figure 15. From Figure 15, it can be seen that the estimated absolute displacement RMS also has time-varying characteristics, which are similar to those in Figure 9 and Figure 10. To further compare the difference of the structural seismic response under fully and modulated non-stationary seismic excitations, the time-dependent absolute displacement RMS at the mid-span is compared in Figure 16.
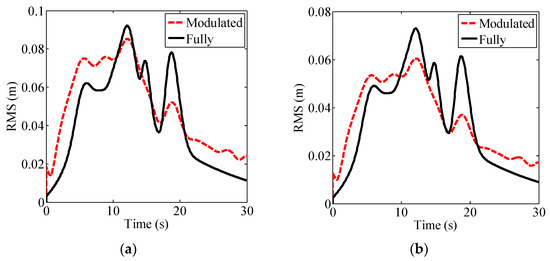
Figure 16.
Comparison of the absolute displacement RMS at the mid-span: (a) Vertical (z direction); (b) Transversal (y direction).
As shown in Figure 16, the maximum displacement RMS at the mid-span is 0.085 m in the z direction and decreases to 0.060 m in the y direction under the equivalent modulated non-stationary seismic excitation, which is lower than the corresponding values under the fully non-stationary seismic excitation. Furthermore, the second peak values of the absolute displacement RMS under modulated non-stationary seismic excitation are much lower than those under fully non-stationary seismic excitation in both directions, indicating that ignoring the frequency non-stationarity of the ground motion can underestimate the structural response caused by the surface waves for such a large-span CGHSR bridge. Thus, it is significant to consider the fully non-stationary characteristics (both intensity and frequency) of the earthquake ground motion to design the large-span CGHSR bridge. As for design process, the stochastic analysis are much simpler to be conducted for modulated cases, thus the amplification coefficients can be personally defined to modify the results in modulated cases in order to consider the seismic fully non-stationary characteristics.
With the exception of the results of the displacement RMS, the force RMS is of great concern to engineers as it can be directly used for structural design. The maximum RMS of the critical shear force and bending moment of the bridge piers are presented in Table 4 and Table 5, respectively.

Table 4.
Maximum RMS of shear force at the bottom of piers (×105 kN).

Table 5.
Maximum RMS of bending moment at the bottom of piers (×106 kN·m).
It can be seen from Table 4 and Table 5 that the maximum shear force and bending moment occurs at the 2# pier under the two non-stationary seismic excitations. Moreover, the maximum RMS of the shear force and bending moment at the bottom of each pier under fully non-stationary seismic excitation is larger than those under equivalent modulated non-stationary excitation.
4. Conclusions
This work presented a stochastic seismic analysis of a large-span CGHSR bridge subjected to fully non-stationary seismic excitation using the PEM and MCS methods. A POD-based method is proposed to determine the pseudo static displacement for PEM under fully non-stationary seismic excitation. For the purpose of comparison, a modulated non-stationary ground acceleration model corresponding to the fully non-stationary one is derived based on the energy conservation principle. Taking into consideration the wave-passage effects, the critical response of the structural key positions under both non-stationary seismic excitations were analyzed and contrasted. The following conclusions are drawn accordingly:
- The proposed POD-based method can determine the structural pseudo static displacement for PEM under fully non-stationary seismic excitation. The structural dynamic and quasi-static displacement contributes almost the same to the absolute displacement.
- The last arrived surface waves can also cause a relatively large displacement. The frequency non-stationarity of the earthquake ground motion should be considered to avoid underestimating the structural quasi-static displacement caused by the surface waves.
- The structural stochastic response under fully non-stationary seismic excitation is larger than that under equivalent modulated non-stationary seismic excitation.
Note that the stochastic seismic analysis is conducted, here, in the frequency domain and it is difficult to consider the geometric nonlinearity, particularly for long-span bridges, which requires further analysis.
Author Contributions
Conceptualization, C.X. and H.W.; methodology, C.X.; formal analysis, C.X., Z.X. and R.L.; writing—original draft preparation, C.X.; funding acquisition, H.W. All authors have read and agreed to the published version of the manuscript.
Funding
This research work was jointly supported by the National Natural Science Foundation of China (Nos. 52208468, 52208481) and the Natural Science Foundation of Jiangsu Province (No. BK20220851).
Data Availability Statement
Not applicable.
Conflicts of Interest
The authors declare no conflict of interest.
References
- Yan, B.; Dai, G.; Hu, N. Recent development of design and construction of short span high-speed railway bridges in China. Eng. Struct. 2015, 100, 707–717. [Google Scholar] [CrossRef]
- He, X.; Wu, T.; Zou, Y.; Chen, Y.; Guo, H.; Yu, Z. Recent developments of high-speed railway bridges in China. Struct. Infrastruct. Eng. 2017, 13, 1584–1595. [Google Scholar] [CrossRef]
- He, G.; Mol, A.; Zhang, L.; Lu, Y. Environmental risks of high-speed railway in China: Public participation, perception and trust. Environ. Dev. 2015, 14, 37–52. [Google Scholar] [CrossRef]
- Cai, C.; He, Q.; Zhu, S.; Zhai, W.; Wang, M. Dynamic interaction of suspension-type monorail vehicle and bridge: Numerical simulation and experiment. Mech. Syst. Signal Process. 2019, 118, 388–407. [Google Scholar] [CrossRef]
- Zhang, Y.; Wang, H.; Mao, J.; Wang, F.; Hu, S.; Zhao, X. Monitoring-Based Assessment of the Construction Influence of Benoto Pile on Adjacent High-Speed Railway Bridge: Case Study. J. Perform. Constr. Facil. 2019, 33, 04018106. [Google Scholar] [CrossRef]
- Guo, W.; Hu, Y.; Liu, H.; Bu, D. Seismic performance evaluation of typical piers of China’s high-speed railway bridge line using pushover analysis. Math. Probl. Eng. 2019, 2019, 9514769. [Google Scholar] [CrossRef]
- Zhang, Z.; Lin, J.; Zhang, Y.; Zhao, Y.; Howson, W.; Williams, F. Non-stationary random vibration analysis for train–bridge systems subjected to horizontal earthquakes. Eng. Struct. 2010, 32, 3571–3582. [Google Scholar] [CrossRef]
- Liu, Y.; Yang, Y.; Li, L. Major natural disasters and their spatio-temporal variation in the history of China. J. Geogr. Sci. 2012, 22, 963–976. [Google Scholar] [CrossRef]
- Wei, B.; Li, C.; He, X. The applicability of different earthquake intensity measures to the seismic vulnerability of a high-speed railway continuous bridge. Int. J. Civ. Eng. 2019, 17, 981–997. [Google Scholar] [CrossRef]
- Zucca, M.; Giuseppe, C.P.; Tropeano, G.; Simoncelli, M. On the Influence of Shallow Underground Structures in the Evaluation of the Seismic Signals. Ing. Sismica 2021, 38, 23–35. [Google Scholar]
- Harichandran, R.; Hawwari, A.; Sweidan, B. Response of long-span bridges to spatially varying ground motion. J. Struct. Eng. 1996, 122, 476–484. [Google Scholar] [CrossRef]
- Zanardo, G.; Hao, H.; Modena, C. Seismic response of multi-span simply supported bridges to a spatially varying earthquake ground motion. Earthq. Eng. Struct. Dyn. 2002, 31, 1325–1345. [Google Scholar] [CrossRef]
- Lin, J.; Zhang, Y.; Yan, Z. Seismic spatial effects on long-span bridge response in nonstationary inhomogeneous random fields. Earthq. Eng. Eng. Vib. 2005, 4, 75–82. [Google Scholar]
- Jangid, R. Stochastic response of bridges seismically isolated by friction pendulum system. J. Bridge Eng. 2008, 13, 319–330. [Google Scholar] [CrossRef]
- Zhang, J.; Jia, H.; Zheng, S.; Qin, S.; Zhang, K. Analysis of a high-pier railway bridge under spatial stochastic stationary and non-stationary earthquake excitations. Teh. Vjesn. /Tech. Gaz. 2016, 23, 465–475. [Google Scholar]
- Su, C.; Liu, X.; Li, B.; Huang, Z. Inelastic response analysis of bridges subjected to non-stationary seismic excitations by efficient MCS based on explicit time-domain method. Nonlinear Dyn. 2018, 94, 2097–2114. [Google Scholar] [CrossRef]
- EN1998-2:2005; Eurocode 8: Design Provisions of Structures for Earthquake Resistance, Part 2: Bridges. European Committee for Standardization: Brussels, Belgium, 2005.
- JTG/T B02-01-2008; Guidelines for Seismic Design of Highway Bridges. China Communications Press: Beijing, China, 2008.
- Shinozuka, M. Monte Carlo solution of structural dynamics. Comput. Struct. 1972, 2, 855–874. [Google Scholar] [CrossRef]
- Xiu, D. Fast numerical methods for stochastic computations: A review. Commun. Comput. Phys. 2009, 5, 242–272. [Google Scholar]
- Hacıefendioğlu, K.; Başağa, H.; Banerjee, S. Probabilistic analysis of historic masonry bridges to random ground motion by Monte Carlo Simulation using Response Surface Method. Constr. Build. Mater. 2017, 134, 199–209. [Google Scholar] [CrossRef]
- Proppe, C.; Pradlwarter, H.; Schuëller, G. Equivalent linearization and Monte Carlo simulation in stochastic dynamics. Probabilistic Eng. Mech. 2003, 18, 1–15. [Google Scholar] [CrossRef]
- Au, S.; Beck, J. Subset simulation and its application to seismic risk based on dynamic analysis. J. Eng. Mech. 2003, 129, 901–917. [Google Scholar] [CrossRef]
- Lin, J. A fast CQC algorithm of PSD matrices for random seismic responses. Comput. Struct. 1992, 44, 683–687. [Google Scholar]
- Lin, J.; Zhang, W.; Williams, F. Pseudo-excitation algorithm for nonstationary random seismic responses. Eng. Struct. 1994, 16, 270–276. [Google Scholar] [CrossRef]
- Lin, J.; Li, J.; Zhang, W.; Williams, F. Random seismic responses of multi-support structures in evolutionary inhomogeneous random fields. Earthq. Eng. Struct. Dyn. 1997, 26, 135–145. [Google Scholar] [CrossRef]
- Lin, J.; Zhang, Y.; Li, Q.; Williams, F. Seismic spatial effects for long-span bridges, using the pseudo excitation method. Eng. Struct. 2004, 26, 1207–1216. [Google Scholar] [CrossRef]
- Jia, H.; Zhang, D.; Zheng, S.; Xie, W.; Pandey, M. Local site effects on a high-pier railway bridge under tridirectional spatial excitations: Nonstationary stochastic analysis. Soil Dyn. Earthq. Eng. 2013, 52, 55–69. [Google Scholar] [CrossRef]
- Zhang, D.; Jia, H.; Zheng, S.; Xie, W.; Pandey, M. A highly efficient and accurate stochastic seismic analysis approach for structures under tridirectional nonstationary multiple excitations. Comput. Struct. 2014, 145, 23–35. [Google Scholar] [CrossRef]
- Lin, J.; Zhang, Y.; Zhao, Y. Pseudo excitation method and some recent developments. Procedia Eng. 2011, 14, 2453–2458. [Google Scholar] [CrossRef]
- Muscolino, G.; Alderucci, T. Closed-form solutions for the evolutionary frequency response function of linear systems subjected to separable or non-separable non-stationary stochastic excitations. Probabilistic Eng. Mech. 2015, 40, 75–89. [Google Scholar] [CrossRef]
- Yu, H.; Wang, B.; Gao, Z.; Li, Y. An exact and efficient time-domain method for random vibration analysis of linear structures subjected to uniformly modulated or fully non-stationary excitations. J. Sound Vib. 2020, 488, 115648. [Google Scholar] [CrossRef]
- Colajanni, P.; Pagnotta, S.; Testa, G. Comparison of fully non-stationary artificial accelerogram generation methods in reproducing seismicity at a given site. Soil Dyn. Earthq. Eng. 2020, 133, 106135. [Google Scholar] [CrossRef]
- Zerva, A. Spatial Variation of Seismic Ground Motions: Modeling and Engineering Applications; Crc Press: Boca Raton, FL, USA, 2016. [Google Scholar]
- Muscolino, G.; Genovese, F.; Biondi, G.; Cascone, E. Generation of fully non-stationary random processes consistent with target seismic accelerograms. Soil Dyn. Earthq. Eng. 2021, 141, 106467. [Google Scholar] [CrossRef]
- Simos, T. High-order closed Newton–Cotes trigonometrically-fitted formulae for long-time integration of orbital problems. Comput. Phys. Commun. 2008, 178, 199–207. [Google Scholar] [CrossRef]
- Gao, Q.; Wu, F.; Zhang, H.; Zhong, W.; Howson, W.; Williams, F. A fast precise integration method for structural dynamics problems. Struct. Eng. Mech. 2012, 43, 1–13. [Google Scholar] [CrossRef]
- Kerschen, G.; Golinval, J.; Vakakis, A.; Bergman, L. The method of proper orthogonal decomposition for dynamical characterization and order reduction of mechanical systems: An overview. Nonlinear Dyn. 2005, 41, 147–169. [Google Scholar] [CrossRef]
- Cacciola, P.; Deodatis, G. A method for generating fully non-stationary and spectrum-compatible ground motion vector processes. Soil Dyn. Earthq. Eng. 2011, 31, 351–360. [Google Scholar] [CrossRef]
- Du, X.; Xu, Y.; Xia, H. Dynamic interaction of bridge–train system under non-uniform seismic ground motion. Earthq. Eng. Struct. Dyn. 2012, 41, 139–157. [Google Scholar] [CrossRef]
- Huang, G. Application of proper orthogonal decomposition in fast fourier transform-assisted multivariate nonstationary process simulation. J. Eng. Mech. 2015, 141, 04015015. [Google Scholar] [CrossRef]
- Li, Y.; Togbenou, K.; Xiang, H.; Chen, N. Simulation of non-stationary wind velocity field on bridges based on Taylor series. J. Wind. Eng. Ind. Aerodyn. 2017, 169, 117–127. [Google Scholar] [CrossRef]
- Zhao, N.; Huang, G. Fast simulation of multivariate nonstationary process and its application to extreme winds. J. Wind. Eng. Ind. Aerodyn. 2017, 170, 118–127. [Google Scholar] [CrossRef]
- Wang, H.; Xu, Z.; Feng, D.; Tao, T. Non-stationary turbulent wind field simulation of bridge deck using non-negative matrix factorization. J. Wind. Eng. Ind. Aerodyn. 2019, 188, 235–246. [Google Scholar] [CrossRef]
- Deodatis, G. Non-stationary stochastic vector processes: Seismic ground motion applications. Probabilistic Eng. Mech. 1996, 11, 149–167. [Google Scholar] [CrossRef]
- Dong, L.; Liao, M.; Yang, S. Filtering modification of vibration signal integration algorism. Mach. Des. Manuf. 2010, 1, 46–48. [Google Scholar]
- Gu, M.; Lv, Z. Identification of a mechanism’s vibration velocity and displacement based on the acceleration measurement. Mech. Sci. Technol. Aerosp. 2011, 30, 522–526. [Google Scholar]
- Liang, R.; Wang, H.; Li, J.; Gao, H.; Zheng, W.; Xu, Z. Multiple tuned inerter-based dampers for seismic response mitigation of continuous girder bridges. Soil Dyn. Earthq. Eng. 2021, 151, 106954. [Google Scholar] [CrossRef]
- Crespi, P.; Zucca, M.; Valente, M.; Longarini, N. Influence of corrosion effects on the seismic capacity of existing RC bridges. Eng. Fail. Anal. 2022, 140, 106546. [Google Scholar] [CrossRef]
- Berto, L.; Vitaliani, R.; Saetta, A.; Simioni, P. Seismic assessment of existing RC structures affected by degradation phenomena. Struct. Saf. 2009, 31, 284–297. [Google Scholar] [CrossRef]
- An, L.; Li, D.; Yu, P.; Yuan, P. Numerical analysis of dynamic response of vehicle-bridge coupled system on long-span continuous girder bridge. Theor. Appl. Mech. Lett. 2016, 6, 186–194. [Google Scholar] [CrossRef][Green Version]
- Hu, L.; Xu, Y.; Huang, W. Typhoon-induced non-stationary buffeting response of long-span bridges in complex terrain. Eng. Struct. 2013, 57, 406–415. [Google Scholar] [CrossRef]
Publisher’s Note: MDPI stays neutral with regard to jurisdictional claims in published maps and institutional affiliations. |
© 2022 by the authors. Licensee MDPI, Basel, Switzerland. This article is an open access article distributed under the terms and conditions of the Creative Commons Attribution (CC BY) license (https://creativecommons.org/licenses/by/4.0/).