Abstract
Several performance metrics to measure the effectiveness of manufacturing equipment have been studied, and one of the most used is overall equipment effectiveness (OEE). However, its application and development in the road transportation sector remains little studied. The purpose of this paper is to establish a new metric derived from OEE to measure the overall effectiveness of coal mining transportation and apply this metric to actual operation. This study employed in-depth interviews and Delphi techniques to explore the specific metrics. Three rounds of Delphi involving mining experts, academia, and consultants identified six potential metrics to measure coal mining transportation operations that contributed to a new metric to measure mining transportation overall vehicle effectiveness. This paper also discusses a case study of how this newly developed metric was tested and applied to the actual operation of the truck fleet at a coal-hauling company in Indonesia. According to the case study, this metric accommodated the important factors in coal mining transportation operations and reflected operational performance. This study contributes to measuring the effectiveness of coal-hauling transportation by providing an effective metric that will help the managerial team make better decisions for process improvement.
1. Introduction
The quest to improve productivity in today’s competitive global environment has led to a need for rigorously defined performance measurement systems for production processes that indicate production losses and areas of process improvement. This situation requires additional well-defined performance metrics that consider three important factors: equipment availability, performance, and quality. Performance measures can be obtained through a combination of various operation measurements. To measure the overall operation metric, Overall equipment equipment effectiveness (OEE) as a key performance indicator (KPI) was introduced by Nakajima and applied to measure equipment productivity [1,2,3,4]. OEE is increasingly used in the industry as an indicator and driver for controlling and monitoring equipment performance, as well as an indicator and driver for process and performance improvement. The relationship between availability, performance, and quality established in OEE is key to its usefulness and has come to be used as a metric in business decision-making processes [5,6]. The main advantage of OEE over other KPIs is in combining three separate elements into a single number that is perceived as an overall performance indicator. This indicator is useful because it consolidates overall operation metrics and is simple and clear in facilitating the identification of areas of potential improvement.
OEE research is prevalent in a variety of manufacturing sectors such as aerospace, automotive, and paper, and is used to measure mining equipment effectiveness [7,8,9,10]. The articles contain scientific and practical content regarding the OEE concept, but implementation in the mining transportation context has been little addressed. We studied the article on the OEE concept applied to mining equipment; however, this concept used traditional OEE [7]. Problems occurred when traditional OEE was used in the mining environment, because some elements, such as quality rate, were designed for the manufacturing environment. This element must be modified to meet the unique nature of mining. It is also important to find and use the appropriate tools to measure the effectiveness of transportation processes and to eliminate those processes that do not add value [11]. OEE has therefore been developed as an effective measurement indicator in the road transportation sector [12,13,14,15]. However, these concepts do not apply to mining transportation since they were developed for urban freight transportation applications. The factors that build the indicators do not represent the mining transportation process, since they use on-time delivery, clients not served, excess distance, product defect, faulty delivery, traffic jams, etc., as transportation losses. These kinds of losses are designed for urban cargo transportation, not for mining. Urban freight transportation has multiple destinations, carries various goods, serves various customers, and has a more predictable working environment. Cargo transport is focused on service level.
Mining transportation has unique characteristics since it exists in a physically challenging environment, an inherently variable working environment that is impacted by weather and widespread mining locations [16,17]. Trucks transport coal only in bulk to a specific destination. The most critical challenges for mining equipment are utilization, productivity, and operation safety. Therefore, the objective of this paper is to (1) establish a new metric to measure the overall effectiveness of coal mining transportation; (2) validate the proposed metric; and (3) apply this metric to the coal-hauling fleet transporting coal from pit to port in a coal-mining project in Indonesia. To achieve this goal, a new metric will be developed using a mixed method approach with a three-round Delphi study to propose a new consolidated metric quantifying the effectiveness of the coal transportation process, and then apply it to measure the effectiveness of the coal-hauling process. The proposed metric is called mining transportation overall vehicle effectiveness (MTOVE) and is derived from OEE as a key performance indicator to measure the availability, performance, and quality of the transportation process.
The novelty of this research is the development of a new metric derived from OEE to measure the effectiveness of the coal transportation process by translating the principles of OEE to measure the effectiveness of the coal-hauling process. This research was conducted in one of the coal-hauling contractor companies in Indonesia. An aspect that motivated the application of this new metric was to combine several elements into a single metric, enabling the managerial team to monitor and evaluate the effectiveness of the overall hauling operation performance. In addition, the metrics identified transportation losses in the process and provided information for continuous improvement.
2. Literature Review
2.1. Overall Equipment Effectiveness Overview
A significant amount of literature has been published in recent years concerning the definition of OEE and its application [18,19,20,21]. Nowadays, OEE is widely used to analyze not only the effectiveness of individual equipment but also for integrated equipment systems [22]. OEE helps management recover hidden capacity, reduce production losses, and identify additional capital investment needs [23]. OEE measurement can be applied at several different levels, and the initial OEE measurement can be compared with future OEE values, thereby quantifying the level of improvement achieved [15]. The main advantage of OEE over other performance metrics is that it combines the three individual components into a single numeric value and can be viewed as a measure of overall equipment performance [24]. This metric measures the performance of operations by the availability, performance, and quality of individual equipment. OEE is the result of the multiplication of these three parameters in a percentage [2,19,25,26]. The availability component measures the downtime losses due to breakdown, setup, and adjustment, indicating the ratio of actual operating time to planned available time. The performance component measures speed losses due to minor stoppages and reduced speed as metrics of production speed, and is the ratio of the production speed of equipment to the planned speed. Finally, the quality component measures quality losses due to process defects and represents the ratio of quality-related production losses to actual production [27]. The OEE value range has been discussed by several authors who concluded that it would be difficult to establish an optimum OEE figure for reference, since every industry has its norms depending on the application and situation [23]. However, some studies have found that the OEE benchmark value of 85% is considered world-class performance [26,28,29].
2.2. Overall Equipment Effectiveness Evolution
OEE is an effective management metric that is applied across industries and has gained importance, becoming one of the most important metrics in today’s industry [25]. Along with monitoring production performances, it can be used as a metric for process improvement activities [27,30]. Because of industry needs, OEE has been modified, and the original OEE metric was extended to fit a broader perspective [1,4,31,32,33]. Some researchers have developed and modified OEE to fit their specific requirements. KPIs based on OEE have been discussed, and some authors have proposed performance measurement based on OEE with different names and terms [6,34]. The concepts of overall input equipment efficiency (OIE) and total equipment efficiency (TEE) were introduced [35]. The OEE concept has been modified as integrated equipment effectiveness (IEE) to meet the essential requirements of capital-intensive industries such as steel, petroleum, and chemical companies [36]. IEE provides a complete picture of performance based on workload, capital, and market characteristics. A metric was introduced to estimate overall resource efficiency (ORE) by integrating factors such as availability, changeover efficiency, material availability, and manpower availability [37]. Global process efficiency (GPE) was designed to evaluate the performance of a process based on equipment availability, production speed, quality level, and ability to meet predetermined production plans [34]. To quantify the efficiency of logistical processes, a new metric called overall process efficiency (OPE) was developed and applied in the logistics sector to reveal the hidden losses with the greatest impact on the truck-unloading process [19]. In the mining context, OEE was used to measure the effectiveness of mining equipment such as draglines, shovels, underground borer, pillars, and trucks [7,8,9,10,38]. OEE applications in road transport improvement have also been introduced to evaluate the performance of urban freight transportation utilizing OEE [31,39,40].
2.3. OEE Development in Transportation Context
An indicator of road transportation effectiveness and productivity was introduced called overall vehicle effectiveness (OVE) [12]. OVE measures the overall effectiveness index related to the transportation process (vehicle effectiveness) using OEE principles. There are five inherent transport losses or wastes identified in OVE: driver breaks, excess load time, fill loss, speed loss, and quality delay [12]. Losses that affect the availability, performance, and quality rate in transportation compared to losses in traditional OEE are described in Table 1. The OVE calculation method measures the availability, performance, and quality of the transportation process based on the above five losses. According to the OVE calculation methodology, activities of the transportation process are divided into those with added value and those without added value for the end customer. Original OVE did not consider energy efficiency when making the transportation route selection, where OVE calculation methodologies assign higher OVE values to less energy-efficient routes when delivery or collection takes place to/from a significant number of destinations (multiple points). This issue was identified for multiple drop-offs or collections. To solve it, a new component was added to the OVE that measures the route effectiveness. Thus, OVE assumed a new shape and name to become modified overall vehicle effectiveness (MOVE) [13].

Table 1.
OEE traditional losses and transportation losses.
Another specific metric to measure the overall efficiency of the transport process has been introduced. To maximize the availability utilization of company fleet vehicles, it was recommended to calculate the OVE metric based on full calendar time [14]. The lower the availability utilization, the higher the cost of the transportation process. Thus, the calculation of the OVE metric based on total calendar hours consequently led to creating transportation overall vehicle effectiveness (TOVE). The TOVE methodology considers several new losses related to vehicle availability, time, preventive and unscheduled maintenance, breakdowns, excessive delays due to customers, and quality of service [26]. The efficiency of transport processes in the TOVE metric is obtained by multiplying the administrative availability, operational availability, performance, and quality rates [26].
A new metric to measure vehicle fleet energy efficiency was introduced that represents another transport process effectiveness metric [15]. This metric takes energy efficiency into account. Energy efficiency is the level of energy consumed in transportation operations. The energy efficiency of a transport process is the ratio of transport volume to vehicle fleet energy efficiency consumption, expressed in ton-kilometers per kilowatt hours. The vehicle fleet effectiveness metric is called OVE Human and combines several components, including the availability utilization rates of vehicle and driver, the performance of vehicle and driver, and the transport process quality including fleet energy efficiency and quality of supply services [15].
Based on the literature review for TOVE, we found eight potential metrics as described in Table 2. We used this specific literature since it discussed the metrics related to overall vehicle effectiveness in the road transportation context.
Table 2.
Type of Transportation Overall Vehicle Effectiveness metric found in the selected publications.
The OEE application in the mining industry differs from that in the manufacturing industry because the physical environment in which mining equipment operates is less than ideal [8]. Some challenges in the mining industry have been described: a physically challenging environment, an inherently variable environment, geographically spread output teams, inherently variable raw materials, and remote locations [16]. The dynamic nature of mining operations introduces a high degree of uncertainty into various unit operations, and mining is also a volatile and risky work environment [17]. These factors can significantly affect equipment utilization [7].
3. Methodology
This research employed a mixed-method approach comprising both qualitative and quantitative methods. As a qualitative method to identify potential metrics, we employed in-depth interviews followed by three rounds of Delphi surveys. An in-depth interview is a qualitative research technique that involves individual interviews with a small number of respondents to explore their opinions on a particular idea [42]. The Delphi technique is a method for consensus-building using a series of questionnaires with multiple iterations to collect data from a selected panel [43]. The second method employed a quantitative method by testing the new metric in actual coal-hauling operations. The new metric was tested in an actual coal-hauling operation, and data were collected for three months to utilize the metric to measure and analyze the effectiveness of the coal transportation process. We proposed a methodology based on the approach in Figure 1. The main steps in our approach included identifying the potential metrics through a literature review and conducting an in-depth interview (step 1), obtaining the potential metric (step 2), designing the questionnaire (step 3), conducting the Delphi survey (step 4), obtaining the final metric (step 5), constructing the proposed framework (step 6), implementing the metrics in actual coal-hauling operation (step 7), analyzing the data and summarizing the result (step 8).
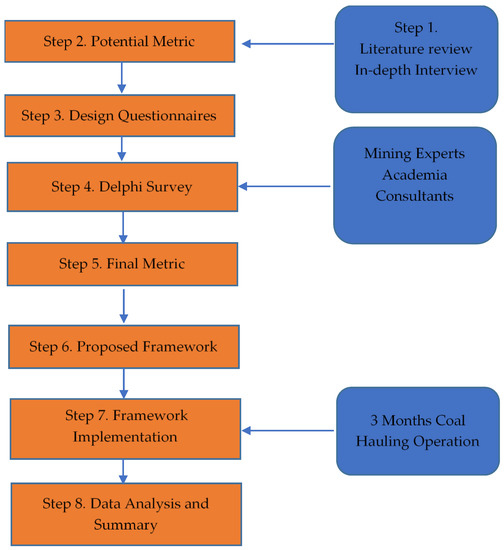
Figure 1.
Methodology of the study.
This study aimed to answer these research questions (RQ):
- RQ1. What are the suitable metrics to measure overall mining transportation effectiveness?
- RQ2. How can the selected metrics be applied to measure mining transportation effectiveness?
3.1. Identification of Potential Metrics for Mining Transportation Overall Vehicle Effectiveness
We combined a literature review and in-depth interviews to explore potential metrics to measure mining transportation effectiveness, followed by a three-round online Delphi technique to establish consensus [42,43]. To collect information and expert opinion, we employed an in-depth interview process [43]. Before undertaking the Delphi study, steps were taken to ensure that the sources of information for this study were representative. This was achieved by identifying the expert participants for the in-depth interview process and Delphi study. Five experts for the in-depth interview process were identified. Selected mining experts were required to have at least ten years of work experience in coal-hauling operations. The participants are sometimes referred to as expert or panel in this paper.
Before conducting an in-depth interview, we arranged a meeting with the selected expert to fine-tune the understanding of the interview topics and data from the interviewees. Each interview took approximately 30–45 min per expert. The interview participants consisted of five mining experts who worked in mining contractor companies. Three of the participants were representatives of the company where this research was conducted, and two were experts from other coal mining companies. The interviews took place virtually in a private room. A semi-structured interview was employed in this process, using open-ended questions on a one-to-one basis [44,45]. The interviews were audio-recorded and transcribed, with the participant’s consent. Expert profiles are described in Table 3. The potential metrics from the literature review were compiled with metrics from the in-depth interviews and used as input to develop the Delphi survey questionnaires.
Table 3.
Profiles of the mining experts.
3.2. Three-Round Delphi Questionnaire
After identifying the potential metrics from the literature review and in-depth interviews, a three-round online Delphi technique was employed to establish consensus [46]. The main objective of the three rounds was to reach a consensus by reducing variance in responses, and the second purpose was to improve precision [47]. During the Delphi study, participants were allowed to suggest additional statements that had not been included in the previous step. The participants were informed that there would be three rounds of questionnaires.
Survey participants were identified using purposive sampling [48]. The Delphi survey included selected mining experts, consultants, and lecturers. The participants were chosen from a pool of mining experts who were familiar with mining transportation as well as senior consultants and lecturers from reputable organizations. We invited all the mining experts who were involved in the prior in-depth interviews to take part in the Delphi survey. In addition, we invited eight additional mining experts to take part in the Delphi survey; fourteen participants were invited in total. We began the survey by circulating the questionnaire via electronic mail to all participants. Then we collected their responses and returned the questionnaire to them for other rounds. Feedback is an essential component of the Delphi procedure [49]. Key information from the preview survey was used to design the subsequent Delphi survey questions. In the later rounds, the participants were able to view the group’s responses. The data were stored on the computer with password protection and could only be accessed by the interviewer.
The Delphi survey participants are described in Table 4. Mining experts were required to have at least ten years of work experience in mining operations. The lecturer was required to have research or teaching experience in total productive maintenance (TPM) and overall equipment effectiveness (OEE) and be familiar with the coal mining industry. Consultants were required to have experience in implementing TPM and OEE and have experience in handling clients in the mining industry. Questionnaire preparation included pilot testing (pre-testing) of the questionnaire, which was conducted by an assessment group [50]. The pre-testing was aimed at checking instruction and question clarity, completion time, and question redundancy [51,52]. We used the feedback from the pilot test to modify, add, or delete ambiguous questions to improve the convergence of the questionnaire [53]. The questionnaire was sent to panel experts, but because of time limitations and the pandemic situation, the survey was conducted by email.
Table 4.
Profiles of panelists in the three rounds of the Delphi Survey.
The first-round questionnaire included three parts, and the first part collected generic information such as the company’s field of operation, position, and experts’ years of experience and email addresses. The second part presented all the potential metrics from the previous process (literature review and in-depth interview) according to the 5-point Likert scale of 1 (not agree) to 5 (extremely agree). We designed a survey questionnaire in which experts were asked to judge the level of significance of each metric. These questions aimed to enable the panel experts to give their opinion of the importance of each metric based on their understanding and experience. The third part was an open-ended question, where the participants were allowed to suggest additional statements about potential metrics that had not been included in the list. In the second and third rounds, additional questionnaires were created. Here, we proposed an overall metric that combined all potential metrics into a single metric called mining transportation overall vehicle effectiveness (MTOVE). We consolidated all potential metrics into a single metric (overall metric), and the formula of the proposed MTOVE is described in Equation (1). We designed a survey questionnaire in which participants were asked to express their judgment about the new MTOVE metric using a 5-point Likert scale.
3.3. Case Study Profile
The new metric was tested and applied to evaluate a coal hauling company that operated in a coal mining site in Central Kalimantan, Indonesia. The company works 24 h a day, divided into two working shifts: day shift and night shift. Each shift has a 60 min break for rest and a meal. The working schedule consists of a 7-day week, and there is an over shift every Friday to take 12 h off. Depending on the circumstances and management decisions, several workdays are not available to work on. Every day the hauling operation team receives the production plan information from the mining owner, where the loading point and stockpile location are mentioned. The loading process starts at the loading point (mining pit). The coal is loaded into the trucks using an excavator. The truck is a rigid truck type with a vessel capacity of 24.5–25.5 metric tons.
The process begins with the arrival of the truck at the loading point. An excavator loads the coal into the truck. Once the truck is fully loaded, the excavator operator gives a signal confirming that the truck is fully loaded and asks the truck to leave the loading point and travel to the port stockpile. The distance between the loading point and the port stockpile is around 30 km, with an allowable hauling speed maximum of 50 km/h. Before arriving at the port, the truck enters the weighbridge, receiving documents from the weighbridge operator that record truck weight information. Then, the driver enters the stockpile location where a port supervisor informs the driver and directs the truck to the dumping location for unloading. Once the truck is in the unloading position, the driver begins the process of unloading coal. The driver opens the tailgate of the truck and the hydraulic rams to lift the front vessel side, allowing the coal in the truck vessel to be dumped on the ground behind the truck. Once the unloading process is finished, the truck travels back to the loading point, and the coal is stored in the port stockpile.
Once the driver returns to the loading point, they record the following data on the timesheet: time of entry and problems encountered during the hauling process cycle, including breakdown, refueling, stoppage, rain, slippery road, etc. The coal-hauling process is described in Figure 2. At the end of the working shift the driver completes and signs the timesheet, and submits it to the group leader, who confirms the document. If there is a difference, the group leader takes note of it and notifies the driver to verify the discrepancy. All data related to hauling operations are uploaded and stored in the mining control center (MCC). Operation data were collected for three months. For data reliability, we took the data from MCC that had already been verified by the operation control team.
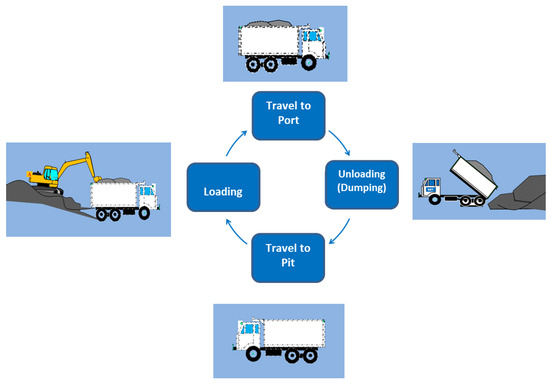
Figure 2.
Coal-hauling process.
4. Result and Discussion
This section summarizes the results of our analysis based on the methodology described in Section 3. The potential mining transportation effectiveness metrics identified after conducting the literature analysis and in-depth interviews are presented.
4.1. Potential Metrics from Literature and In-Depth Interview Result
We identified several potential metrics after combining the literature review and in-depth interview process. Potential metrics obtained from the literature review are described in Table 2. There were several potential metrics obtained from the in-depth interview process: physical availability, use of availability, fuel consumption, hauling distance, productivity, truck capacity, coal losses, and mean time to repair (MTTR), etc. From the literature review and in-depth interview result, there were two similar metrics: truck availability and truck utilization. Both of them represented the time the truck was in operation. Time utilization is important since the truck is an expensive asset. The content analysis method was carried out following the coding process by determining the most consistent and frequently used metrics [8,9]. Once the text was coded, the codes were then further categorized and combined with relation analysis to summarize the data. After conducting a content analysis, we identified the nine potential metrics described in Table 5, which were the most consistent and frequently used metrics for measuring mining transportation overall vehicle effectiveness based on the literature review, combined with the in-depth interview results. For the next step, we initially used the metrics in Table 5 to develop the Delphi questionnaire.
Table 5.
Potential metrics from the literature review and in-depth interview result.
4.2. Three-Round Delphi Study Result
In the first round of the Delphi survey, the respondents were asked to give their perceptions of the importance of the metrics in Table 4 on a 5-point Likert scale. In the second and third rounds, respondents were provided with the summary results from the previous rounds and were asked to reconsider their opinion and adjust their original options if they wished. The first-round Delphi questionnaire was sent to 14 panel members by email. After two weeks we collected and analyzed the results of the first round, and the results are described in Table 6.
Table 6.
Result of Delphi’s first round.
To analyze the data, we employed the content validity ratio method (CVR-Lawshe’s method) [54]. The CVR is a validity test to evaluate the level of agreement among several experts by considering the essential level based on an expert agreement where the minimum CVR value is 50% [55]. The CVR value was calculated using Excel. The results of the CVR method analysis included three metrics where the CVR value was below 50%, namely, hauling distance with a CVR value of 43%, truck capacity with a CVR value of 43%, and mean time to repair (MTTR) with a CVR of 36%. These three metrics were excluded in the next Delphi round. The reliability test was conducted to evaluate the consistency and reliability of the selected potential metrics using Cronbach’s alpha test. An internal consistency test was used to determine whether these metrics could be used as a measurement tool based on a minimum value of 0.7 [51]. Cronbach’s alpha (α) was calculated using IBM SPSS version 26 software, and the α value result was 0.721. With a Cronbach’s alpha of 0.721, the potential metrics could be used for the next questionnaire. There were six potential metrics from the first Delphi round: physical availability, use of availability, productivity, fuel efficiency, coal losses, and quality of service.
Second- and third-round questionnaires were prepared based on input from the first round, including a newly proposed metric; these enabled respondents to give their opinion about the newly proposed metric. This new metric was constructed based on the existing OEE approach. The basis for this grouping was the well-known, existing OEE metric; a researcher proposed the new metric MTOVE. MTOVE was constructed based on combining the elements of physical availability, use of availability, performance, and quality (see Equation (1)). The grouping of the proposed MTOVE metrics is described in Figure 3. As in the first round, the second- and third-round questionnaires were sent to the group of panel members by email. In the second and third rounds of Delphi, respondents were asked to give their opinion about the importance of the six selected potential metrics in the previous round. Respondents were asked to give scores based on a 5-point Likert scale. In addition, there were questions to determine respondents’ opinions on the new overall metric to measure overall transportation effectiveness by combining all metrics (MTOVE) based on a 5-point Likert scale. This purpose was to validate the proposed MTOVE.
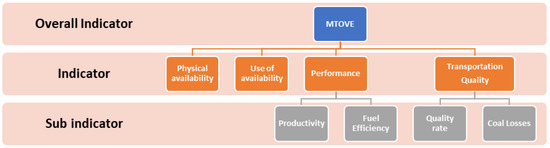
Figure 3.
Proposed Mining Transportation Overall Vehicle Effectiveness (MTOVE) framework.
This grouping hierarchy was then included in the second and third rounds of Delphi questionnaires to obtain respondents’ opinions based on 5-point Likert scales. In addition to opinions, a comment column was provided, allowing respondents to provide comments and other suggestions related to this proposal. Second-round questionnaires were sent to 14 respondents, who were asked to complete them within two weeks. However, only 12 experts participated in this round, with a return rate of 86%. Two participants could not participate was because of a time conflict. The results of the second round of questionnaires were analyzed using statistical tests to determine the convergence of the respondents’ answers. The statistical test used was the Kendall Concordance coefficient (W coefficient) employing IBM SPSS version 26 software [56]. The significance level was set as p-value = 0.000, and this value was used to evaluate the level of convergence of respondents’ answers [57]. The value of the concordance coefficient (W) was between 0 and 1; the value of 0 indicated no agreement and 1 indicated that all respondents’ answers were identical or in perfect agreement. The concordance coefficient test showed a p-value of 0.000, which indicates that the respondents’ answers converged. Kendall’s W value for the second round of questionnaires was 0.542, indicating strong agreement among respondents [57].
In the third round, total questionnaires were sent to 14 respondents, and only 12 respondents participated, giving a return rate of 86% as in the second round of surveys. Two did not complete it because they were busy with work and did not have time to participate in the questionnaire. A statistical convergence test using IBM SPSS version 26 was performed to determine the concordance coefficient value. Kendall’s W value was 0.688 with a p-value of 0.000. The statistical test indicated that the opinions of the respondents on the metric converged (strong convergence) because the Kendall W value above 0.6 indicated a strong convergence [57]. The statistical analysis of the third round of the Delphi survey indicated that all six potential metrics were valid as metrics to measure the effectiveness of coal transportation. The statistical analysis of three rounds of Delphi is described in Table 7. From the three-round Delphi study, we can conclude that the selected metrics in Table 6 are valid and can be used as coal mining transportation metrics. Based on the three three-round Delphi survey we established physical availability, use of availability, productivity, fuel efficiency, coal losses, and quality of service as the final metrics.
Table 7.
Delphi results for the second and third rounds.
4.3. Construction of the Proposed Mining Transportation Overall Vehicle Effectiveness (MTOVE)
The proposed MTOVE formula was constructed based on the OEE concept, which combined the overall metrics into a single metric. This formula was also adapted from the TOVE and OVE Human concepts [14,15]. We adopted TOVE since it considered the relevant performance measures in transport operations. TOVE used total calendar time in the truck availability calculation to maximize its utilization. This is relevant in the mining environment, where the equipment availability is based on total calendar time and trucks must be utilized as often as possible. The OVE Human concept was also adapted, and we made a necessary modification to apply it to coal-hauling circumstances. OVE Human considered vehicle fleet energy, which refers to the energy consumed during the transportation process. MTOVE used fuel consumption as a new factor to measure the effectiveness of fuel consumption in terms of total fuel consumed divided by coal volume transported and mileage distance (L/ton km). Hauling contractors must control and monitor fuel consumption effectively since fuel is an important element in transportation cost. Modifications needed to be made to ensure its applicability in the coal mining transportation application.
TOVE considered quality ratio as the percentage of service to customers, which is unmet demand and product defects during transportation. OVE Human also considered the quality rate, which is determined based on the number of service complaints, the number of delays, the number of damaged deliveries, and faulty deliveries. It also considered the number of driver violations related to traffic and transportation regulations. The quality ratio in MTOVE represents the number of trip failures due to internal causes, such as when trucks experience a breakdown or incident during the hauling process and coal is not delivered into port; subsequently, coal will be transferred to another truck. Truck accidents during the hauling process are also considered a trip failure.
The proposed formula to calculate MTOVE is constructed as follows in Equation (1). To establish this formula, several metrics were combined: physical availability, use of availability, performance, and transportation quality. Physical availability represents the truck availability and use of availability represents the level of truck utilization, and performance represents truck productivity and the fuel consumption rate during the hauling process. Moreover, transportation quality represents transportation quality rate and coal loss during the hauling process. Safety, which is a crucial factor in mining, was also included in the quality rate calculation, which is the ability of the truck driver to operate without accident during the hauling process.
The physical availability (PA) measures the total time the equipment is available after subtracting time losses due to equipment failure or routine maintenance. The resources that affect the PA are truck breakdown and truck maintenance time. The total available time in a day is based on 24 h when the truck is scheduled to work for the entire day. If there is no breakdown, then the truck is ready to use for an entire day.
The use of availability (UA) measures the real total time the system is operating without equipment idle. Internal and external factors affect the UA. Internal factors are situations that occur within the company and are managed and controlled by the organization internally. An internal factor that affects the UA is a waiting driver, waiting for instruction, and refueling. External factors originate outside the company, such as rain and road slipperiness. For example, in rainy situations the operation must be stopped because of safety considerations. These situations count as idle time and will affect the UA ratio.
Performance measures the overall performance, which is a combination of the hauling process productivity and the fuel consumption performance during the hauling process. Productivity measures the ratio of the ideal volume transported per hour based on the ideal hauling cycle time and the actual volume transported per hour based on the actual hauling cycle time described in Equation (7). Productivity is described as the ratio of total volume output and total time consumed. The total time consumed represents the operation time in Equation (5). Productivity is affected by losses that slow down the total hauling cycle time, such as waiting for loading and speed reduction. Ideal transported volume is based on truck capacity, which is 25 metric tons. Transported volume per hour is affected by truck capacity and cycle time and cycle time is affected by hauling distance. In this case study, the hauling speed assumption was about 50 km per hour. Fuel performance is the ratio of the ideal fuel consumption rate and the actual fuel consumption rate during the hauling process. Losses that affected fuel consumption rate are loading time, road grade, and road quality.
The transportation quality measures the number of trips completed with the coal delivered satisfactorily without delay and spillage during transportation. It is the combination of quality rate and coal loss due to spillage. Quality rate measures the total number of failed trips because of accidents or major breakdowns during the hauling process, causing the truck not to arrive in the port stockpile. When this situation happens, the coal must be transferred to another truck or change vehicle. Process transferring requires time and effort to rehandle the coal, and we count it as a failed trip. Coal losses are affected by coal spills during transportation. These losses can happen when the truck tailgate is broken, causing coal spillage. When the truck has accident, the coal must be transferred to another truck, and since there is a rehandling process, there will be loss during the transferring process.
4.4. Delphi Result for Proposed MTOVE
The proposed MTOVE metric and formula were included in the second- and third-round questionnaires. The purpose was to ask the panel members for their expert opinion. The participants were asked their opinions on the importance of the MTOVE metric through 5-point Likert scales. To analyze between-round Delphi results for the proposed MTOVE we employed Cohen’s kappa (κ) statistic using IBM SPSS version 26 software. Cohen’s kappa (κ) is often used to assess agreement of nominal data as a measure of inter-rater agreement or reliability [58]. The results in Table 8 show a kappa value of 0.75, and good agreement is indicated when the value is between 0.61 and 0.80. This demonstrated that respondents agreed to use the MTOVE formula to measure overall effectiveness.
Table 8.
Delphi result for proposed MTOVE.
4.5. Results of the MTOVE Implementation
This section describes how MTOVE is applied and measured. The research results are based on the actual case study in a coal-hauling operation utilizing a 12-truck fleet, then the data were collected from the process to be analyzed. The time spent on the data collection was three months. The MTOVE metric for the truck fleet was calculated on a daily basis and each factor was studied separately. Each factor was calculated with the equations in Section 4.3. Figure 4 shows the average rate of all factors per week for the 12-week period for all unit trucks.
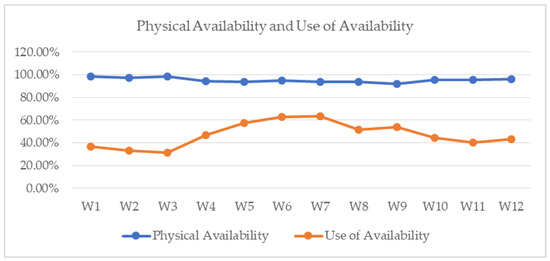
Figure 4.
Average physical availability (PA) and use of availability (UA) rates.
The average rates of physical availability and use of availability (UA) are described in Figure 4. The PA average value over a three-month period was 95%. This indicated that the trucks were in good condition since the total down-time was only 5% for all trucks. These PA values were still above the OEE availability benchmark value of 90% [28]. This was an achievement owing to the implementation of a basic total productive maintenance (TPM) program. However, the average rate of use availability indicated that the UA average value for the three-month period was 47%. The lowest UA was found in the first three weeks. Losses in these weeks occurred because of rain, which was an external factor and uncontrollable. However, from the fourth to the seventh week, the UA value increased because of less idle time as weather conditions were much better than in the first three weeks. UA increased because of less idle time, thus increasing operation time, which meant more time for hauling operations and higher truck utilization. The UA results indicated that the greatest loss of time was due to the idle time of the trucks. After further in-depth analysis, we detected that most of the idle time was attributed to rain and slippery roads, since the hauling road was built from original soil that does not resist water during the rainy season. Some of the losses were also due to the absence of a driver, idling the truck. Most of the time, trucks became idle because of weather conditions.
The average rate of performance as a combination of productivity and fuel consumption rate is described in Figure 5. This showed that the performance average value for the three-month period was 54%. This value was far below the OEE performance benchmark value of 95% [28]. Performance consisted of productivity and fuel performance, as shown in Figure 5. The average fuel consumption rate was 99%. The fuel performance factor average of 99% was very close to the desired value of 100%, and there were no significant losses for fuel performance. The productivity average value was 54%, which affected overall performance. Further investigation indicated that losses dragged down productivity because of nonproductive time during operation time. Productivity losses occurred because of waiting queues when the operation began since 12 fleet trucks started at the same time in the same loading point. Loading time for one truck was about 7–8 min, and the last truck had a waiting time of 77–88 min. The second problem was excess hauling cycle time because of road conditions. Bad hauling-road-condition quality increased hauling cycle time. Excess cycle time also occurred after rain; because of the conditions; some parts of the hauling road were still not completely dry after rain, which impacted truck speed. The fuel performance on certain occasions provided values above 100% because of variations in hauling cycle time and travel speed.
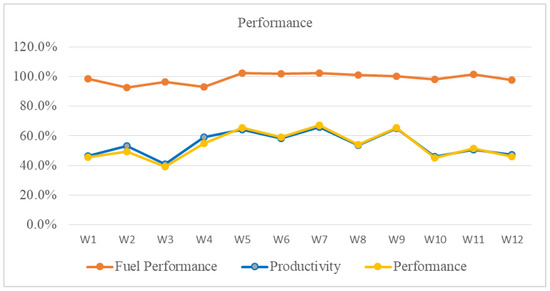
Figure 5.
Performance rate (PR).
The average rate of transportation quality as a combination of quality of service and coal losses is described in Figure 6. The average transportation quality rate was 100%, which was still above the OEE quality benchmark of 99.9% [28]. This indicated that the company was still able to achieve service quality and minimum coal losses. The quality of service and coal loss factors were very close to the desired value. Both values during the three-month periods were 100%, supported by several trip failures and zero accidents. Zero trip failures due to a major breakdown indicated that truck maintenance activities were well performed after the company implemented total productive maintenance practices. Zero accidents also indicated that the safety performance was good, since the control and safety monitoring are very tight in mining operations.
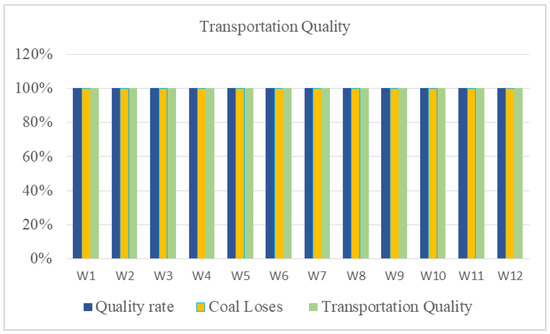
Figure 6.
Transportation quality rate.
Figure 7 shows the average MTOVE calculation result (physical availability use of availability performance efficiency transportation quality) for the three-month period. Values between 12% and 40% were presented with an average of 25%. Maximum MTOVE value appeared during the fourth to seventh week, and this trend was very similar to the trend value of UA. The UA value was also at maximum during the fourth to seventh week, as shown in Figure 4. This indicated that UA affected the MTOVE result. It was also confirmed by the trend graph in Figure 7, where the trends of MTOVE and all factors are combined in one graph. Figure 7 presents a trend-line comparison between the MTOVE and all factors combined. The factors with the lowest averages that affected overall vehicle performances were UA and PR. These two factors were the most influential in decreasing the final MTOVE result. Figure 7 shows the trend line of UA as similar to the trend line of MTOVE; when UA increased, then MTOVE increased, and when UA decreased, then MTOVE decreased. The graph shows that the fluctuation of UA resulted in the fluctuation of MTOVE; this indicated that in this case study UA had an impact on MTOVE. It can be highlighted how the UA factor decreased the performance of the coal mining transportation process.
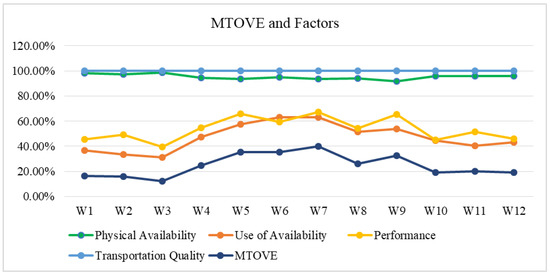
Figure 7.
Average MTOVE results.
This MTOVE metric laid the foundation for the company to digitize its processes as part of a continuous improvement cycle. MTOVE and all factors contributed to data digitization to encourage faster and more transparent results and a faster decision-making process. The continuous improvement action was fed by information from the metric to eliminate non-added-value activities from the mining process. Through MTOVE we proposed that it was possible to record operational data and measure the process from obtained data for further analysis. MTOVE will help the management team in data-driven decision making and foster improvement for better performance. In addition, MTOVE allows the identification of losses to generate continuous improvement to eliminate the losses that occur in the hauling processes. This research provides a practical contribution to the company that will improve the hauling process with MTOVE implementation. This concept can be applied to measure the performance of the other mining projects within the company and to evaluate the performance of each project by using it as an overall metric for performance comparison.
After conducting three months of testing in actual coal-hauling operations, we can provide answers to both initial research questions. MTOVE was able to measure the overall mining transportation effectiveness by consolidating six metrics that were validated through a three-round Delphi survey among experts. This study has demonstrated how selected metrics and the proposed MTOVE metric can measure the effectiveness of the coal-hauling process. The results explained the categorized element with six selected metrics of the MTOVE and their influence on the hauling process. This research provided solutions related to the hauling process measurement and structured data documentation. It was possible to record and organize the operational data to calculate the performance metric. Through the participation of the researchers and experts during the study, the new metric derived from OEE could be measured and validated. This research identified several opportunities for improvement that are explained in the sections on theoretical and practical contributions.
4.6. Theoretical Contribution
Figure 8 represents the comparison between the OEE and MTOVE over the three-month operation period. It shows the weekly average OEE calculation (availability performance quality) versus MTOVE (physical availability use of availability performance transportation quality) for three months. The graph illustrates that the weekly average OEE value was much higher than the MTOVE value obtained. Specifically, there were contrasting values for OEE and MTOVE; OEE obtained an average value of 54% and MTOVE obtained an average value of 25%. This happened because MTOVE accommodated truck utilization, which has a large impact on overall effectiveness results. However, the original OEE does not consider truck utilization. This UA was one of the factors that distinguished between the original OEE and the MTOVE concept.
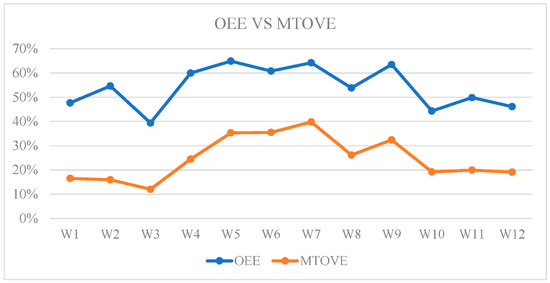
Figure 8.
Weekly average of OEE vs. MTOVE.
Measuring the effectiveness of coal transportation with the original OEE resulted in a gap with MTOVE. Notably, the use of availability affected the MTOVE value very much. The truck utilization measured by UA affected MTOVE and was not considered in the original OEE. Several studies have customized OEE to fit their industrial requirements. This research makes a strong theoretical contribution. The first contribution is the adaptation of the OEE metric to the mining domain, in this case to the coal-hauling process. The modification contributed to the identification of the six MTOVE metrics (physical availability, use of availability, productivity, fuel performance, coal losses, and quality of service). It was possible to measure all-important factors in hauling operations in one single index. The productivity performance allowed us to calculate the ratio of the actual productivity of the hauling process vs. the standard productivity. Fuel performance allowed us to calculate the ratio of the actual fuel consumption of the hauling process vs. the standard fuel consumption. With the coal losses factor, we can identify coal losses during coal transportation.
Finally, by measuring the transportation failure factor, we identified the number of trucks that failed to arrive at the stockpile. A deeper analysis will allow us to determine the detailed reason for the transport failure, whether because of a truck breakdown or truck accident. These measure the service level to the mining owner. The second theoretical contribution is increasing the scientific knowledge on metric development in the mining transportation sector through the Delphi study. Data collection and analysis were accomplished by the active participation of the researchers and the involvement of the mining experts and company management team in the implementation of the actual case. It closed the gap between theory and practice.
4.7. Practical Contributions
This new metric for measuring overall vehicle effectiveness provided a performance breakdown of all MTOVE factors during the hauling process, as described in Figure 9. It was possible to identify the factors that affected the overall performance; some of them were attributed to controllable factors, but others were noted to be uncontrollable by the company because of environmental conditions such as rain and slippery roads. After viewing this result and assessing the benefits, management decided to make MTOVE one of the performance measurement metrics of the company. This metric was adopted by the company and used to evaluate performance in a weekly operation review meeting. Several improvements were identified at the organizational level, starting with information from the use of utilization data (UA); the company decided to improve road maintenance quality to improve the UA. Improving road maintenance will lead to cycle time improvement, thus impacting productivity and, in the end, increasing the MTOVE score.
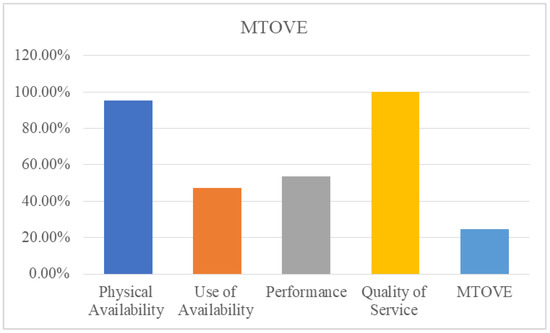
Figure 9.
MTOVE three-month period.
The MTOVE building structure allows the company to create a culture of data-driven management. After several meetings with the management team, we defined the ideal MTOVE range for the company in the hauling process as between 40% and 45% by considering the average MTOVE weekly score. We want to highlight that this range recognizes that MTOVE results are influenced by controllable and uncontrollable factors. Some factors were not directly controlled by the company because of environmental impact and could not be compared with the OEE ranges obtained in production. Several studies in manufacturing plants estimated the benchmark value as an average of 85% [26,28,29]. Studies of OEE in manufacturing plants estimated an average value between 30% and 80% [59]. Preview studies on TOVE application in the road transportation sector set the value at 48% [14]. We believe that this proposed MTOVE can be replicated in other companies that perform hauling services in the mining domain. This study can also be a baseline for current Industry 4.0 applications in the coal mining transportation process, which allow real-time data processing of information collected from the mining operations and subsequently evaluate its effectiveness [60,61,62]. MTOVE also establishes a chain of causality, hierarchical dependencies, and metrics of interest that can be analyzed from different perspectives to provide additional insights into mining transportation operations. This concept provides a tailored metric to be applied in mining transportation. Through MTOVE, mining industry data are significantly more accessible with the Internet of Things (IoT) [63]. MTOVE combined with the global positioning system (GPS) and other technologies will help to improve transportation effectiveness [64].
5. Conclusions
In this article, a new metric called MTOVE was introduced to measure the overall effectiveness of the coal-hauling process. Availability, performance, and quality factors were considered based on the original OEE. Availability was divided into two categories: physical availability and use of availability. Performance subfactors including productivity and fuel performance were also modified by considering productivity and fuel usage as important factors in mining. Productivity in the hauling operation was measured, which reflects cycle time and hauling volume. Fuel performance indicates the fuel usage during transportation and reflects the efficiency of fuel consumption during transportation as compared to hauling volume and distance. Modification of transportation quality subfactors included transportation failure and coal losses during transportation. This reflected the condition in the hauling process. Failure due to accidents and truck breakdowns during the hauling process was measured as they reflect the quality of service. Transportation failure due to breakdown is the internal measurement process of the truck condition during the transportation process, and accidents reflect transportation safety. Coal losses were also included because they may happen during the transportation process and are important points from the mining owner’s point of view. All these metrics represent the coal transportation process based on expert opinion through in-depth interviews and three rounds of the Delphi survey. Testing in actual coal transportation proved that MTOVE can be used to measure the overall effectiveness of coal transportation and to reveal operation losses, which leads to better decision making.
The new metric of MTOVE was introduced through scientific studies that included mining experts, lecturers, and consultants. The new metric was proposed, calculated, and analyzed. MTOVE was tested and used for real hauling operations, data from different sources were collected, and this study was conducted in collaboration with researchers and practitioners. The implementation results suggested that MTOVE was able to measure the overall effectiveness of the hauling process, as indicated by the MTOVE score. MTOVE can be calculated on the shift, weekly, or monthly basis that represents the overall performance. MTOVE can also be used as a tool to guide the management team in investigating a problem by conducting an in-depth analysis of each factor that drags down the MTOVE score. The in-depth analysis will lead the management team to find losses and make specific improvements to achieve better performance. This study has shown that the OEE concept can be used in the mining transportation domain.
The implementation results in the case study indicated that the lowest performance factors dragging down MTOVE value were use of availability and performance. Specifically, the performance rate was dragged down by low productivity. These indicated that losses impacting use of availability and productivity must be further analyzed and improved in order to improve MTOVE value. Further research can be undertaken on ways to improve the MTOVE value.
The authors have proposed a new MTOVE metric and described its contribution to the existing literature as a methodology allowing companies to measure the overall effectiveness of the coal-hauling process after adapting it to the mining operation environment. This new parameter includes truck availability, use of availability, performance, productivity, fuel consumption, and quality of service as well as trip failure and coal losses as criteria in business decision making. The study’s limitation is that it considered coal mining projects only. Testing in different mining projects such as gold mining, nickel, or other minerals is suggested and some details and factors that contribute to MTOVE effectiveness may not yet be included. Since the data collected from this study were numerous, we also suggest using the digitization concept combined with MTOVE in future studies.
Author Contributions
Data curation, S.W.H.; formal analysis, S.W.H.; writing—original draft preparation, S.W.H.; conceptualization, M.L.S. and R.O.S.G.; methodology, M.L.S. and R.O.S.G.; supervision, M.L.S. and R.O.S.G.; writing—review and editing, M.L.S. and R.O.S.G. All authors have read and agreed to the published version of the manuscript.
Funding
This research received no external funding.
Institutional Review Board Statement
Not applicable.
Informed Consent Statement
Not applicable.
Data Availability Statement
Not applicable.
Conflicts of Interest
The authors declare no conflict of interest.
References
- Muchiri, P.; Pintelon, L. Performance Measurement Using Overall Equipment Effectiveness (OEE): Literature Review and Practical Application Discussion. Int. J. Prod. Res. 2008, 46, 3517–3535. [Google Scholar] [CrossRef]
- Nakajima, S. Introduction to TPM (Total Productive Maintenance); Productivity Press: Portland, WA, USA, 1988. [Google Scholar]
- Chikwendu, O.C.; Chima, A.S.; Edith, M.C. The Optimization of Overall Equipment Effectiveness Factors in A Pharmaceutical Company. Heliyon 2020, 6, e03796. [Google Scholar] [CrossRef]
- del Carmen Ng Corrales, L.; Lambán, M.P.; Hernandez Korner, M.E.; Royo, J. Overall Equipment Effectiveness: Systematic Literature Review and Overview of Different Approaches. Appl. Sci. 2020, 10, 6469. [Google Scholar] [CrossRef]
- Tsarouhas, P.H. Evaluation of Overall Equipment Effectiveness in The Beverage Industry: A Case Study. Int. J. Prod. Res. 2013, 51, 515–523. [Google Scholar] [CrossRef]
- Domingo, R.; Aguado, S. Overall Environmental Equipment Effectiveness as a Metric of a Lean and Green Manufacturing System. Sustainability 2015, 7, 9031–9047. [Google Scholar] [CrossRef]
- Elevli, S.; Elevli, B. Performance measurement of mining equipments by utilizing OEE. Acta Montan. Slovaca 2010, 15, 95–101. [Google Scholar]
- Mohammadi, M.; Rai, P.; Gupta, S. Performance Evaluation of Bucket Based Excavating, Loading and Transport (BELT) Equipment-An OEE Approach. Arch. Min. Sci. 2017, 62, 105–120. [Google Scholar] [CrossRef]
- Dindarloo, S.R.; Siami-Irdemoosa, E.; Frimpong, S. Measuring the Effectiveness of Mining Shovels. Min. Eng. 2016, 68, 45–50. [Google Scholar] [CrossRef][Green Version]
- Norden, C.; Ismail, J. Defining a Representative Overall Equipment Effectiveness (OEE) Measurement for Underground Bord and Pillar Coal Mining. J. South Afr. Inst. Min. Metall. 2012, 112, 845–851. [Google Scholar]
- Burdzik, R.; Ciesla, M.; Sładkowski, A. Cargo Loading and Unloading Efficiency Analysis in Multimodal Transport. PrometTraffic Transp. 2014, 26, 323–331. [Google Scholar] [CrossRef]
- Simons, D.; Mason, R.; Gardner, B. Overall Vehicle Effectiveness Overall Vehicle Effectiveness. Int. J. Logistics Res. Appl. 2004, 7, 119–135. [Google Scholar] [CrossRef]
- San, G.T.; Mason, R.; Disney, S.M. MOVE: Modified Overall Vehicle Effectiveness. In Proceedings of the 8th International Symposium of Logistics, Seville, Spain, 6–8 July 2003; pp. 641–649. [Google Scholar]
- Villarreal, B. The Transportation Value Stream Map (TVSM). Eur. J. Ind. Eng. 2012, 6, 216–233. [Google Scholar] [CrossRef]
- Radosavljević, D.M.; Manojlović, A.V.; Medar, O.M.; Bojović, N.J. Vehicle Fleet Energy Efficiency Influence on Overall Vehicle Effectiveness. Therm. Sci. 2018, 22, 1537–1548. [Google Scholar] [CrossRef]
- Dunstan, K.; Lavin, B.; Sanford, R. The Application of Lean Manufacturing in a Mining Environment. In Proceedings of the International Mine Management Conference, Melbourne, Victoria, Australia, 16–18 October 2006; pp. 16–18. [Google Scholar]
- Wijaya, A.; Kumar, R.; Kumar, U. Implementing Lean Principle into Mining Industry Issues and Challenges. Int. Symp. Mine Plan. Equip. Sel. 2009, 16, 1–9. [Google Scholar]
- Cheah, C.K.; Prakash, J.; Ong, K.S. An Integrated OEE Framework for Structured Productivity Improvement in a Semiconductor Manufacturing Facility. Int. J. Product. Perform. Manag. 2020, 69, 1081–1105. [Google Scholar] [CrossRef]
- Corrales, L.D.C.N.; Lambán, M.P.; Morella, P.; Royo, J.; Sánchez Catalán, J.C.; Hernandez Korner, M.E. Developing and Implementing a Lean Performance Indicator: Overall Process Effectiveness to Measure the Effectiveness in an Operation Process. Machines 2022, 10, 133. [Google Scholar] [CrossRef]
- Perumal, P.A.; Teruaki, I.; Siang, T.Y.; Sieng, Y.S. Examination of Overall Equipment Effectiveness (OEE) in Term of Maynard’s Operation Sequence Technique (MOST). Am. J. Appl. Sci. 2016, 13, 1214–1220. [Google Scholar] [CrossRef][Green Version]
- Di Luozzo, S.; Pop, G.R.; Schiraldi, M.M. The Human Performance Impact on OEE in the Adoption of New Production Technologies. Appl. Sci. 2021, 11, 8620. [Google Scholar] [CrossRef]
- Braglia, M.; Frosolini, M.; Zammori, F. Overall Equipment Effectiveness of a Manufacturing Line (OEEML) an Integrated Approach to Assess Systems Performance. J. Manuf. Technol. Manag. 2008, 20, 8–29. [Google Scholar] [CrossRef]
- Dal, B.; Tugwell, P.; Greatbanks, R. Overall Equipment Effectiveness as a Measure of Operational Improvement-A practical Analysis. Int. J. Oper. Prod. Manag. 2000, 20, 1488–1502. [Google Scholar] [CrossRef]
- Sonmez, V.; Testik, M.C.; Testik, O.M. Overall Equipment Effectiveness when Production Speeds and Stoppage Durations are Uncertain. Int. J. Adv. Manuf. Technol. 2018, 95, 121–130. [Google Scholar] [CrossRef]
- Tsarouhas, P.H. Overall Equipment Effectiveness (OEE) Evaluation for an Automated Ice Cream Production Line: A Case Study. Int. J. Product. Perform. Manag. 2020, 69, 1009–1032. [Google Scholar] [CrossRef]
- Bamber, C.J.; Castka, P.; Sharp, J.M.; Motara, Y. Cross-Functional Team Working for Overall Equipment Effectiveness (OEE). J. Qual. Maint. Eng. 2003, 9, 223–238. [Google Scholar] [CrossRef]
- Andersson, C.; Bellgran, M. On the Complexity of Using Performance Measures: Enhancing Sustained Production Improvement Capability by Combining OEE and Productivity. J. Manuf. Syst. 2015, 35, 144–154. [Google Scholar] [CrossRef]
- Sharma, R. Overall Equipment Effectiveness Measurement of TPM Manager Model Machines in Flexible Manufacturing Environment: A Case Study of Automobile Sector. Int. J. Product. Qual. Manag. 2019, 26, 206–222. [Google Scholar] [CrossRef]
- Blanchard, B.S. An Enhanced Approach for Implementing Total Productive Maintenance in The Manufacturing Environment. J. Qual. Maint. Eng. 1997, 3, 69–80. [Google Scholar] [CrossRef]
- Ahmad, N.; Hossen, J.; Ali, S.M. Improvement of Overall Equipment Efficiency of Ring Frame Through Total Productive Maintenance: A Textile Case. Int. J. Adv. Manuf. Technol. 2018, 94, 239–256. [Google Scholar] [CrossRef]
- Muñoz-Villamizar, A.; Santos, J.; Montoya-Torres, J.R.; Jaca, C. Using OEE to Evaluate the Effectiveness of Urban Freight Transportation Systems: A case study. Int. J. Prod. Econ. 2017, 197, 232–242. [Google Scholar] [CrossRef]
- Hidayat, A.; Irdas, I. Evaluation of Micro Hydro Power Plant (MHPP) Using Overall Equipment Effectiveness (OEE) Method. ARPN J. Eng. Appl. Sci. 2017, 12, 5271–5275. [Google Scholar]
- Li, X.; Liu, G.; Hao, X. Research on Improved OEE Measurement Method Based on the Multiproduct Production System. Appl. Sci. 2021, 11, 490. [Google Scholar] [CrossRef]
- Oliveira, R.; Taki, S.A.; Sousa, S.; Salimi, M.A. Global Process Effectiveness: When Overall Equipment Effectiveness Meets Adherence to Schedule. In Proceedings of the 29th International Conference on Flexible Automation and Intelligent Manufacturing (FAIM2019), Limerick, Ireland, 24–28 June 2019. [Google Scholar]
- Sheu, D.D. Overall Input Efficiency and Total Equipment Efficiency. IEEE Trans. Semicond. Manuf. 2006, 19, 496–501. [Google Scholar] [CrossRef]
- Anvari, F.; Edwards, R. Maintenance Engineering in Capital-Intensive Manufacturing Systems. J. Qual. Maint. Eng. 2011, 17, 351–370. [Google Scholar] [CrossRef]
- Eswaramurthi, K.G.; Mohanram, P.V. Improvement of Manufacturing Performance Measurement System and Evaluation of Overall Resource Effectiveness. Am. J. Appl. Sci. 2013, 10, 131–138. [Google Scholar] [CrossRef]
- Fourie, H. Improvement in the Overall Efficiency of Mining Equipment: A Case Study. J. South. African Inst. Min. Metall. 2016, 116, 275–281. [Google Scholar] [CrossRef]
- García-Arca, J.; Prado-Prado, J.C.; Fernández-González, A.J. Integrating KPIs for Improving Efficiency in Road Transport. Int. J. Phys. Distrib. Logist. Manag. 2018, 48, 931–951. [Google Scholar] [CrossRef]
- Ahren, T.; Parida, A. Overall Railway Infrastructure Effectiveness (ORIE) A Case Study on the Swedish Rail Network. J. Qual. Maint. Eng. 2009, 15, 17–30. [Google Scholar] [CrossRef]
- Dalmolen, S.; Moonen, H.; Iankoulova, I.; Hillegersberg, J.V. Transportation Performances Measures and Metrics: Overall Transportation Effectiveness (OTE): A Framework, Prototype and Case Study. In Proceedings of the 46th Hawaii International Conference on System Sciences Transportation, Wailea, HI, USA, 7–10 January 2013. [Google Scholar]
- Boyce, C.; Neale, P. Conducting in-Depth Interviews: A Guide for Designing and Conducting in-Depth Interviews for Evaluation Input; Pathfinder International: Watertown, MA, USA, 2006. [Google Scholar]
- Hsu, C.C.; Sandford, B.A. The Delphi technique: Making sense of Consensus. Pract. Assess. Res. Eval. 2007, 12, 10. [Google Scholar]
- Allmark, P.; Boote, J.; Chambers, E.; Clarke, A. Ethical Issues in the Use of In-Depth Interviews: Literature Review and Discussion. Res. Ethics. 2009, 5, 48–54. [Google Scholar] [CrossRef]
- Ahlin, E. Semi-Structured Interviews with Expert Practitioners: Their Validity and Significant Contribution to Translational Research; SAGE Publications Ltd.: London, UK, 2019. [Google Scholar]
- Ogbeifun, E.; Mbohwa, C.; Pretorius, J.H.C. Developing Key Performance Indicators Using the Delphi Technique. FUTY J. Environ. 2016, 10, 27–38. [Google Scholar]
- Hallowell, M.R.; Gambatese, J.A. Qualitative Research: Application of the Delphi Method to CEM Research. J. Constr. Eng. Manag. 2010, 136, 99–107. [Google Scholar] [CrossRef]
- Ruiter, V.N. The Delphi technique: A Tutorial. Res. Hosp. Manag. 2022, 12, 91–97. [Google Scholar]
- Boulkedid, R.; Abdoul, H.; Loustau, M.; Sibony, O.; Alberti, C. Using and Reporting the Delphi Method for Selecting Healthcare Quality Indicators: A Systematic Review. PLoS ONE 2011, 6, e20476. [Google Scholar] [CrossRef] [PubMed]
- Van Nguyen, T.A.; Tucek, D.; Pham, N.T. Indicators for TQM 4.0 Model: Delphi Method and Analytic Hierarchy Process (AHP) Analysis. Total Qual. Manag. Bus. Excell. 2022, 1–15. [Google Scholar] [CrossRef]
- Forza, C. Survey Research in Operations Management: A Process-Based Perspective. Int. J. Oper. Prod. Manag. 2002, 22, 152–194. [Google Scholar] [CrossRef]
- Mengistu, A.T.; Panizzolo, R. Indicators and Framework for Measuring Industrial Sustainability in Italian Footwear Small and Medium Enterprises. Sustainability 2021, 13, 5472. [Google Scholar] [CrossRef]
- Rivera, P.A.; do Carmo, B.B.T.; Arcese, G.; Merveille, N. Social Circular Economy Indicators: Selection through Fuzzy Delphi Method. Sustain. Prod. Consum. 2021, 26, 101–110. [Google Scholar] [CrossRef]
- Ayre, C.; Scally, A.J. Critical values for Lawshe’s Content Validity Ratio: Revisiting the Original Methods of Calculation. Meas. Eval. Couns. Dev. 2014, 47, 79–86. [Google Scholar] [CrossRef]
- Azevedo, S.G.; Govindan, K.; Carvalho, H.; Cruz-Machado, V. Ecosilient Index to Assess the Greenness and Resilience of the Upstream Automotive Supply Chain. J. Clean. Prod. 2013, 56, 131–146. [Google Scholar] [CrossRef]
- Miller, K.M. Nonparametric Statistics for the Behavioral Sciences, 2nd ed.; CRC Press: New York, NY, USA, 2013. [Google Scholar]
- Moslem, S.; Ghorbanzadeh, O.; Blaschke, T.; Duleba, S. Analysing Stakeholder Consensus for a Sustainable Transport Development Decision by the Fuzzy AHP and Interval AHP. Sustainability 2019, 11, 3271. [Google Scholar] [CrossRef]
- Rau, G.; Shih, Y.S. Evaluation of Cohen’s Kappa and Other Measures of Inter-Rater Agreement for Genre Analysis and Other Nominal Data. J. Engl. Acad. Purp. 2021, 53, 101026. [Google Scholar] [CrossRef]
- Cheh, K.M. Analysis of Overall Equipment Effectiveness (OEE) within different sectors in different Swedish industries. Master’s Thesis, Mälardalen University, Västerås, Sweden, 2014. [Google Scholar]
- Ejsmont, K.; Gladysz, B.; Corti, D.; Castaño, F.; Mohammed, W.M.; Martinez Lastra, J.L.M. Towards ‘Lean Industry 4.0ʹ–Current trends and Future Perspectives. Cogent Bus. Manag. 2020, 7, 1781995. [Google Scholar] [CrossRef]
- Pagliosa, M.; Tortorella, G.; Ferreira, J.C.E. Industry 4.0 and Lean Manufacturing: A Systematic Literature Review and Future Research Directions. J. Manuf. Technol. Manag. 2021, 32, 543–569. [Google Scholar] [CrossRef]
- Yazdi, P.G.; Azizi, A.; Hashemipour, M. An Empirical Investigation of the Relationship Between Overall Equipment Efficiency (OEE) and Manufacturing Sustainability in Industry 4.0 with Time Study Approach. Sustainability 2018, 10, 3031. [Google Scholar] [CrossRef]
- Gackowiec, P.; Podobinska-Staniec, M.P.; Brzychczy, E.; Kühlbach, C.; Özver, T. Review of Key Performance Indicators for Process Monitoring in the Mining Industry. Energies 2020, 13, 5169. [Google Scholar] [CrossRef]
- Ortega, J.; Tóth, J.; Péter, T. Applying Geographic Information System Methodologies to Estimate the Catchment Area Accessibility of Park-and-Ride Facilities. Period. Polytech. Transp. Eng. 2021, 50, 69–78. [Google Scholar] [CrossRef]
Publisher’s Note: MDPI stays neutral with regard to jurisdictional claims in published maps and institutional affiliations. |
© 2022 by the authors. Licensee MDPI, Basel, Switzerland. This article is an open access article distributed under the terms and conditions of the Creative Commons Attribution (CC BY) license (https://creativecommons.org/licenses/by/4.0/).