1. Introduction
Humans show various social behaviors. Gaze interaction is one example of nonverbal social communication behaviors. Gaze interaction helps people judge someone to be attentive, attractive, credible, socially competent, or socially dominant, and hence is an essential factor in many social situations [
1]. The opposite of gaze interaction is gaze avoidance, which is associated with several psychiatric conditions of social situations like Social Anxiety Disorder (SAD). SAD is a fear of social situations or underperformance and is the fourth most common psychological disorder [
1]. Furthermore, about 13% of people suffer from SAD during their lifetimes [
1].
In healthy social communication, gaze interaction is necessary. Some social situations prevalently depend on gaze interaction, like appearing in an interview for a job or presenting to an audience [
2]. According to McCroskey [
3], social anxiety is “An individual’s level of fear or anxiety connected with either anticipated or real communication with other persons”. A person having SAD may not be able to live a quality life. Here, it is essential to distinguish between shyness and SAD, where SAD could be a cause of disturbance in normal routine. About 80% of people with SAD also experience other psychiatric conditions like specific phobia, major depressive disorder (MDD), and dependency on alcohol. The problems associated with the disorder demand proper treatment.
If left untreated, SAD could cause various social negative behaviors like isolation, cyberbullying, harmful, social academic, and psychological loneliness, problems in making friends, depression, and school refusal [
4]. If left untreated, it has an increased risk of persistence into adulthood after 11 years of age. There are various significant methods to treat SAD, i.e., cognitive behavioral therapy (CBT), exercising, yoga, etc. Computers and the latest machine-learning algorithms can also aid in all the above-mentioned methods either directly or indirectly.
In recent years, computers have been effectively used to measure social and mental disorders. The reliance on information and communication technologies (ICT) is increasing because of the following two main reasons:
To avoid the patients’ fear: Despite SAD being the cause of various sociological damages, only half of the adults seek treatment [
5], because they fear being negatively evaluated by a healthcare professional which, by itself, is a symptom of SAD.
Financial issues: SAD imposes extensive economic costs on individuals. The treatment costs are significantly higher for people that have SAD as compared to other chronic physical diseases. The studies by Sugano et al. [
4] and Pampouchidou et al. [
5] analyzed the data from the Netherlands’ national mental health survey and estimated an annual mean cost of €11,952 per person. In addition, literature such as [
6,
7] also suggests that there is a rising cost of the diagnosis of psychological disorders.
The solution to mentioned problems could be solved by developing ICT-oriented applications that could automatically predict patients’ SAD. There exist some examples of the use of ICTs to predict psychological disorders. For example, machine-learning algorithms are used to predict depression among senior citizens [
8], an automated video-based recognition of depression and anxiety symptom severity [
5], or to improve and predict the state of healthcare [
9]. Machine learning is used for many other applications within social contexts, e.g., social media presence and analysis on Twitter or YouTube [
10,
11,
12], or general applications of image or language processing [
13,
14,
15,
16,
17]. However, research in using machine-learning techniques to predict SAD is scarce.
The existing studies on the prediction of SAD mostly used gaze interaction [
8,
18]. The proposed methods used live remote communication or manual coding to measure gaze interaction. There are multiple challenges present in the existing research related to SAD prediction. Firstly, techniques to detect gaze interaction use live remote communication. A remote video conversation via software like Skype is entirely different from live communication e.g., Face to Face (F2F), presentations, or an interview [
18]. Secondly, the existing research that used live F2F communication heavily relied on humans to watch out for gaze interaction/avoidance and then manually record it [
8,
19]. Thirdly, no public dataset exists related to the prediction of SAD. A dataset is important and could prove to be a primary intellectual output of research [
1]. Therefore, the aim of this research is also to prepare a gaze interaction and avoidance dataset to predict SAD. In addition, SAD is further categorized into four major classes as per the LSAS scale [
9]. The proposed work is the pioneer study conducted to find a relationship between gaze interaction and SAD classes.
The rest of the paper is organized as follows:
Section 2 describes related work con-ducted in ICT based context of SAD, while
Section 3 describes methods and materials col-lected or used in this research.
Section 4 explains the experimental setup and describes the analysis and results.
Section 5 concludes the paper and explains the implications and po-tential future directions of the research.
2. Related Work
SAD is a disorder with a marked and persistent fear of social situations, which often is the cause of embarrassment or humiliation [
20]. Individuals can experience social stress in a range of contexts, such as giving a public speech, speaking to a superior in a structural environment, or when engaged in unexpected interpersonal communication settings. Mostly, those who are socially anxious account for themselves as being shy when involved in an interpersonal setting or feeling some apprehension to communicate with others [
21].
The research [
20] explains that people with SAD have common symptoms such as:
Self-conscious in front of other people
Worrying for days or weeks before an event involving other people as well
Stay away from places where people involved
Tough time making friends and keeping friends
Some physical symptoms when they are with other people, like blushing, nausea, trembling, heavy sweating, and having a tough time talking.
If untreated, SAD can construct various kinds of psychopathology spanning internalizing and externalizing conditions [
22]. The externalizing conditions incorporate a variety of disinhibited or externally focused behavioral symptoms, including aggression, conduct problems, delinquent behavior, oppositionality, hyperactivity, and attention problems. The internalizing conditions include a variety of over-inhibited or internally focused symptoms, including anxiety, fear, sadness/depression, social withdrawal, and somatic complaints [
22]. Thus, SAD is an example of an internalizing condition. Another epidemiological study by Blalock [
2] estimates that about 80% of people with SAD also experience a comorbid psychiatric condition such as other anxiety disorders and major depressive disorder (MDD).
Psychiatrists use the LSAS to predict someone’s SAD condition. The LSAS is a short questionnaire developed in 1987 by psychiatrist Michael Liebowitz. However, this subjective scale depends on the correct answers provided by the subjects. Jahedi et al. [
23] described some disadvantages of subjective scales such as:
Subjective scale filling is a time-consuming task because it includes a proper understanding of the questionnaire and an exact answer for each question; otherwise, it will predict incorrect results.
It is an arduous task for children, semi-literate, and non-literate people to fill the subjective scale, as they cannot read and understand it properly.
A subjective scale needs aid in the filling and is thus prone to other people’s bias.
The subjective scale may be prone to produce incorrect results due to manual evaluation.
A subjective measurement can be improved by replacing it with some objective measures. With the advancement in machine-learning techniques, automatic gaze estimation has improved. Recent studies have proposed the automatic detection of gaze interaction with eye trackers or wearable cameras [
4]. However, there are many central issues in detecting gaze interaction with such wearable devices. Firstly, it is hard for participants to wear eye trackers or cameras because they feel more self-conscious if they have psychological disorders [
24]. Secondly, gaze interaction largely depends on the conditions of interaction [
25]. For example, talking with close family and friends is a different kind of interaction than talking with strangers.
To overcome the shortcomings, the researchers have designed interfaces that help in the video annotation of gaze interaction manually. Manually here means a human annotates a video by tracking the gaze of the participants and inputting gaze avoidance or interaction as a coded value [
8]. Recent studies also contributed to new instruments that efficiently browse various videos like sports [
26], education [
27], first-person videos [
28], and surveillance [
29]. These works used techniques based on computer vision and formulated modern GUI support for video browsing like-colored video timelines [
30], content-aware fast-forwarding [
31], and direct manipulation [
32]. However, work related to real-time automatic gaze analysis to detect gaze for predicting SAD is scarce.
Researchers like Langer et al. [
8] and Howell et al. [
18] suggested that SAD is associated with gaze avoidance. Farabee et al. [
19] estimated gaze interaction in a live situation where women saw the videos of the confederate. The videos were pre-recorded, but the women participants had no idea about it. For them, it was live remote communication. However, one of the drawbacks of the study was the use of human coders to code gaze avoidance or gaze interaction. Such coding could be biased because of the human coder’s involvement. Assuming a coder is not biased, there is still a possibility of human error due to loss of concentration, over-coding, or under-coding of the values. Such errors might result in a prediction error.
Weeks et al. [
33] measured the gaze interaction in a live communication where all participants took part in a role-play task, which was a conversation with an unknown female (whom they were told was also a study participant). Two video cameras were fixed on the wall of the test room. A stopwatch was used to figure out the total number of seconds in which the participants maintained gaze interaction with their confederates during each minute of the communication. The drawback of this study was again the involvement of a human who used a stopwatch to measure the time of gaze interaction or gaze avoidance. Hence, the same flaws, as explained in an earlier paragraph, might have crept into the study as well.
Howell et al. [
18] measured gaze avoidance by setting up a live remote environment. The participants interacted with the interviewer through a webcam. However, Langer et al. [
8] argued that such a live remote environment setup might not be able to produce real anxiety situations in social environments as in live F2F communication and might not have produced the correct results. There are some other shortcomings suggested by Hebert et al. [
34]. For example, the authors measured the gaze behavior in live communication, where participants talked with their real friends. A video from live communication was recorded. However, the problem is that talking to friends is what most of us do in normal daily life and thus might not be a trigger for SAD. Secondly, the coders used manual detection of gaze interaction while watching the video. As said earlier, the use of a manual technique to measure gaze interaction is not an efficient approach as human coders could miss an essential gaze interaction or avoidance moment. Furthermore, such coding might be prone to the coder’s bias, who ultimately knew the purpose of the experiment. Therefore, there is a need for a technique to automate the measurement of gaze interaction in live communication to detect SAD.
Table 1 summarizes the discussion provided in the related work section. The first column shows the reference from where the parameters are extracted. The second column shows the use of a live environment or not, while the third column explains whether manual or automated coding is used in the research. The fourth column explains whether the research compares the sub-classes of SAD with gaze interaction or not. The fifth column supplies information about the production of any public dataset. The last column states whether any relationship was proved between the SAD and gaze interaction in the research or not. The table highlight research gaps such as no usage of automatic prediction of gaze in a live environment. Furthermore, no study proved a relationship between gaze interaction/avoidance with SAD classes. In addition, the lack of a dataset in SAD prediction is also a gap that this study aims to fill in.
3. Materials and Methods
Accurate measurement and estimation are important in learning social behaviors such as the prediction of someone’s personality [
4]. However, this is a more serious job when someone’s health is involved. At the same time, the cost of such a prediction should also be affordable for everyone. To achieve “affordability” in this research, we decided to capture live F2F communication with the participants and for this purpose, an interview was set up with the participants. A built-in P.C. camera was used to capture the live F2F communication of the participants.
To automate the prediction process, the Haar Cascade classifier was identified as a method to detect human faces and their gaze interaction/avoidance. The method was proposed by Viola and Jones in 2001 [
35] and is being used in the latest face detection, recognition, and gaze interaction prediction research. Examples include [
36,
37,
38], etc. Besides, the algorithm is open-source and is easily available as linked libraries for languages like Python.
A detailed understanding of SAD and finding its relationship with gaze interaction could help health planners to design and implement the right healthcare delivery system. However, studies like [
8,
18,
33] conducted experiments to predict only the presence or absence of SAD. As per the LSAS scale [
9], SAD is further divided into four classes according to severity level. Treatment of SAD depends on the severity of the SAD as everyone can have a different severity level. Therefore, by extending the prediction of SAD into classes, psychiatrists can drill down the SAD cases and diagnose and prescribe the treatments accordingly. Therefore, to fulfill our third goal, we extended the procedure to include the prediction of SAD in four classes. A class showing the absence of SAD was also included. The fourth goal is to create a dataset with data collected from the selected participants. The first step toward data collection was to measure the SAD of the participants.
The participants were evaluated for SAD with an LSAS SAD evaluation scale before data collection. The choice of a suitable psychological evaluation scale for this purpose is discussed in the next subsection. The participants filled out the scale as per their subjective assessment of themselves. The information about the selection of the participants that engaged in the subjective data collection is provided in the second sub-section. A summary of the filtered participants for the second phase of automated data collection is provided in the “Selected participants” sub-section. The design and development of an application for automated data collection are discussed in the last sub-section.
3.1. Psychological Scale Selection
There are various scales available to measure SAD, but the most used is LSAS (Liebowitz Social Anxiety Scale) [
39]. The scale is evaluated for its psychometric properties as per standards set in the Structured Clinical Interview for DSM Disorders (SCID) [
40]. It is a semi-structured interview guide that explains the process of the assessment of current and lifetime Axis disorders. Some examples of these disorders are anxiety, mood disorders, psychosis, and substance use disorders. The latest version of SCID is called SCID-V. It is considered a standard instrument for the valuation of Axis psychopathology, as explained by the Diagnostic and Statistical Manual-V (DSM-V) [
41]. SCID-V also has the LSAS [
9], which is a standard clinician-administered interview to assess social anxiety symptoms.
The LSAS has shown exceptional divergent and convergent validity [
18]. Scores on the LSAS can distinguish between patients with SAD and those without SAD [
33]. It can also classify the participants into four more classes as follows. A score of less than 55 on the LSAS scale means that the participant belongs to the “No SAD” group. A participant with a score exceeding 55 on the LSAS scale means that he/she belongs to a SAD group. It further has criteria or thresholds for the symptoms of SAD. It includes the severity and length which are needed for a symptom to qualify for the diagnosis. The total score shows the severity of the individual’s SAD in terms of 1) “No SAD” (≤55), 2) Marked (≥55 and ≤65), 3) Moderate (≥65 and ≤80), 4) Severe (≥80 and ≤95), and 5) Very Severe (≥95). The comparison of SAD subclasses can be useful for three reasons:
To better understand the relationship between SAD and gaze interaction by comparing all classes as each class might have a different kind of gaze interaction pattern,
For correct prediction of SAD using gaze interaction for each class separately, and
To supply effective treatment of SAD for each class as each SAD person in a different class might not need the same kind of treatment.
3.2. Criteria for the Selection of Participants
As explained in the related work section, subjective assessment scales have various disadvantages. However, to predict SAD automatically, there is a requirement to have subjective assessment data of the participants to overcome some of the disadvantages like difficulty in filling out scale by children and non-literate. The following four conditions were applied to make the results correct:
- (1)
Participants above the age of 18 were considered.
- (2)
The educational qualification of all participants was taken above 10th grade.
- (3)
For each class of SAD, the number of male and female participants was taken equally.
- (4)
The number of participants selected was greater than the existing literature review on SAD prediction.
The experimenter informed participants about the experiment verbally and in the form of written information on the provided consent form. It was necessary to fill out the form to show the participants’ volunteer participation agreement for the experiment. One of the participants supplied informed consent to publish the information/image(s) in an online open-access publication. All the methods were conducted following World Health Organization (WHO) relevant guidelines and regulations. The process of data collection, taking consent, and the ethical procedure followed was approved by the COMSATS University Islamabad, Research, and Evaluation Committee (CUI-REC) co-located in COMSATS University Islamabad, Abbottabad Campus, Pakistan. The committee also looks after the ethical issues in research.
After the consent, the participants were provided with the printed LSAS scale. The experimenter also supplied instructions on filling it out accurately. After filling out the scale, the participants returned it to the experimenter. The filled scales by 180 participants were manually analyzed one by one, and the final score of each participant was computed. Each of the participants was grouped based on the final score. The grouping was based on the LSAS threshold values to declare someone with “No SAD” or to any of the four classes: Marked, Moderate, Severe, and Very Severe. Most of the participants i.e., 66 had a ‘“No SAD”’ group, 43 had Moderate SAD, 39 were with Marked SAD, 10 were identified as having Severe SAD, and 22 had “Very Severe” SAD as per an analysis of LSAS scores. In the phase, we investigated 180 participants, among which 77.2% were male and 22.8% were female. As there were only 10 participants in the severe class, therefore, it was decided to collect data from only 50 participants (10 from each class) in the second phase.
The percentage distribution of the data collection at various locations is illustrated in
Table 2 below.
3.3. Final Selection of the Participants
As per our planned experimental setup section (c.f. “Experimental setup”), the procedure of collecting the data from a single participant could take about an hour, including consent agreement and delivering setting instructions. Furthermore, the non-availability of some participants for the experiment resulted in the wastage of the time slot and re-allocation to another time slot. Besides, the experiment was conducted at three separate locations (c.f.
Table 2) and was a time-consuming process. Moreover, we found only 10 participants in the severe SAD class after analyzing 180 participants in Phase 1. Therefore, it was decided to collect data from only 50 participants (10 from each class) in the second phase. This process helped us to save experimentation time as well as to experiment with enough participants. Various existing research conducted similar experiments with a lesser or almost equal number of participants [
34].
All participants with an LSAS score range of “Severe SAD” were therefore selected for the final experiment. This group had 5 male and 5 female participants. The participants from the rest of the classes were selected randomly. All the remaining groups were selected with an equal number of male and female participants as well. This process was done to avoid any influence of gender as a covariate.
3.4. Development of the Application
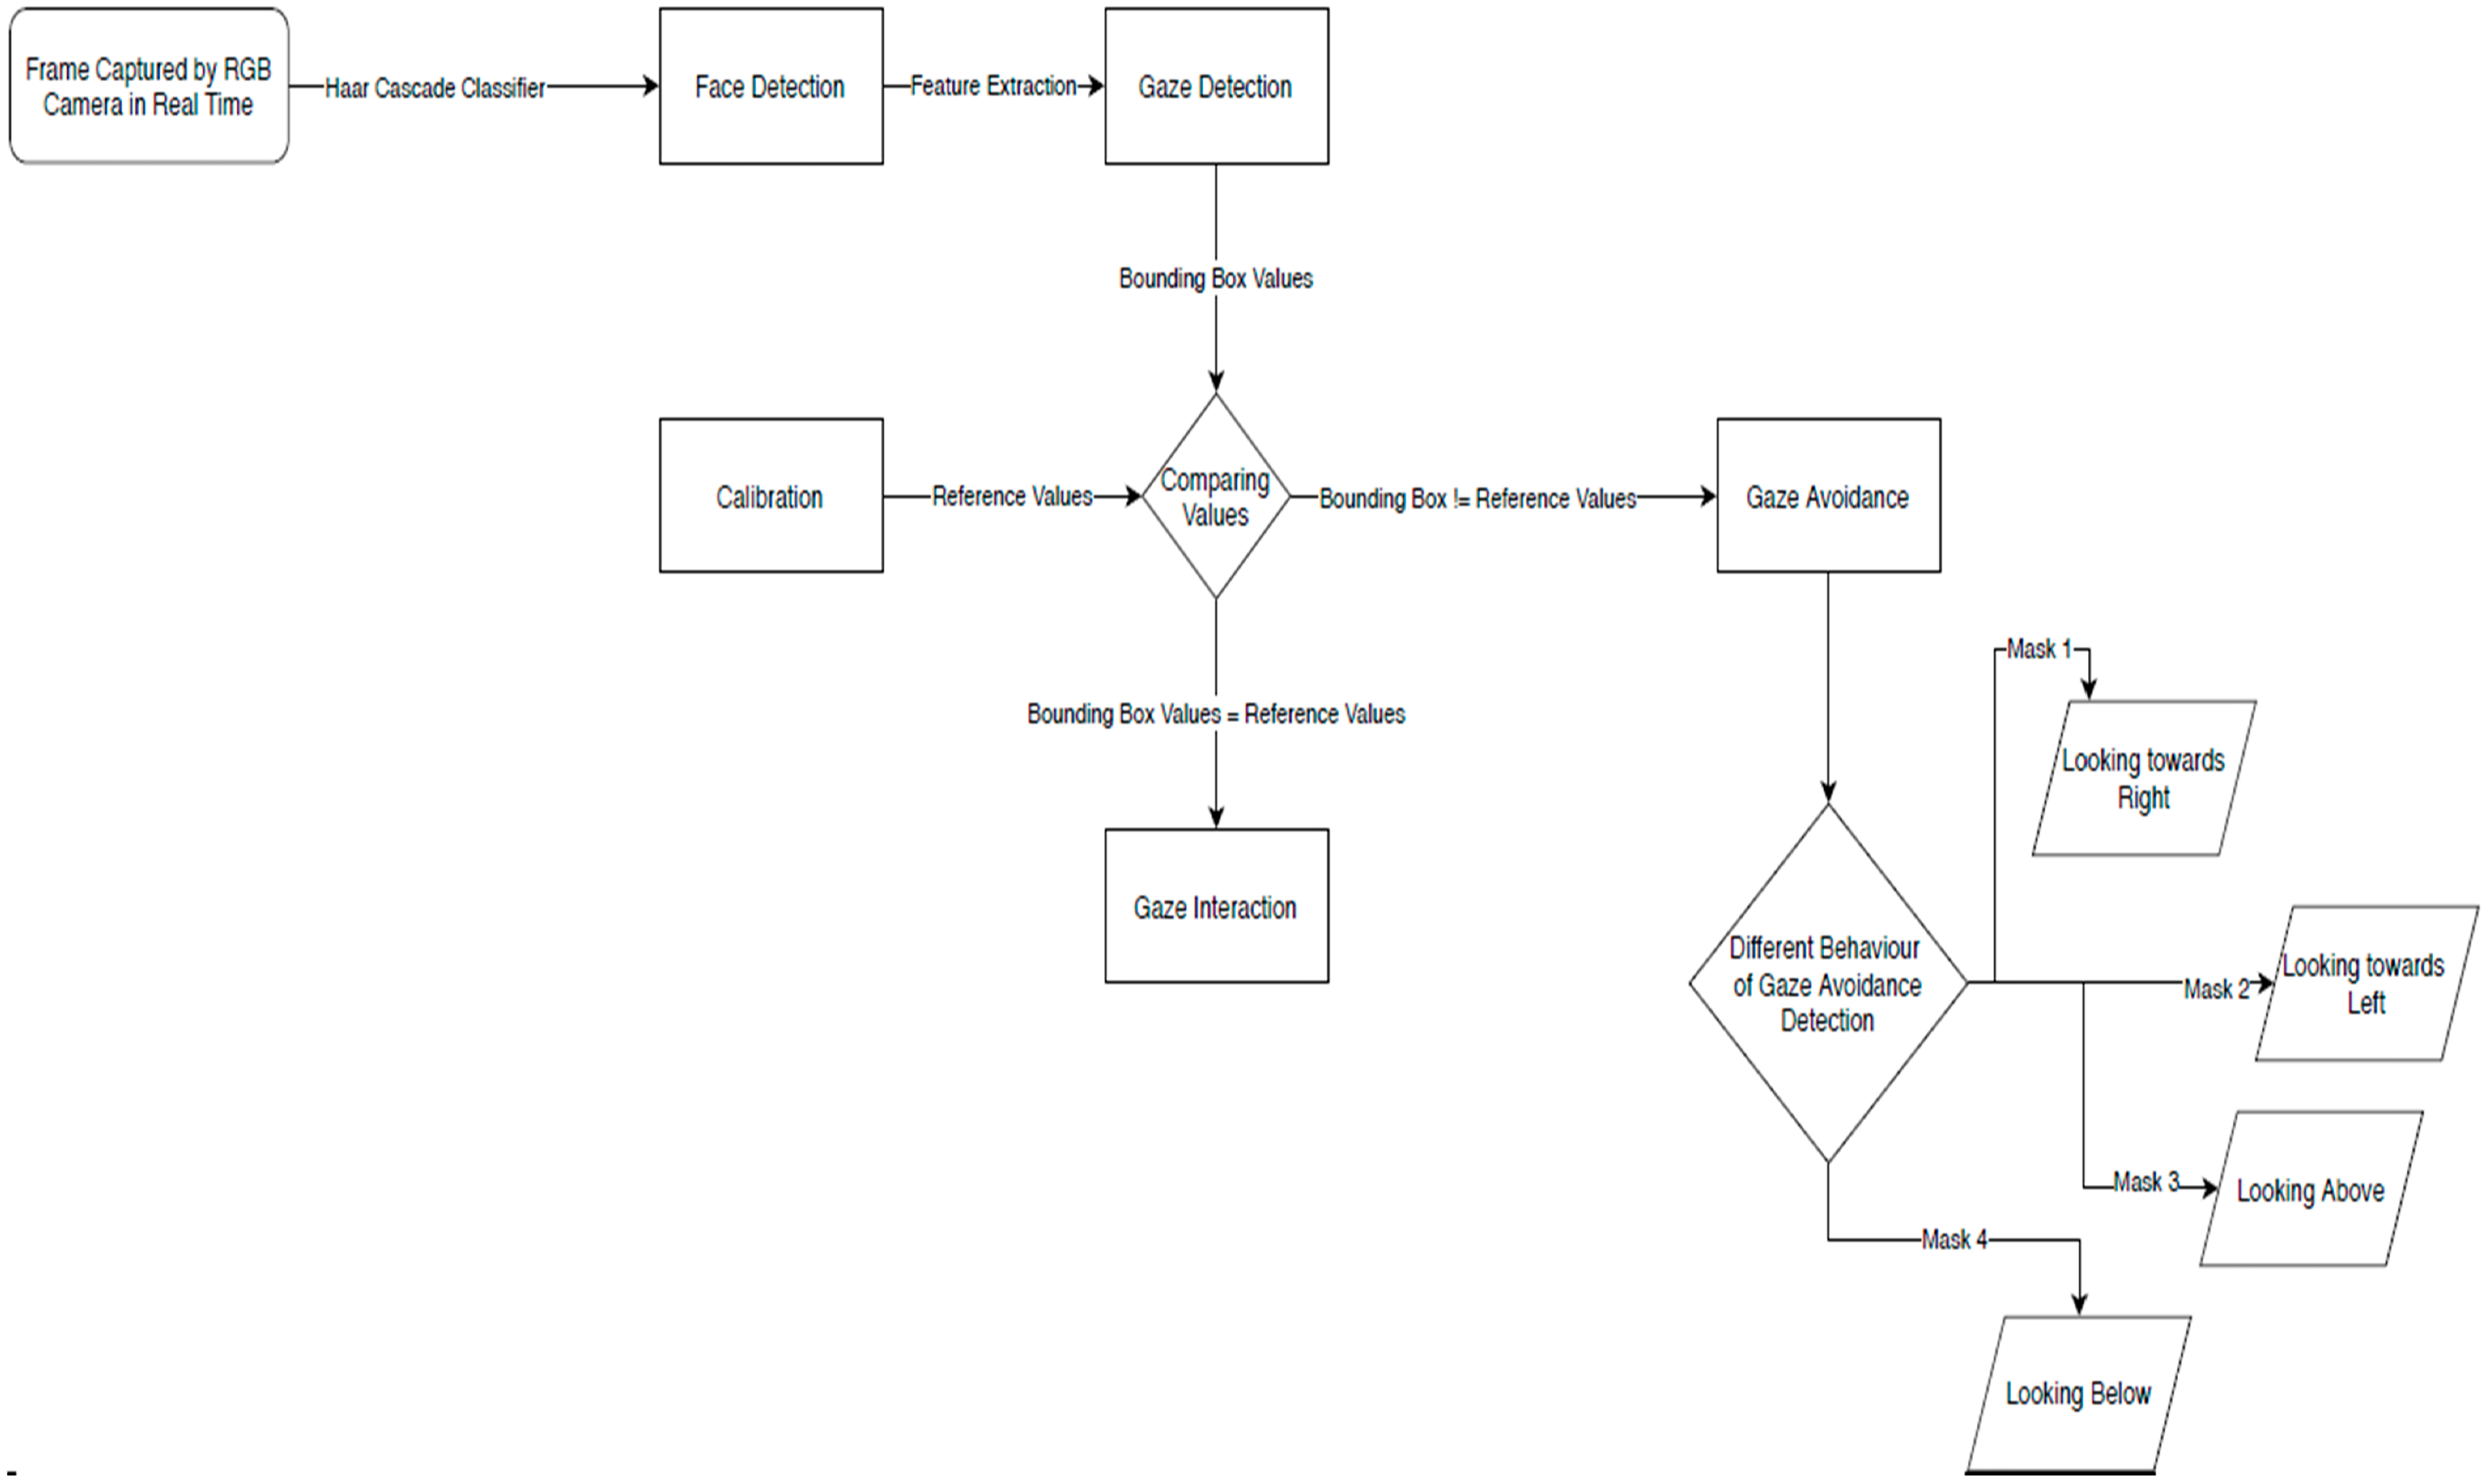
OpenCV 3.4.3 and Python version 2.7.14 were used to develop the application. We applied Haar cascade Classifier to the live videos of the participants. The developed application works in a sequence of the following steps (c.f.
Figure 1).
Step 1: Each participant’s interaction with the interviewer was captured using an RGB camera in the form of a video.
Step 2: Each frame from the video was input into a Haar cascade classifier to detect a face in the frame.
Step 3: By using the feature extraction, gaze was detected.
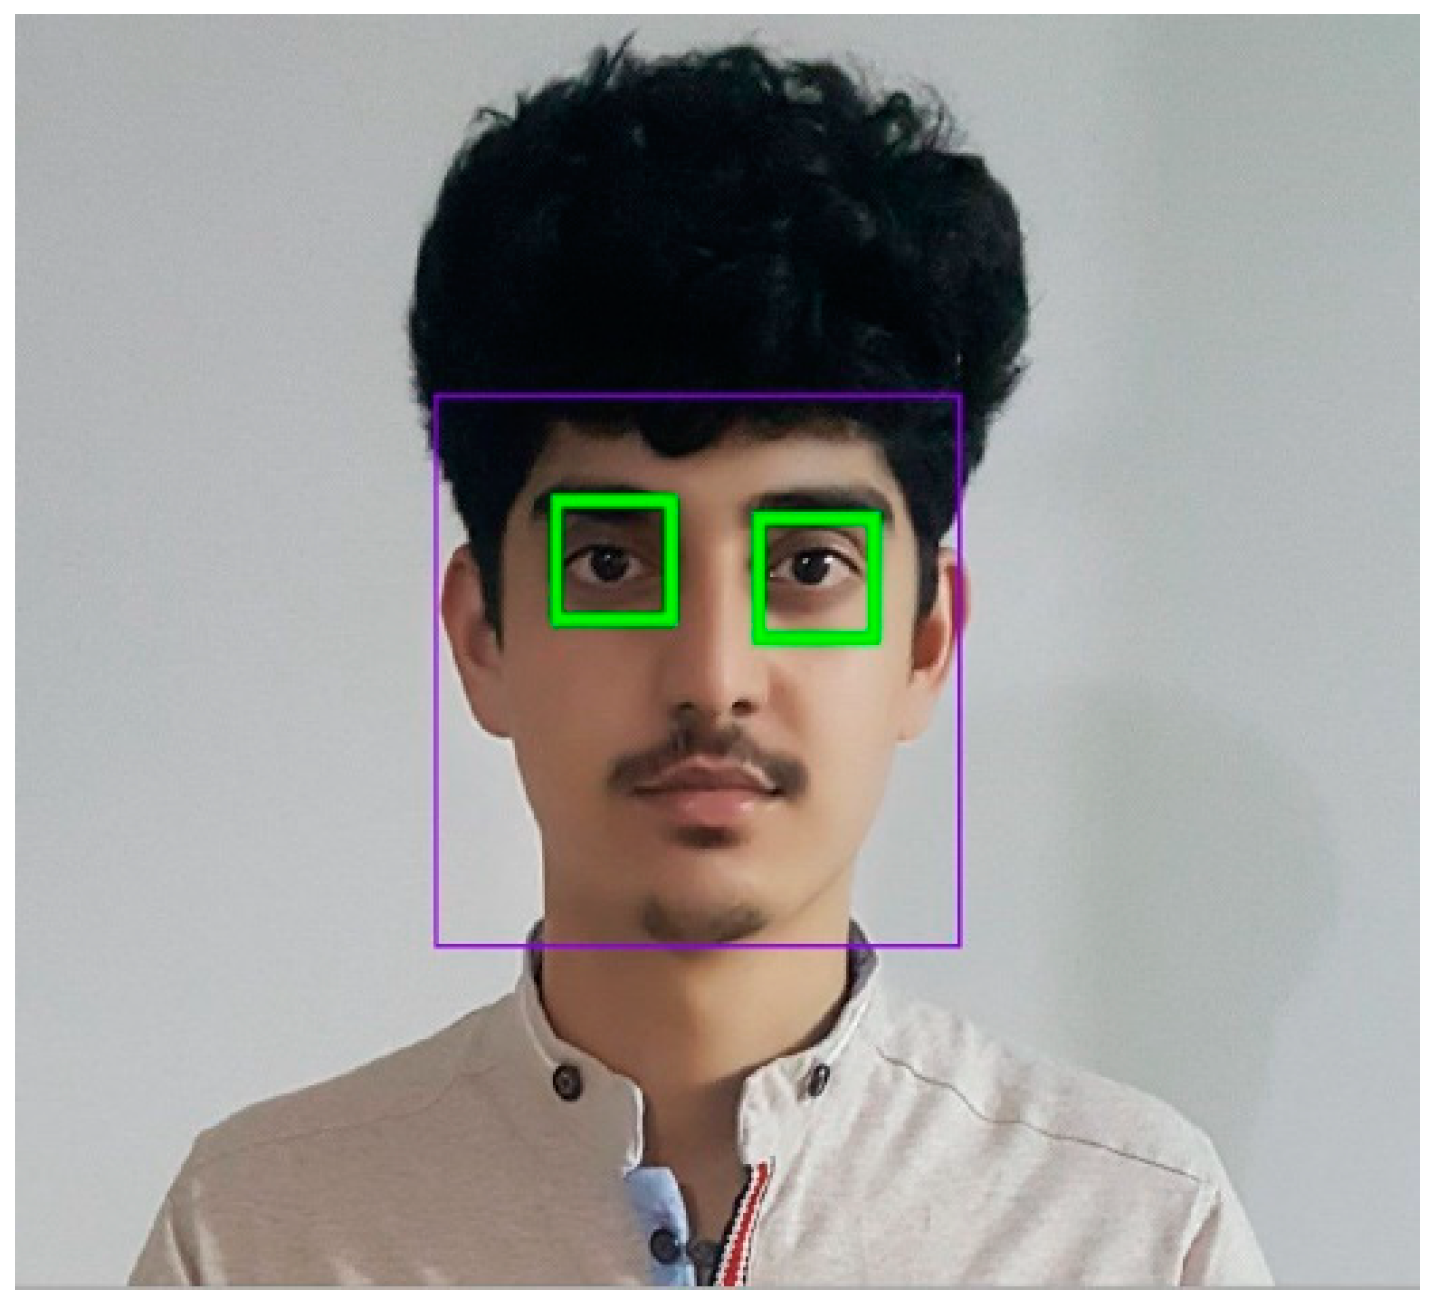
Step 4: The gaze pupil was marked as a bounding box, as shown in
Figure 2.
Step 5: A Calibration file was created in Python to set the reference values for each participant’s gaze interaction. The calibration feature was used as described [
42]. For example, corresponding eX and eY positions were stored as the horizontal and the vertical coordinates, and eW and eH were captured as the height and width of the bounding box. Reference values were unique for each participant and were figured out according to the participant’s gaze bounding box coordinates.
Step 6: Selected reference values were compared with the participant’s gaze values in real time.
If the real-time video values of a participant were within the limits of selected reference values of gaze interaction, then it was considered gaze interaction.
If the real-time video values of a participant were out of the limits of the selected reference value of gaze interaction, then gaze avoidance was considered.
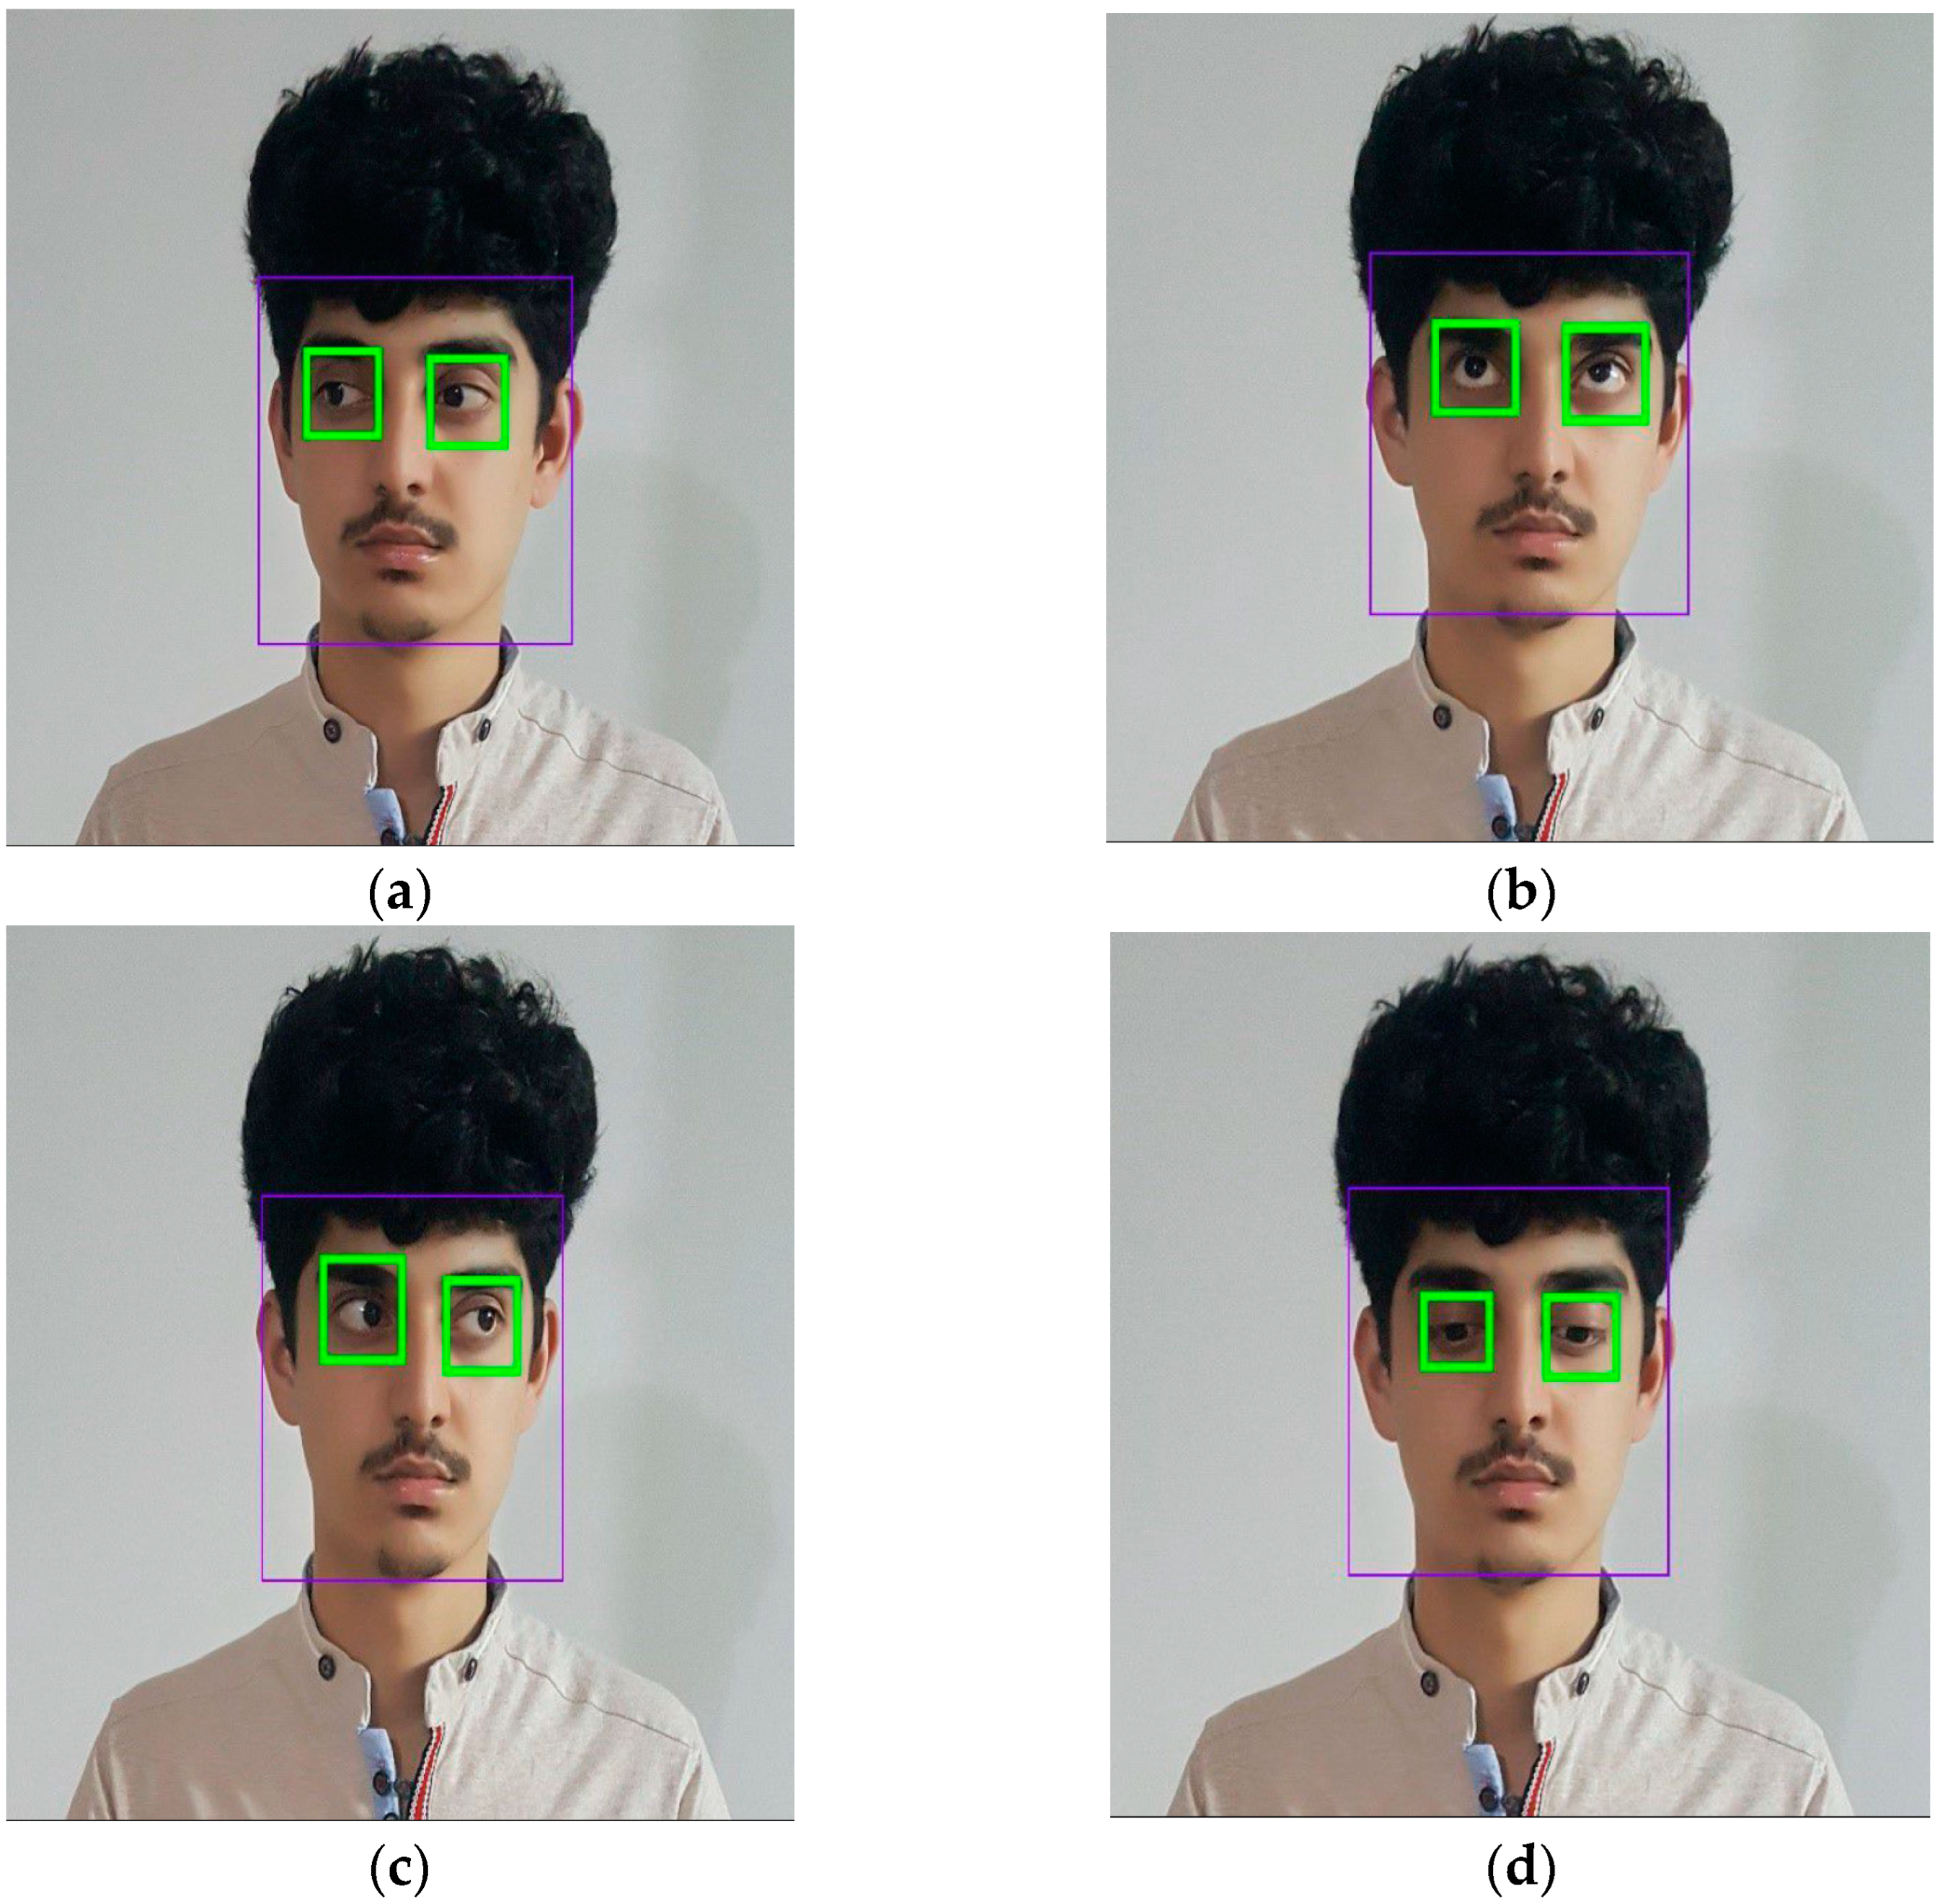
Step 7: The gaze avoidance was further divided into four subclasses (gazing above, gazing below, gazing right, gazing left) by detecting coordinate values of the bounding box during gaze avoidance (c.f.
Figure 3). The decision to collect these data was taken to enrich the dataset, as well as to test any possible links between these gaze behaviors with SAD.
3.5. Experimental Setup
The experiment was conducted in the Fall 2021 semester from 6 September 2021 to 31st December 2021. As explained earlier (c.f.
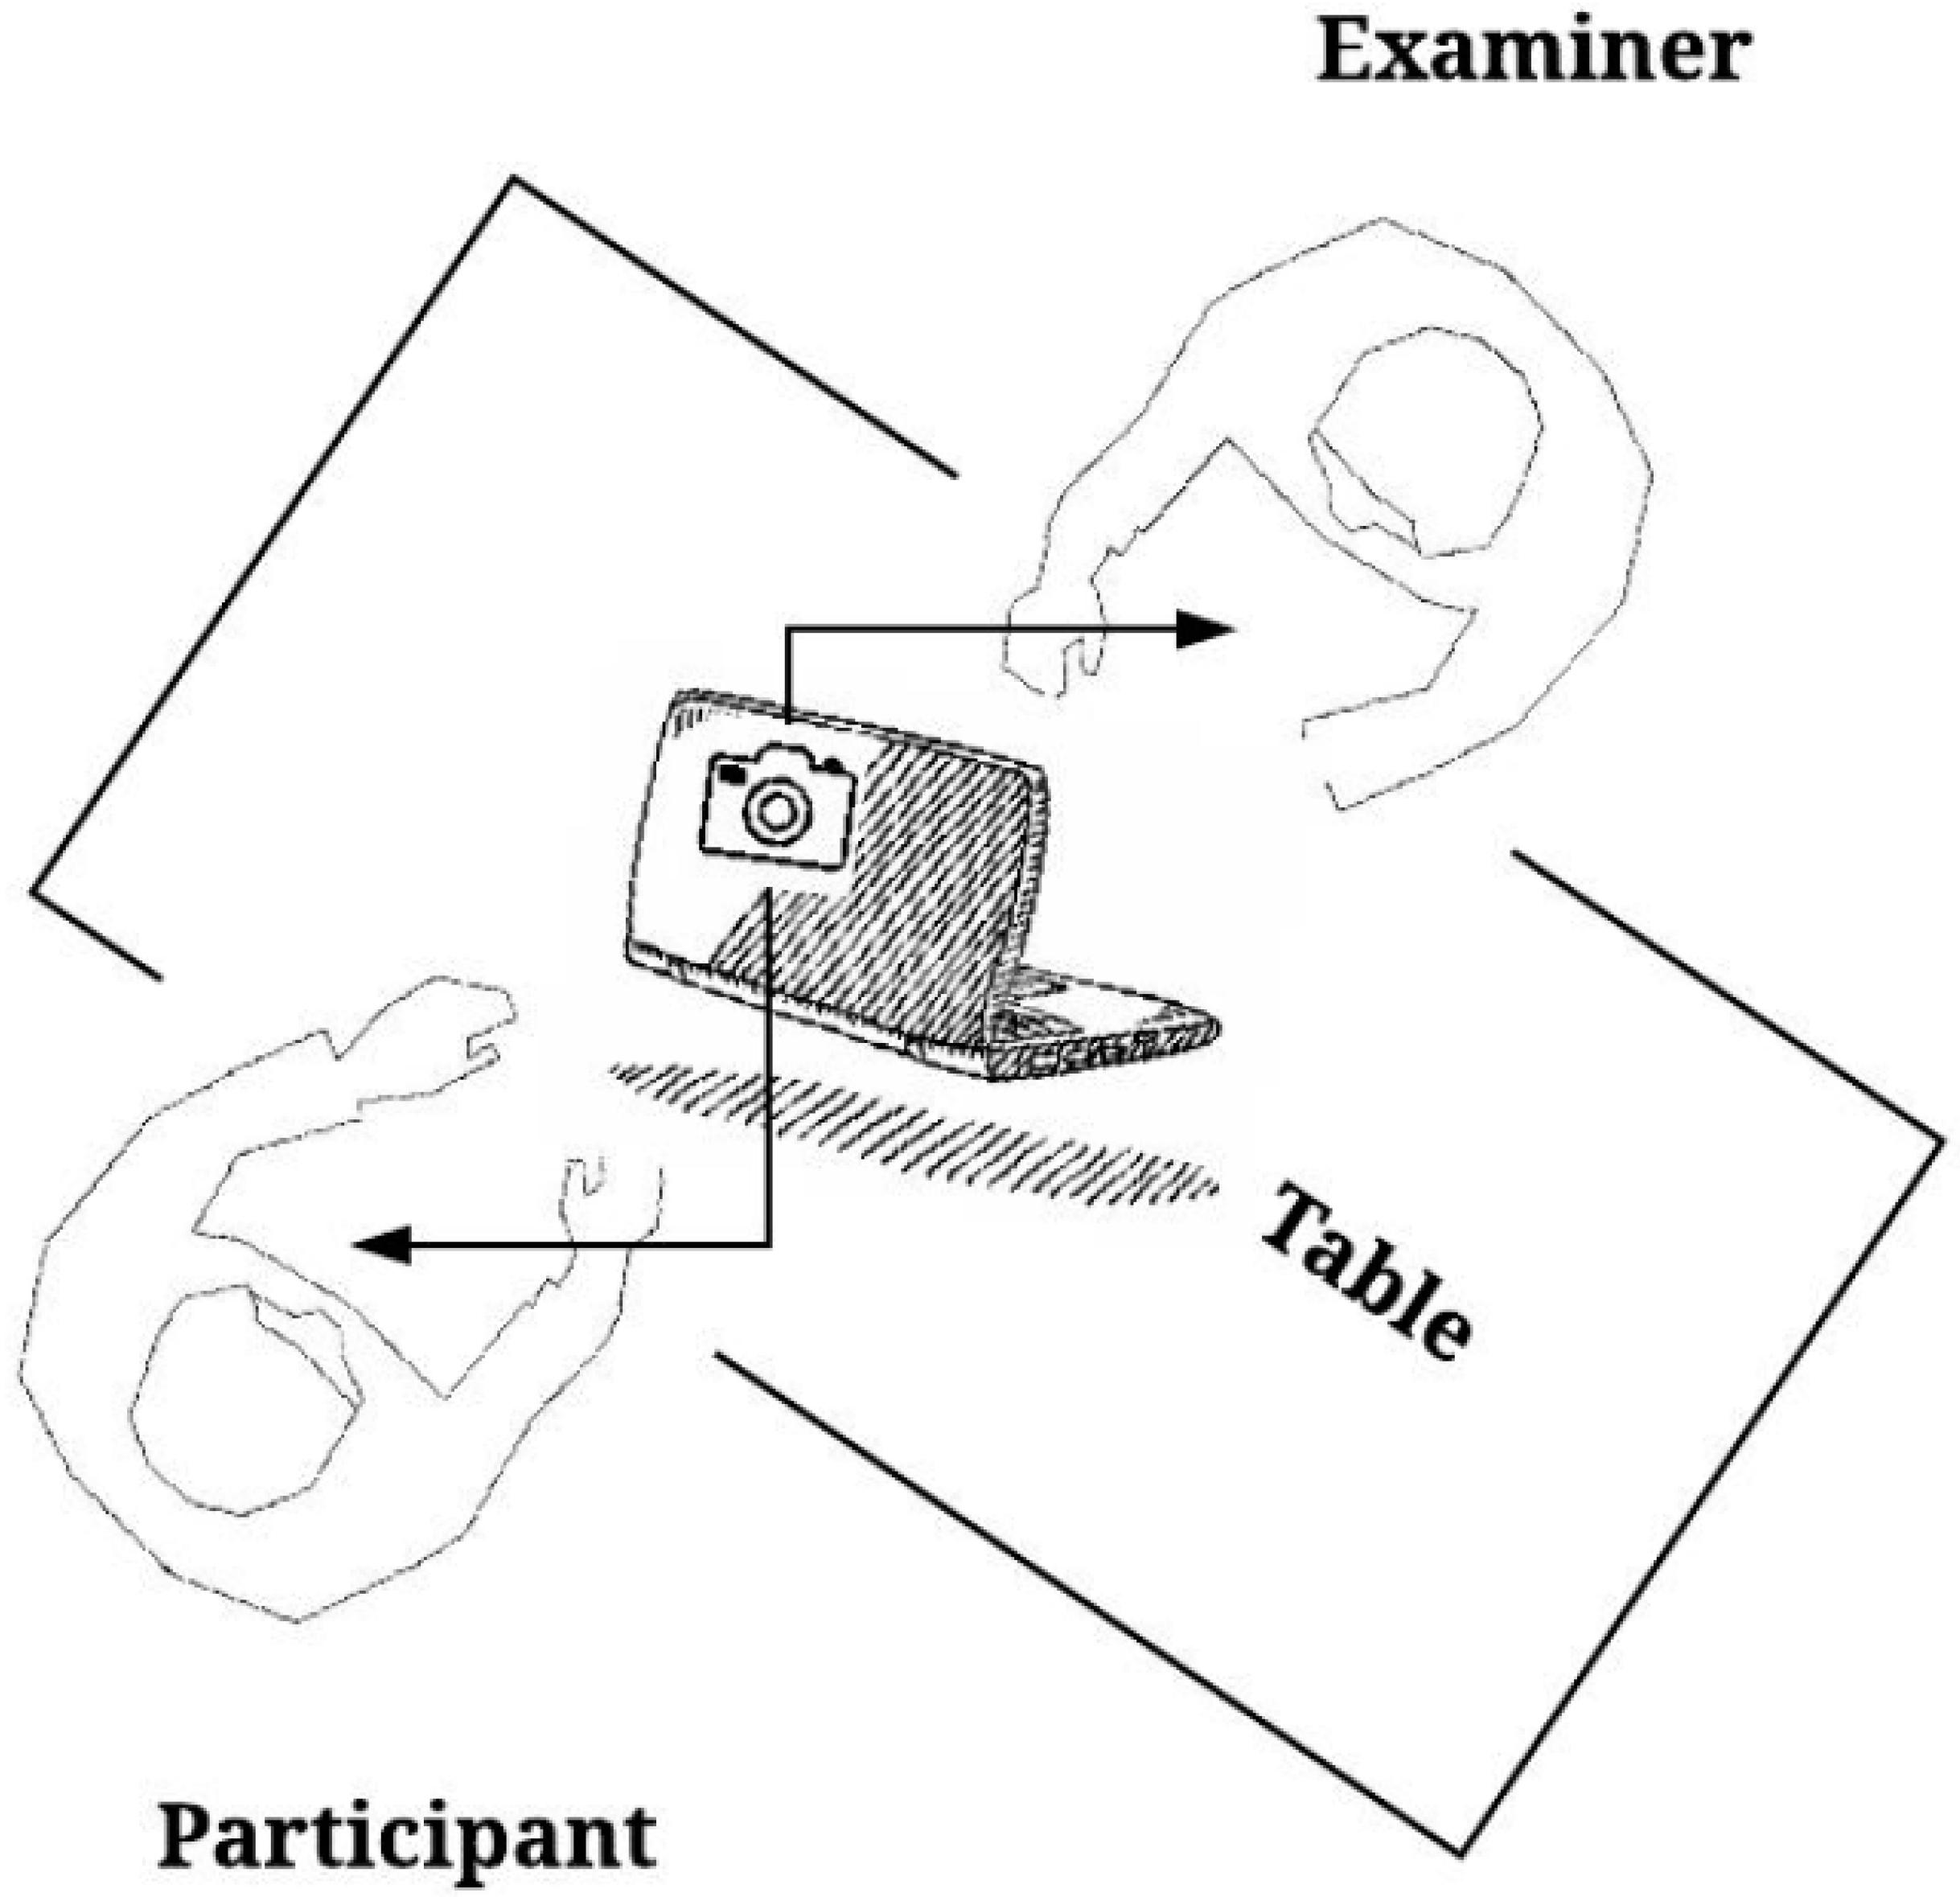
Table 2), three separate locations were used to collect data. The experiment was conducted in a separate room for each location. In college and university, a room for the execution of the experiment was made available. Participants who opted to take the experiment in their homes or near their homes were invited for a conversation session in a nearby primary school. It was ensured that no external noise could disturb the participants. The room had a table and two chairs. A laptop facing the interviewer was placed on the table with an external camera mounted for automatic detection of gaze via the proposed application. The examiner sat on one chair, and participants were called to sit on the other chair for the interview.
Figure 4 shows the experimental setup of the proposed work.
3.5.1. Conversation Used for Experimental Study
After the scale-filling phase, the participants were invited for a conversation session as per the setup explained in the prior section. It took an average of 5 days to analyze the collected scale data and to inform the finally selected participants for the experiment. The conversation session was planned to be 5 min without any break. The session was video recorded for later use and to create a dataset of SAD. The conversation used for this study was the same as used by [
8] and is described in
Table 3 below. The observer was asked to act like an interviewer who wanted to know about the personality of the participants.
3.5.2. Data Preparation
As the first step of the analysis, data were pre-processed to prepare a dataset. In the recorded real-time conversation, gaze interaction was measured by using the developed application (c.f. development of the application). The data labeling process as explained in the latter part of this section was used to predict whether to consider the extracted data values of a participant’s gaze as gaze interaction or avoidance. We collected 5 min of video from 50 participants. We took 6 frames per second (fps) to collect data from each frame. This makes 1800 gaze values for each participant in a 5-min conversation. The collected data were used to create a balanced dataset of gaze interaction/avoidance to detect SAD in real-time environments. Our dataset holds 90,000 values of gaze interaction/avoidance values against interactions of 50 Participants. This dataset could prove to be useful in the future to find the relationship between SAD with other combinations of SAD symptoms like trembling voice to predict SAD. The dataset has three parts: “Annotation”, “Calibration’’, and “Data’’.
The annotations include:
Detected eye landmark’s location on the whole image coordinate in pixels.
The target position of gaze in the screen coordinate.
3D gaze target position compared to the camera.
The assessed 3D left gaze center in the camera coordinate system.
The assessed 3D right gaze center in the camera coordinate system.
Labeling in terms of gaze interaction and gaze avoidance.
Gaze avoidance labeling is further extended in terms of looking above, looking below, and looking toward left and right.
Besides, there is also a “Calibration” file for each participant, which has:
The intrinsic parameter of the laptop camera.
The projection matrix of the camera.
The position of the image plane in the camera coordinate.
The laptop screen size.
The screen height and width in pixels.
The screen height and width are in millimeters.
The “Data” file had:
Gaze prediction graph for an individual participant.
Score file that has the scores of subjective scale and automatic gaze prediction.
The recorded file of real-time gaze prediction.
4. Analysis, Results, and Discussions
This section includes a comparison of SAD classes in terms of gaze interaction/avoidance. The interaction and avoidance data for each class were computed separately. As can be seen from
Figure 5, participants in the “No SAD” class had the highest gaze interaction, with an average percentage corresponding to 82.9%. This shows that people who do not have SAD are more likely to keep gaze interaction. The gaze interaction average percentage tends to decrease as the severity of the SAD tends to increase. As
Figure 5 shows, the marked, moderate, severe, and very severe average gaze interaction percentages decreased to 64.7%, 46.6%, 31%, and 27.4%, respectively. The largest gaze interaction percentage of a participant in the “No SAD” group was 88%, in the Marked group it was 70.50%, in the Moderate group it was 53.70%, in the Severe group it was 37.80%, and in the ‘Very Severe’ group it was 34.60%. An overall analysis revealed a linear relationship between gaze interaction and increasing severity of SAD.
The next analyses were conducted to analyze the relationship between subgroups such as females vs. males. In addition, data analysis in the context of parameters like accuracy, precision, and recall was also conducted.
4.1. Relationship between Gender-Based Gaze Interaction/Avoidance and SAD Classes
The data were divided based on gender groups and processed for each SAD class separately.
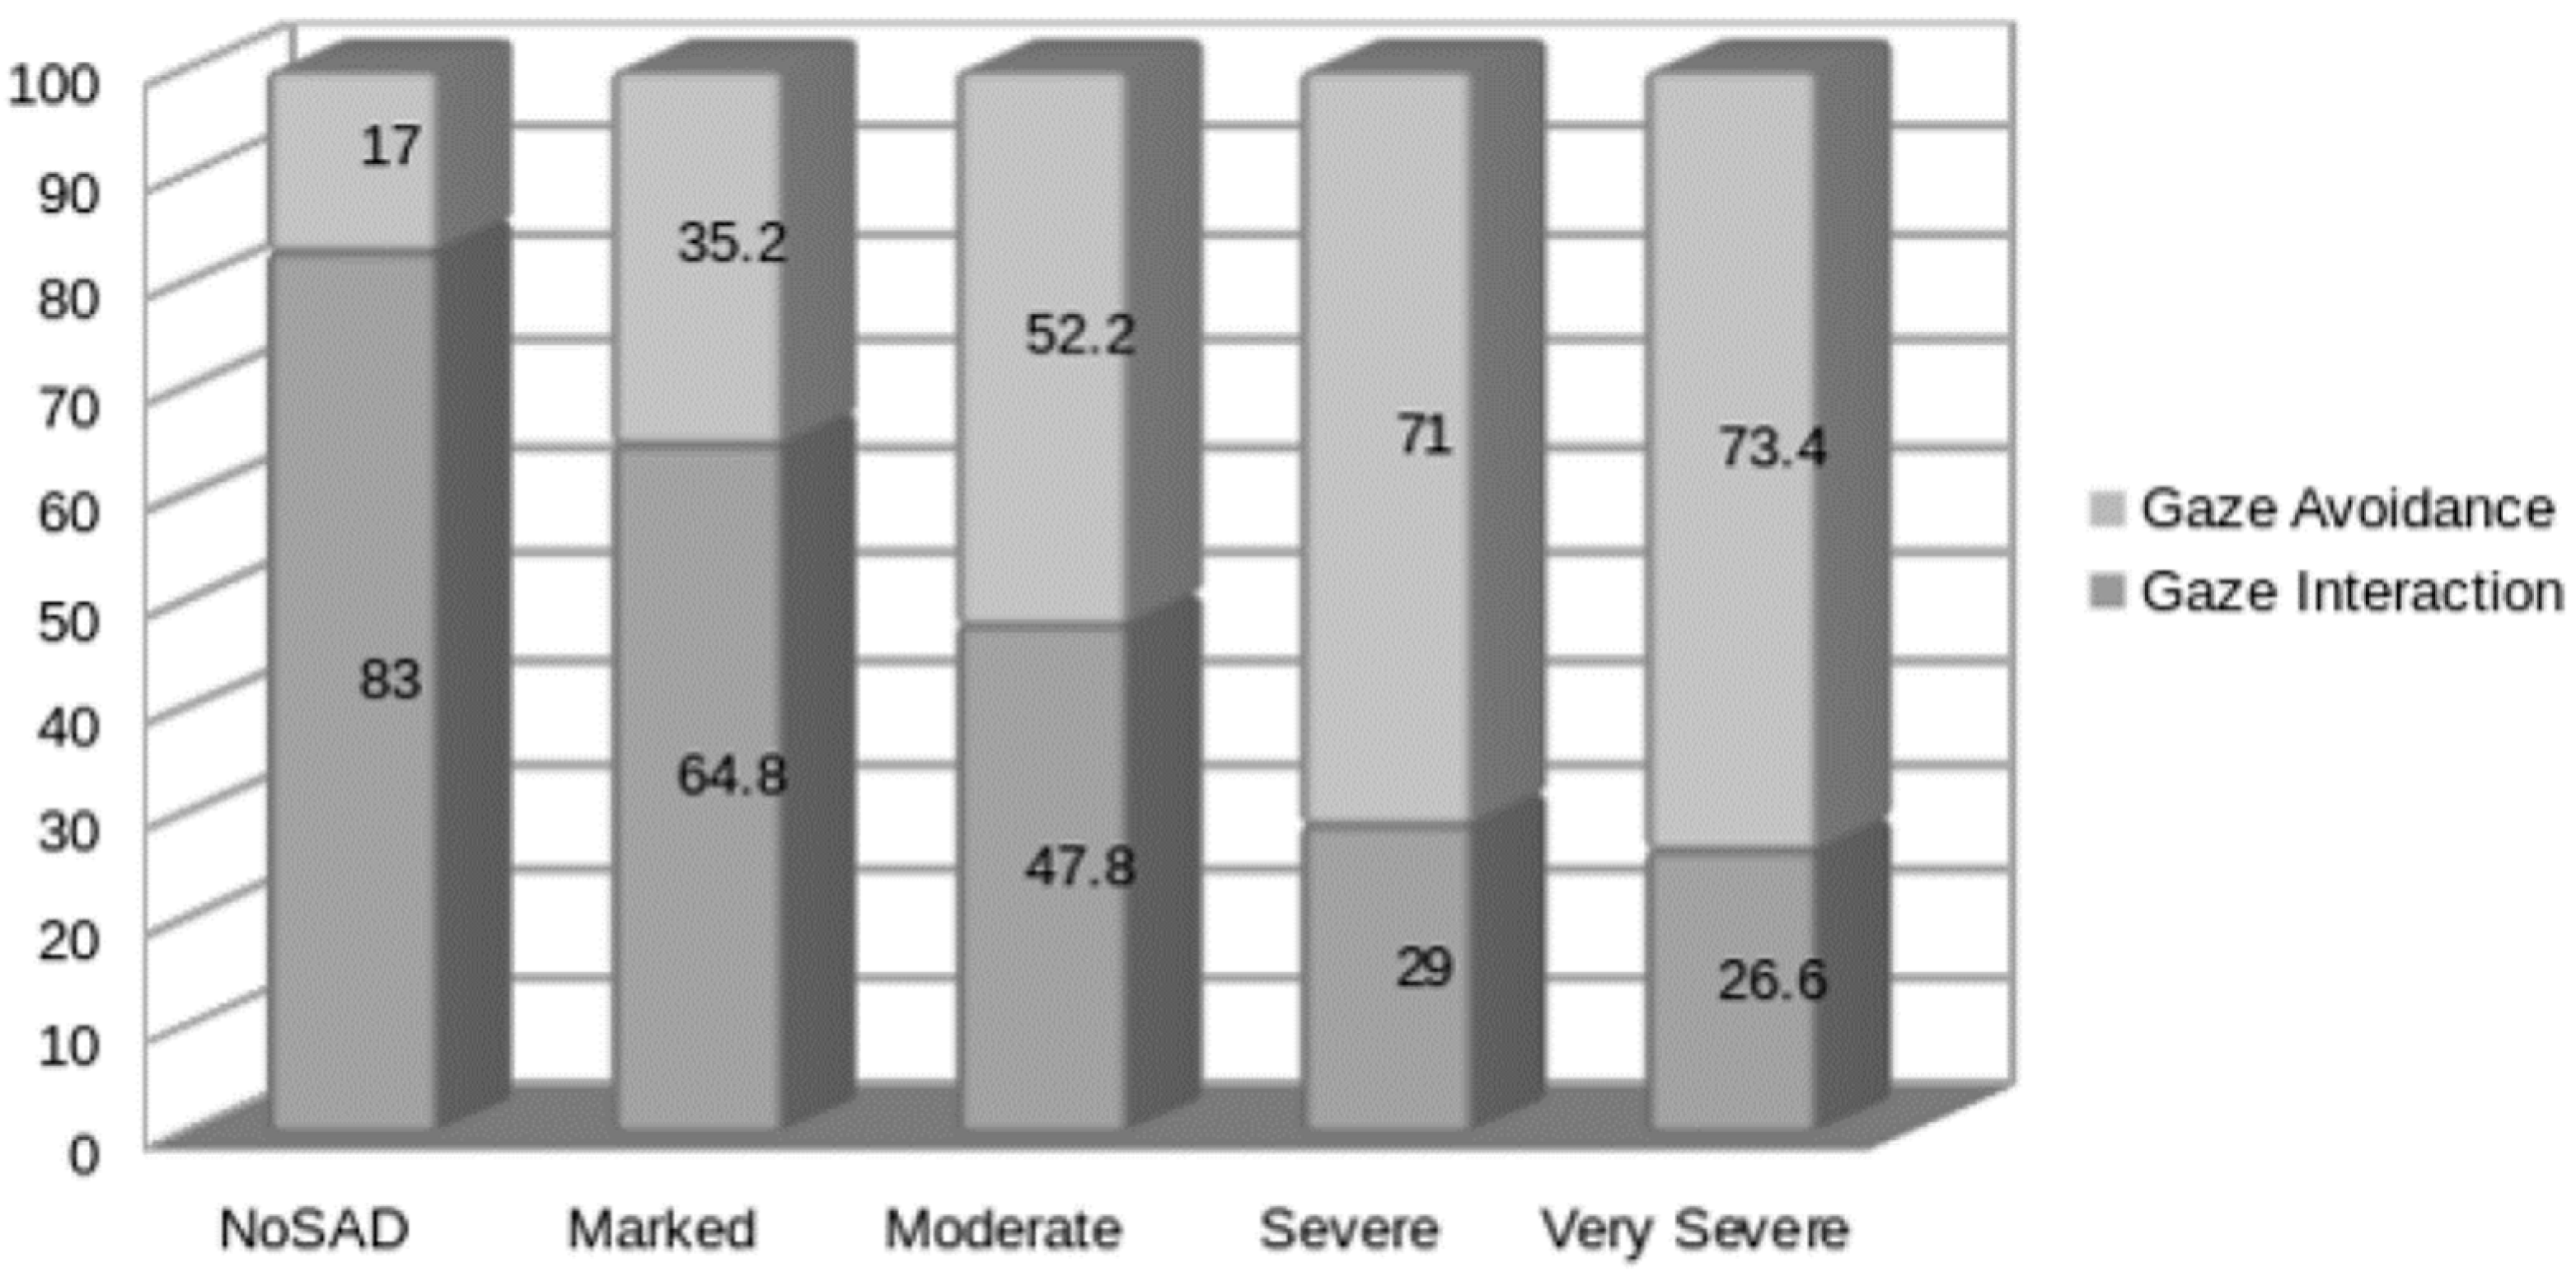
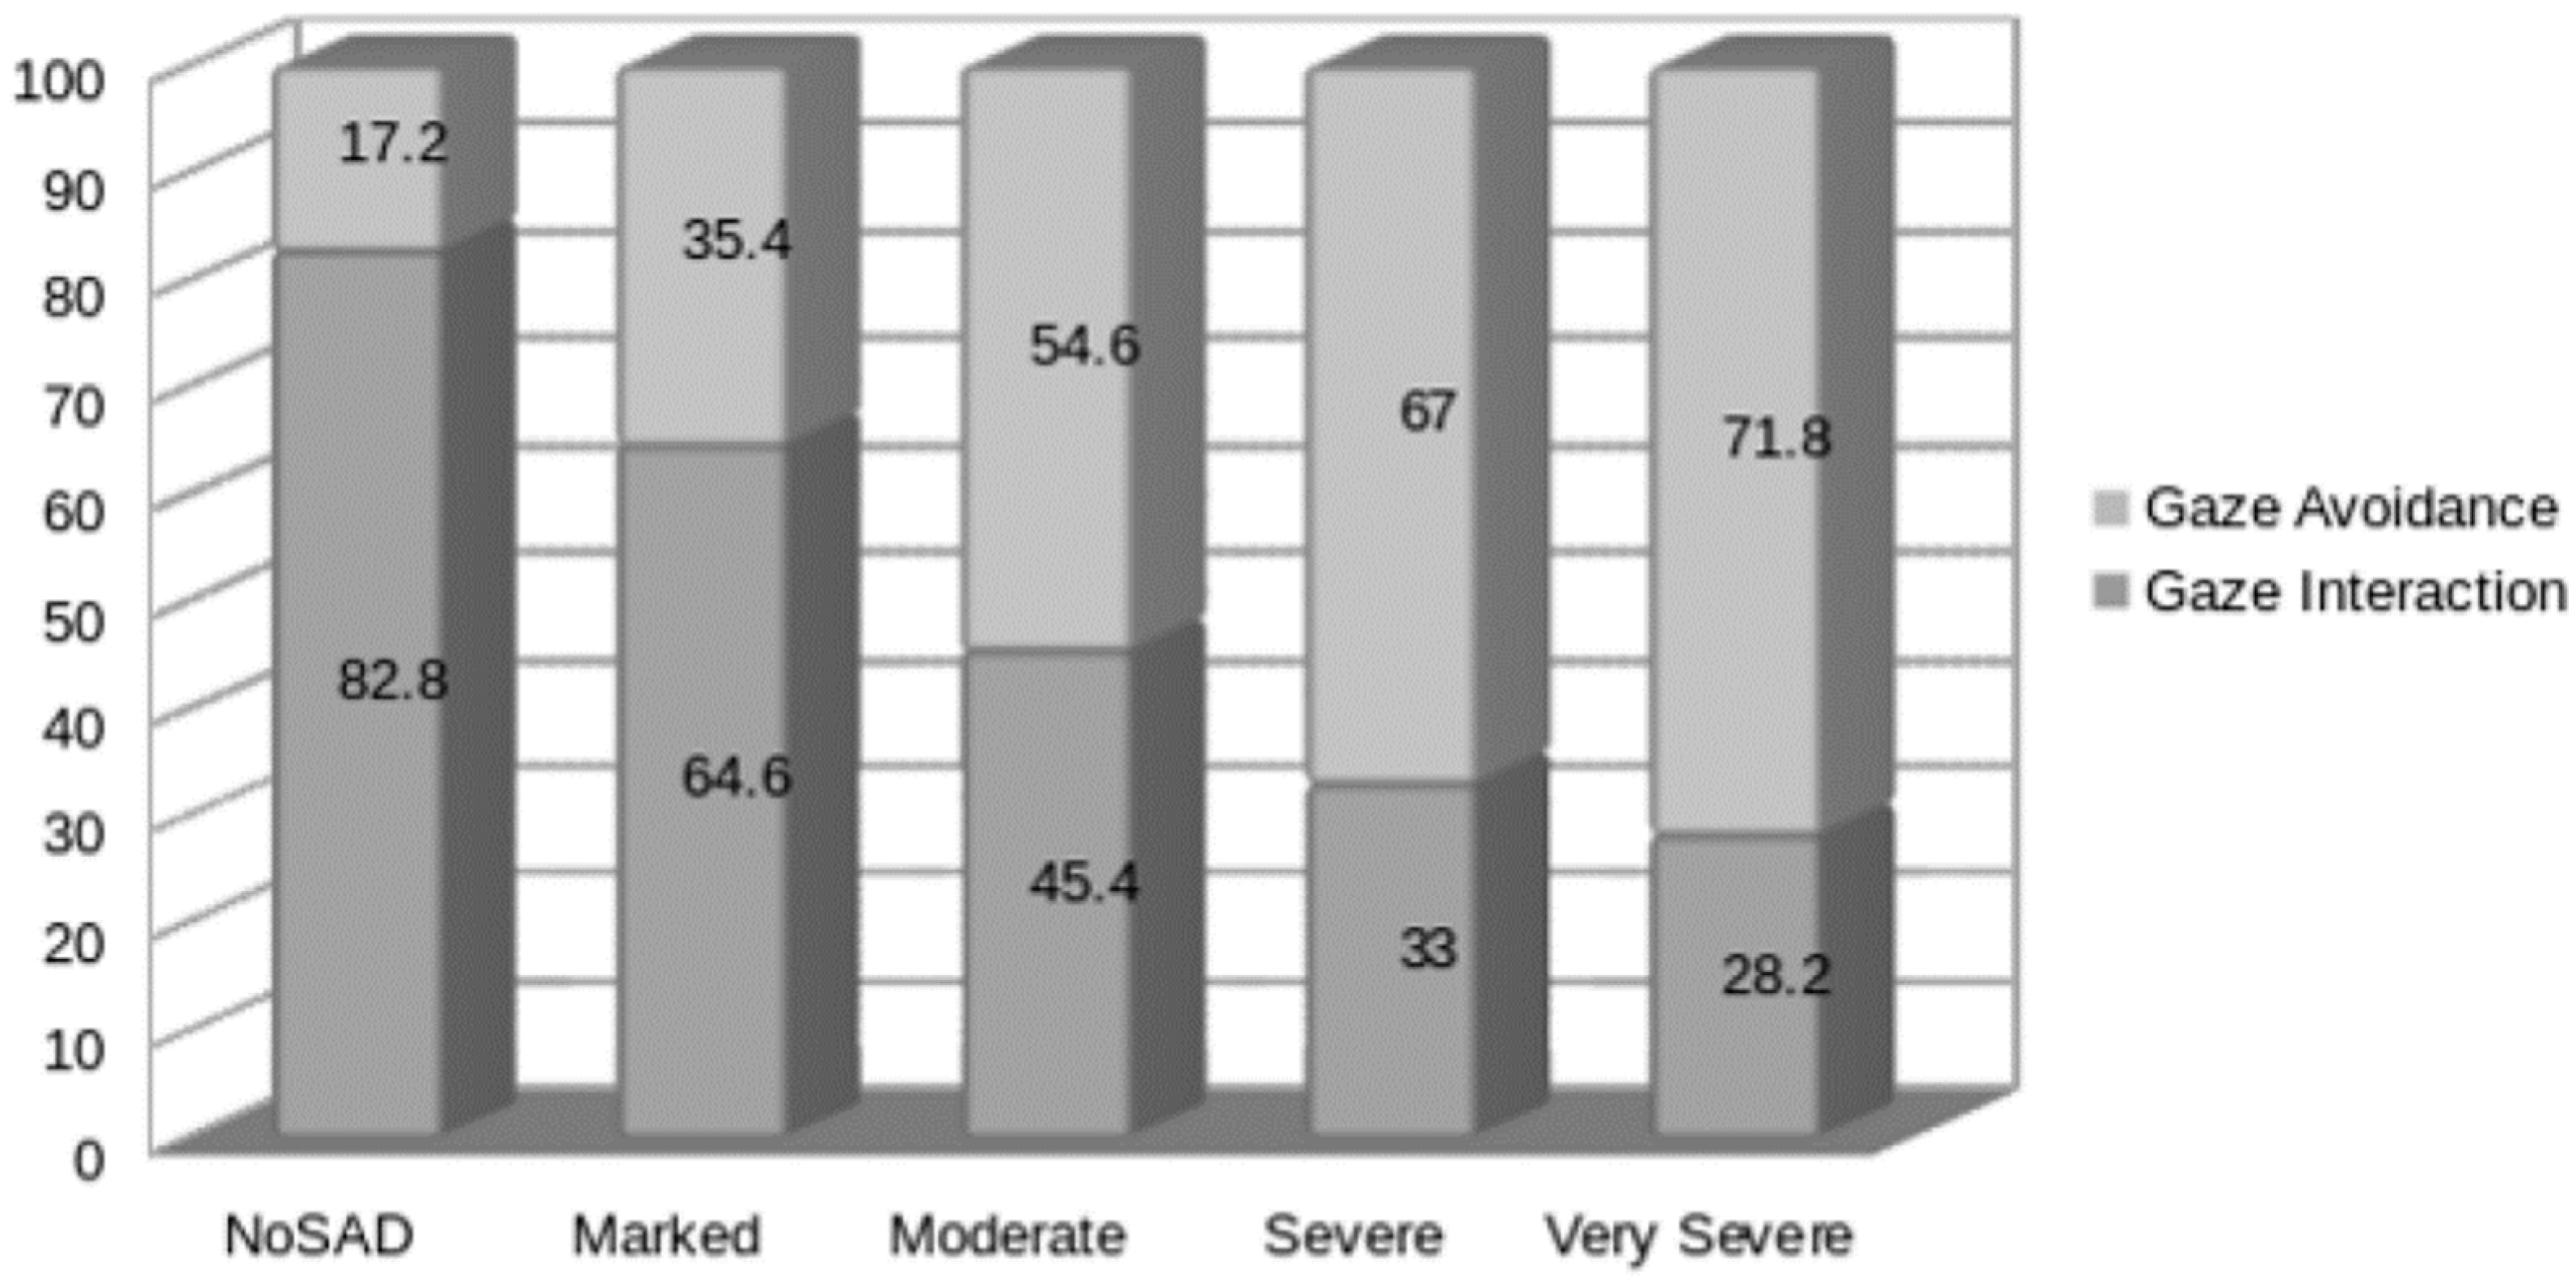
Figure 6 describes the relationship between SAD and the gaze interaction of female participants. The graph in
Figure 7 describes the relationship between SAD and the gaze interaction of male participants. From the results, the gaze interaction trend becomes negative as SAD class severity increases in both male and female cases. Thus, it can be said that the SAD prediction method, as described in this research, applies to all genders.
4.2. Is SAD Predictable via Gaze Avoidance sub-Behaviors?
The gaze avoidance data were further categorized into looking below, looking above, looking right, and looking left behaviors (c.f.
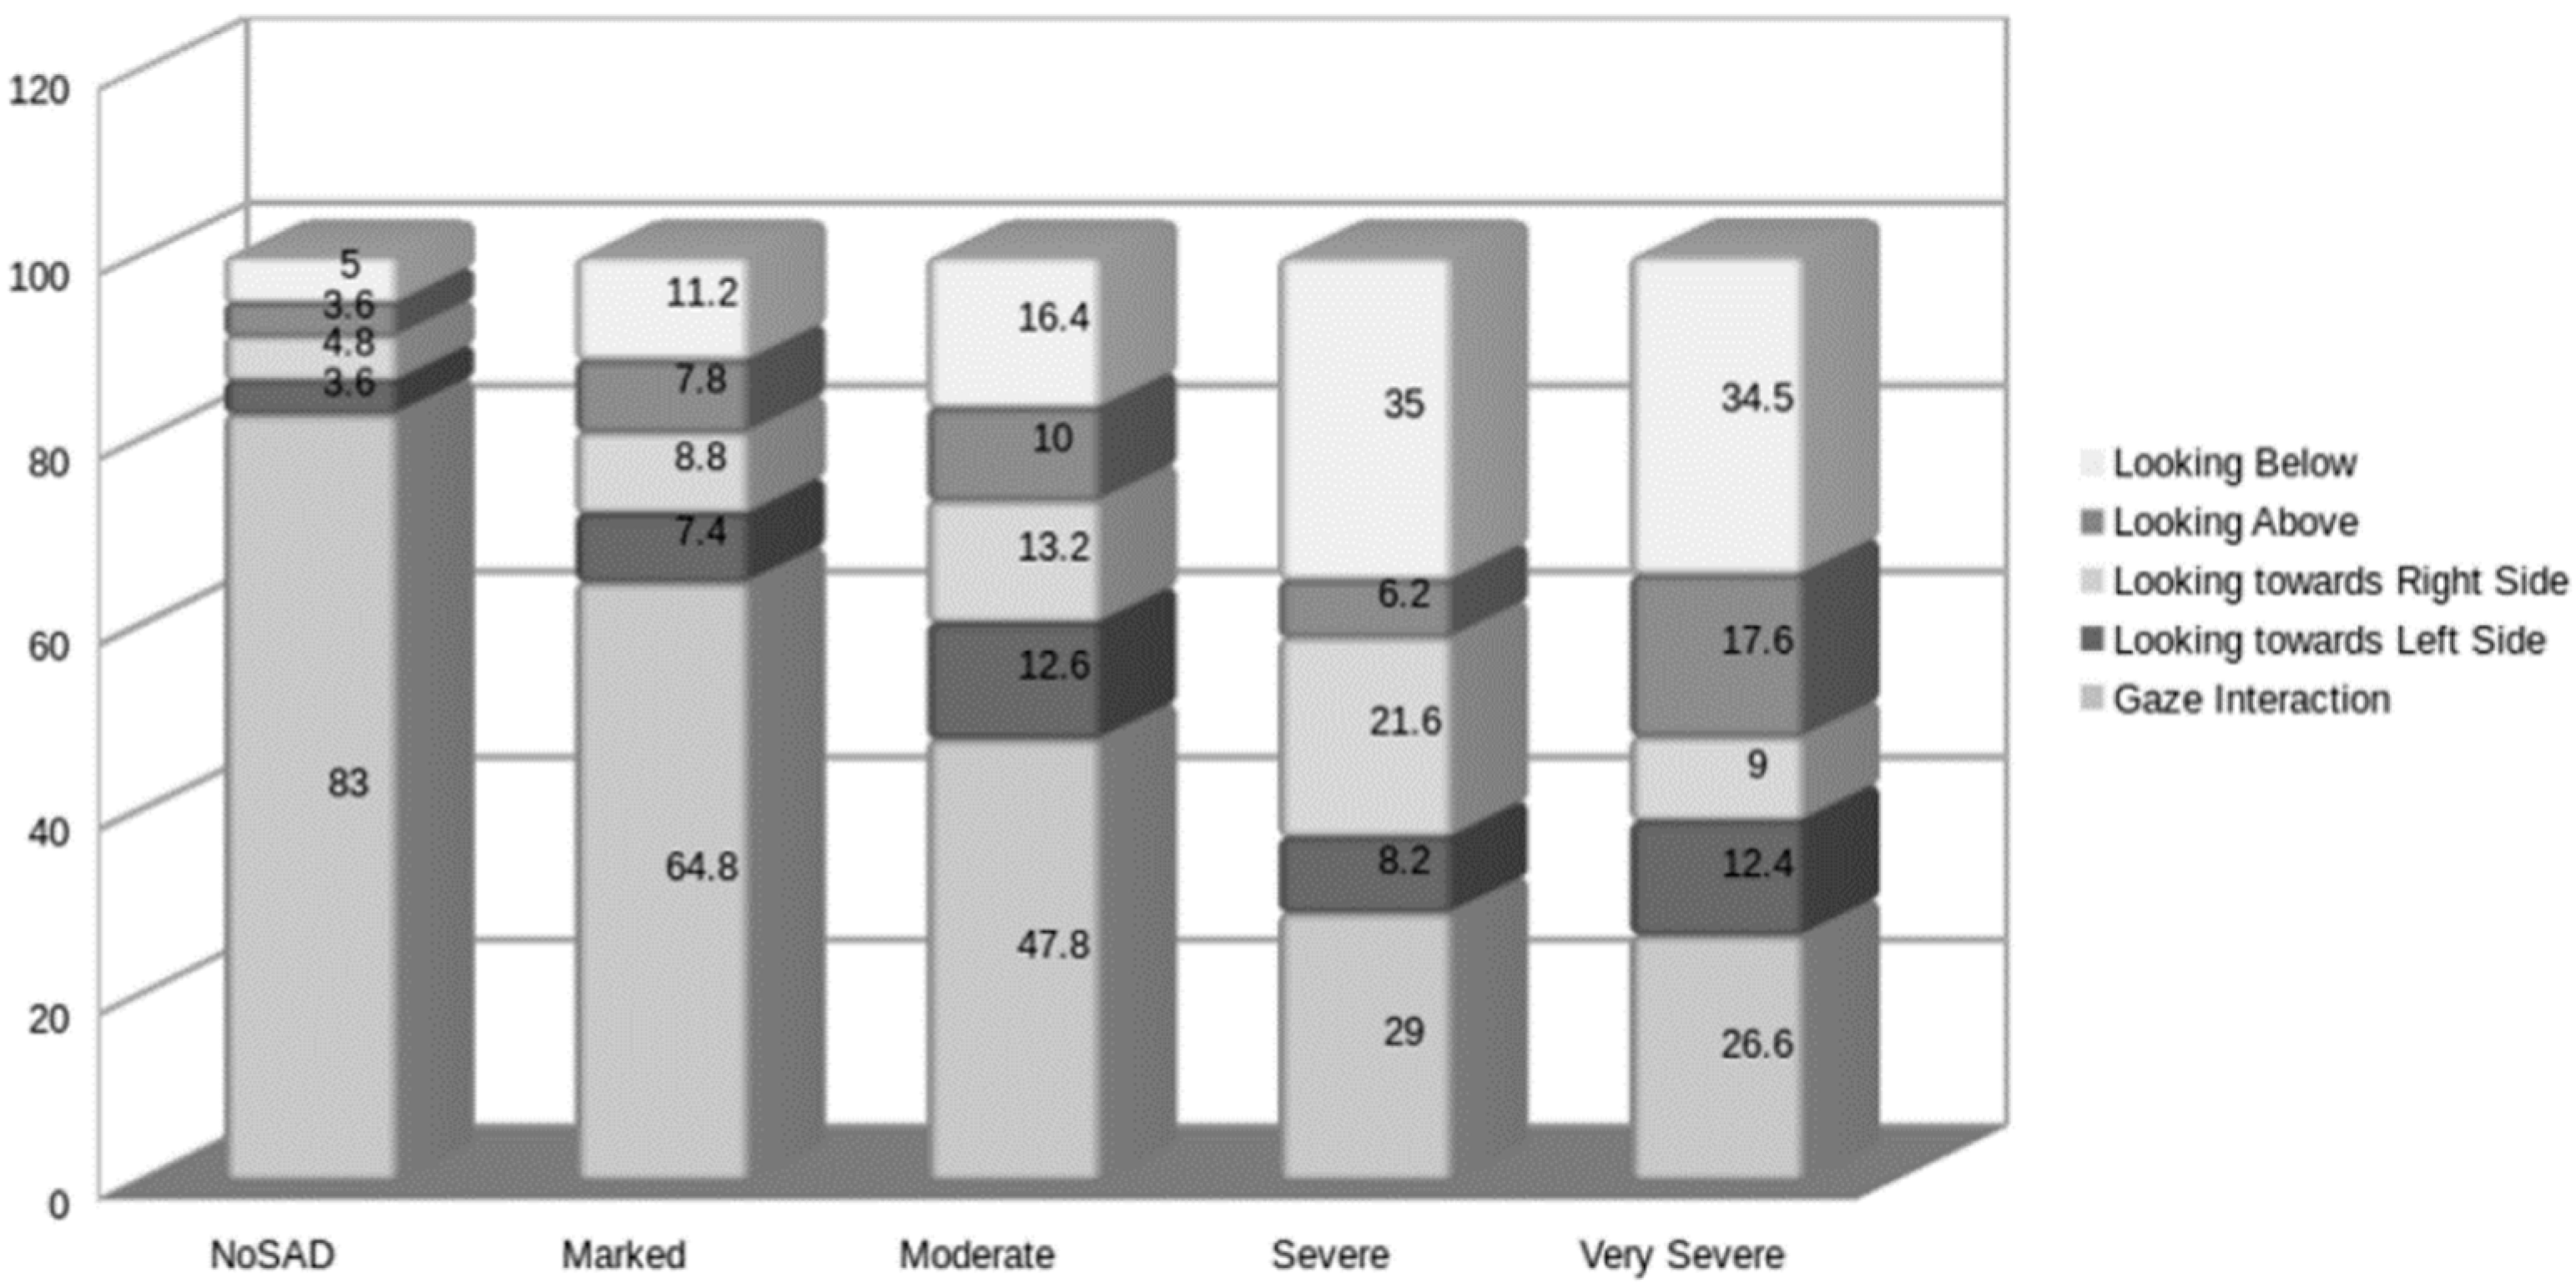
Section 3.4.). It was hypothesized that participants with SAD would show dominant looking-down behavior. This finding could give us a possibility of detecting SAD, even from a sub-behavior of gaze avoidance.
Figure 8 shows female gaze avoidance behavior further sampled into the four sub-behaviors. In the gaze avoidance category, 35%, and 34.47% of the sub behavior in ‘severe’ and ‘very severe’ participants were “looking below” behavior. Similarly,
Figure 9 shows male gaze avoidance behavior, which shows that looking below behavior intensity is lesser in males, i.e., 20% and 20.4% in case of severe and ‘very severe’ classes. However, this sub-behavior still forms major gaze avoidance behavior in males as well. A paired sample t-test conducted on the joint gender data showed a significant difference between looking below behavior and all other avoidance behaviors, as shown in
Table 4. Furthermore, all the participants showed this behavior with medium or large effect size as Cohen’s D column in
Table 4 shows.
Figure 8 and
Figure 9 also show the trend that as SAD class severity increases, looking below behavior also increases, which is not the case for all other gaze avoidance sub-behaviors. This is a sign that it might be possible to predict SAD by only looking below sub behavior, which in turn supports the hypothesis that looking below behavior is associated with SAD, as well as the severity of SAD.
4.3. SAD Prediction Using Gaze Interaction Dataset
A decision tree classifier was used to predict SAD. The decision tree does not require computationally intensive data processing as well as it does not require assumptions of the distribution of data. Similarly, this algorithm is useful for finding hidden patterns in a dataset. It can exclude unimportant features and its accuracy is comparable to other classification techniques [
43]. The data collection is simple with a non-normal distribution of data. Therefore, a decision tree classifier was used to predict SAD. The data were fed to the decision tree, which classified data into five classes (one No SAD class and four SAD classes).
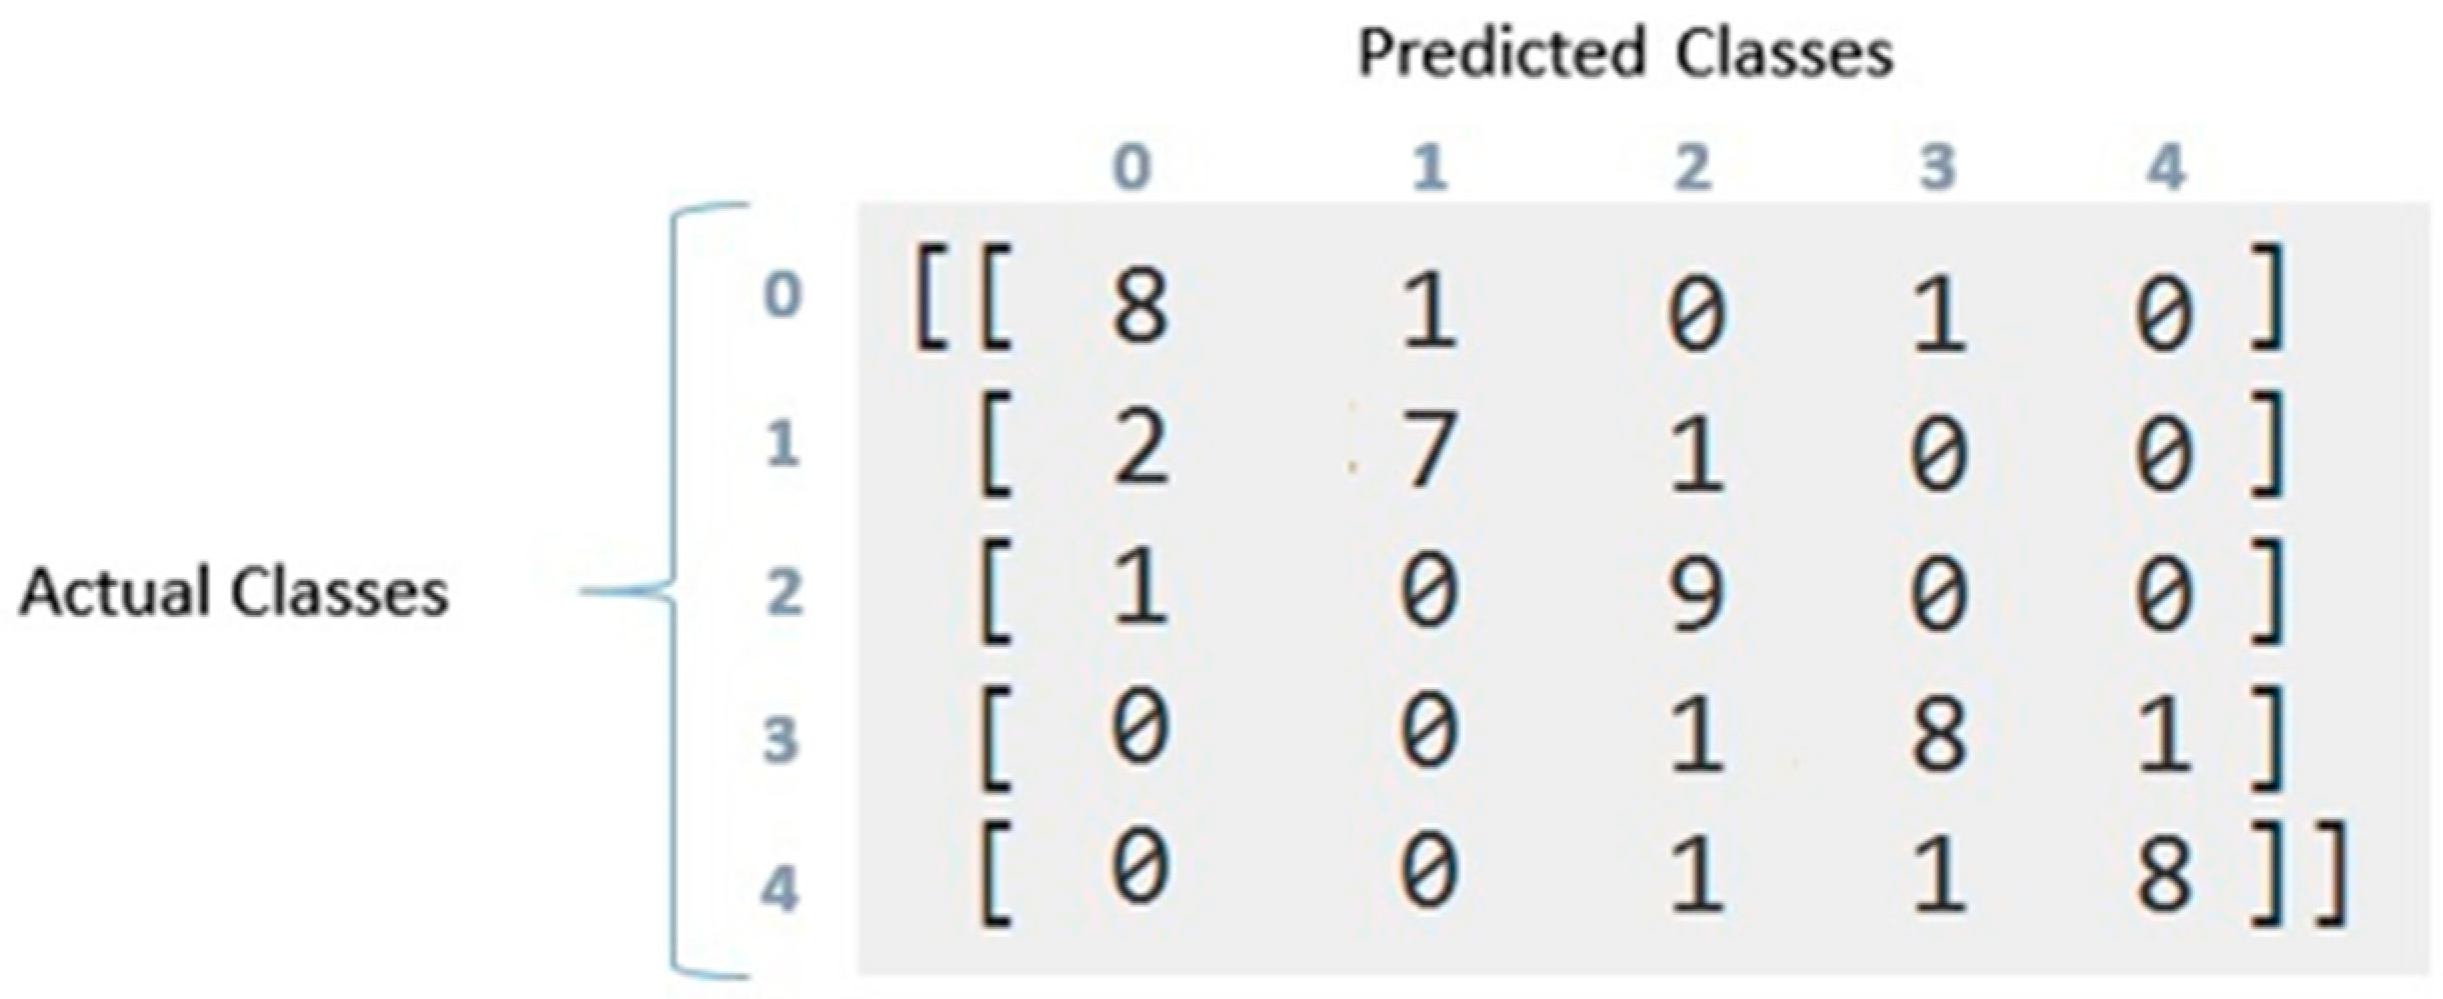
The classifier was used to predict an overall accuracy as well as to predict the accuracy of the sub-classes as well. The earlier literature only differentiated between the SAD group (A group of participants that have a social anxiety disorder) and the ‘No SAD’ group (A group of participants that have no social anxiety disorder). In this way, the sub-class classification was a novel process executed in this research. The results show that the overall accuracy of this method was 80%. The confusion matrix of the dataset prediction of SAD is illustrated in
Figure 10.
From the confusion matrix, the precision and recall scores were calculated as illustrated in
Table 5. As can be seen from the data in
Table 5, the recall percentage of ‘No SAD’, Marked, Moderate, Severe, and very severe groups were 80%, 70%, 90%, 80%, and 80%, respectively. The third column refers to recall, i.e., the percentage of total relevant results of each class that is correctly classified by the algorithm. The precision scores of ‘No SAD’, Marked, Moderate, Severe, and very severe groups were 73%, 88%, 75%, 80%, and 89%, respectively.
These results show that there is a possibility of replacing a subjective LSAS scale of SAD prediction with an objective method defined in this research with an accuracy of 80%. As shown earlier (c.f.
Section 2—Related Work), the subjective scale has many disadvantages, including a biased response from the participants that could affect the accuracy of the SAD prediction with the LSAS scale. There is a possibility of replacing that scale with the process described in this research. Otherwise, the process could be used along with the LSAS scale for a more correct assessment and prediction of SAD.
5. Conclusions, Implications, and Future Directions
This study investigated the possibility of automatic social anxiety disorder (SAD) prediction. The experiments were conducted in a live environment with human participants by using a custom-developed application. The application used the Haar Cascade classifier. SAD classes were predicted by using decision tree classifiers from the created gaze dataset. The results proved that SAD could be predicated with an overall accuracy of 80%. Furthermore, each class of SAD could be predicted with accuracies of 80%, 70%, 90%, 80%, and 80%, respectively. The possibility of replacing a subjective scale (LSAS) with an objective technique used in this research is discussed.
The results suggest that individuals with SAD make lower gaze interactions during a social situation conversation. The results also suggest that as SAD class severity increases, the gaze interaction decreases. This study contributed in the following ways: (1) detected gaze interaction automatically in a real-time conversation using a simple RGB camera, (2) annotation (labeling gaze in real-time) is done in terms of gaze interaction and gaze avoidance to find the relationship between SAD and gaze interaction, (3) pioneered in finding a relationship between gaze interaction and SAD classes, (4) we created first gaze dataset that could be used in future analyses of SAD individually or along with a combination of some other SAD symptoms.
Findings from the current study provide further support that individuals with elevated SAD are likely to engage in lower gaze interaction, which may have negative impacts on social functioning and contribute to the maintenance of SAD symptoms. Importantly, this support was derived using several novel methodological approaches that addressed weaknesses from earlier studies extending the external and ecological validity of this body of research. Our results confirmed that the larger trait of social anxiety severity was inversely associated with the frequency and duration of gaze interaction throughout the totality of a conversation task. Finally, our results supply implications for psychotherapy. Given that gaze interaction is an essential part of meaningful human interaction, actively targeting improvement in gaze interaction as a part of SAD treatment will likely increase the quality of life for SAD patients. It is also essential to consider the nature of the social stimulus (e.g., positive; ambiguous), duration, and CBT skill development stage when preparing in vivo exposures to boost positive corrective experiences and/or successful self-regulation.
The results of the current study should be viewed considering its limitations. The results of the study revealed that the female participants showed “looking below” behavior more than their male counterparts in each class, i.e., 5% as compared to 4.6% in the “No SAD” class, 11.2% vs. 7.4% in the “Marked” class, 16.4% vs. 14% in the “Moderate” class, 35% vs. 20% in the “Severe” class, and 35.5% vs. 20.4% in the “Very Severe” class. Therefore, there is a possibility of future research that decides whether this difference is a natural difference across the world, or if it is more associated with Asian culture generally and specifically in the Muslim world. Furthermore, there is a need to separate SAD from traditional shyness that is part of the eastern and Muslim cultures.
A relationship between gaze interaction with SAD classes was found with 50 participants (10 in each class). In the future, a larger sample size can be used to predict and deeply analyze the relationship between gaze and SAD within its classes. Arguably, bigger samples are essential for detecting existing relationships between self-reported indices. Overall, further expansion of this type of research to larger and more diverse samples will help in advancing the objective assessment of psychological disorders. Only a decision tree classifier was used for SAD prediction.
Table 6 and
Table 7 contain multi-class confusion matrix data for our SAD classes. The results of the tables could be used to filter out the 20% of the cases that might not be predictable from the data. However, to do that, there are only 5 features available in the present dataset to predict SAD. In the future work, kernel tricks method can be used to engineer more features to increase classification accuracy. In addition, more complex decision classifiers such as Random Forest can also be used to increase classification accuracy. The prediction can be evaluated using many other machine-learning algorithms (e.g., ANN, SVM, Bayes, etc.) for classification tasks to find the best one for the task.


 ,
, 


