Abstract
Autonomous navigation technology is the basis of underground crawler walking equipment automation. Based on research of the sector laser pose parameter detection method, a pose detection system based on a cross laser is proposed. The mathematical model between pose parameters, laser receiver measurement data and tilt sensor measurement data is established by vector algorithm and the expression of key pose parameters is deduced. This paper studies the deviation correction control strategy of crawler walking equipment and puts forward the point deviation correction control strategy based on roadway excavation technology. Firstly, the end position of the path is determined according to the initial pose of the roadheader. Then, Bessel curve is used to plan the path between the starting point and the endpoint, and the pure tracking algorithm is used to track the planned path. The measurement errors of X and Y coordinates and yaw angle of roadheader within 10 80 m shall not exceed 10 mm, 32 mm and 0.65°. Using the point deviation correction strategy, the positioning error of the roadheader at the end of the path is less than 13 mm, and the yaw angle error is less than 0.16°. In the deviation correction process, the maximum angular velocity of the roadheader is 0.07 rad/s, which is less than 0.82 rad/s of the conventional deviation correction strategy. The results show that the point deviation correction strategy can not only ensure the accuracy of motion control, but also improve the stability of equipment motion.
1. Introduction
Coal is a large part of the global energy mix and an important primary energy [1,2,3,4,5,6]. The mining environment of underground coal mine is poor and even dangerous. The rapid development of new industries, such as the new energy, new materials and information industries, has absorbed a large number of talents, and hence impacted employment within the coal industry. The coal industry brain drain phenomenon has gradually emerged, and new talent is insufficient [7]. Therefore, intelligent coal mining is not only helpful to improve the efficiency of coal mining and improve the working environment of workers, but also to cater for the need for sustainable development in the coal industry [8,9,10,11].
Heavy equipment, such as roadheader and continuous miners, moves by crawler. The automation of crawler walking equipment is the key to realize the intellectualization of roadway excavation, and the autonomous navigation system is the foundation of the intellectualization of crawler walking equipment. Crawler walking equipment navigation technology includes two aspects: real-time detection of equipment pose and automatic deviation correction control. The former is the basis of the latter [12].
M. Wu [13] applied the space intersection measurement technology to the measurement of the pose parameters of the roadheader and simulated the working environment of the roadway for simulation analysis. R. Li [14] proposed a pose parameter detection system of roadheader based on a fan laser. H. Chen [15] proposed a laser receiver spot location algorithm based on window scanning, frequency domain filtering and window scanning, which indirectly improves the detection accuracy of pose parameters. Y. Tao [16] proposed a single-station multi-point time-sharing attitude measurement method based on IGPS and designed an experimental system to verify the accuracy of the method. S. Fu [17] applied ultra-wideband positioning technology to the pose detection of the roadheader body and proposed a detection method of the pose parameters of the roadheader based on ultra-wideband ranging. Y. Du [18] proposed a visual positional detection method based on a double cross laser. W. Yang [19] proposed a situation as a whole positioning method of roadheader based on a parallel laser beam. By analyzing and processing the two-point and three-line images formed by the laser pointer, the attitude of the equipment is obtained by using the spatial solution algorithm. K. Zhang [20] proposed a pose detection method based on roof vision. Through the image preprocessing of the roof, the roof target is identified, and the features are extracted. Then, the pose of the roadheader is solved by PNP algorithm. Y. Tian [21] proposed an inertial navigation positioning method for Roadheader Based on zero speed correction. J. Yang [22] proposed a vision/odometer/inertial navigation dynamic pose integrated measurement method and corrected the measurement value of inertial navigation/odometer with reference to the vision measurement results. Yan [23] proposed a pose detection method of roadheader based on multi-sensor fusion, and on this basis, studied the automatic cutting method of arbitrary roadway sections.
Zhang [24] proposed an autonomous deviation correction method for roadheader based on a regional grid. X. Zhang [25] studied the directional correction principle of the roadheader in the roadway and established the directional correction model of the roadheader. The trajectory tracking controller is designed based on Lyapunov function, and the trajectory tracking problem of roadheader is solved by the backstepping method. J. Yang [26] modelled the random constraint environment of the correct path of the roadheader and classified the orientation correction problem of the roadheader as a general random network problem. The road random mesh network model is defined, and the genetic mutation particle swarm optimization algorithm is used to optimize the target path. The simulation results show that the convergence speed and accuracy of this algorithm can meet the requirements of directional correction path planning.
By studying the method of detecting the pose parameters of a fan-shaped laser, a capstan navigation system based on a cross laser is proposed, improving the safety and reliability of the device downhole without reducing the effective service distance. The spatial solution model of pose is established, and the capstan azimuth correction strategy using tunnel technology is studied, improving the smoothness of the anchor digger movement during deflection.
2. Materials and Methods
2.1. Pose Parameter Detection Method
The pose detection subsystem is composed of a laser emitter, three laser receivers, a laser ranging sensor, a biaxial tilt sensor and an industrial computer, as shown in Figure 1. The transverse laser emitter is arranged on the top of the tunnel, and the laser receiver, distance measuring sensor and tilt sensor are arranged on the roadheader body. The position coordinates of the spot projected on the laser receiver will also change accordingly when the roadheader is twisted or moved. The change of the spot coordinates is detected by the laser receiver and sent to the industrial computer as the data source for pose calculation.
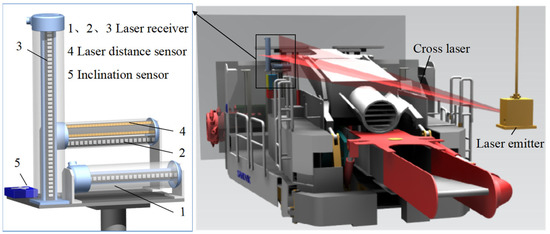
Figure 1.
Pose detection method.
R. Li [14] proposed a plane solution method, which assumes that the roadheader moves on an ideal horizontal plane. However, under actual working conditions, the roadheader does not always move on the horizontal plane. The uneven road surface will cause the roadheader to tilt, and the pitching and rolling motion of the roadheader will also cause the point coordinates of the laser receiver to change. Using the plane algorithm to calculate the pose parameters will produce errors. Therefore, it is necessary to study the spatial algorithm of roadheader yaw angle and lateral offset. For example, a laser receiver can be subject to analysis, as shown in Figure 2.
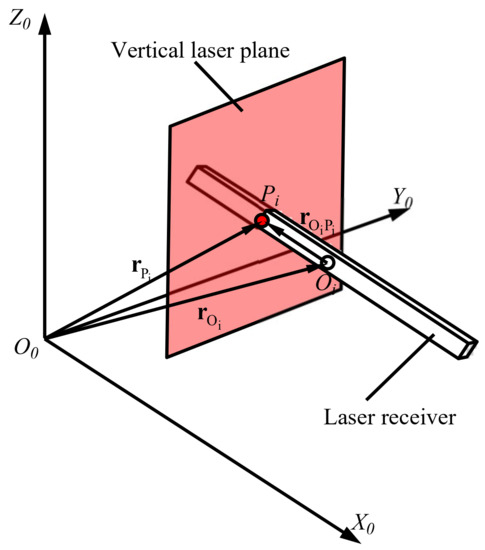
Figure 2.
Principle of pose parameter space algorithm.
O0X0Y0Z0 is the reference coordinate system; point O is the center of the laser receiver; point P is the center of the laser spot and rO and rP are the coordinate vectors corresponding to point O and point P, respectively. They are also the relative coordinate vectors from point O to point according to the vector algorithm:
The coordinate vector rP obtains the coordinate vector by calculating the intersection of the laser plane and the straight line where the laser receiver is located. While the expression of the laser plane is determined by the mounting direction and position of the laser emitter, the expression of the straight line where the laser receiver is located is determined by the attitude parameters of the roadheader body and the installation mode of the laser receiver. The coordinate vector rO can be obtained by left multiplying the coordinate vector in the roadheader coordinate system (depending on the installation direction of the laser receiver) by the direction cosine matrix from the roadheader coordinate system to the reference coordinate system. The coordinate vector rOP may be obtained by multiplying the measured value of the laser receiver by its direction vector. Since there are three laser receivers, three matrix equations can be established, and the lateral offset (X-axis coordinate), altitude offset (Z-axis coordinate) and yaw angle of the roadheader can be obtained [27].
Herein, a, b and c denote the mounting positions of the laser receiver ① on the roadheader, and a3, b3 and c3 denote the mounting positions of the laser receiver ③ on the roadheader. L0 is the front rear distance between the laser receivers ① and ②. H0 is the height difference between the two laser receivers. d1, d2 and d3 are the measured values of the laser receivers ①, ② and ③. β and γ are the pitch angle and roll angle measured by the tilt sensor, respectively.
2.2. Automatic Deviation Correction Control Strategy
At present, the deviation correction strategy of the roadheader is to track the roadway centerline as the target path. Tracking accuracy and speed are the evaluation criteria of tracking algorithms. However, through the analysis of the tunneling technology, it is found that the coal wall will be cut only when the roadheader reaches the end position, while the coal wall will not be cut during the forward movement of the roadheader. Therefore, the forming accuracy of the roadway section has nothing to do with the position accuracy of the roadheader during driving but is related to the pose of the roadheader at the endpoint (i.e., the starting point of the next driving cycle).
In addition, the weight of the roadheader is much larger than that of the traditional mobile robot. Therefore, in the process of correcting the deviation, the control input should be reduced as much as possible to improve the smoothness of the tracking track and the stability of the roadheader body motion. In this paper, the control strategy of point position deviation correction is proposed to ensure the accuracy of deviation correction and improve the stability of roadheader movement in the process of deviation correction. The point deviation correction control strategy includes the three steps: the determination of the starting point and endpoint; path planning from the starting point to the endpoint and tracking of the the planned path.
(1). Determine the starting point and end point;
(2). Path planning from the starting point to the end point;
(3). Track the planned path.
2.2.1. Prediction Method of the Driving Cycle EndPoint
The starting point and endpoint of motion control must be determined before the roadheader body is automatically calibrated. The starting point is the center coordinate of the roadheader body at the initial position of the cycle, which can be measured by the pose detection system. However, the selection of the endpoint needs to consider the requirements of the roadheader motion stability during the deviation correction process, and avoid large changes in the angle speed of the roadheader.
In this paper, we propose a path endpoint prediction method based on the initial state. The basic principle of this method is to predict the end position according to the position and angle of the roadheader at the starting point, and to predict the end position without control input. If the position deviation of the prediction point is less than the initial deviation, the prediction point is set as the endpoint of the cycle. If the deviation of the predicted point is larger than the deviation of the starting point, the endpoint of the cycle is set on the roadway centerline. If the starting point deviation is too large, the roadheader deviation can be corrected in stages within multiple driving cycles. The predicted deviation is less than the initial deviation (|e1| ≤ |e0|).
- (1)
- The predicted deviation is less than the initial deviation (|e1| ≤ |e0|)
As shown in Figure 3, O0 is the starting point of the roadheader in the ideal state, O1 is the endpoint of the roadheader in the ideal state, located on the Y axis, and its y coordinate is the distance of the driving footage of each cycle. P0 is the actual starting point, that is, the current position of the roadheader; α0 is the yaw angle of the roadheader at the starting point and e0 is the deviation of the body position of the roadheader at the starting point. Furthermore, P1 is the endpoint predicted according to the pose of the roadheader at the starting point; e1 is the deviation of the prediction point and Lc is the driving cycle footage.
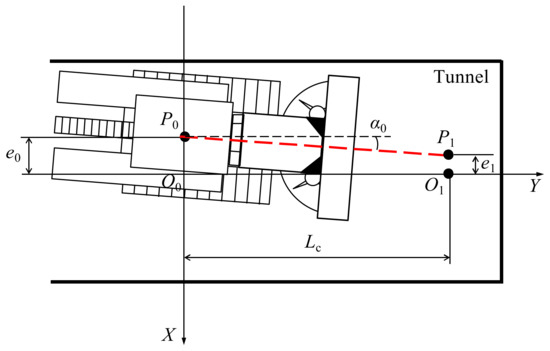
Figure 3.
The starting point and endpoint when |e1| ≤ |e0|.
The position deviation of the roadheader is indicated to tend to decrease by|e1| ≤ |e0|. In order to stabilize the movement of the roadheader, the control input should be reduced as much as possible. The initial speed and direction of the roadheader remain unchanged and the forward travel distance Lc reaches the point P1. If this point is set as the endpoint, the coordinates of the endpoint are (e0-Lctan α0, Lc).
- (2)
- The predicted deviation is greater than the initial deviation, and the initial deviation is less than the maximum deviation correction amount (|e1| > |e0| and |e0| ≤ [e]).
When the lateral (X-axis) deviation at the starting point is large, if you try to eliminate the lateral deviation within a driving cycle, it may affect the flatness of the roadway. Defining [e] as the maximum adjustment amount allowed for a single drive cycle, signifies [e] as the X-axis difference between the start and end of the cycle. Since |e0| ≤ [e] indicates that the starting point deviation of the roadheader at the starting point is small, the roadheader position deviation can be adjusted to zero within one cycle. In fact, |e1| > |e0| indicates that the position deviation of the roadheader continues to increase. At this time, the target point P1 is set on the Y-axis with coordinates (0, Lc), as shown in Figure 4.
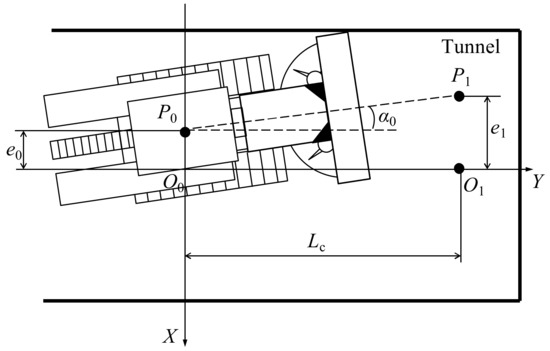
Figure 4.
The starting point and endpoint when |e1| > |e0| and |e0| ≤ [e].
- (3)
- The predicted deviation is greater than the initial deviation, and the initial deviation is greater than the maximum correction amount (|e1| > |e0| and |e0| > [e]).
While e1 > e0 indicates that the position deviation of the roadheader continues to increase, |e0| > [e] indicates that the deviation of the anchor point of the windlass at the anchor point is large, which is not suitable for eliminating the lateral deviation of the roadheader in a driving cycle. If the maximum allowable adjustment amount in a single cycle is [e], then the coordinate of the trajectory endpoint P1 is (e1 ± [e], Lc). When e1 is greater than zero, the negative sign is taken and when e1 is less than zero, the positive sign is taken, as shown in Figure 5.
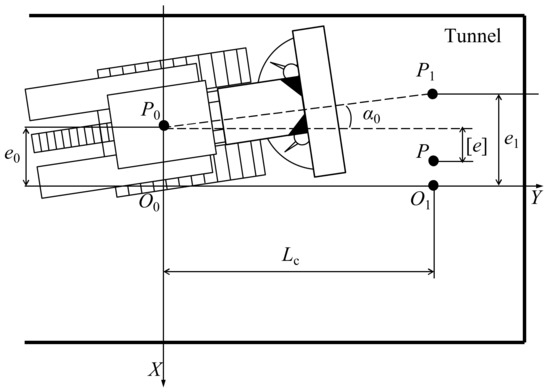
Figure 5.
The starting point and endpoint when |e1| > |e0| and |e0| > [e].
2.2.2. Path Planning Research
The main research aim is to generate a path from the starting point P0 to the endpoint P1 of the driving cycle, which satisfies the kinematic constraints, as a reference for driving the body motion of the roadheader. To ensure that the path is feasible, the following constraints should be met [28]:
The first derivative of the path curve function is continuous.
The tangent of the starting point on the path is consistent with the initial speed direction of the roadheader, and the tangent direction of the endpoint on the path is consistent with the roadway centerline (i.e., Y axis).
The curvature of each point on the path should be continuous and bounded.
The trajectories satisfying the above conditions include plane curves, such as polynomial fitting curves and Bezier curves.
Polynomial Fitting Path
If the above constraint conditions are to be met, at least cubic polynomial curve shall be used. The general formula of a polynomial is:
The classification and discussion according to different cycle endpoints are as follows:
- (1)
- |e1| ≤ |e0|
At this time, the target point P1 is set on an extension line in the initial speed direction. Clearly, the planned path is a straight line, starting from P0 and ending at P1. The curve equation is:
- (2)
- |e1| > |e0| and |e0| ≤ [e]
As shown in Figure 6, the target path is a cubic polynomial curve connecting the start point P0 and the endpoint P1.
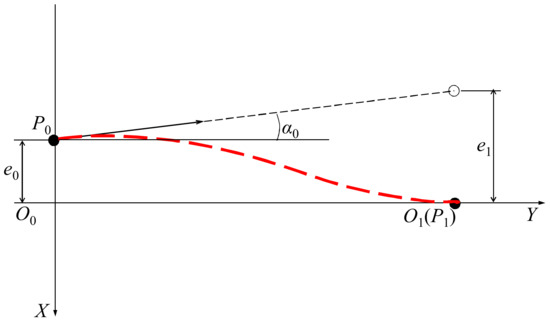
Figure 6.
The cubic polynomial path when |e1| > |e0| and |e0| ≤ [e].
According to the constraint conditions, the polynomial boundary conditions are:
The first two constraints represent the position constraints of the roadheader at the starting point and the endpoint, respectively. The last two constraints represent the orientation constraints of the roadheader at the start and endpoints. In order to avoid the attitude sudden change of the roadheader when stared, the tangent vector of the start point is consistent with the direction of the initial speed. In order to correct the heading of the roadheader, the tangent vector at the endpoint is consistent with the Y axis.
By substituting the boundary condition (5) into the general Formula (4), the coefficient can be obtained
- (3)
- |e1| > |e0| and |e0| > [e]
As shown in Figure 7, the solution of the curve equation is similar to the second case, and the boundary conditions are:
By substituting the boundary condition (7) into Equation (4), the coefficients can be obtained
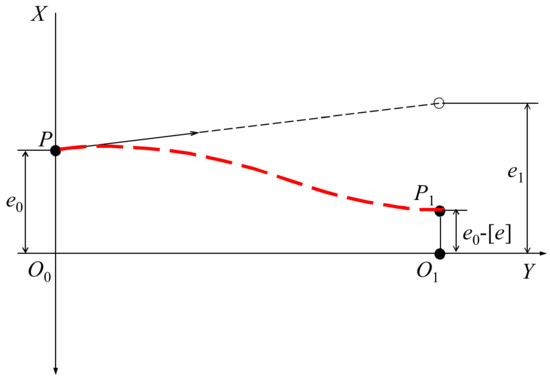
Figure 7.
The cubic polynomial path when |e1| > |e0| and |e0| > [e].
The Bezier Curve Path
The Bezier curve is a two-dimensional curve obtained by a recursive method according to the positions of starting point, endpoint and control point. The shape of the Bezier curve can be changed by adjusting the position of the control points. The n control point corresponds to the Bessel curve of order n − 1. The third-order Bessel curve has the following important characteristics: the derivative of the curve at t = 0 is the same as the slope (derivative) of P0C1, and the derivative at t = 1 is the same as the slope (derivative) of C2P1. Therefore, the third-order Bessel curve meets the requirements of path planning.
The third-order Bezier curve needs two control points, C1 and C2. Adjusting the distances from the control points (C1 and C2) to the starting point and the endpoint changes the shape of the curve accordingly. The distance from the control point to the starting point (endpoint) is defined as KsLc, where Lc is the driving cycle footage and Ks is the shape coefficient of Bessel curve, which is taken from 0 to 1. Different shape coefficients correspond to different curve shapes. The classification and discussion according to different cycle endpoints are as follows:
- (1)
- |e1| ≤ |e0|
The yaw angle of the roadheader at the start point on the target path is the same as that at the endpoint.The Bezier curve degenerates into a straight line, and the target path is a straight line between the start point P0 and the endpoint P1.
- (2)
- |e1| > |e0| and |e0| ≤ [e]
In order to meet the requirements of the automatic deviation correction trajectory constraint of the roadheader, the control point C1 is selected on the tangent of the curve starting point, that is, the extension line of the initial speed direction. The control point C2 is selected on the tangent line at the end of the curve, that is, on the Y-axis, as shown in Figure 8.
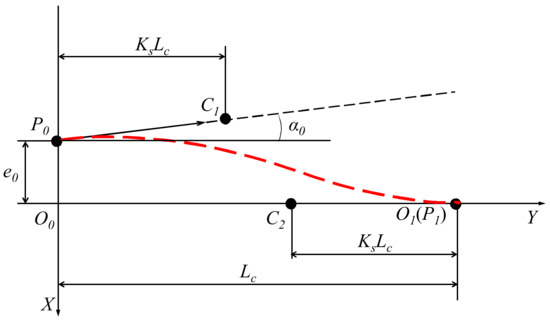
Figure 8.
Planning path of third-order Bessel curve when |e1| > |e0| and |e0| ≤ [e].
The start and end coordinates are P0(e0,0) and P1(0,Lc), respectively. The distance between the control point C1 and the starting point P0, and the distance from control point C2 to endpoint O1 are KsLc. The coordinate of the control point is (C1 (K = Lc,e0 + KsLctanα0), C2 (Lc − KsLc,0)).
- (3)
- |e1| > |e0|and|e0| > [e]
Similarly to the second case, the control point C1 is selected on the tangent of the curve starting point, that is, the extension line of the initial speed direction. The control point C2 is selected on the parallel line between point P1 and the Y axis, as shown in Figure 9.
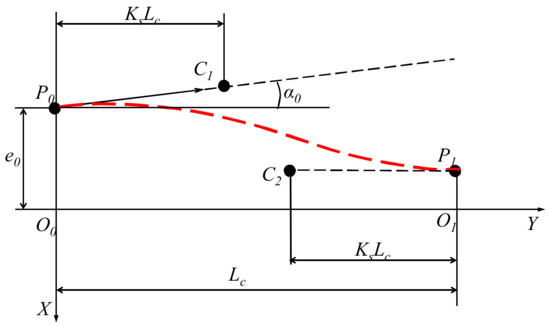
Figure 9.
The planning path of the third-order Bessel curve when |e1| > |e0| and |e0| > [e].
The coordinate of the control point C2 is (Lc − KsLc, e0 ± [e]), and the rest is the same as the second case.
2.2.3. Research on the Trajectory Tracking Algorithm
Trajectory tracking control methods include the PID tracking model, the pure tracking model and the neural network. The PID tracking control algorithm is relatively mature, but the optimal control parameters are complex, and it is difficult to obtain the optimal parameters under complex conditions. The neural network control algorithm needs to collect a large number of samples for training and verification, which is difficult to realize [29]. The pure tracking algorithm adopts the preview following principle, and the tracking process is very smooth, which meets the requirements of the windlass deviation correction for stability. To sum up, this paper uses the pure tracking algorithm to track the planned path.
The pure tracking algorithm works via the curvature of the computer body moving from the current position to the target point, as shown in Figure 10. Firstly, a target point is selected, which is located at a certain distance in front of the roadheader. The target trajectory is discretized to obtain the tracking target point sequence Gk (xgk′,ygk′) k = 1, 2, 3 ……. X0O0Y0.Figure 10 represents the roadway coordinate system, and XBOBYB represents the roadheader coordinate system. G is an arbitrary target point on the planning path, and (xg,yg) is the coordinate of the target point in the roadheader coordinate system. The yaw angle is α, φ is the angle at which the roadheader rotates from the current point OB to the target point G along the arc and Lfc is the preview distance.
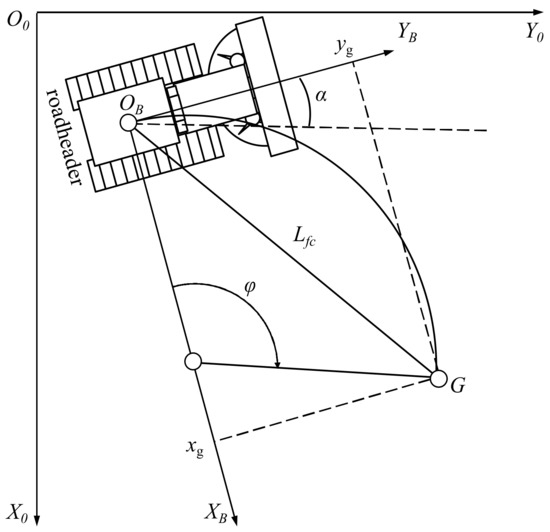
Figure 10.
The pure-pursuit algorithm.
Assuming that the roadheader moves on a plane, the motion curvature of the roadheader body can be defined as the reciprocal of the distance from the center of the body to the instantaneous rotation center, and the sign is opposite to the sign of the motion radius. This entails taking the negative sign in the clockwise direction, and taking the positive sign in the reverse direction. The curvature also represents the instantaneous change of the relative movement distance in the roadheader direction, as shown in Equation (9) [30].
It must be established that the coordinate system XBOBYB is attached to the roadheader, and the YB axis is consistent with the movement direction. The instantaneous center is always located on the XB axis in the roadheader coordinate system. According to the pure tracking control strategy, the curvature of the roadheader at the current position is equal to the radius of the fitting arc from the current point to the target point, and the distance from the target point to the current point becomes the preview distance [31]. The arc is a tangent to the YB axis, so the coordinates of the target point in the roadheader body coordinate system can be calculated by the following formula:
where φ is the angle that the roadheader body turns from the current point to the target point along the arc and ρsp is the curvature of the current point.
The preview distance can be calculated by the following formula:
In accordance with (11) and (12), the roadheader body angle, is:
It should be noted that xg and yg are local coordinates under the roadheader body coordinate system, and the target point sequence is the global coordinates under the roadway coordinate system. Therefore, it is necessary to convert the global coordinates into local coordinates, that is
where α is the yaw angle and (x,y) is the current position coordinate of the windlass body.
The state update equation of motion is:
where ak is the acceleration, which can be calculated by the following formula
where vg is the target speed, vk−1 is the current speed and K is the speed gain.
3. Results
3.1. Simulation Analysis Results
Through setting different parameters, the deviation correction characteristics of the roadheader under the initial conditions can be simulated and analyzed. The difference between the point deviation correction control strategy and the traditional deviation correction strategy is compared. The simulation parameter settings are shown in Table 1.

Table 1.
Simulation parameter settings.
As described above, the selection of the endpoint of the driving cycle is related to the pose of the roadheader body at the starting point. When the deviation of the prediction point is smaller than the initial deviation (i.e.,|e1| ≤ |e0|), the target path is a straight line between the starting point and the prediction point. When the deviation of the prediction point is greater than the initial deviation (i.e., |e1| > |e0|), the target path is a cubic polynomial curve or a Bezier curve. If the lateral deviation of the roadheader at the starting point is greater than the maximum adjustment amount of a single driving cycle, it is necessary to gradually correct the position deviation of the roadheader in multiple driving cycles. The deviation correction strategy in each driving cycle is basically the same as when |e1| > |e0| and |e0| ≤ [e]. Therefore, this section only analyzes |e1| > |e0| and |e0| ≤ [e].
3.1.1. Analysis of Path Smoothness and Deviation Correction Accuracy
Figure 11 is a track of the roadheader center under the point position correction strategy and the conventional correction strategy. The conventional deviation correction strategy takes the roadway center line as the target path to track. The point correction strategy uses a polynomial curve or a Bezier curve as the tracking target path, as can be seen from Figure 11.
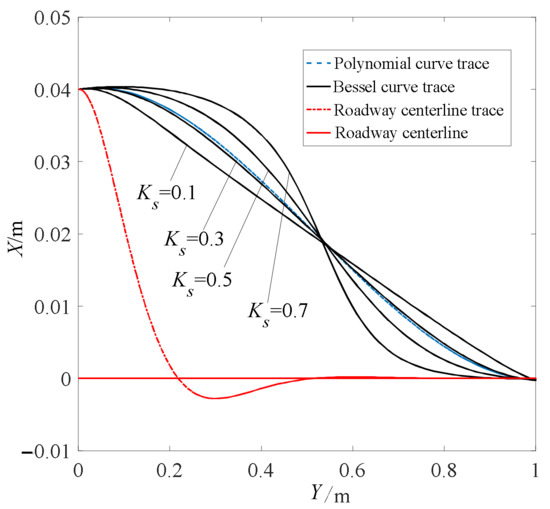
Figure 11.
A comparison of the tracking trajectories of different planning paths.
When tracking the center line of the road, the pure tracking algorithm appears to “overshoot”, and the smoothness of the tracking is poor.
When the planning path is a Bezier curve or polynomial curve, the tracking is relatively smooth. By adjusting the shape coefficient Ks of a Bezier curve from 0.1 to 0.7, the shape of the tracking track will change accordingly. The smaller the shape coefficient, the larger the curvature of the tracking at the starting point and the endpoint, and the smaller the curvature in the middle. On the contrary, the larger the shape coefficient, the smaller the curvature of the trajectory at the start and endpoints, and the larger the curvature in the middle.
The preview distance is an important parameter of the pure tracking algorithm. The larger the preview distance, the smoother the =tracking, but the larger the tracking error. The smaller the preview distance, the more accurate the trajectory tracking is, but the stability is poor. In order to analyze the influence of the pre-sighting distance on the stability of the tracking trajectory, the pre-sighting distances of 0.1 m, 0.3 m and 0.5 m were taken to compare the trend of the different curves. The analysis results are shown in Figure 12.
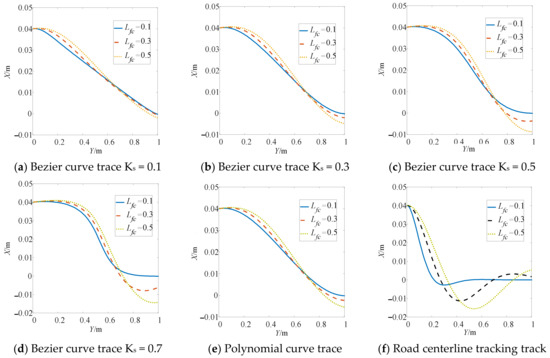
Figure 12.
A comparison of tracking trajectories to different lookahead distances.
As can be seen from Figure 12, for target paths such as a Bezier curve, cubic polynomial or road centerline, with the increase in preview distance the curvature of each point on the tracking track curve becomes smaller and the tracking becomes smoother.
The greater the preview distance, the greater the X coordinate of the roadheader at the endpoint (i.e., the lateral offset of the roadheader). By comparing the tracking trajectories at different pre-sighting distances, it can be seen that the error at the endpoint is significantly larger for a pre-sighting distance of 0.5 m than for the other two values with the same coefficient, so the preview distance Lfc ≤ 0.3 m is more appropriate.
3.1.2. Roadheader Stability Analysis
The roadheader shall be as stable as possible during the rectification process. Here, the angular velocity of the roadheader body shall be analyzed as an evaluation standard. The smaller the absolute value of the angular velocity, the smaller the change, and the more stable the roadheader body.
As shown in Figure 13, firstly, when the preview distance Lfc = 0.1 m, the maximum angular velocity is significantly higher than that when the preview distance is 0.3 m and 0.5 m. In addition, the angular velocity fluctuations are large and frequent, and at this point the anchor digger body is at its least stable. Secondly, for the point position correction strategy, when the target path is a Bezier curve, the larger the shape coefficient KS, the greater the change of the angular velocity. Thirdly, for the traditional correction strategy, the maximum angular velocity is much higher than the point correction strategy.
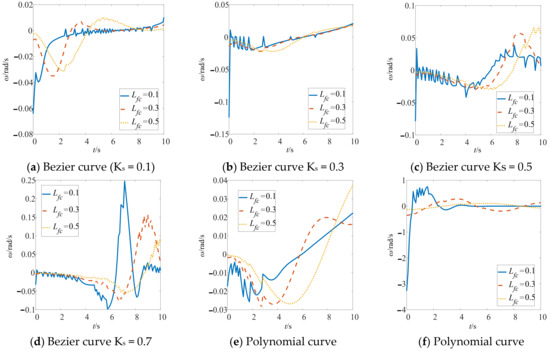
Figure 13.
An angular velocity comparison under different planning paths and lookahead distances.
3.2. Experimental Results
The direction correction control of the roadheader needs to detect the X-axis coordinate, Y-axis coordinate and yaw angle of the roadheader body in the tunnel. Therefore, the main purpose of the ground experiment is to verify the measurement accuracy of the laser navigation system for the above three key attitude parameters.
This involves arranging a laser emitter at the starting point to provide a reference and installing the laser receiver, tilt sensor, distance measuring sensor and controller, etc., on the crawler, as shown in Figure 14.
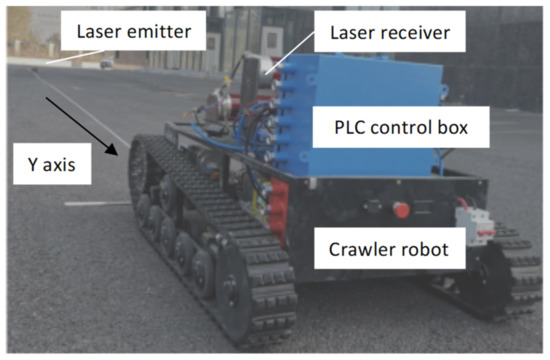
Figure 14.
The experiment set.

Table 2.
Laser emitter parameters.

Table 3.
Laser receiver parameters.

Table 4.
Inclination sensor parameters.
3.2.1. Pose Detection and Measurement Experiment
The experiment must be started at a distance of 10 m, and the laser emitter must be adjusted so that the laser plane is perpendicular to the ground and consistent with the reference line. By adjusting the pose of the crawler robot, the spot position coordinates of the two laser receivers are zero, and the state at this time can be taken as the initial state. The pose of the crawler robot should be changed, and then the steel ruler and high-precision goniometer used to measure the yaw angle and the lateral deviation of the roadheader as the actual value. Comparison of the measured value of the navigation system with the actual value provides the measurement error. These experimental steps were repeated 20 times to obtain a plurality of measurement errors and obtain the standard deviation of the measurement error. The distance between the crawler robot and the laser emitter must be increased at 10 m intervals each time, and then the experimental steps repeated. The measurement error of attitude parameters is shown in Figure 15.

Figure 15.
The measurement error of the pose parameter.
Within the range of 10–80 m, the X-axis coordinate measurement error generally increases with the increase in distance, the standard deviation of error is between 1–6 mm, and the maximum error is between 3–10 mm. The Y-axis coordinate measurement error generally increases with the increase in distance, the standard deviation of error is between 4–14 mm, and the maximum error is between 10–32 mm. The measurement error of yaw angle does not obviously change with distance. The standard deviation of error is between 0.1–0.3°, and the maximum error is between 0.25–0.65°.
After the completion of the ground test, in order to further verify the reliability of the navigation system under the actual working conditions, a downhole industrial test was carried out. The test site is shown in Figure 16.
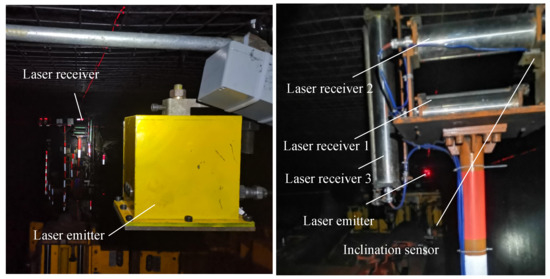
Figure 16.
The industrial test scenario.
The northeast celestial coordinate system is adopted in the mining area to indicate the direction of the roadheader. The reference system (navigation coordinate system) is defined as the X-axis representing the east, the Y-axis representing the north and the Z-axis representing the sky. The XB axis of the roadheader coordinate system refers to the right side of the roadheader, the YB axis refers to the forward direction and the ZB axis refers to the upper side. The yaw angle is zero when the YB axis of the roadheader points north. The heading direction of the tunnel is due west. Figure 17 is the monitoring data of the pose parameters of the excavation roadheader in a certain period of time.


Figure 17.
Pose parameter monitoring data.
The experimental data showed that the roadheader moved westward about 0.7 m at 10:53 and retreated to the starting position at 10:56. This situation is essentially consistent with the on-site feedback. The yaw angle, pitch angle and roll angle of the roadheader have no obvious increase or decrease trend, but the measured data fluctuate within a certain range. Comparing the ground experiments, the fuselage offset error is close to the range of the heading angle error. The analysis results show that the laser navigation system of the roadheader can adapt to the underground working environment and continuously detect the attitude parameters of the roadheader body.
3.2.2. Deviation Correction Control Strategy Verification Experiment
The purpose of this experiment is to verify the control accuracy of the proposed point position correction algorithm and the stability of the carrier in the correction process. The experiment uses the crawler robot to simulate the roadheader. The laser navigation system proposed in this paper is used to measure the X coordinate (lateral offset), Y coordinate (forward distance) and yaw angle of the robot in real-time. In the experiment, a ruler was placed to mark the road centerline and used as the Y axis. By taking the laser emitter position as the origin, as shown in Figure 14, a reference coordinate system is established with the right side of the vertical Y axis as the X axis. During the experiment, the pose parameters measured by the navigation system are transmitted to the controller. According to the current pose, the left and right trajectory speeds are controlled according to the deviation correction control strategy proposed in this paper.
According to the road driving technology, the footage of each driving cycle is set to 1 m, and the maximum deviation correction amount of each driving cycle is 0.05 m. Three sets of initial conditions are established, as shown in Table 5. The three groups differ in thier initial conditions: the predicted deviation may be less than the initial deviation and the predicted deviation may be greater than the initial deviation. Thirdly the predicted deviation may be greater than the initial deviation and hence the initial deviation may be greater than the maximum correction amount. For the initial conditions of group 1 and group 3, according to the point position correction strategy, the deviation correction must be completed in two driving cycles, hence the Y coordinate of the endpoint is set to 2 m.

Table 5.
The initial conditions for the deviation correction experiment.
The point correction strategy takes the Bezier curve as the target path, while the traditional correction strategy takes the road center line as the target path and uses the pure tracking algorithm to track different target paths. The control accuracy and motion stability of the tracked robot under different correction strategies are compared. As described above, the control accuracy is evaluated based on the position and yaw angle error of the tracked robot at the endpoint. The motion stability is evaluated by correcting the maximum angular velocity during the deviation.
Table 6 shows the position error, angle error and maximum angular velocity in the motion control process when the tracked robot reaches the endpoint under different initial conditions and different deviation correction strategies.

Table 6.
A performance comparison of different correction strategies.
Through comparison, two findings become apparent. Firstly, under different initial conditions, there is no difference in the position deviation and angle deviation at the endpoint by using the point position correction strategy or the conventional correction strategy. When applying the point position correction strategy, the maximum position deviation is 13 mm and the maximum angle deviation is 0.16°. When applying the conventional deviation correction strategy, the maximum position deviation is 9 mm and the maximum angle deviation is 0.14°. Secondly, under different initial conditions, the maximum angular velocity is less than 0.07 rad/s in the process of using the point correction strategy. The maximum angular velocity is 0.37, 0.46 and 0.82 rad/s, in the process of using the conventional correction strategy. This maximum angular velocity is a much greater angular velocity than when adopting a point correction strategy. The experimental results show that the point position correction strategy has good motion control accuracy, and the motion stability of the roadheader is better than the conventional correction strategy.
4. Discussion
A navigation system of the roadheader based on the cross laser is proposed. The spatial algorithms of the key pose parameters such as yaw angle, roadheader body lateral offset and altitude offset are studied. The mathematical model between the key pose parameters, the measured data of the laser receiver (point coordinates) and the measured data of the tilt sensor (pitch angle and roll angle) is established by vector algorithm. On this basis, this paper studies the control strategy of deviation correction of the roadheader, and puts forward the control strategy of point deviation correction based on the tunneling technology. The strategy first determines the end position of the driving cycle according to the initial pose of the roadheader, and then uses a Bezier curve to plan the path between the start point and the endpoint. Finally, a pure tracking algorithm is used to track the planned path.
5. Conclusions
The experimental results show that the standard deviations of the X-axis coordinate, Y-axis coordinate and yaw angle errors are less than 6 mm, 14 mm and 0.3°, respectively, and the maximum errors are less than 10 mm, 32 mm and 0.65°, respectively. This is indicative of high accuracy, sufficient to meet the accuracy requirements of detection. The position error of the tracked vehicle is less than 13 mm and the yaw angle error is less than 0.16°, which meets the requirements of motion control accuracy. At the same time, the maximum angular velocity in the correction process is 0.07 rad/s, which is less than 0.82 rad/s in the traditional correction strategy. This improves the stability of the roadheader movement while ensuring correction accuracy.
Author Contributions
Conceptualization, Y.M. and H.C. (Hongyan Chen); Methodology, Y.M.; Software, W.Y.; Validation, H.C. (Hongyue Chen); Data curation, H.C. (Hongyan Chen); Writing—original draft, W.Y.; Writing—review & editing, H.C. (Hongyan Chen); Supervision, D.Z.; Project administration, H.C. (Hongyue Chen); Funding acquisition, Y.M. and H.C. (Hongyue Chen). All authors have read and agreed to the published version of the manuscript.
Funding
This research was funded by the National Natural Science Foundation of China, grant number (51874157, 51974159, 52174115), and the Innovation Leading Team of Liaoning Technical University, grant number (LNTU20TD-02).
Institutional Review Board Statement
Not applicable.
Informed Consent Statement
Not applicable.
Data Availability Statement
The data that support the findings of this study are available within the article.
Acknowledgments
Our deepest gratitude goes to the anonymous reviewers for their careful work and thoughtful suggestions that have helped improve this paper substantially.
Conflicts of Interest
The authors declare no conflict of interest.
References
- Wang, G.; Zhao, G.; Ren, H. Analysis on key technologies of intelligent coal mine and intelligent mining. J. China Coal Soc. 2019, 44, 34–41. [Google Scholar] [CrossRef]
- Wang, G.; Zhang, D. Innovation practice and development prospect of intelligent fully mechanized technology for coal mining. J. China Coal Soc. 2018, 47, 459–467. [Google Scholar] [CrossRef]
- Xie, H.; Wang, J.; Wang, G.; Ren, H.; Liu, J.; Ge, S. New ideas of coal revolution and layout of coal science and technology development. J. China Coal Soc. 2018, 43, 1187–1197. [Google Scholar] [CrossRef]
- Lei, Y. Present Situation and development of underground mine intelligent development technology in domestic. Coal Min. Technol. 2017, 22, 1–4. [Google Scholar] [CrossRef]
- Huo, Z.; Wu, X. Development tendency of internet plus intelligent mine. Coal Sci. Technol. 2016, 44, 28–33, 63. [Google Scholar] [CrossRef]
- Fan, J. Innovation and development of intelligent mining technology in coal mine. Coal Sci. Technol. 2017, 45, 65–71. [Google Scholar] [CrossRef]
- Gao, Y.; Yang, Y.; Chang, Y. Status and prospect of key technologies of intelligentization of fully-mechanized coal mining face. Coal Sci. Technol. 2021, 49, 1–22. [Google Scholar]
- Wang, G.; Wang, H.; Ren, H. 2025 scenarios and development path of intelligent coal mine. J. China Coal Soc. 2018, 43, 295–305. [Google Scholar] [CrossRef]
- Xu, J.; Tan, Z. Smart mine systemengineering and discussion of its key technology. Coal Sci. Technol. 2014, 42, 79–82. [Google Scholar] [CrossRef]
- Li, M.; Yang, S.; Sun, Z.; Hao, W. Study on framework and development prospects of intelligent mine. Coal Sci. Technol. 2017, 45, 121–128. [Google Scholar] [CrossRef]
- Wang, G. Development orientation of complete fully-mechanized automation, intelligent and unmanned mining technology and equipment. Coal Sci. Technol. 2014, 42, 30–34, 39. [Google Scholar] [CrossRef]
- Wang, H. The 40 years developmental review of the fully mechanized. J. China Coal Soc. 2010, 35, 1815–1820. [Google Scholar] [CrossRef]
- Wu, M.; Jia, W.; Hua, W. Autonomous measurement of pose of boom-type roadheader based on space intersec-tion measurement. J. China Coal Soc. 2015, 40, 2596–2602. [Google Scholar]
- Li, R. Research on an Automatic Detection System for the Position and Orientation Parameters of Boom-Type Roadheader Body; China University of Mining Technology: Beijing, China, 2012. [Google Scholar]
- Chen, H.; Yang, W.; Ma, Y.; Tian, L. Accuracy improvement for linear array photocell sensor. Measurement 2021, 179, 109436. [Google Scholar] [CrossRef]
- Tao, Y.; Huang, Y.; Chen, J.; Li, P.; Wu, M. Study on Measurement Error of Angle of Deviation and Offset Distance of Roadheader by Single-station, Multipoint and Time-shared Measurement System Based on iGPS. In Proceedings of the CSAA/IET International Conference on Aircraft Utility Systems (AUS 2018), IET, Guiyang, China, 19–22 June 2018. [Google Scholar]
- Fu, S.; Li, Y.; Yang, J. Research on autonomous positioning and orientation method of roadheader based on Ultra Wide-Band technology. J. China Coal Soc. 2015, 40, 2603–2610. [Google Scholar] [CrossRef]
- Du, Y.; Tong, M.; Liu, T.; Dong, H. Visual measurement system for roadheaders pose detection in mines. Opt. Eng. 2016, 55, 104107. [Google Scholar] [CrossRef]
- Yang, W.; Zhang, X.; Zhang, G.M. Infrared LEDs-Based Pose Estimation With Underground Camera Model for Boom-Type Roadheader in Coal Mining. IEEE Access 2019, 7, 33698–33712. [Google Scholar] [CrossRef]
- Zhang, K. Research on Spatial Pose Detection Method of Roadheader based on Roof Vision; China Coal Research Institute: Beijing, China, 2021. [Google Scholar]
- Tian, Y. Inertial navigation positioning method of roadheader based on zero-velocity update. Ind. Mine Autom. 2019, 45, 70–73. [Google Scholar]
- Yang, J. Study on Combined Measurement Method of Dynamic Position and Orientation for Coal Mine Roadheader; Tianjin University of Science and Technology: Tianjin, China, 2018. [Google Scholar]
- Yan, C.; Zhao, W.; Lu, X. A Multi-Sensor Based Roadheader Positioning Model and Arbitrary Tunnel Cross Section Automatic Cutting. Sensors 2019, 19, 4955. [Google Scholar] [CrossRef]
- Zhang, J.; Cai, X.; Lv, F.; Zong, K.; Wu, M. Research on roadheader auto rectification in limited roadway space based on regional grid. Chin. J. Sci. Instrum. 2018, 39, 62–70. [Google Scholar]
- Zhang, X.; Zhao, J. Vision-based Navigation and Directional Heading Control Technologies of Boom-type Roadheader. J. China Coal Soc. 2021, 46, 2186–2196. [Google Scholar]
- Yang, J.; Tang, Z.; Wang, X. Study on stochastic constraint environment modeling method for optimal deviation rectification path of boom-type roadheader. J. Min. Sci. Technol 2019, 4, 58–65. [Google Scholar] [CrossRef]
- Chen, H.; Yang, W.; Ma, Y.; Tian, L. Multi-sensor fusion method for roadheader pose detection. Mechatronics 2021, 80, 102669. [Google Scholar] [CrossRef]
- Bulut, V. Path planning for autonomous ground vehicles based on quintic trigonometric Bézier curve. J. Braz. Soc. Mech. Sci. Eng. 2021, 43, 104. [Google Scholar] [CrossRef]
- Wang, T.; Dong, R.; Zhang, R.; Qin, D. Research on Stability Design of Differential Drive Fork-Type AGV Based on PID Control. Electronics 2020, 9, 1072. [Google Scholar] [CrossRef]
- Morales, J.; Martínez, J.L.; Martínez, M.A.; Mandow, A. Pure-Pursuit Reactive Path Tracking for Nonholonomic Mobile Robots with a 2D Laser Scanner. EURASIP J. Adv. Signal Process. 2009, 2009, 935237. [Google Scholar] [CrossRef]
- Coulter, R.C. Implementation of the Pure Pursuit Path Tracking Algorithm; The Robotics Institute Carnegie Mellon University: Pittsburgh, PA, USA, 1992. [Google Scholar]
Publisher’s Note: MDPI stays neutral with regard to jurisdictional claims in published maps and institutional affiliations. |
© 2022 by the authors. Licensee MDPI, Basel, Switzerland. This article is an open access article distributed under the terms and conditions of the Creative Commons Attribution (CC BY) license (https://creativecommons.org/licenses/by/4.0/).