Article

Damage Assessment of Shear Wall Structures in an Earthquake–Blast Disaster Chain

State Key Laboratory of Coastal and Offshore Engineering, Dalian University of Technology, Dalian 116024, China
*
Author to whom correspondence should be addressed.
Appl. Sci. 2022, 12(22), 11781; https://doi.org/10.3390/app122211781
Submission received: 14 October 2022 / Revised: 11 November 2022 / Accepted: 16 November 2022 / Published: 19 November 2022
(This article belongs to the Special Issue Seismic Performance Assessment for Structures)

Abstract

:
Shear wall structures are widely used in civil engineering, and their seismic design has been the focus of much attention. Explosions can result from the rupture and ignition of gas pipelines under seismic action, and there are currently no methods to appropriately assess the damage levels of shear wall structures under such hazard chains. Thus, this study provides a two-stage analysis method for the damage assessment of shear wall structures in an earthquake–blast disaster chain. A damage index of the structure is derived to evaluate the damage state. A 12-story shear wall structure is analyzed numerically to demonstrate the proposed assessment method. The results show that the damage state (DS) of the shear wall structure in an earthquake–blast disaster chain can be increased by one or even two levels when explosive loads are introduced following exposure to seismic actions. Therefore, the earthquake–blast disaster chain has an important impact on the response of shear wall structures and warrants further study to find ways that can better protect such structures against similar disasters.

1. Introduction

Reinforced-concrete shear wall structures possess excellent seismic performance and are commonly used in high-rise residential and commercial buildings [1]. However, earthquakes can trigger a chain of secondary and even tertiary disasters (fires [2], explosions [3], landslides [4], flooding [5], etc.). In some cases, the wall structures survive the earthquake intact but are then severely damaged by the following chain of disasters. Therefore, there has been an increased focus of research efforts on the risk assessment of shear wall structures that are potentially exposed to multiple hazards.
The literature presents a variety of methods to analyze the performance and damage of shear wall structures when faced with multiple hazards, such as a combination of earthquakes, wind, rain, flooding, etc. Zheng et al. [6] described a multi-hazard-based framework to assess the potential of a high-risk building to be damaged when subjected to either separate or combined earthquake and wind hazards. The results demonstrated that the probability of damage induced by the dual-hazard earthquake is relatively high. Dong et al. [7] studied the joint probabilistic model of earthquakes and rain for performing the failure risk assessment of structures. Dong et al. [8] proposed a method for evaluating the failure probability of masonry structures under flood scouring and earthquakes. Kameshwar and Padgett [9] proposed the risk assessment for a variety of highway bridges subjected to earthquake and hurricane events.
Earthquakes and explosions [10,11] due to secondary causes (e.g., ignition of gas tanks) are among the most destructive hazards and should be accounted for in the design of buildings. Gas pipelines can rupture during earthquakes and cause gas to leak, which can lead to explosions when the gas concentration near a fire or spark exceeds a certain threshold. An earthquake–blast disaster chain is a low-probability, high-consequence event [12]. Although the probability of an earthquake–blast disaster chain is small, once it occurs, the structure will likely be subjected to loads that far exceed the pre-designed values. Such events can lead to great risks of structural failure, human injuries, and property damage. In recent years, many engineering structure failures during the earthquake–blast disaster chains have revealed deficiencies in conventional disaster-resistance design methods for engineering structures. For instance, in 2011, a hydrogen explosion occurred after the Great East Japan Earthquake, causing severe damage to the nearby power plant [3]. In 2017, infrastructural components caught fire and exploded during the Puebla-Morelos Earthquake in Mexico. The above-mentioned cases highlight the importance of considering the potential consequences of dual earthquake and explosion disasters. Additionally, such cases reveal that while current anti-seismic design codes work well, there is still uncertainty about whether structures can withstand the seismic-explosion disaster chain [13]. Therefore, the dynamic structural behavior, damage, failure mode, and assessment methods should be investigated to ensure structural safety during such situations.
To bridge the gaps above, we investigated the response of a shear wall structure and derived a method to evaluate the damage that the shear wall structures may sustain in an earthquake–blast disaster chain. This paper is organized as follows. Section 2 proposes a theoretical framework for the damage evaluation of shear wall structures under an earthquake–blast disaster chain. Section 3 establishes a finite element model of the shear wall structure using the explicit dynamic FE analysis program LS-DYNA [14]. In Section 3, we describe the collection of recorded field data to facilitate the simulation of the simultaneous occurrences of earthquakes and blast loads. The blast-loading cases examine the effects of having explosions occurring separately at different locations. Specifically, the locations include the corner room on the first floor, the middle room on the first floor, the corner room on the sixth floor and the middle room on the sixth floor. The earthquake–blast disaster chain consists of a random combination of ground motions and explosions. The dynamic responses of the shear wall structure under the earthquake–blast disaster chain are reported in Section 4. In Section 5, the effect of an earthquake–blast disaster chain on structural performance is evaluated in detail. Then, further discussion is given in Section 6. Finally, a summary of conclusions is provided in Section 7.

2. Methodology

2.1. Framework of Damage Evaluation

Although some studies have successfully achieved damage evaluation of shear wall structures under individual earthquake excitation [15,16] or explosion loads [17,18], there are so far limited efforts on developing analytical approaches for damage evaluation of shear wall structures in an earthquake–blast disaster chain. In this paper, an analytical method is developed for the damage evaluation of shear wall structures that experiences an earthquake–explosion disaster chain. The results of this paper should help the community to better understand the damage modes of such structures, especially in the earthquake–explosion disaster chain.
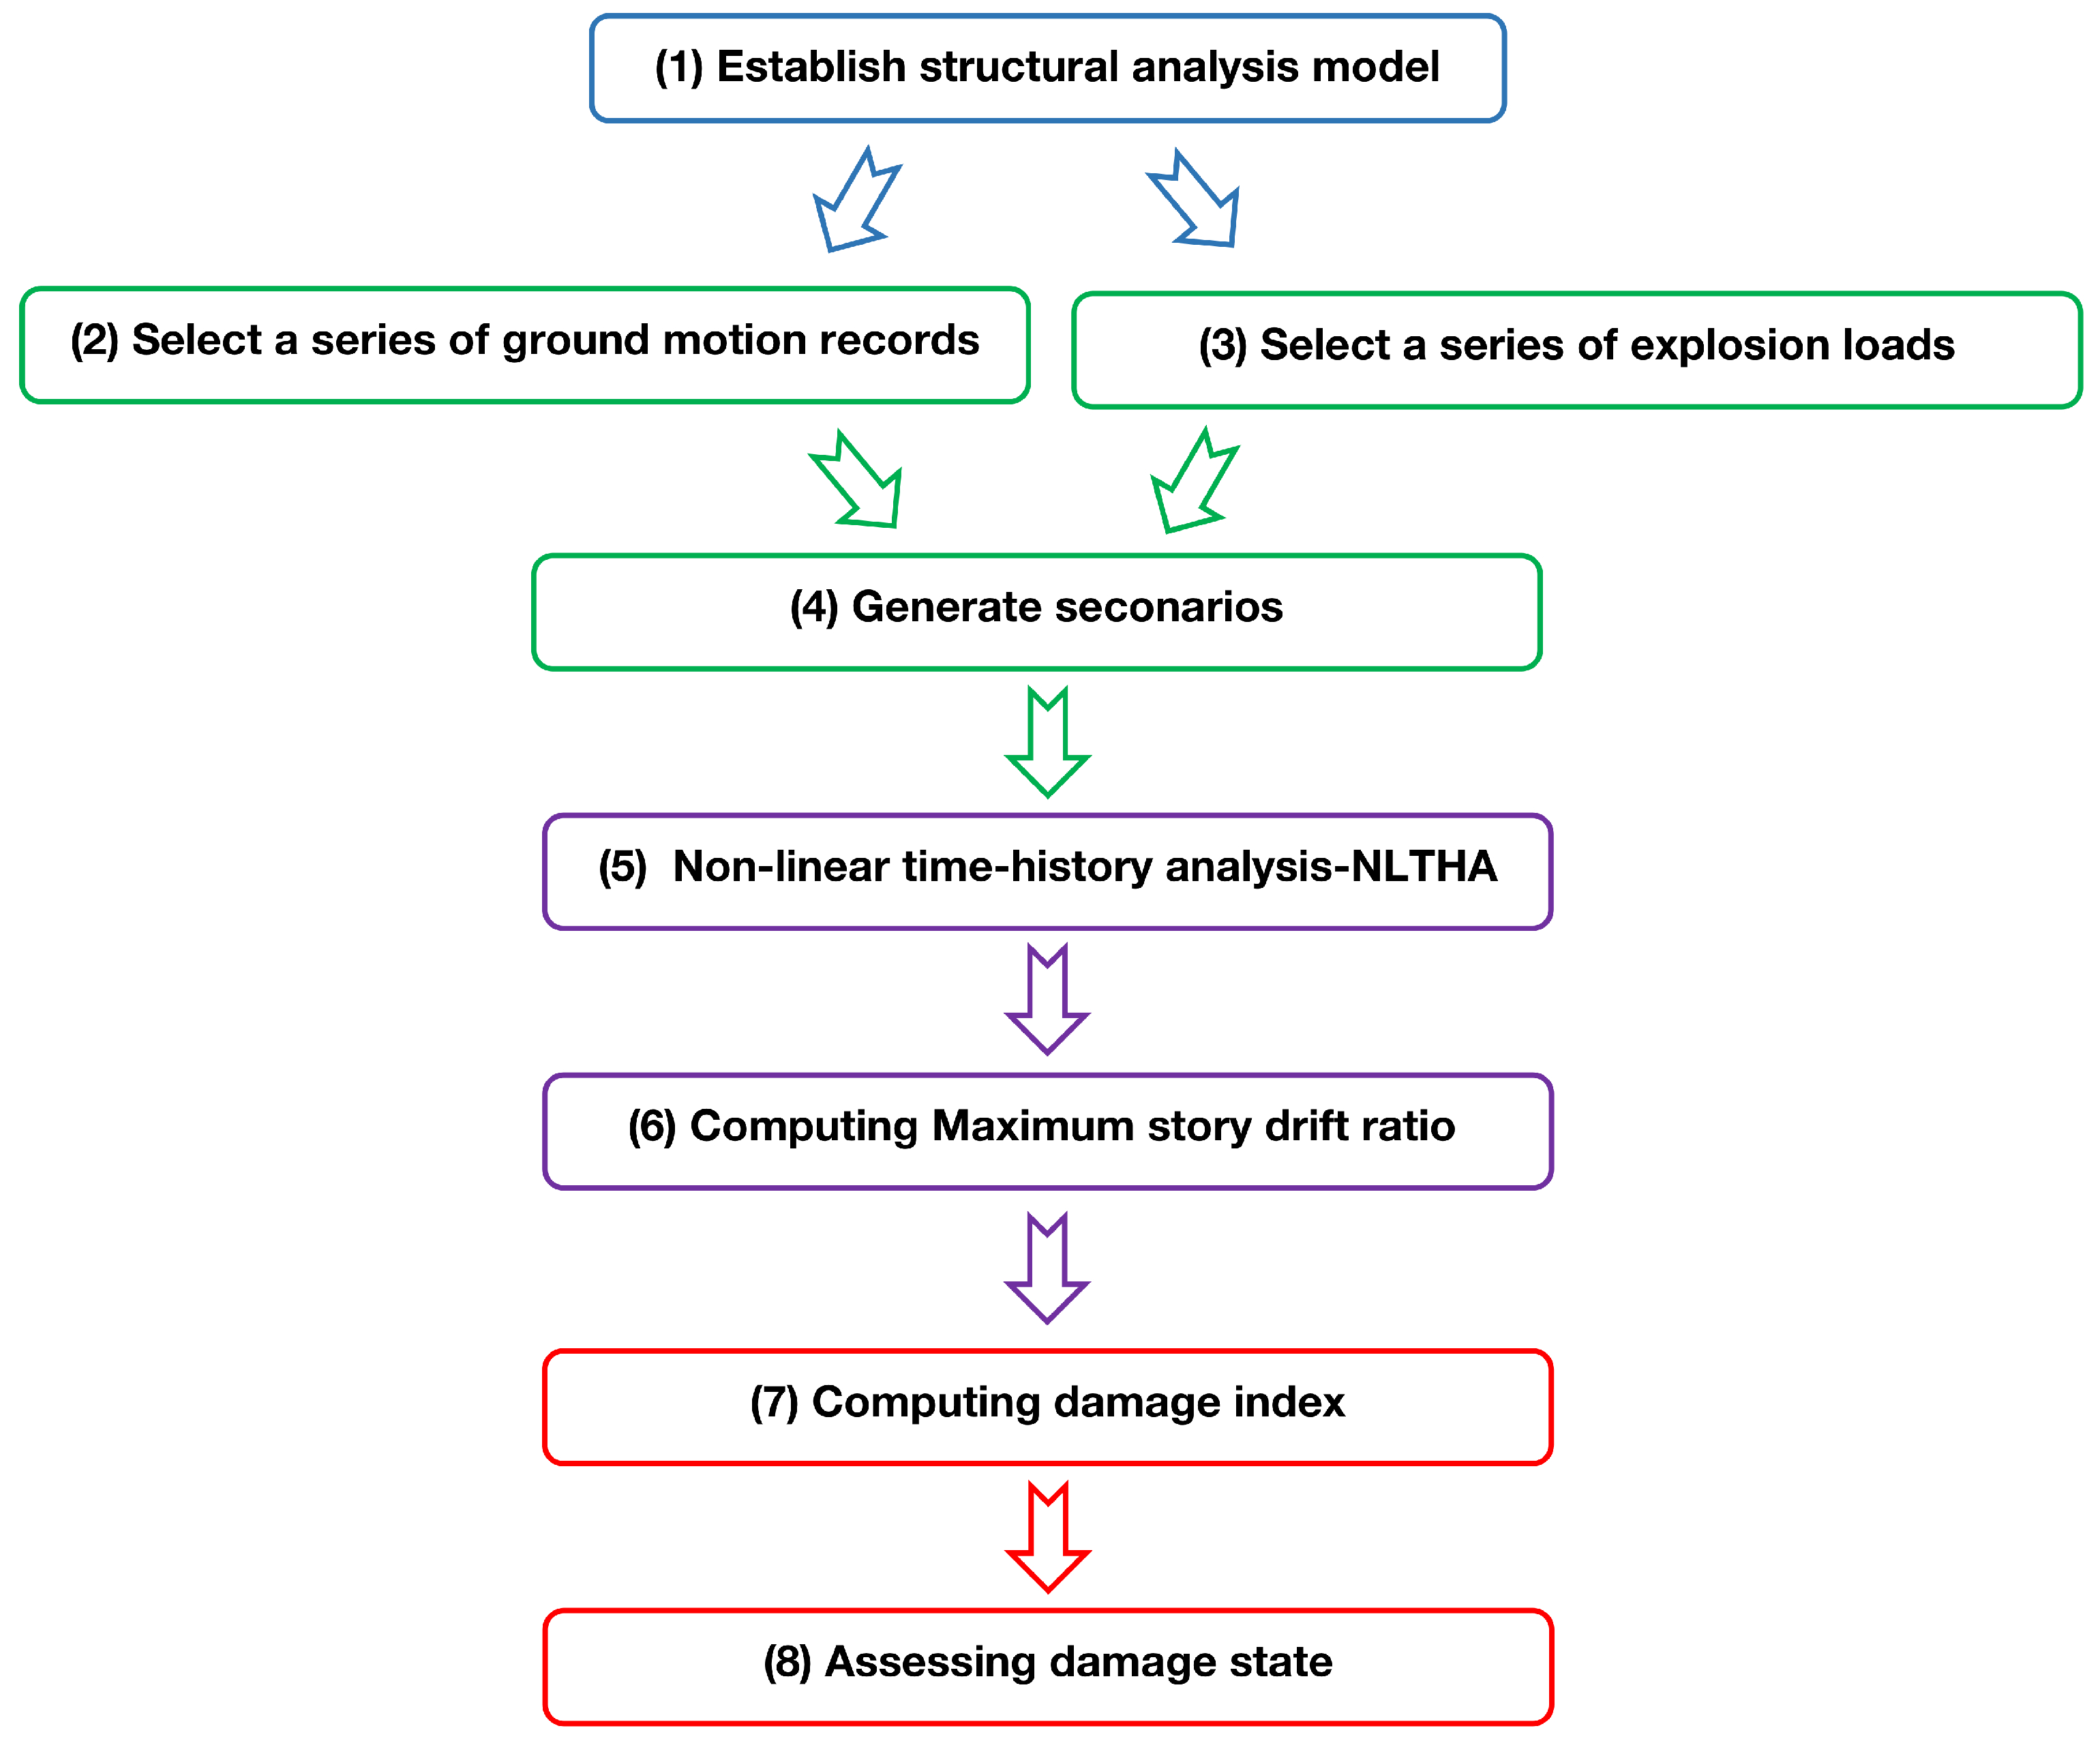
The entire framework for damage assessment of shear wall structures in an earthquake–blast disaster chain is shown in Figure 1.
(1)
The finite element (FE) models of shear wall structures were established.
(2)
A series of ground motion records, based on the site conditions of structure and the epicentral distance, was used for the first phase analysis.
(3)
A series of blast loads at different locations with the same TNT equivalence were used for the second-phase analysis.
(4)
Random combination ground motion records with explosion loads to generate scenarios.
(5)
A two-stage analysis method was used for response and damage analysis of shear wall structures in an earthquake–blast disaster chain, as shown in Figure 1. The first stage was the non-linear time-history (NLTHA) for ground motion records, which was followed by blast loads without any chance for recuperation or reparation of the shear wall structures. Thus, two-stage accumulated damage effects of earthquake loading and blast loading were considered.
(6)
The results from the two-stage damage analysis were used for deriving the damage index ( ξ D R ).
(7)
Determine the damage states (DSs).
(8)
Finally, as presented in Figure 1, the damage evaluation was then developed based on the damage index and the damage states.

2.2. Explosion Loads

Natural gas is also known as methane gas. The lower flammability limit (LFL) of methane is 4.6 ± 0.3%, and the upper flammability limit (UFL) of methane is 15.8 ± 0.4% [19]. The equation of methane combustion can be expressed as:
CH 4 + 2 O 2 + 3.76 N 2 CO 2 + 2 H 2 O + 7.52 N 2
According to Equation (1), with a 21% oxygen concentration in the air, the volume of methane is half of the volume of oxygen (i.e., 10.5%), which indicates a complete chemical reaction can occur. In other words, the highest pressure is generated when the methane concentration is 9.5%.
Previous work has made it possible to approximate a gas explosion as a TNT explosion by the TNT equivalent method [20], which is widely used in the design of industrial buildings and the assessment of the consequences of gas explosion accidents. Based on the principle of energy equivalence, the energy released by the combustible gases in the explosion is used to estimate the amount of TNT explosives that can release the same amount of energy. The specific formula is:
M T N T = α M m Q m Q T N T
where M T N T is the mass equivalent of TNT (kg); α is the efficiency factor for TNT, adopted as 0.04; M m is the volume of methane in the cloud (m 3 ); Q m is the heat of combustion of methane (MJ·m 3 ); and Q T N T is the detonation energy of TNT (MJ·kg 1 ).

2.3. Constitutive Models

Several concrete constitutive models are available within LS-DYNA, including the Holmquist–Johnson–Cook (HJC), the Continuous Surface Cap (CSC) model, the Karagozian and Case Concrete (KCC) model, and the Brittle Damage Concrete (BDC) model. In this manuscript, the HJC model [21] is used due to its ability to simulate the behavior of concrete at large strains and high strain rates. Existing studies [22,23,24] have proven that the HJC model can describe the damage and failure of concrete materials under intensive and impact loadings. The equivalent strength model treats damage, strain rate, and hydrostatic pressure as variables. The general overview of the HJC model is given as follows:
σ * = A ( 1 D ) + B P * N 1 + C ln ε ˙ *
where D, P * N , and ε ˙ * are the damage parameter, the normalized pressure, and the dimensionless strain rate, respectively; A, B, and C are constants, where A is the normalized cohesive strength, B is the normalized pressure hardening coefficient, and C is the strain rate coefficient.
The HJC model incrementally accumulates damage from both equivalent plastic and plastic, which means:
D = Δ ε p + Δ μ p D 1 P * + T * D 2
where Δ ε p and Δ μ p are the equivalent plastic strain and plastic volumetric strain, respectively; both D 1 and D 2 are material damage constants; T * is the normalized maximum tensile hydrostatic pressure.
In this paper, gas explosions are converted into TNT explosions through the TNT equivalent method, as described in Section 2.2. The explosion of TNT is simulated by the * M A T _ H I G H _ E X P L O S I V E _ B U R N material model and the equation of state * E O S _ J W L in LS-DYNA:
p = A 1 1 ω R 1 V e R 1 V + A 2 1 ω R 2 V e R 2 V + ω E V
where p, V, and E are the detonation pressure, the relative volume, and the initial unit volume energy, respectively; A 1 , A 2 , R 1 , R 2 , and ω are the coefficients.
Assuming that the air is a non-viscous ideal gas, it is described by the empty material model * M A T _ N U L L and the equation of state * E O S _ L I N E A R _ P O L Y N O M I A L :
P = C 0 + C 1 μ + C 2 μ 2 + C 3 μ 3 + C 4 + C 5 μ + C 6 μ 2 E
μ = 1 V 1
where P, E, and V are the pressure value, the initial specific internal energy, and the relative volume, respectively; and C 0 , C 1 , C 2 , C 3 , C 4 , C 5 , and C 6 are polynomial equation coefficients.

2.4. Damage Evaluation

Currently, there are a limited number of studies that investigate damage state thresholds for the damage assessment of shear wall structures that have experienced an earthquake–blast disaster chain. Considering the structural characteristics and the earthquake–blast disaster chain, this manuscript uses the same damage state thresholds and limit ranges as indicated in the SEAOC Vision 2000 [25], ATC40 [26], FEMA 273, and FEMA 274 [27] documents to evaluate damage levels. The performance level, corresponding damage state, and drift limits are listed in Table 1.
Generally, the maximum story drift ratio can assess the damage state during both earthquakes and blast loads. As a result, the maximum story drift ratio is critical to evaluate the multi-hazard resistance of the shear wall structures. Then, the maximum story drift ratio of the shear wall structure in an earthquake–blast disaster chain and the story drift ratio at the initiation of structural collapse are suggested as indexes for gauging the damage of a shear wall structure struck by a disaster chain:
ξ D R = D R max D R max u
where ξ D R is the story drift ratio damage index; D R m a x is the maximum story drift ratio of the shear wall structure under a disaster chain; D R m a x u is the story drift ratio of the shear wall structure, which is treated as the initiation of structural collapse specified in the codes.

3. Numerical Simulation

3.1. FE Model of Shear Wall Structure

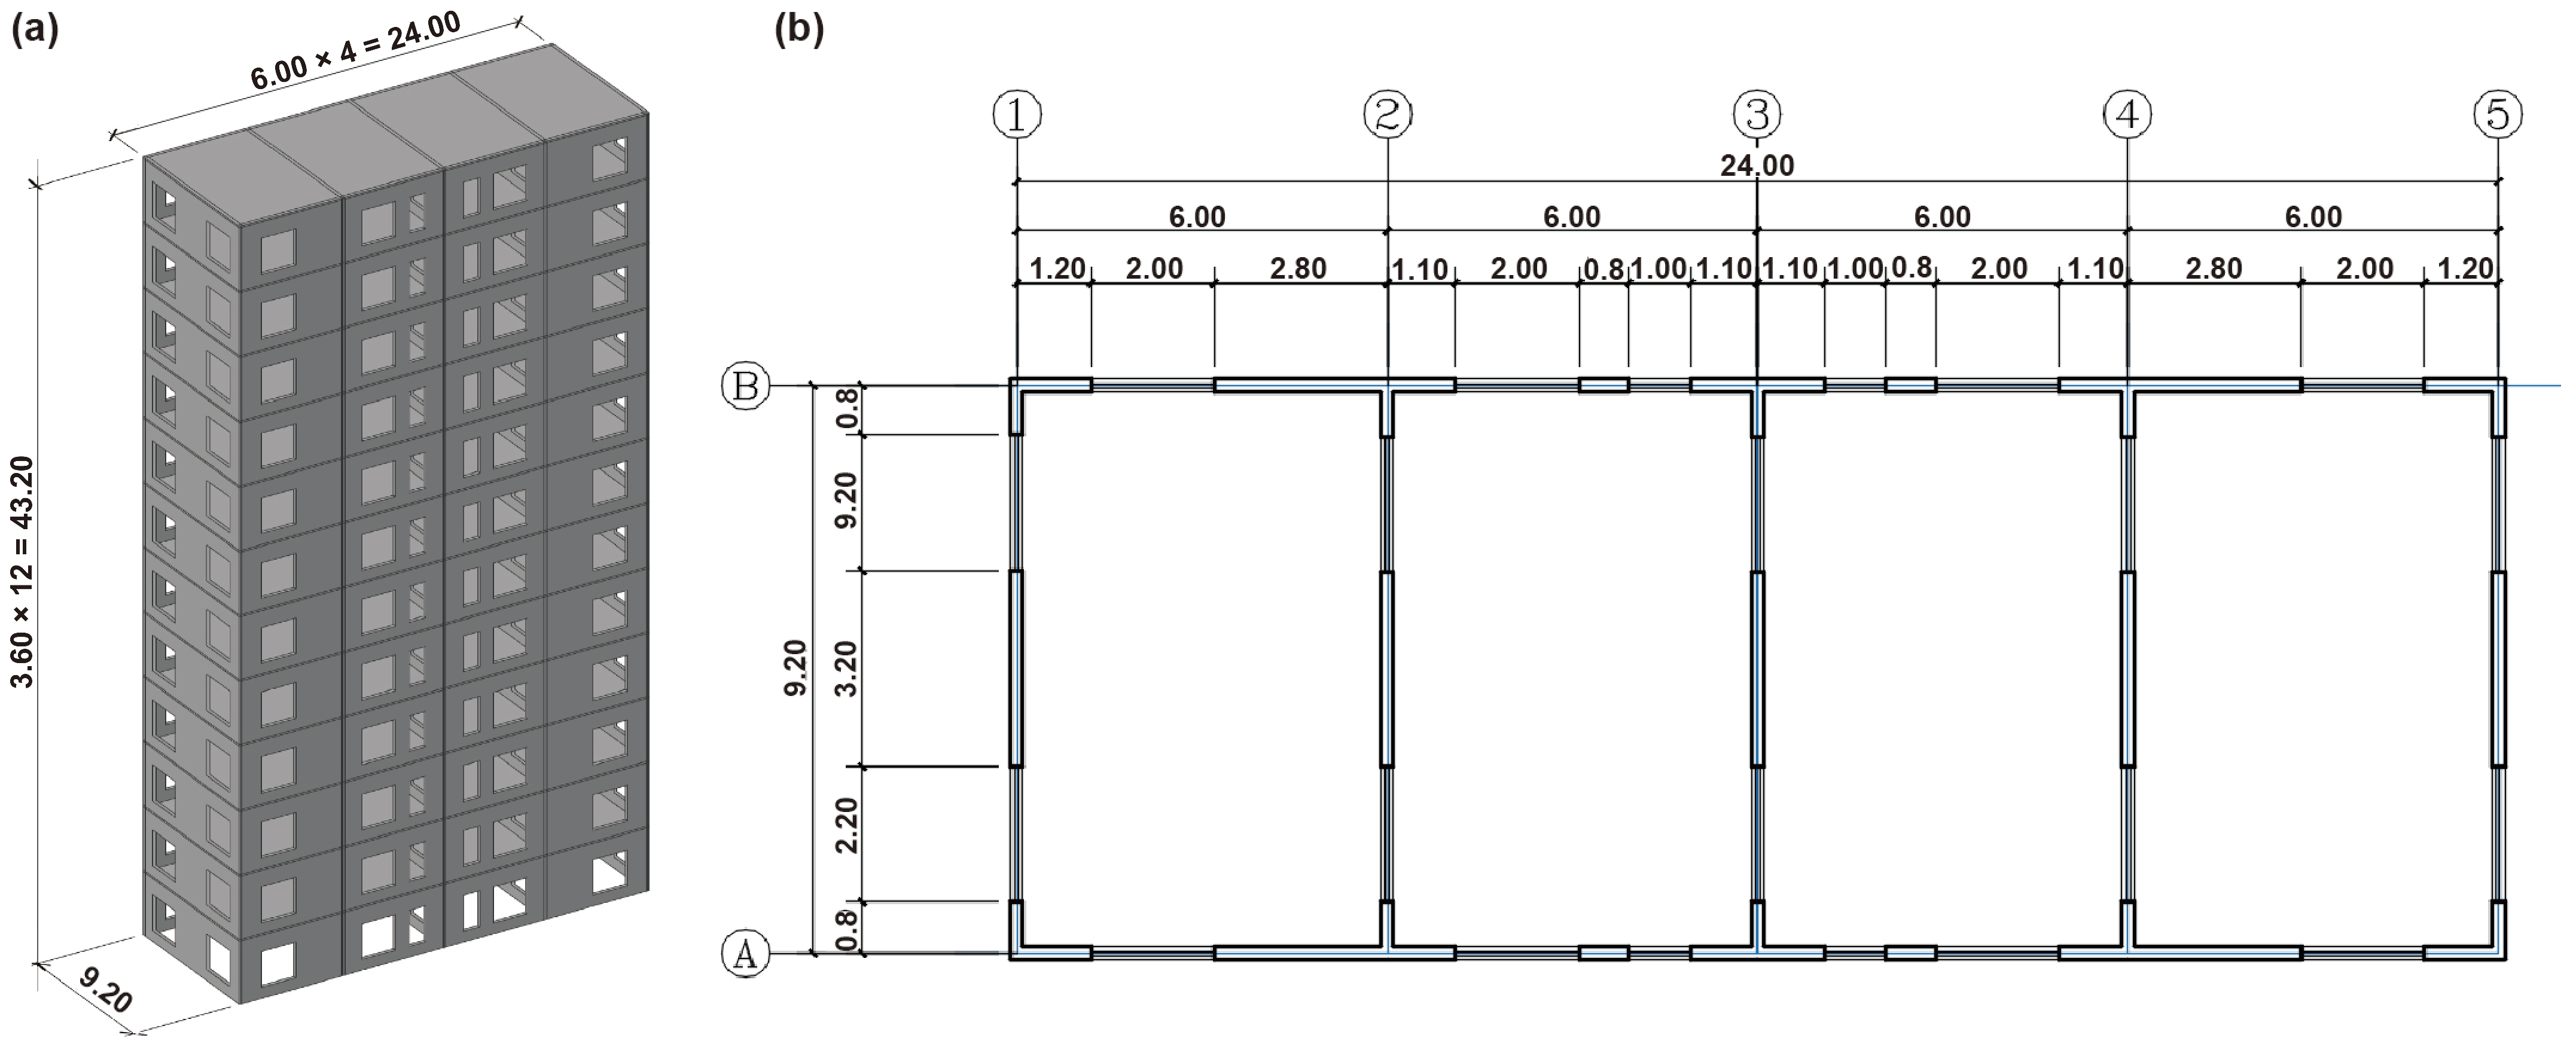
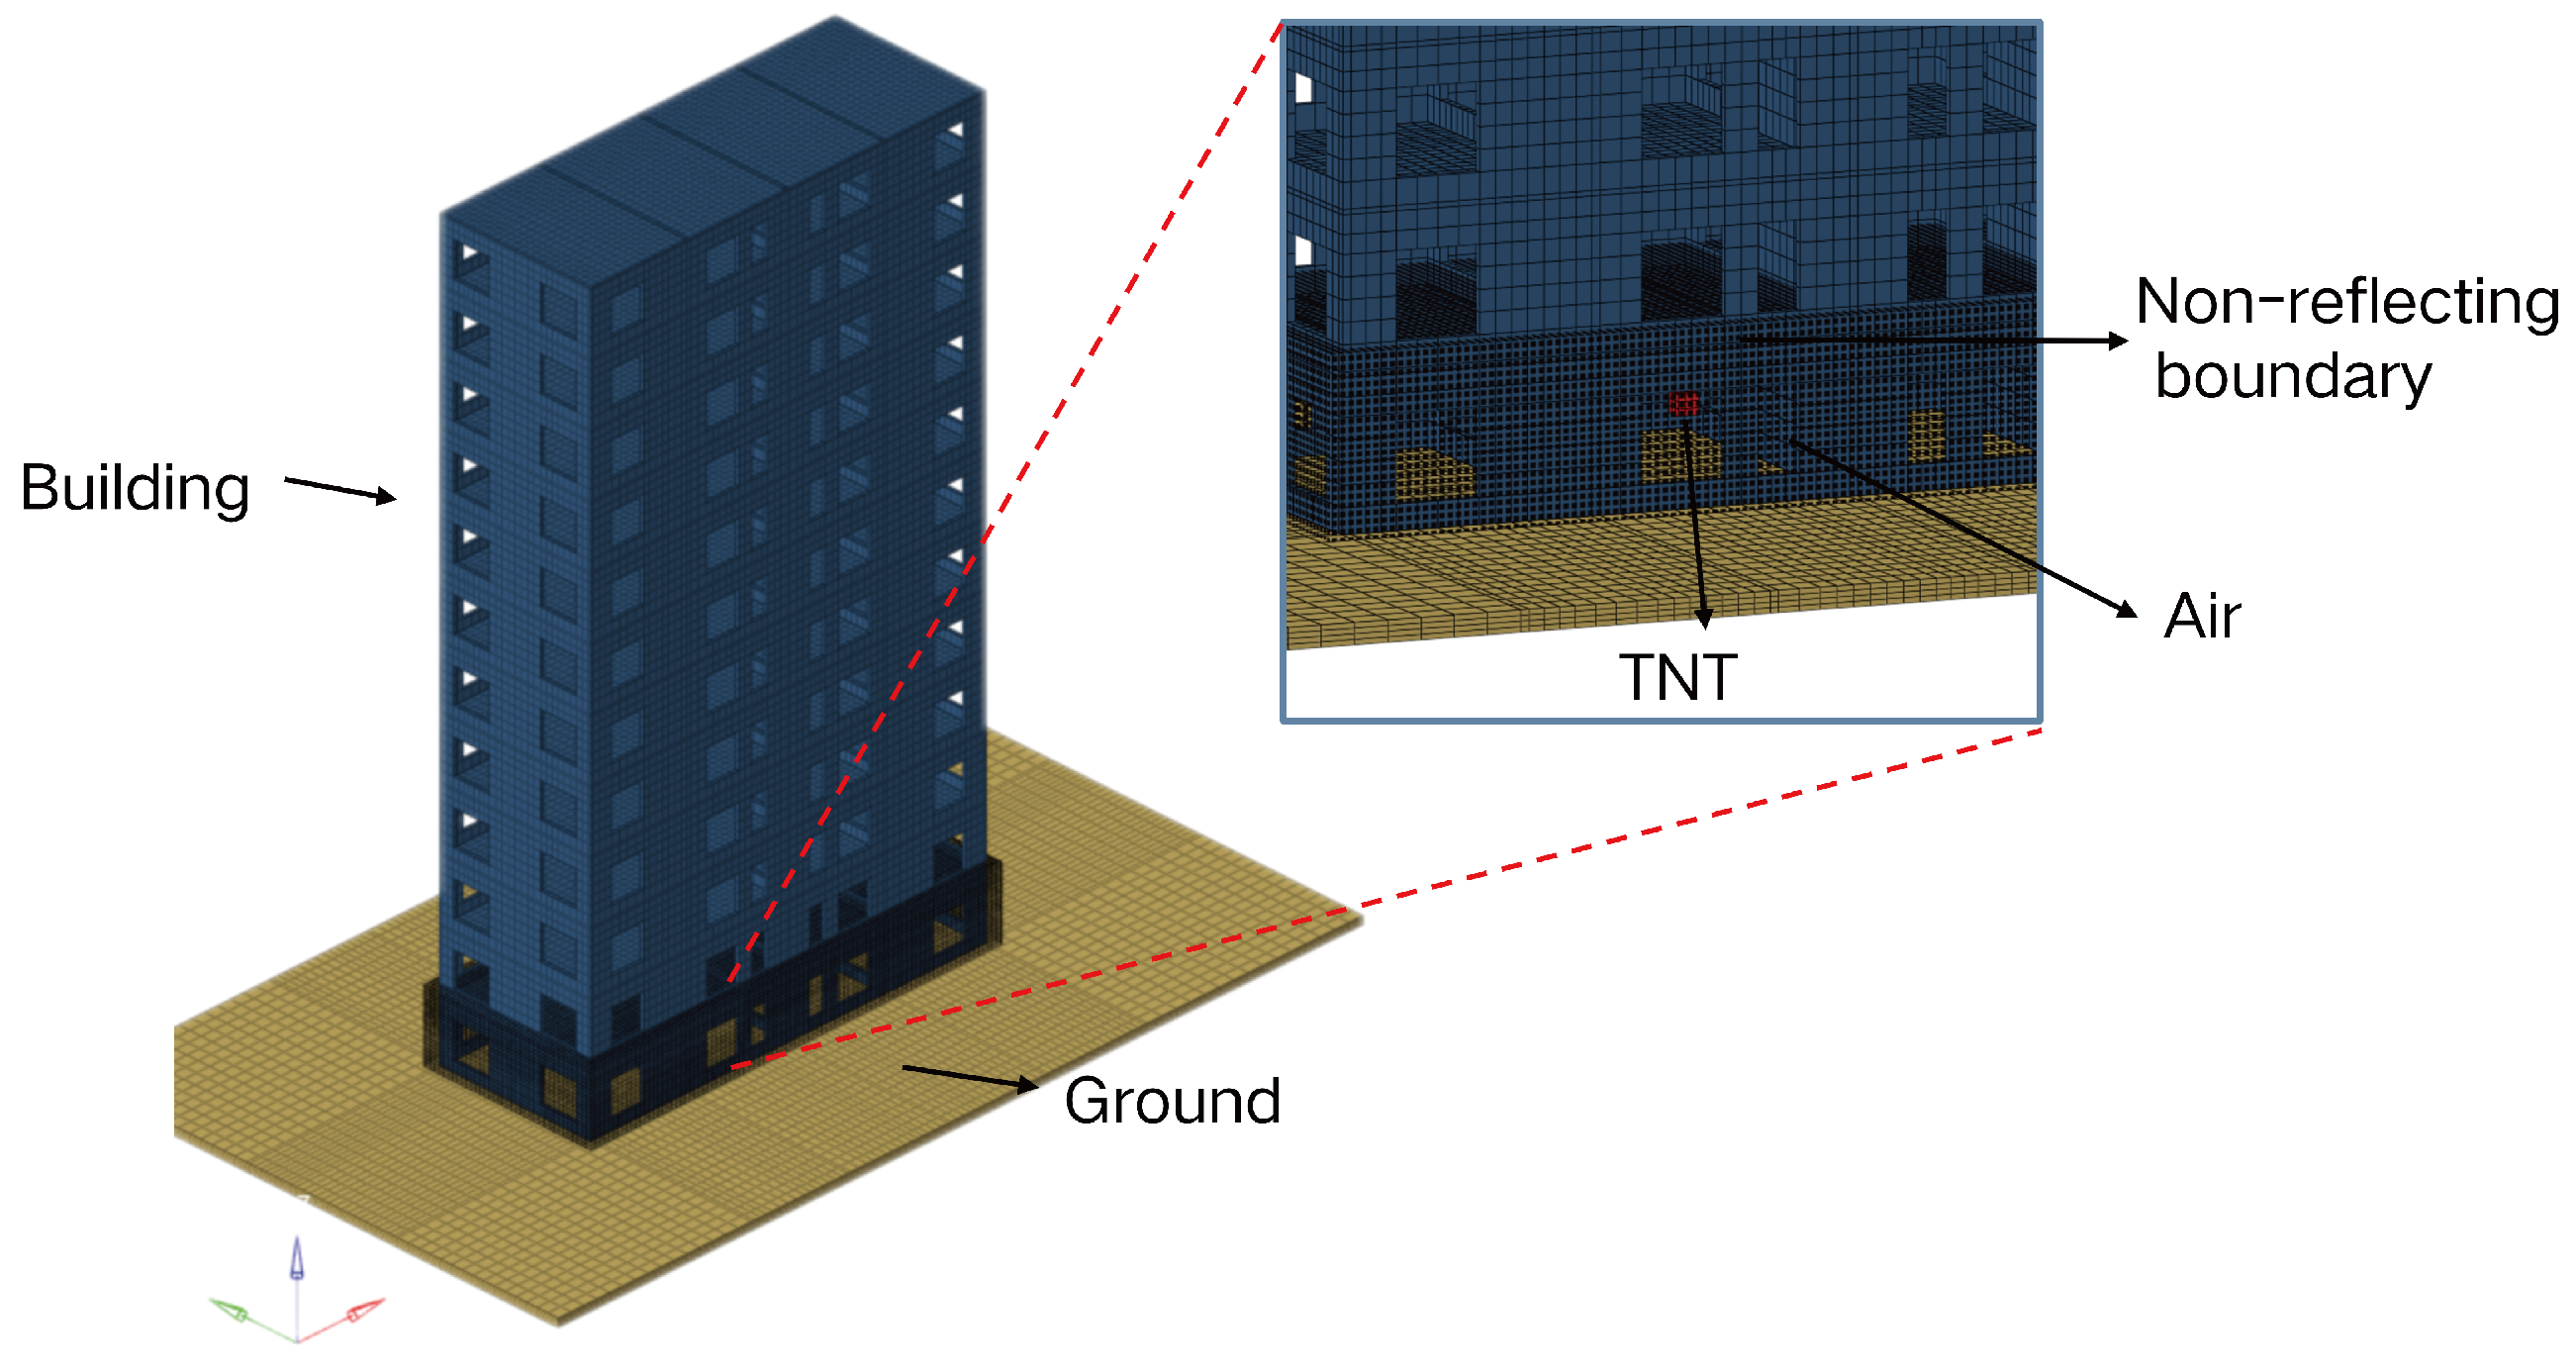
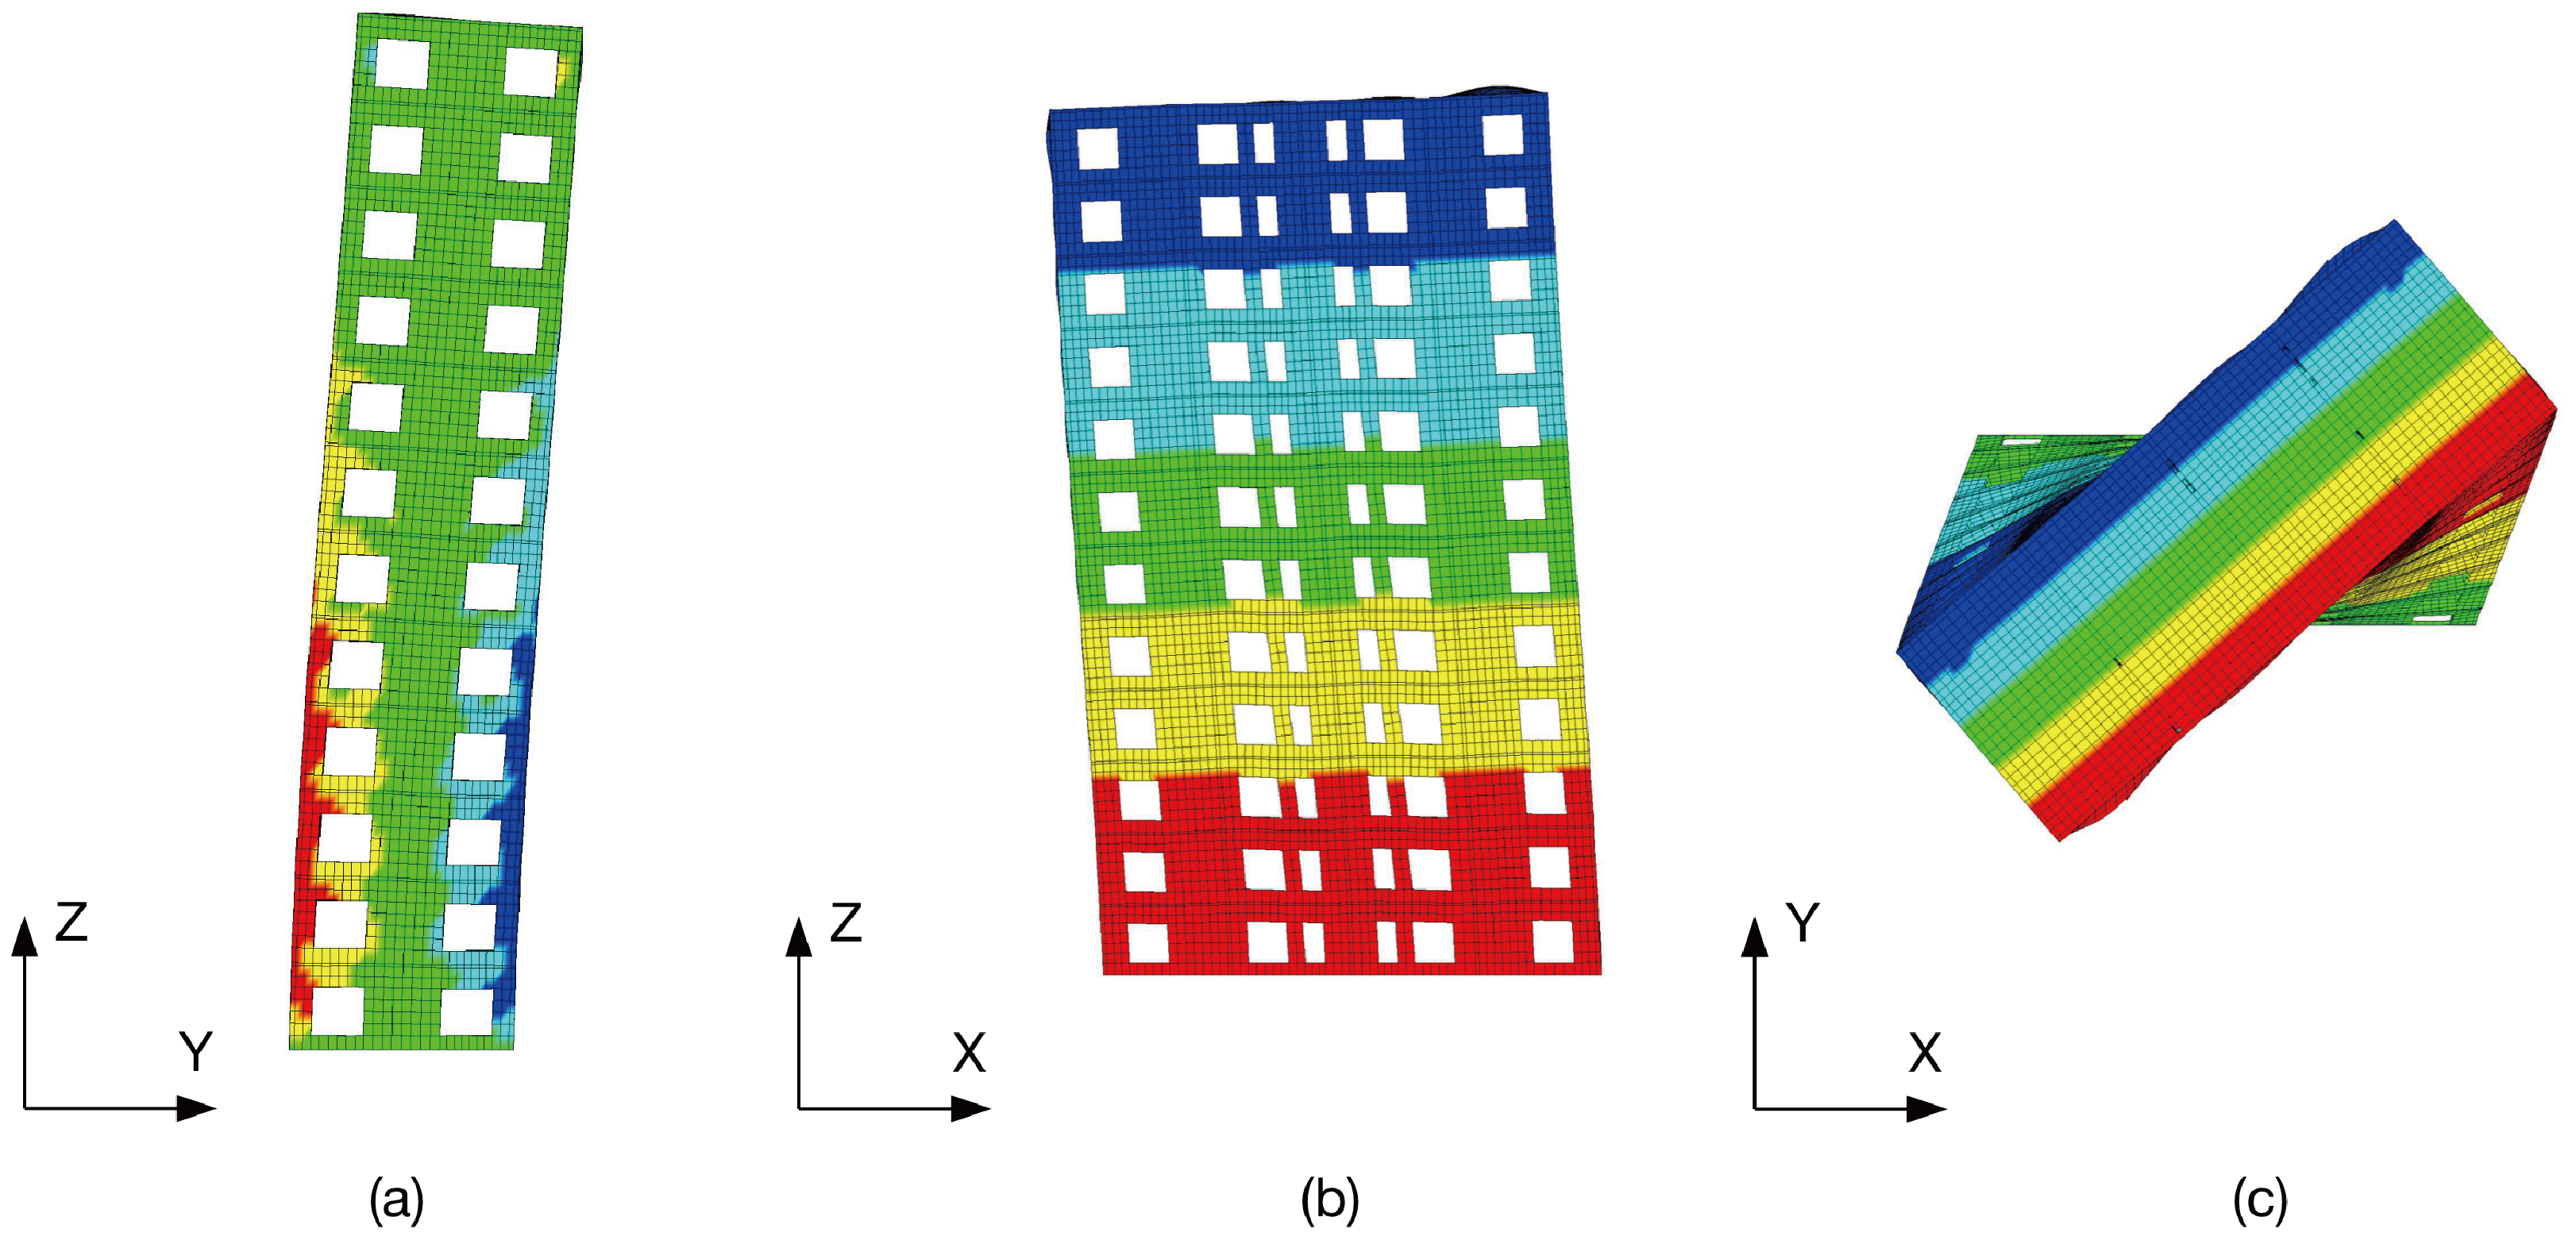
This paper uses a 12-story building as an example case study. The building may be subjected to earthquake and explosion hazards during its service life. The shear wall structure was designed according to the Chinese Seismic Design Code [28,29]. The fortification seismic intensity of the site is 7 degrees, equivalent to the design peak acceleration (PGA) of 0.10 g. The seismic design group is the first group, and the site soil category is II. The schematic of the prototype shear wall structure is shown in Figure 2. The structure was constructed with C40 concrete, which has a standard compressive strength of 40 MPa [30]. The software ANSYS was used to establish the FE model (Figure 3), which was then imported into the explicit dynamic FE analysis program LS-DYNA for numerical simulations [31]. Arbitrary–Lagrange–Euler (ALE) and fluid–structure interaction (FSI) algorithms were used to simulate the propagation of blast waves in the air and the interaction of the waves with the shear wall structure [24,32]. The mesh sizes of the shear wall structure were determined by trial and error to optimally model damage modes and reflect the true dynamic responses of the shear wall structure. The mesh sizes of shear wall structure, air volume, and TNT were, respectively, 500, 500, and 100 mm. Note that in this study, the overall structural response was observed rather than the responses of the individual components. Thus, rebars were neglected to increase simplicity and computational efficiency. Furthermore, the seismic mass acting on the shear wall structure is 180 tons for each floor. The P-delta effect was taken into account in the FE model. The first three mode shapes of this shear wall structure are shown in Figure 4, with the first three periods being 0.54, 0.37, and 0.26 s, respectively.
Considering that the HJC model cannot simulate the spalling and crushing of concrete, the keyword * M A T _ A D D _ E R O S I O N was utilized to delete the excessively distorted structural elements. This function improves the chances of convergence and can accurately model structural failure and erosion. In this paper, the maximum erosion principle was set to 0.01 [33]. The parameters for modeling the concrete [21], TNT [33], and air [33] are listed in Table 2, Table 3 and Table 4, respectively.
Throughout the duration of the earthquake, the shear wall structure, which has fixed end constraints in both the earthquake and explosion stages, is discretized by the solid164 element. The keyword * R I G I D W A L L _ P L A N A R was used to create an infinite rigid ground. Regarding load application, two keywords * L O A D _ B O D Y _ Z and * L O A D _ B O D Y _ P A R T S were used to apply gravity loads. Furthermore, the keywords * L O A D _ B O D Y _ G E N E R A L I E D _ S E T _ P A R T S were used to apply the ground motions in the horizontal direction of the structure system.
At the end of the earthquake, explosive loads were applied to the structure. The full restart method provided by LS-DYNA was used to reproduce the different loading steps. The air and TNT were simulated by the solid164 element. ALE is applied to simulate the propagation of blast waves in the air and their interaction with the shear wall structure. The interaction between air, TNT, and the shear wall structure was simulated using FSI through the keyword * C O N S T R A I N E D _ L A G R A N G E _ I N _ S O L I D . Finally, the air domain was created appropriately, and non-reflective boundary conditions were set to save computational time. Thus, the blast wave can transmit through the boundary of the air domain without reflection.

3.2. Earthquake–Blast Disaster Chain

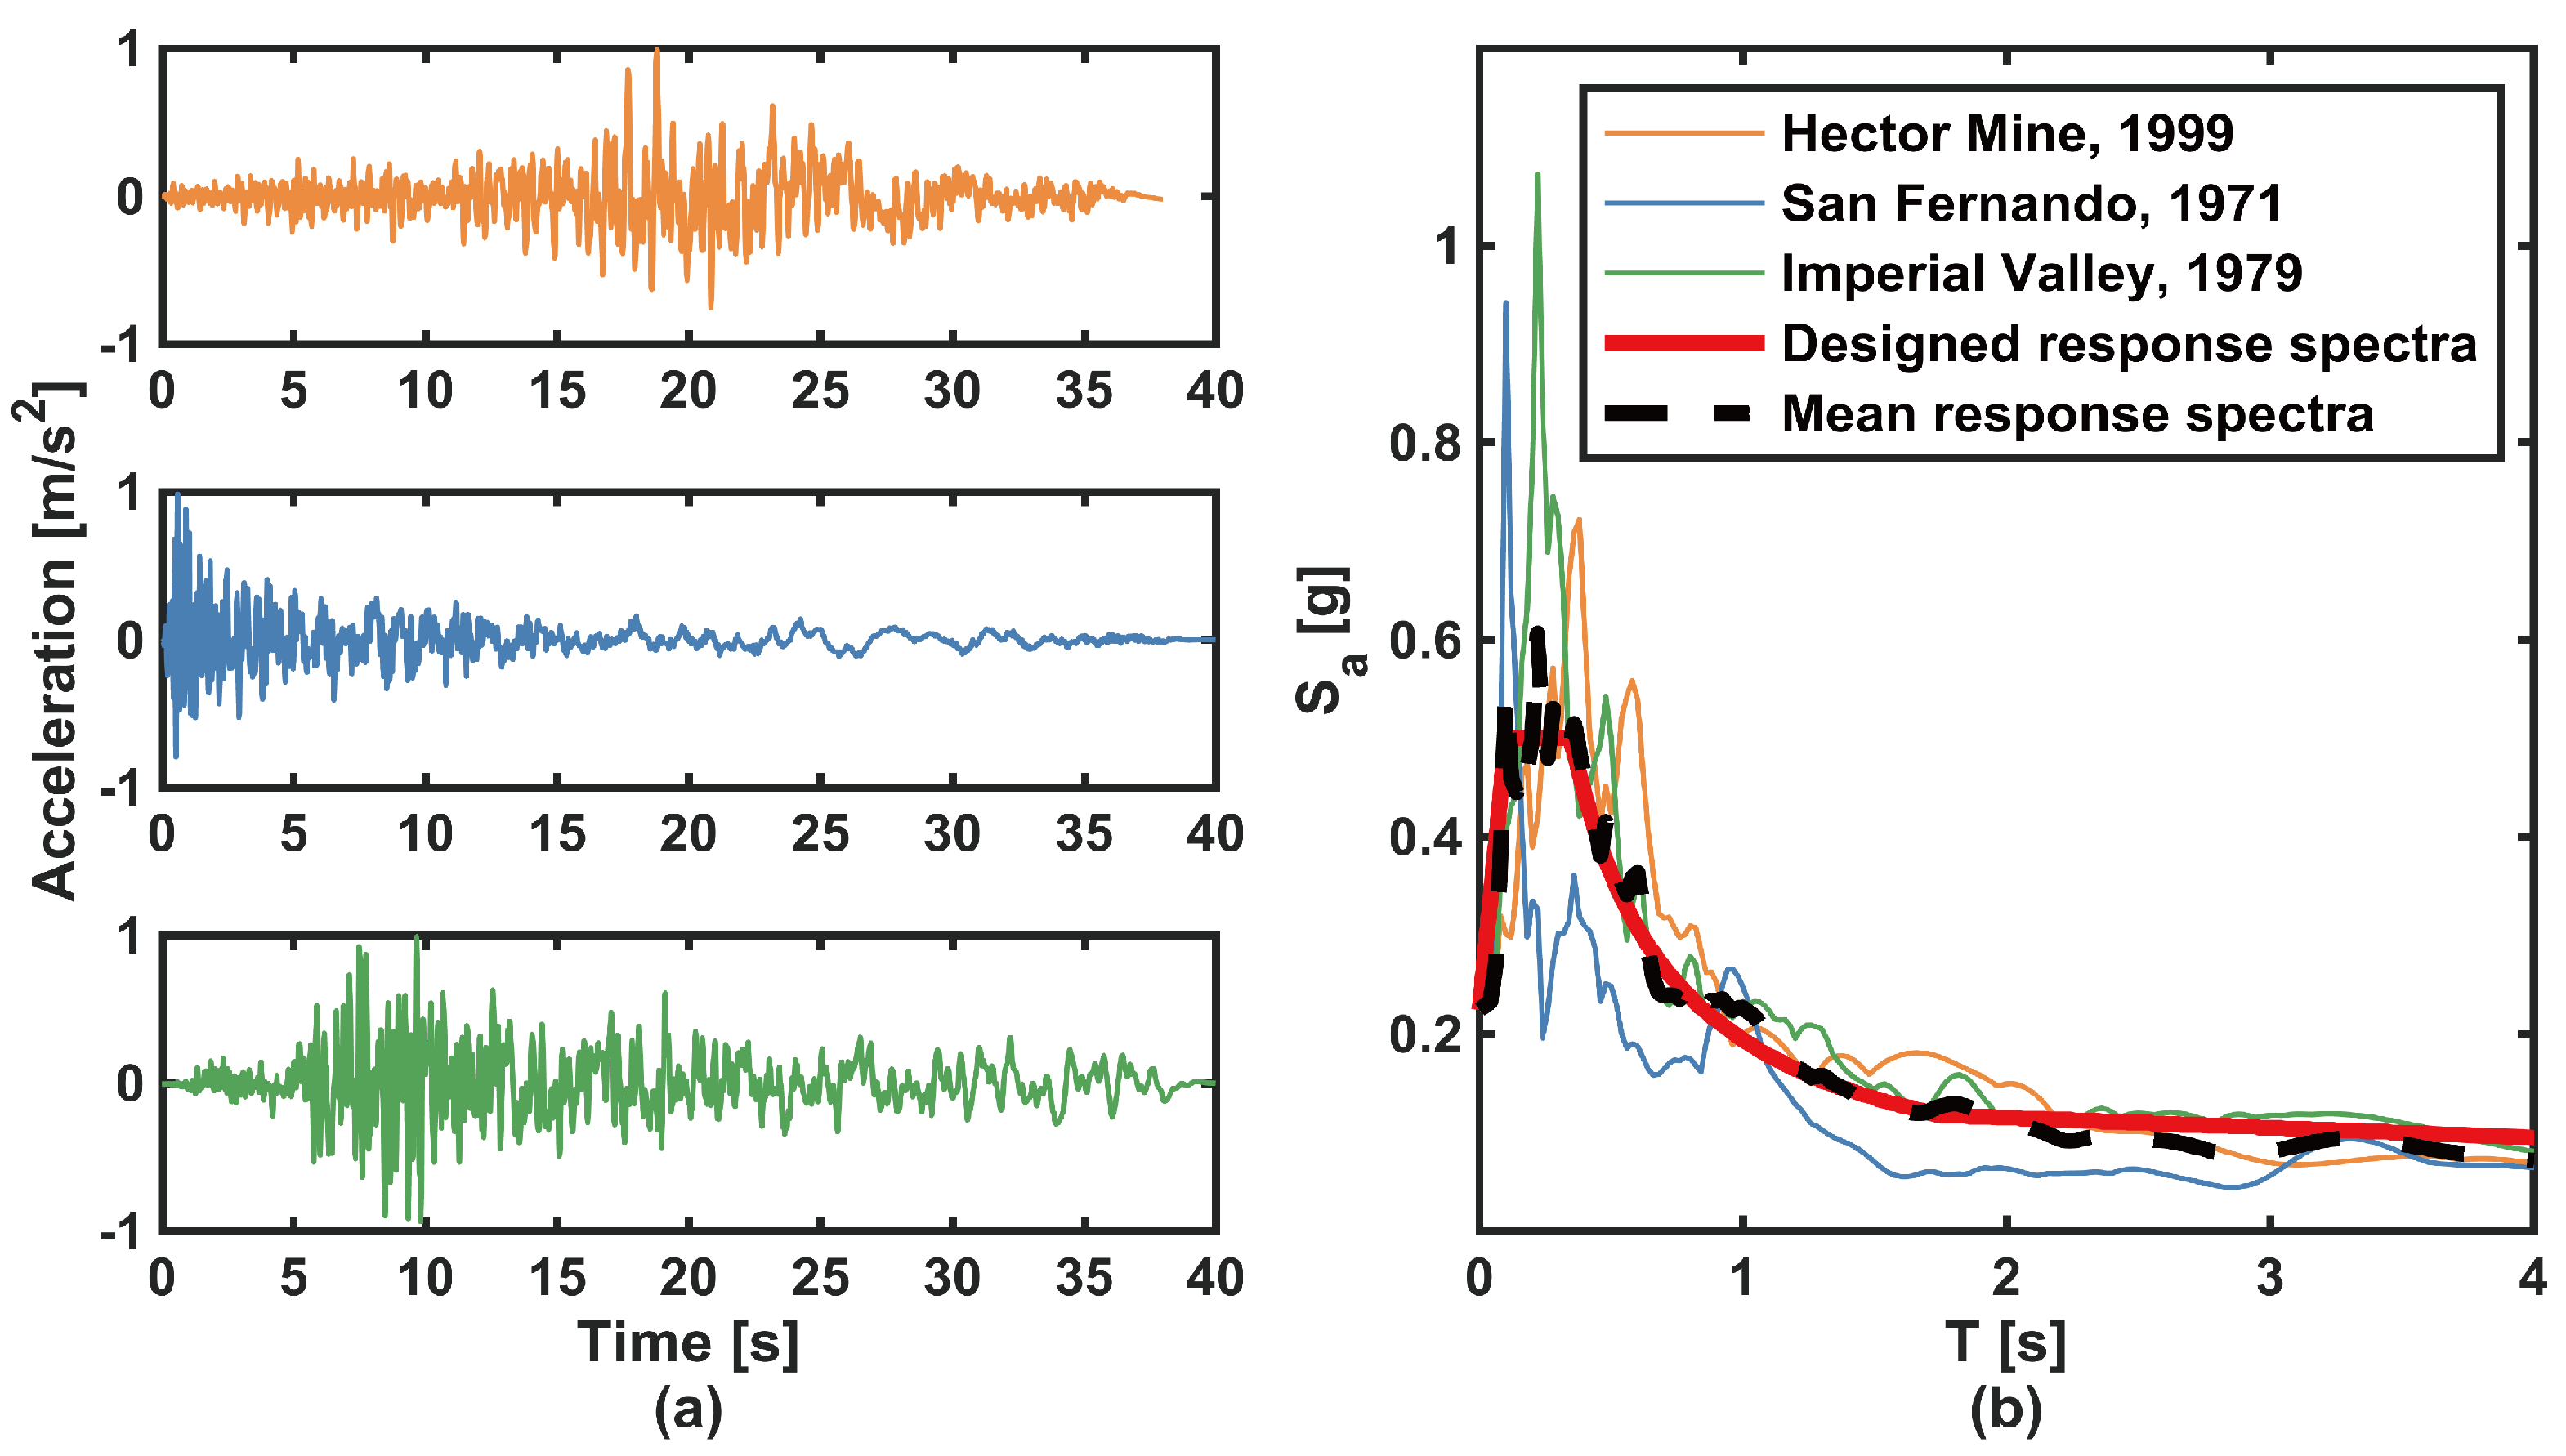
The three recorded seismic events, namely, the Hector Mine, San Fernando, and Imperial Valley events, were applied to the example shear wall structure. The PGA of each record was normalized to 0.1 g, which is compatible with the Chinese design response spectrum at a 5% damping ratio [34]. Figure 5 illustrates the three selected earthquake ground motions. Further details of the three used seismic events are listed in Table 5.
The simulation parameters adopted for the blast loads in this paper were as follows:
(1)
The concentration of methane in the first and sixth story was assumed to be the worst possible (i.e., 9.5% [19]), and the mass equivalent of TNT can be obtained by Equation (2), that is, 150 kg.
(2)
Consider that there would be many pipelines buried underground, but also that the story drift ratio of the sixth floor is the largest after the earthquake. The pipelines are prone to damage, and thus the explosion takes place in one of four locations: the corner room on the first floor, the middle room on the first floor, the corner room on the sixth floor, or the middle room on the sixth floor, as shown in Figure 6.
(3)
The explosion occurs in the center of the appropriate mentioned room.
Table 6 lists 15 cases of earthquake–blast disaster chains. Cases 1–3 represent the scenarios without explosions. Cases 4–6, 7–9, 10–12, and 13–15 describe the scenarios with an earthquake combined with a blast in the corner room on the first floor, the middle room on the first floor, the corner room on the sixth floor, and the middle room on the sixth floor, respectively. In all cases, the structural responses, in terms of roof displacement, story drift ratio, and explosion overpressure, are systematically investigated and represented in the following section.

4. Results and Discussions

4.1. Overpressure Time Histories

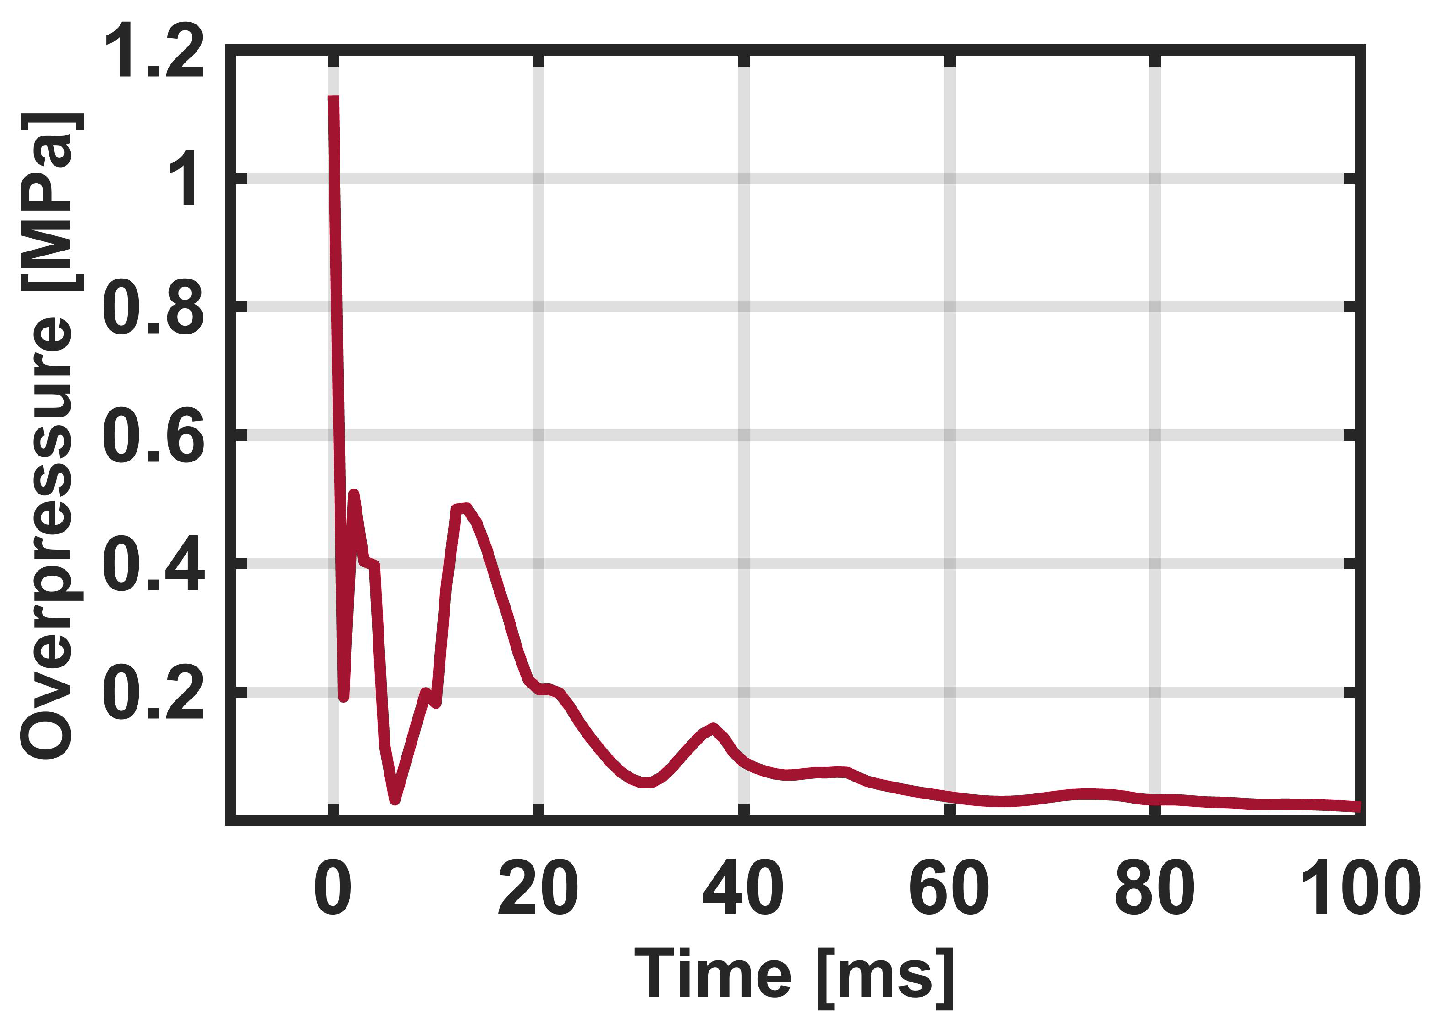
The overpressure at multiple locations of the FE model was investigated. Figure 7 shows the blast wave overpressure time history at the geometric midpoint of the floor of the corner and the middle room on the first floor. As shown in Figure 7, at the moment of the explosion, the shock wave will reach an overpressure peak of 1.27 MPa. This value is only 4.76% less than that specified in safety regulations for blasting (1.33 MPa in [35]), which proves the reliability of the overpressure cure. It can be seen that there are multiple peaks in the overpressure time history of Figure 7. These peaks are mainly caused by wave reflections from the ground, shear walls, and floor. Additionally, the diffraction of the shear walls can also contribute to the multiple peaks. After several pressure peaks, the pressure gradually decays to a lower level. This decay is due to the overpressure wave diffusing outdoors and being absorbed by the structure.

4.2. Displacement Time Histories

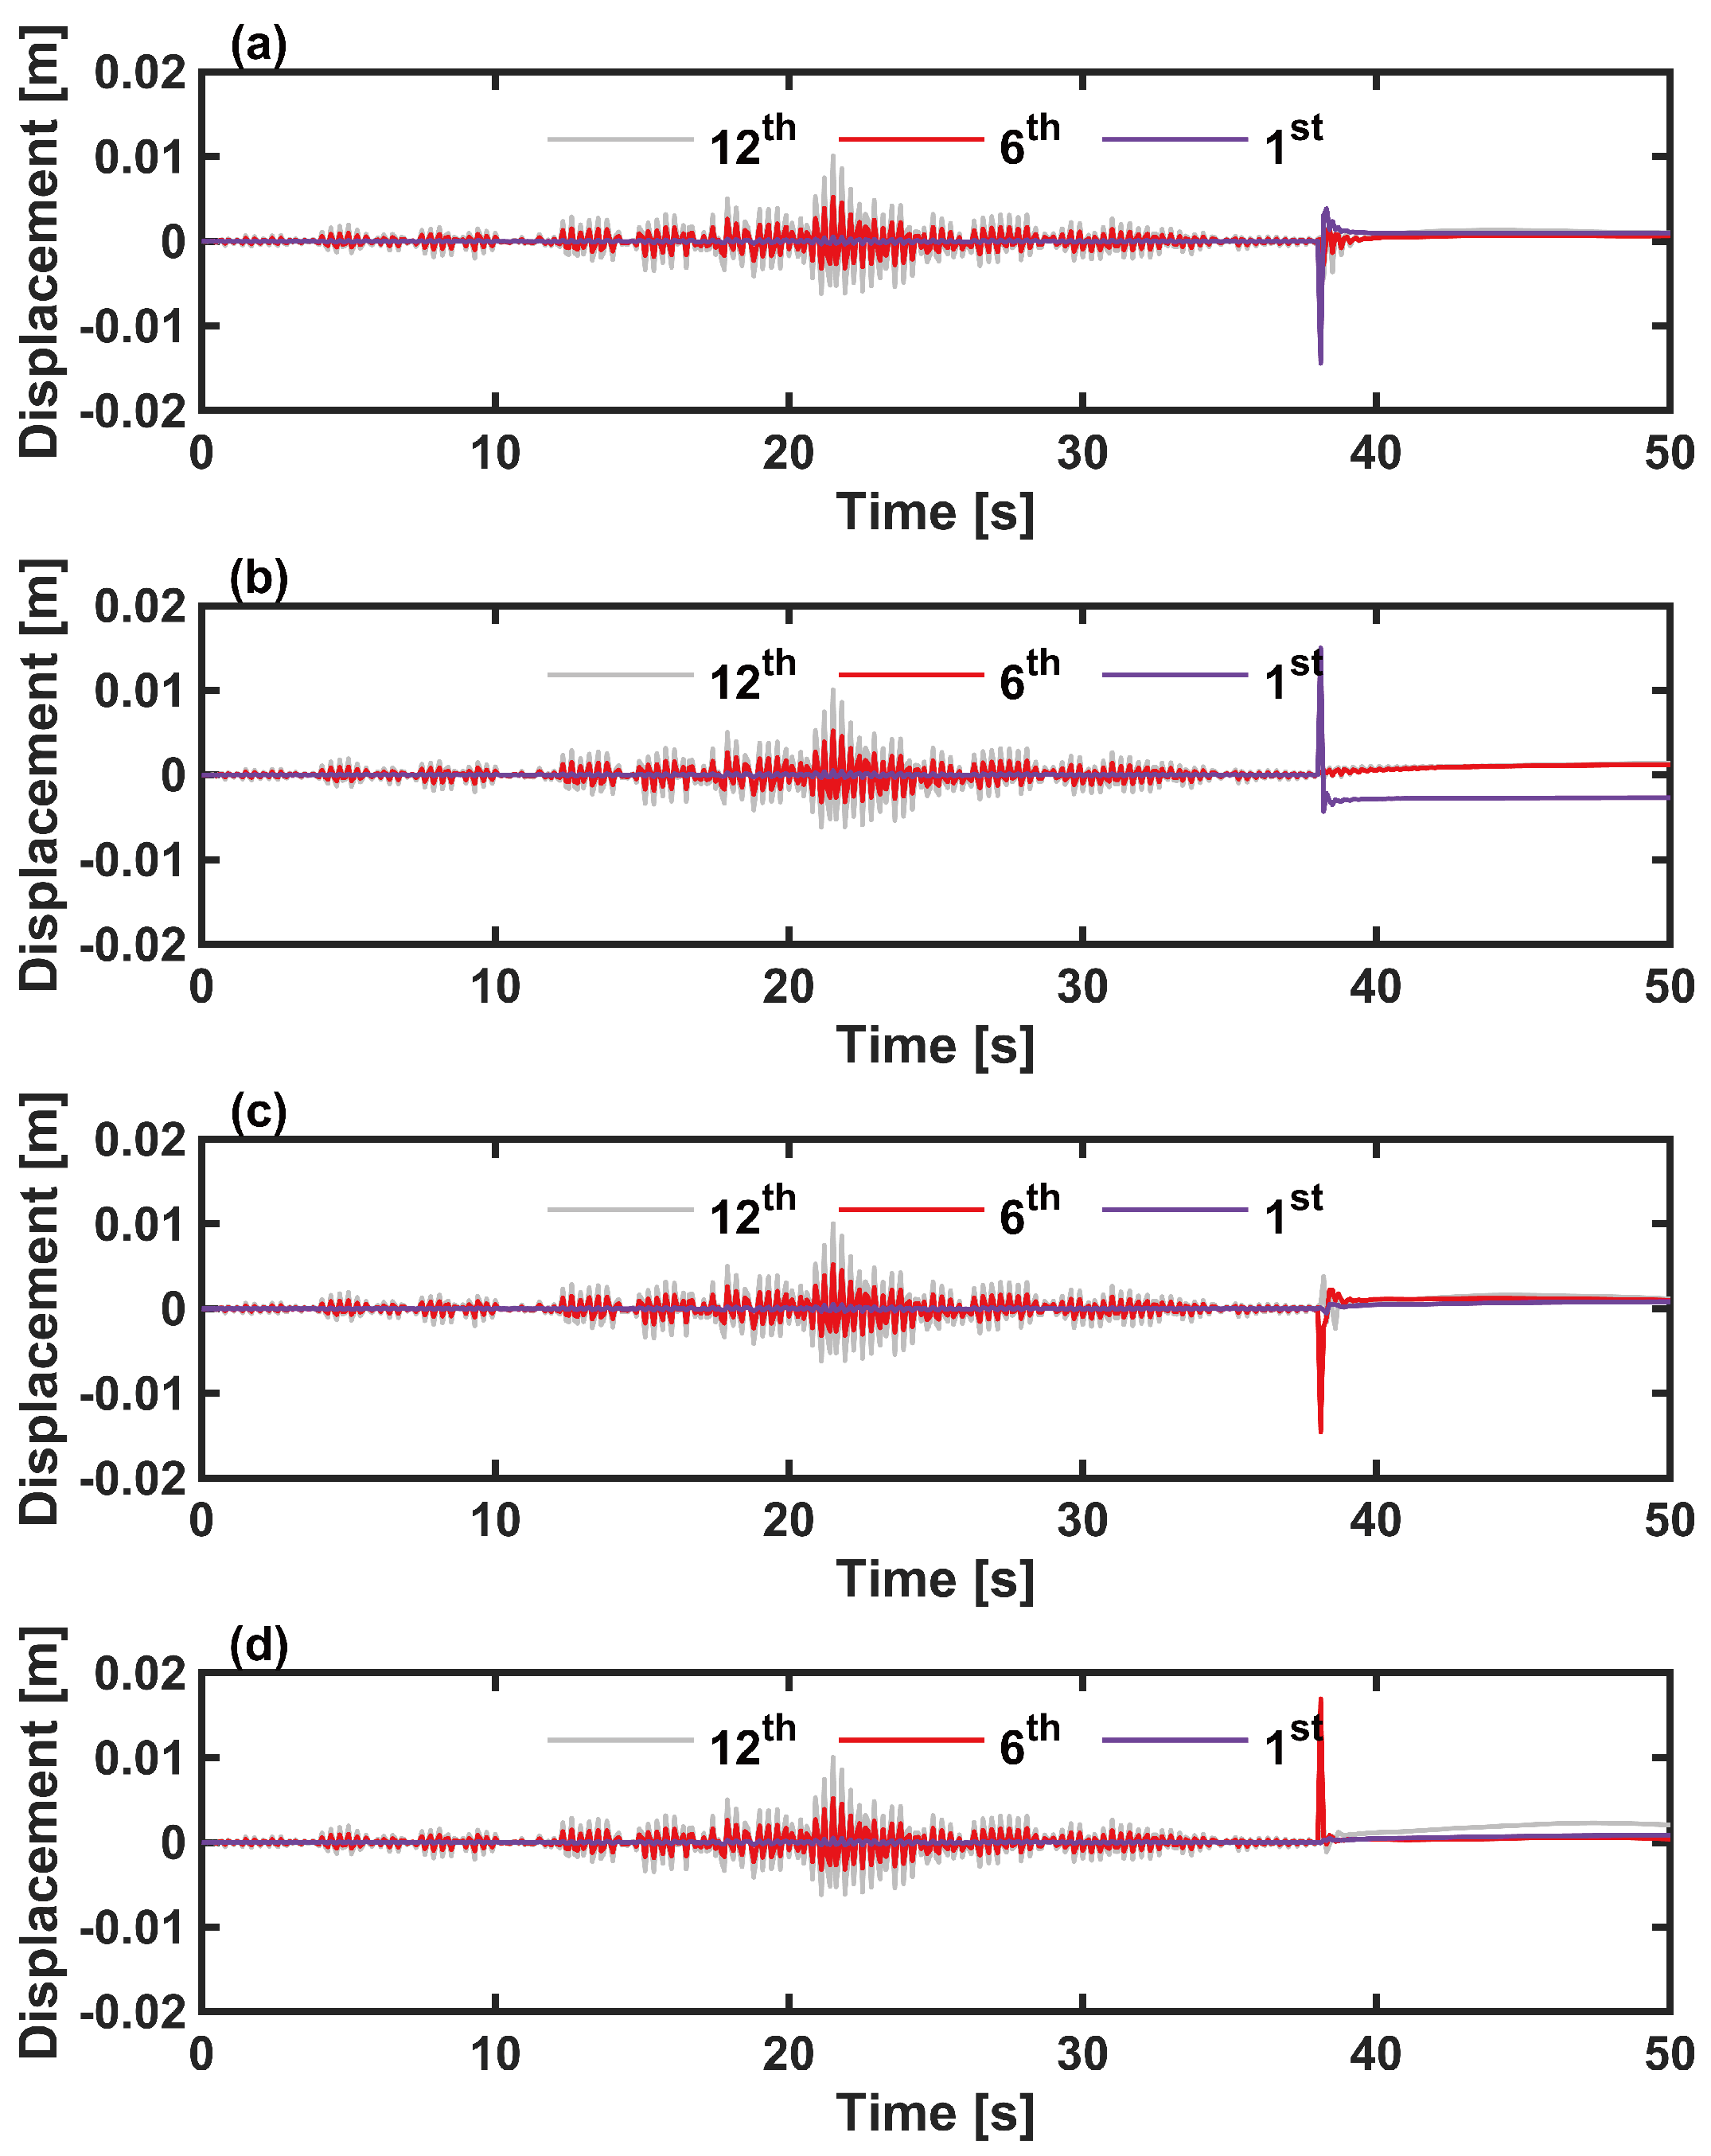
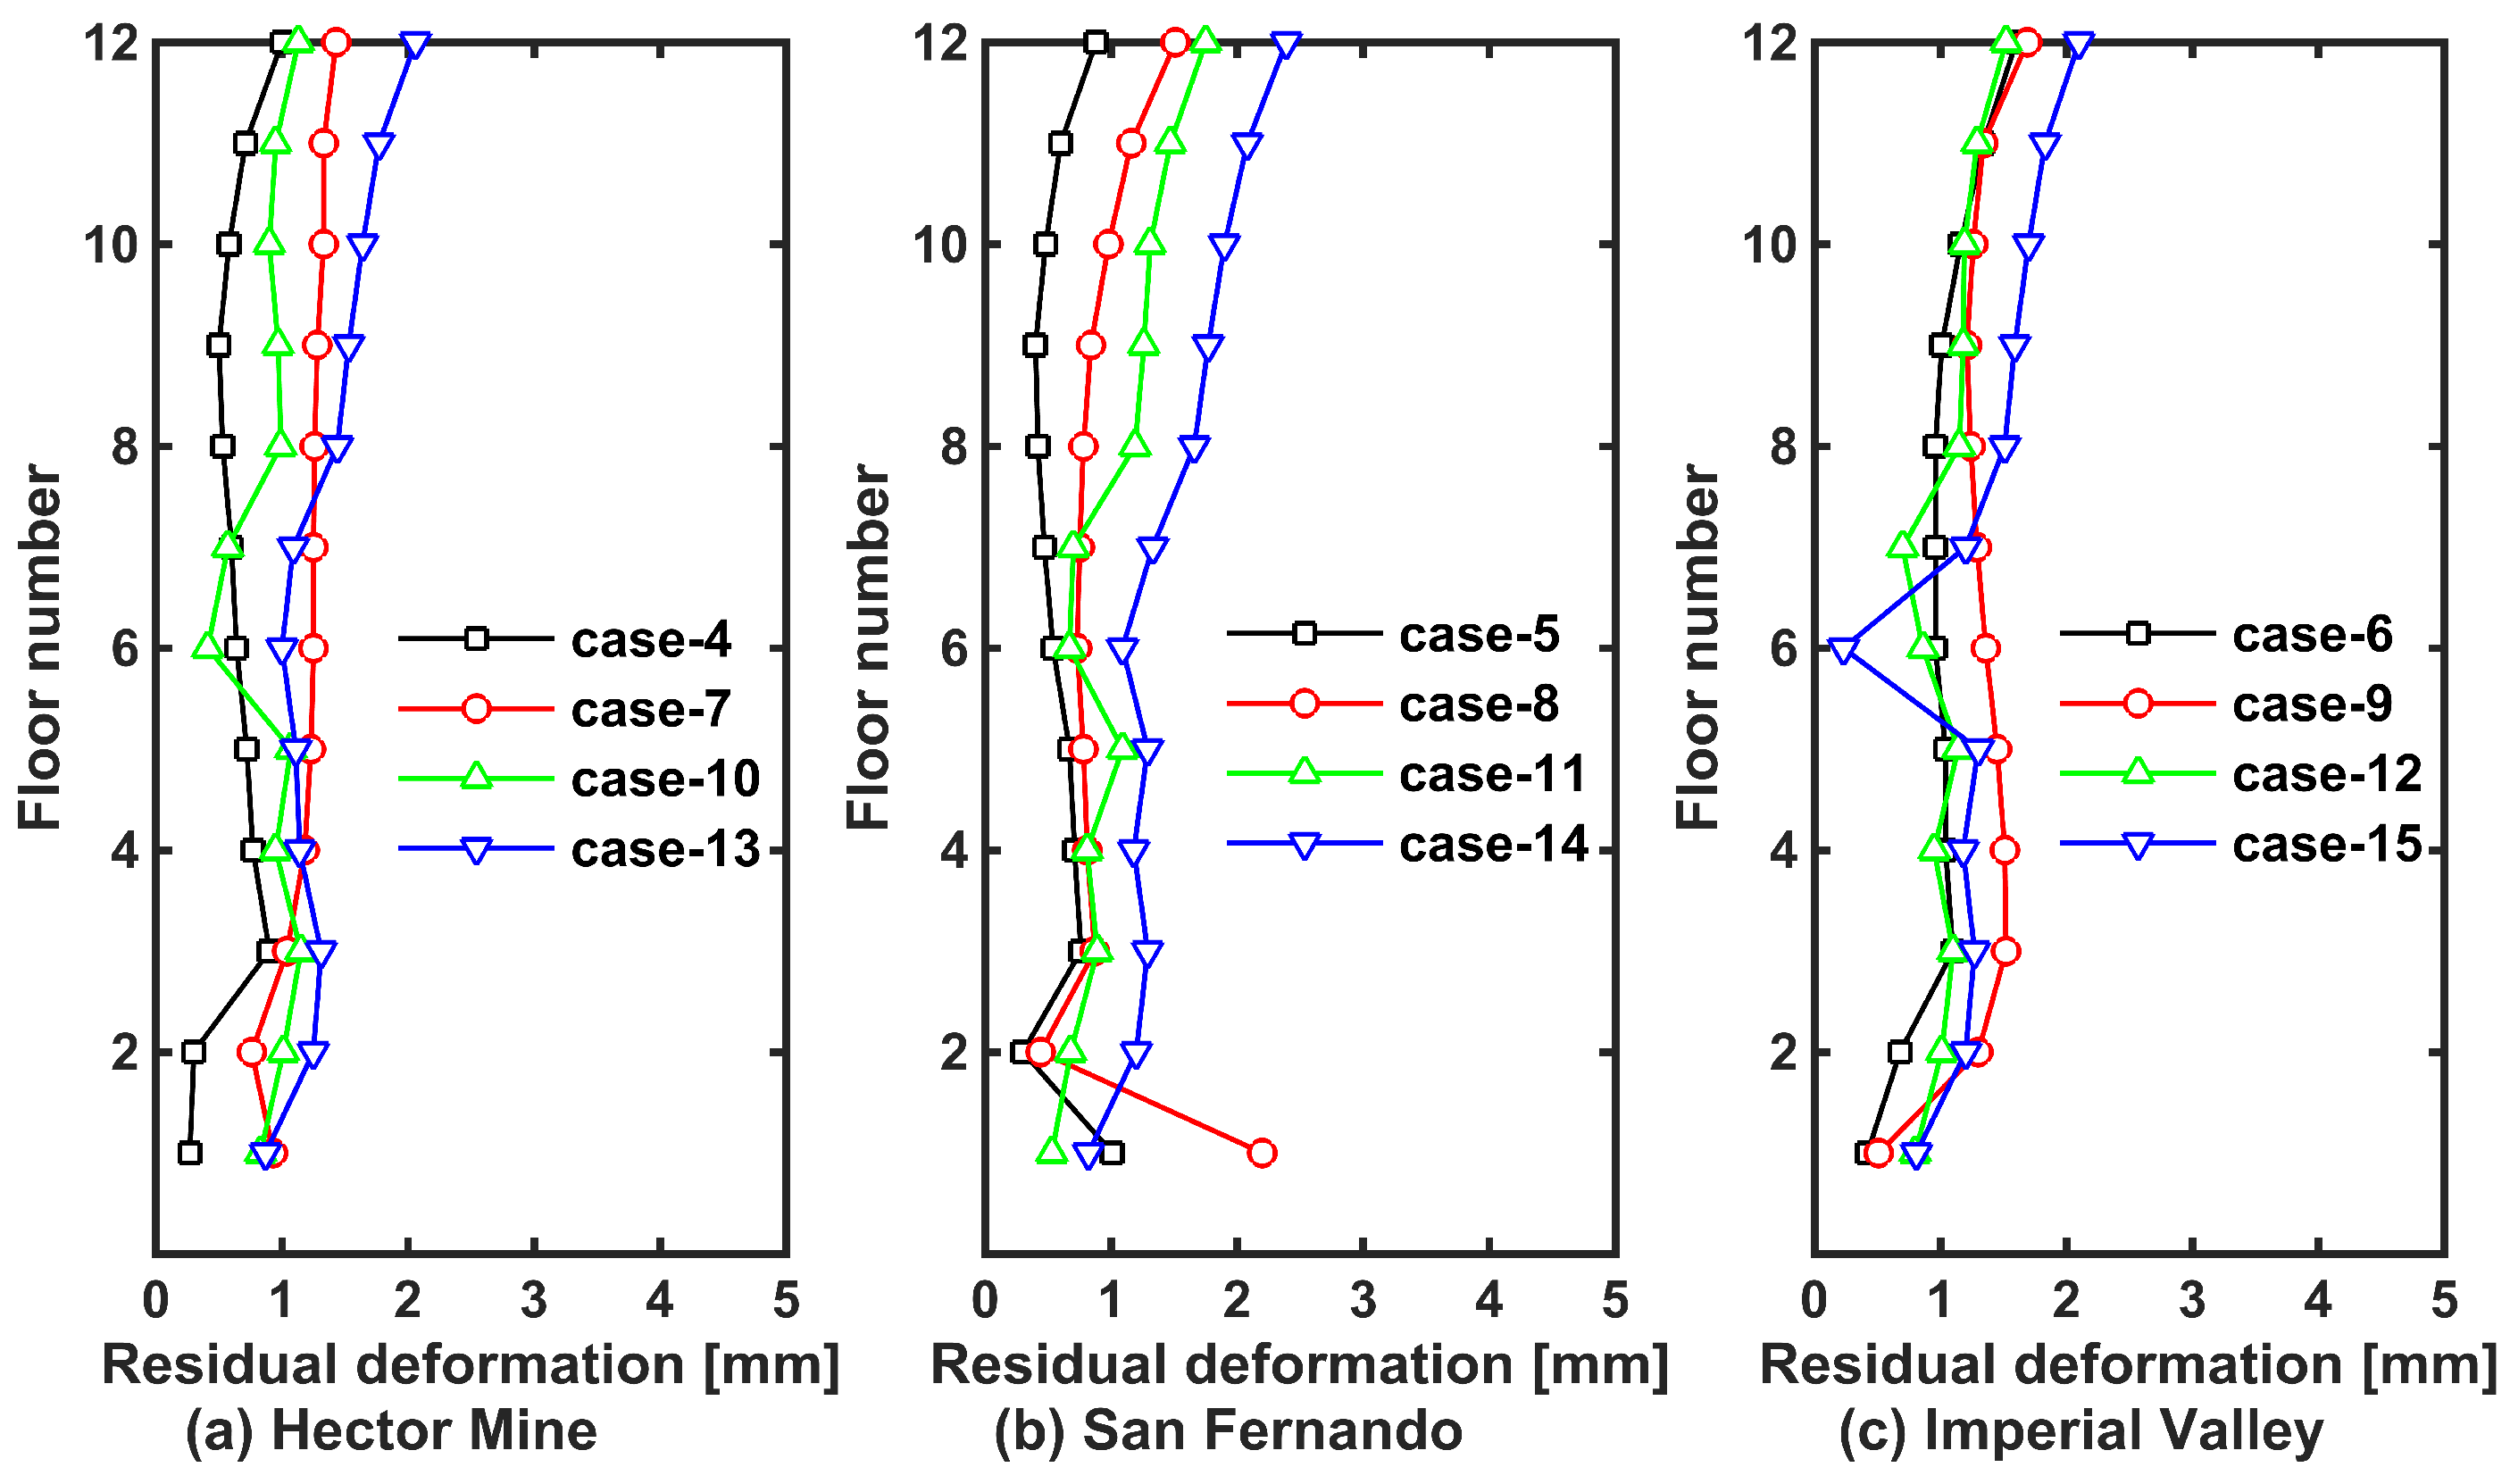
The displacement–time-history curve was extracted from the top midpoint of the shear wall in the middle of the corner and the middle room. Figure 8 provides the time histories of the first, sixth, and twelfth-story displacement under the action of a Hector Mine earthquake–explosion disaster chain. During the earthquake, the top story will be displaced by approximately 1.00 cm. At the moment of the gas explosion, the explosion will dramatically alter the horizontal displacement of the shear wall structure, which will be about 4.00 cm. At this time, some structural members risk losing their bearing capacity and thus failing. Moreover, the increase in displacement will vary with the explosion location. When the explosion occurs on the first floor, the displacement of the first floor will increase instantly; on the other hand, the effects on the displacements of the sixth and twelfth floors will be relatively small. The reason for this phenomenon lies in the fact that the sixth and twelfth floors are far away from the explosion; in addition, after the initial shock wave from the explosion dissipated, the structure will enter into free vibration. The residual deformation caused by the explosion loads will be higher when the explosion occurs in the corner of the first story than when the explosion occurs in the middle of the first story.
The other two earthquake excitations yielded similar results as the above. All the maximum displacements and the residual structural deformations are, respectively, summarized in Table 7 and Table 8. The results show that the explosions would cause the structure to experience plastic deformation, which would significantly reduce the multi-hazard resistance of the structure and make future use of the structure problematic without extensive repairs.
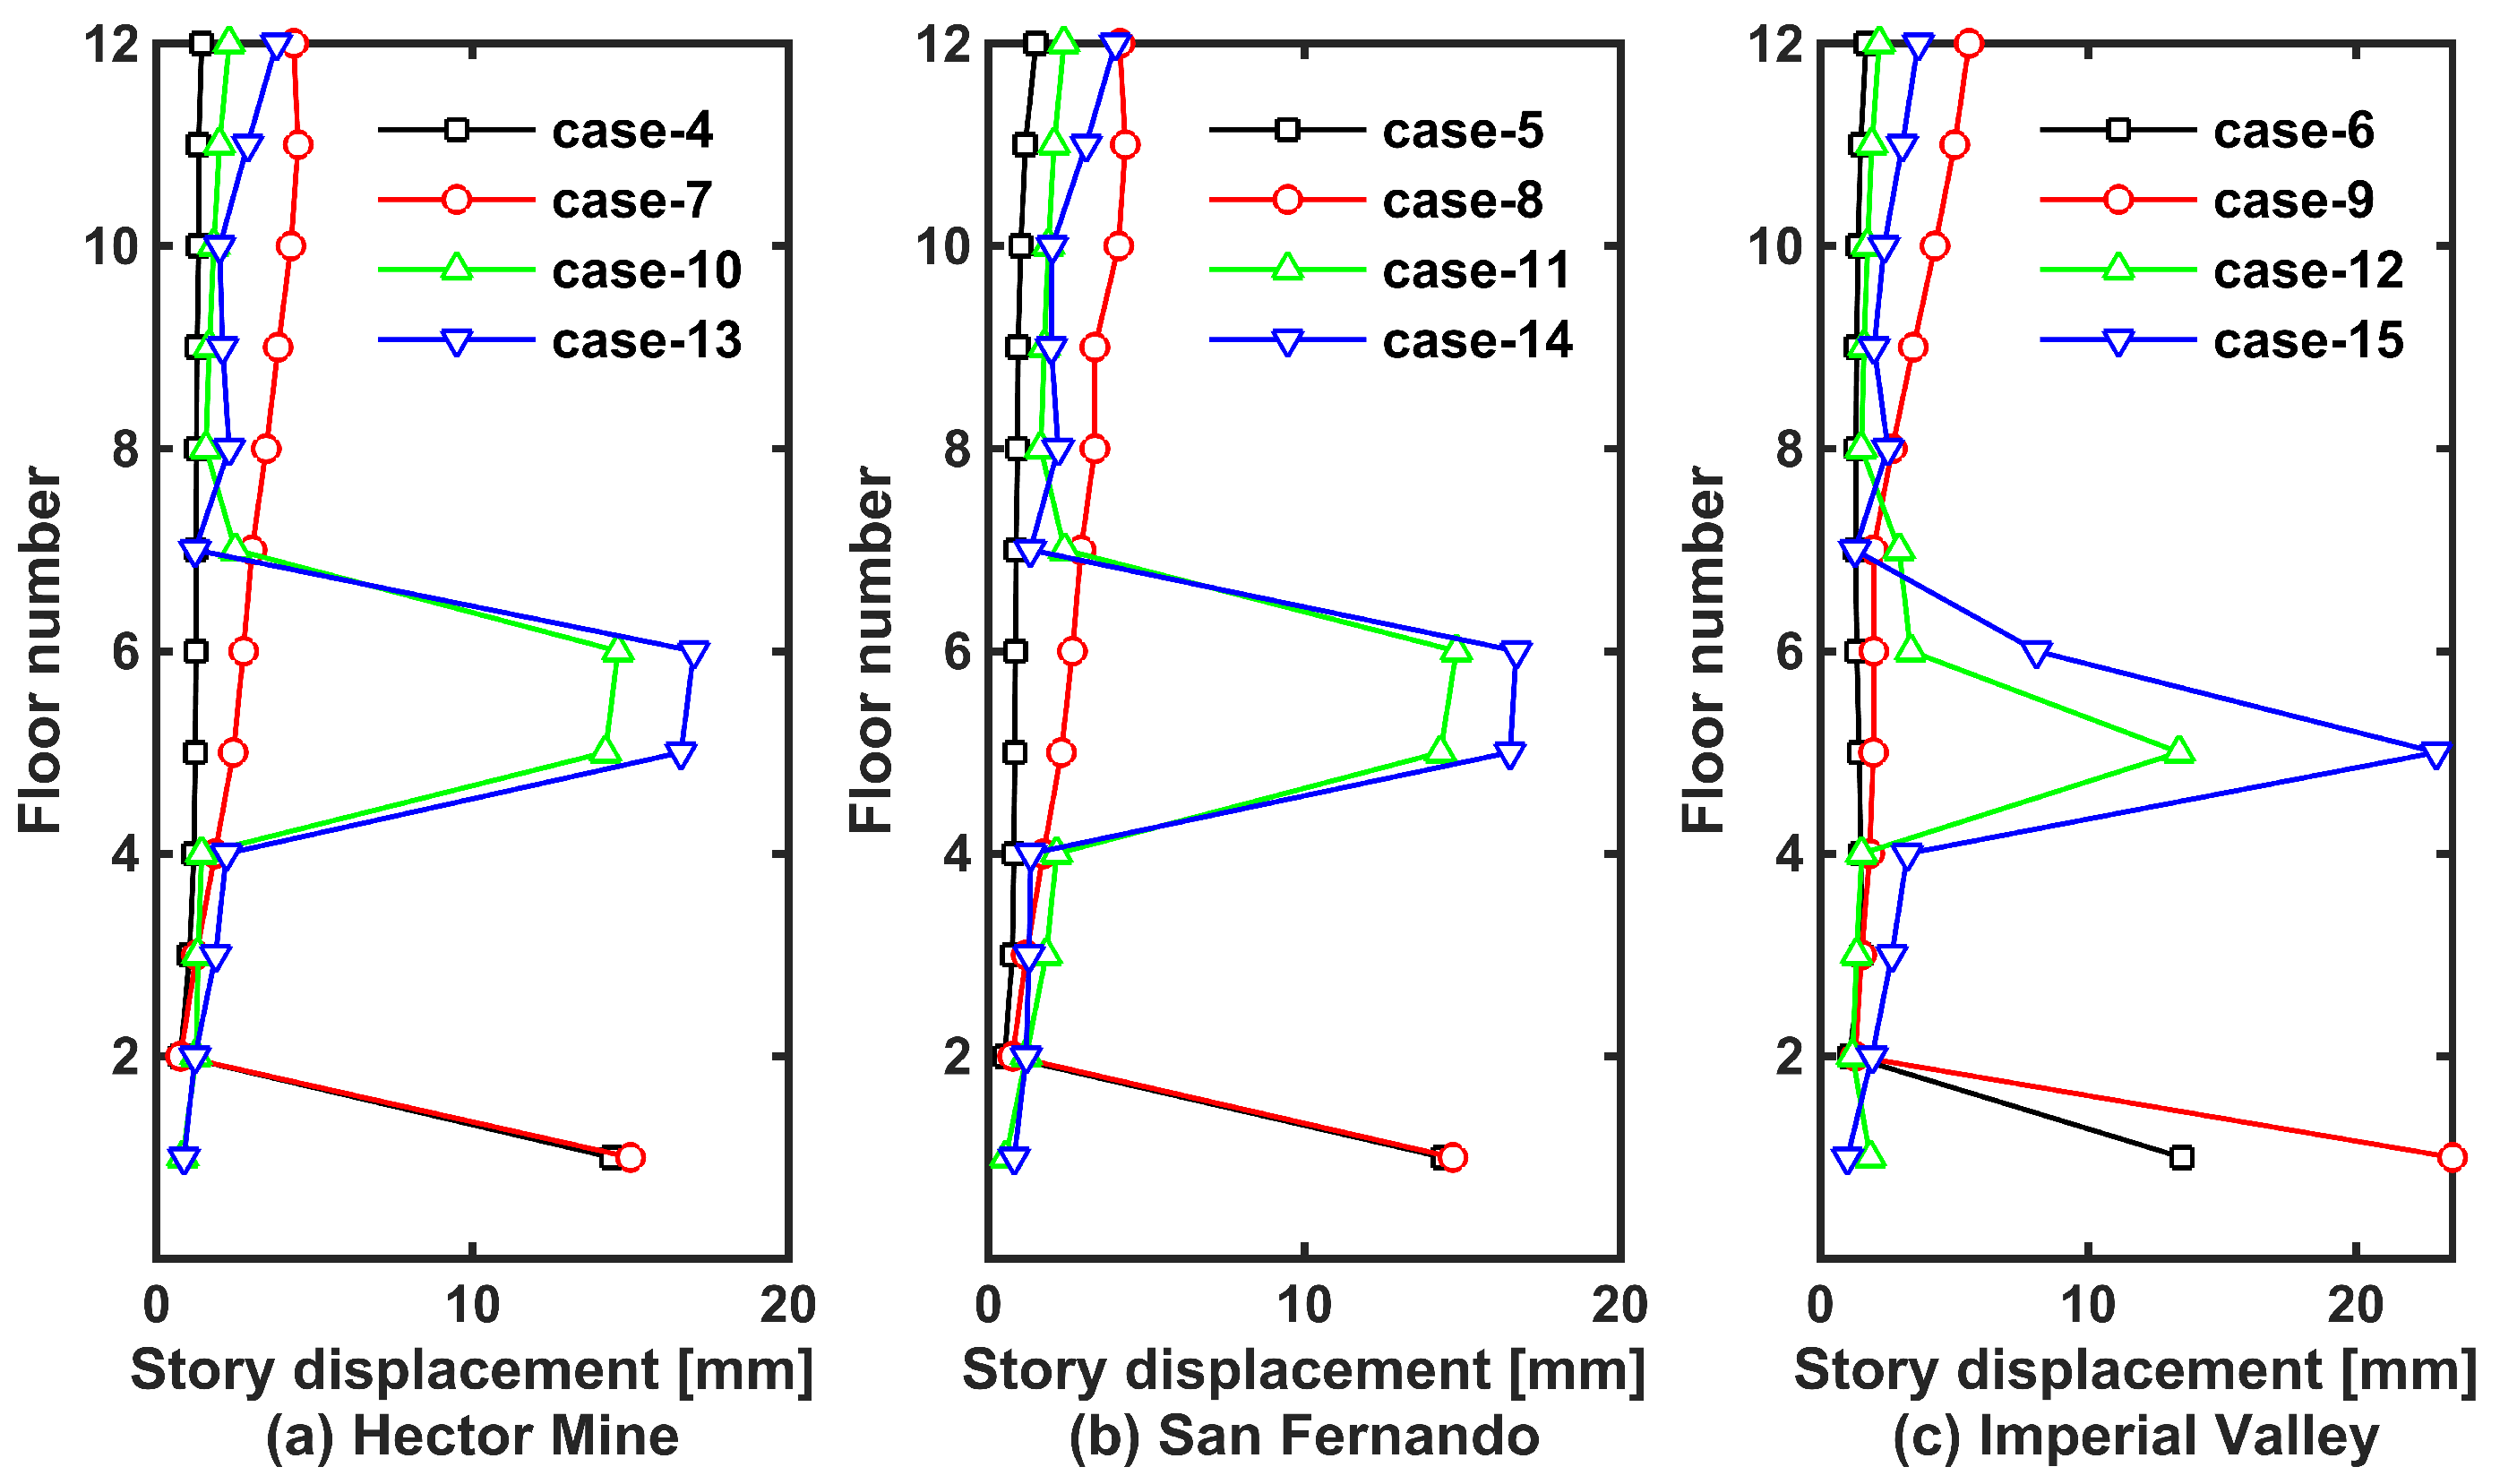
Figure 9 and Figure 10 further show the peak displacement and the plastic deformation of each floor under an earthquake–blast disaster chain respectively. The earthquake–explosion disaster chain increased the overall displacement of the structure. It should be noted that deformations were much higher for the floor directly exposed to the explosion load than for the other floors. However, Figure 9 suggests that blasts have a stronger influence on structural performance compared to earthquakes.
Figure 11 presents the damage distribution of the shear wall structure exposed to the explosion in the corner room of the first floor after San Fernando earthquake. It can be seen that the damage caused by the earthquake is widely distributed in the shear wall structure. In contrast, the damage to the shear walls caused by the gas explosion is highly localized. According to the principle of energy conservation, the energy generated in a gas explosion disperses into the air and is absorbed by the shear walls. The absorbed energy causes large deformation and local damage of shear walls.
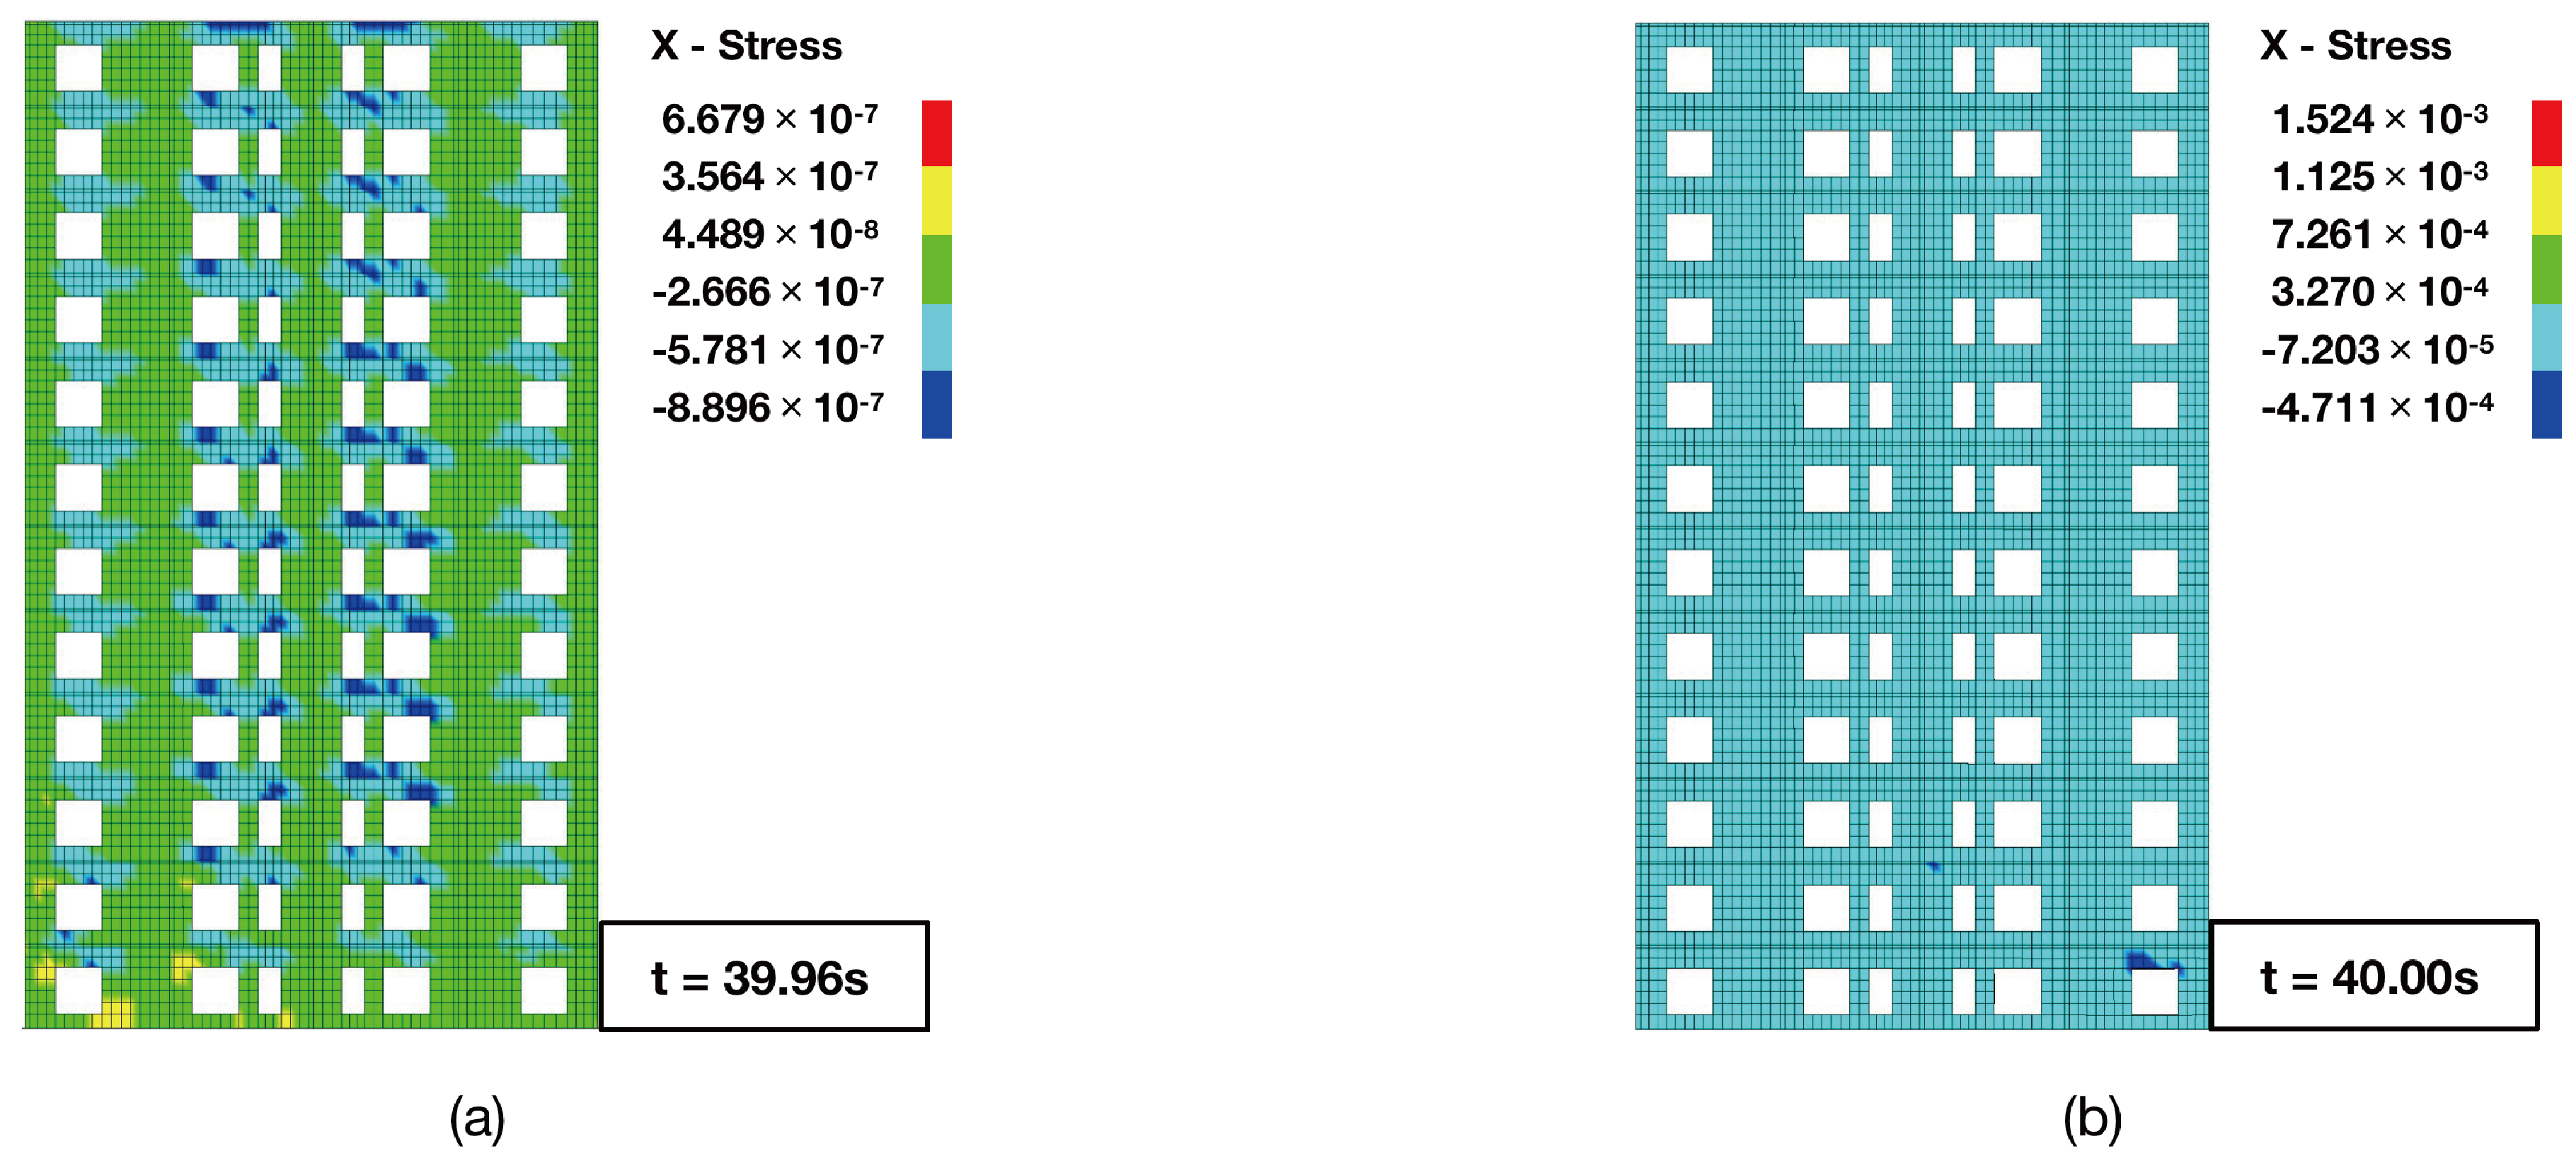
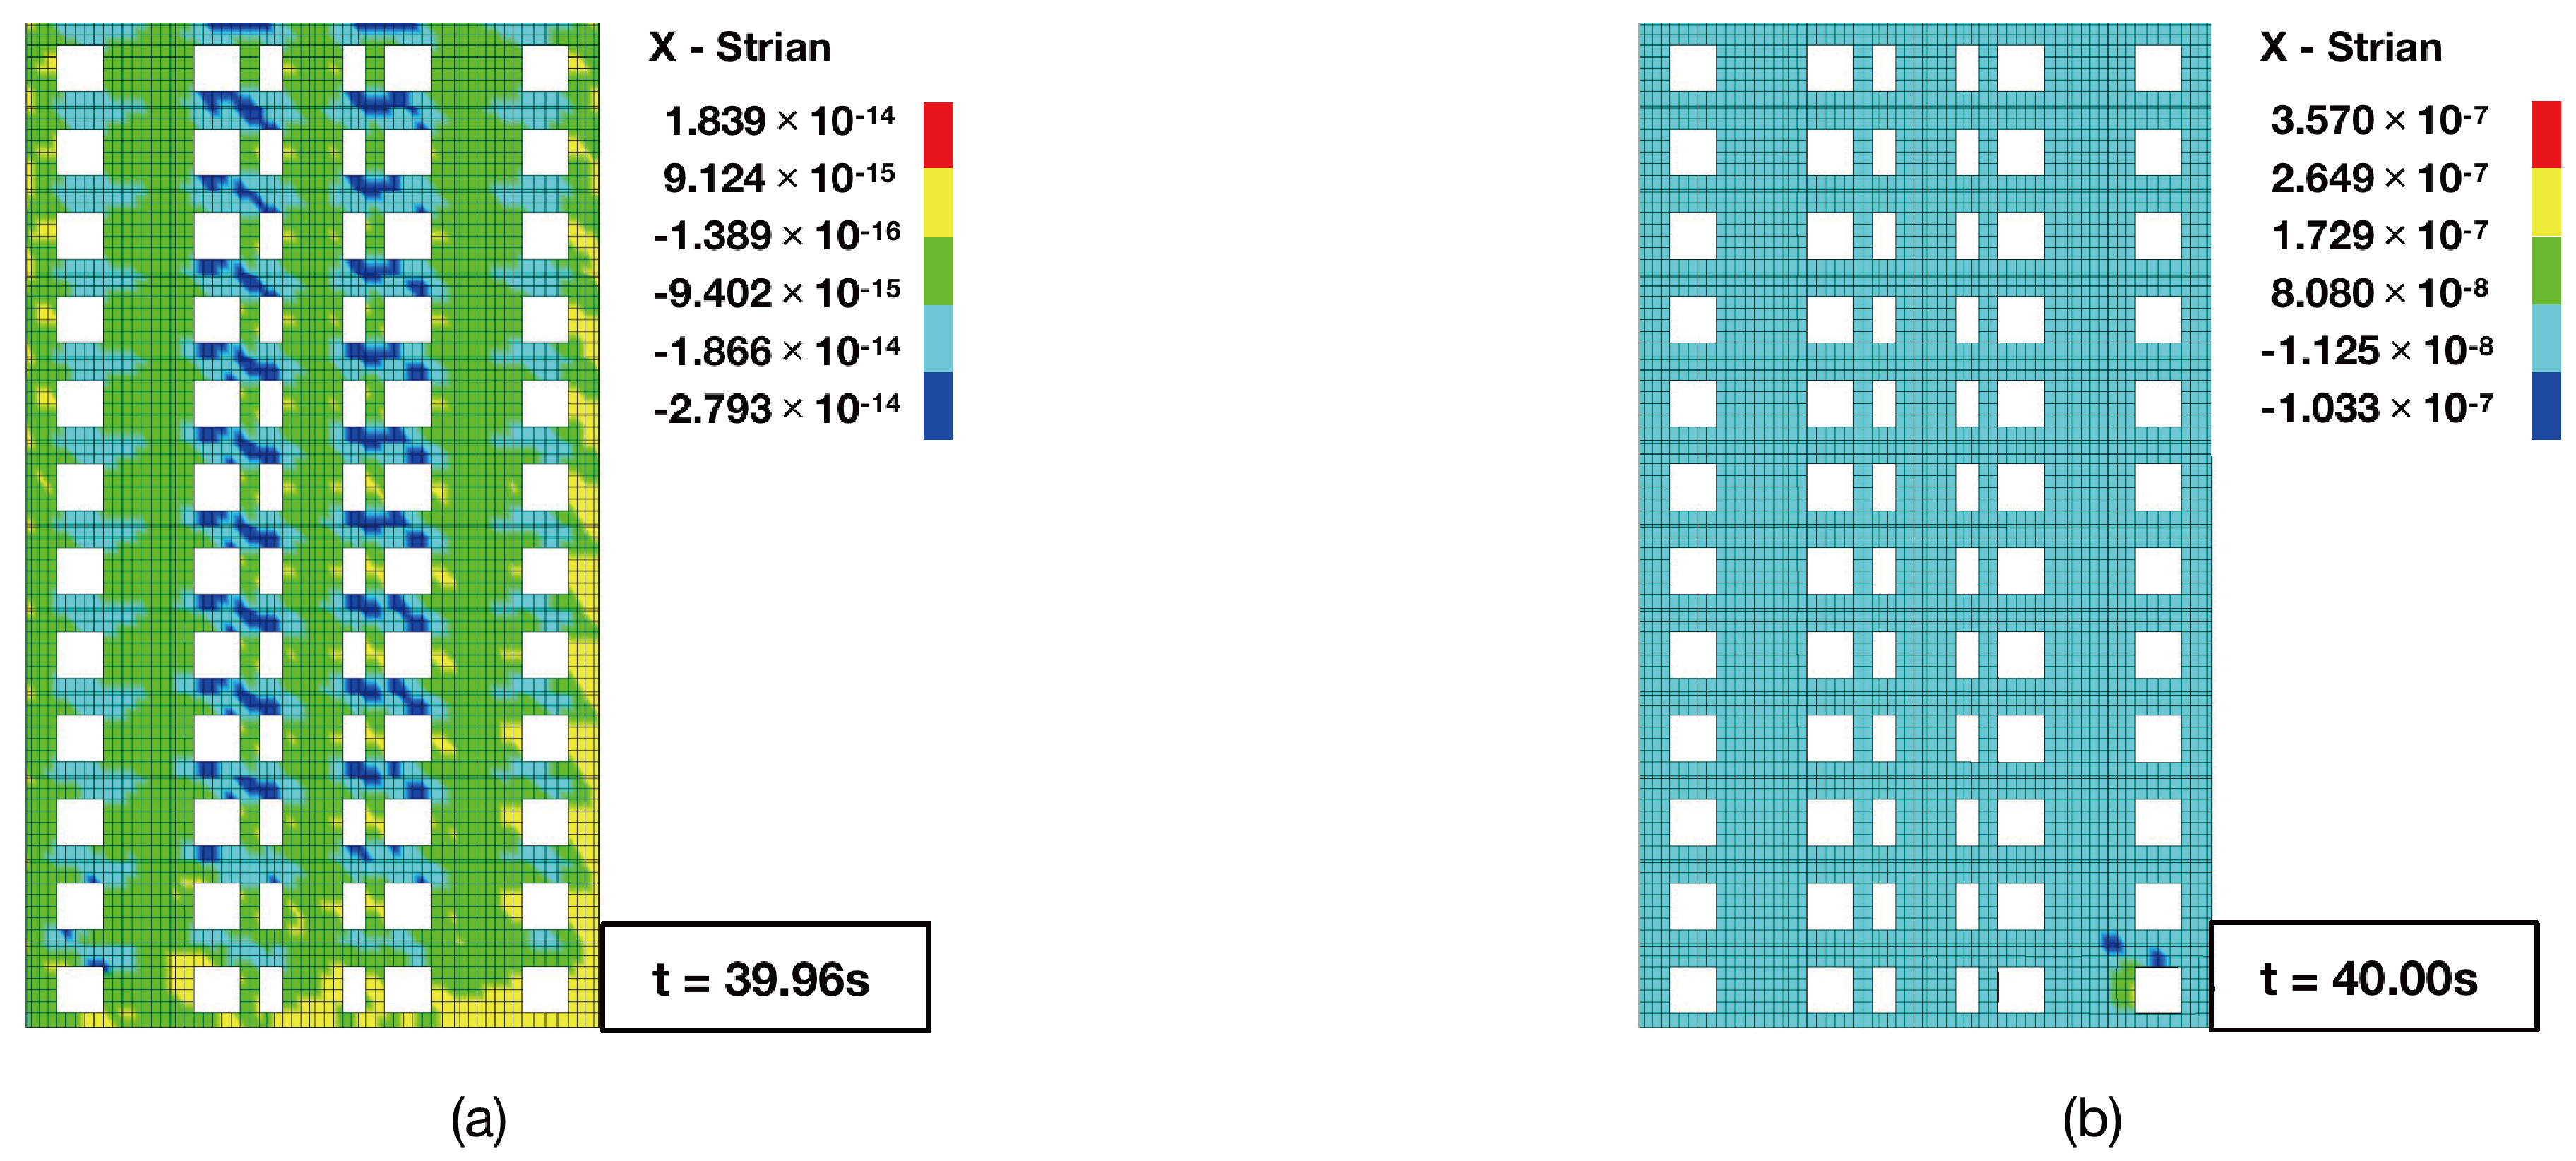
The corresponding stress and strain field in the x direction are shown in Figure 12 and Figure 13, respectively. It can be seen that the stresses and strains caused by the earthquake are much less than those caused by the earthquake–explosion disaster chain. This observation indicates that such a disaster chain cannot be ignored.

4.3. The Maximum Story Drift Ratio

Figure 14 shows the maximum story drift ratio (DRmax) of the shear wall structure, which was used to assess the response of the shear wall structure under earthquake–explosion chain disasters. As shown in Figure 14, the D R m a x of cases 1–3 did not exceed the elastic story drift limit (0.001 [30]), but at the onset of the blast loads, the D R m a x of all cases exceeded the elastic story limit. Using earthquake-induced damage as a baseline for comparison, an explosion in the corner room of the first floor increased the D R m a x by 20 times, and an explosion in the middle room of the first floor increased the D R m a x by 22 times. The explosion in the middle room caused more damage. This is because the middle location likely allowed the blast wave to spread over a larger area than in the cases where the explosions were confined to the corner. The story drift ratios of the shear wall structure on the top three floors were equivalent to the case in which only an earthquake occurred. This lack of blast damage was expected, as the earthquake and explosion were independent events. Thus, since the seismic load did not cause plastic deformation and the blast load did not reach the top floors, the post-earthquake explosion did not cause any plastic deformation in the top three floors.
Figure 14 also shows that an explosion on the sixth floor propagated to more areas of the structure and resulted in much more damage than when the explosion occurred in the first floor. In this case, when the explosion occurred in the corner of the sixth floor, the D R m a x increased by 21 times, and an explosion in the middle caused an increase by 29 times. However, while the story drift ratio of the sixth floor was not significantly affected, the drift ratios of the fifth and seventh floors increased appreciably. Finally, as anticipated, the blast damage was most severe at the sixth floor. Table 9 lists the D R m a x of 15 medium earthquake–blast disaster chains.
The peak accelerations of the San Fernando, Imperial Valley, and Hector Mine events were adjusted to 220 gal. Table 10 lists the D R m a x of 15 major earthquake–blast disaster chains. The hazard chain effects were equivalent to those in Section 3.2 (Table 6) and are not discussed here.
In summary, the time-history analysis demonstrated the severity of the potential damage that can result from an earthquake–explosion chain. Even though the probability of the occurrence of such a disaster chain is low, the proximity of the blast loads to fragile and critical elements of an earthquake-weakened shear wall structure that is not designed to resist blast loads can greatly increase the chances of structural failure.

5. Damage State Assessment

By substituting the displacements at the limit points of the four damage states shown in Table 1 into Equation (8), a set of story-drift-index limits shown in Table 11 can be obtained. The results show that the damage state becomes more severe as the damage index increases.
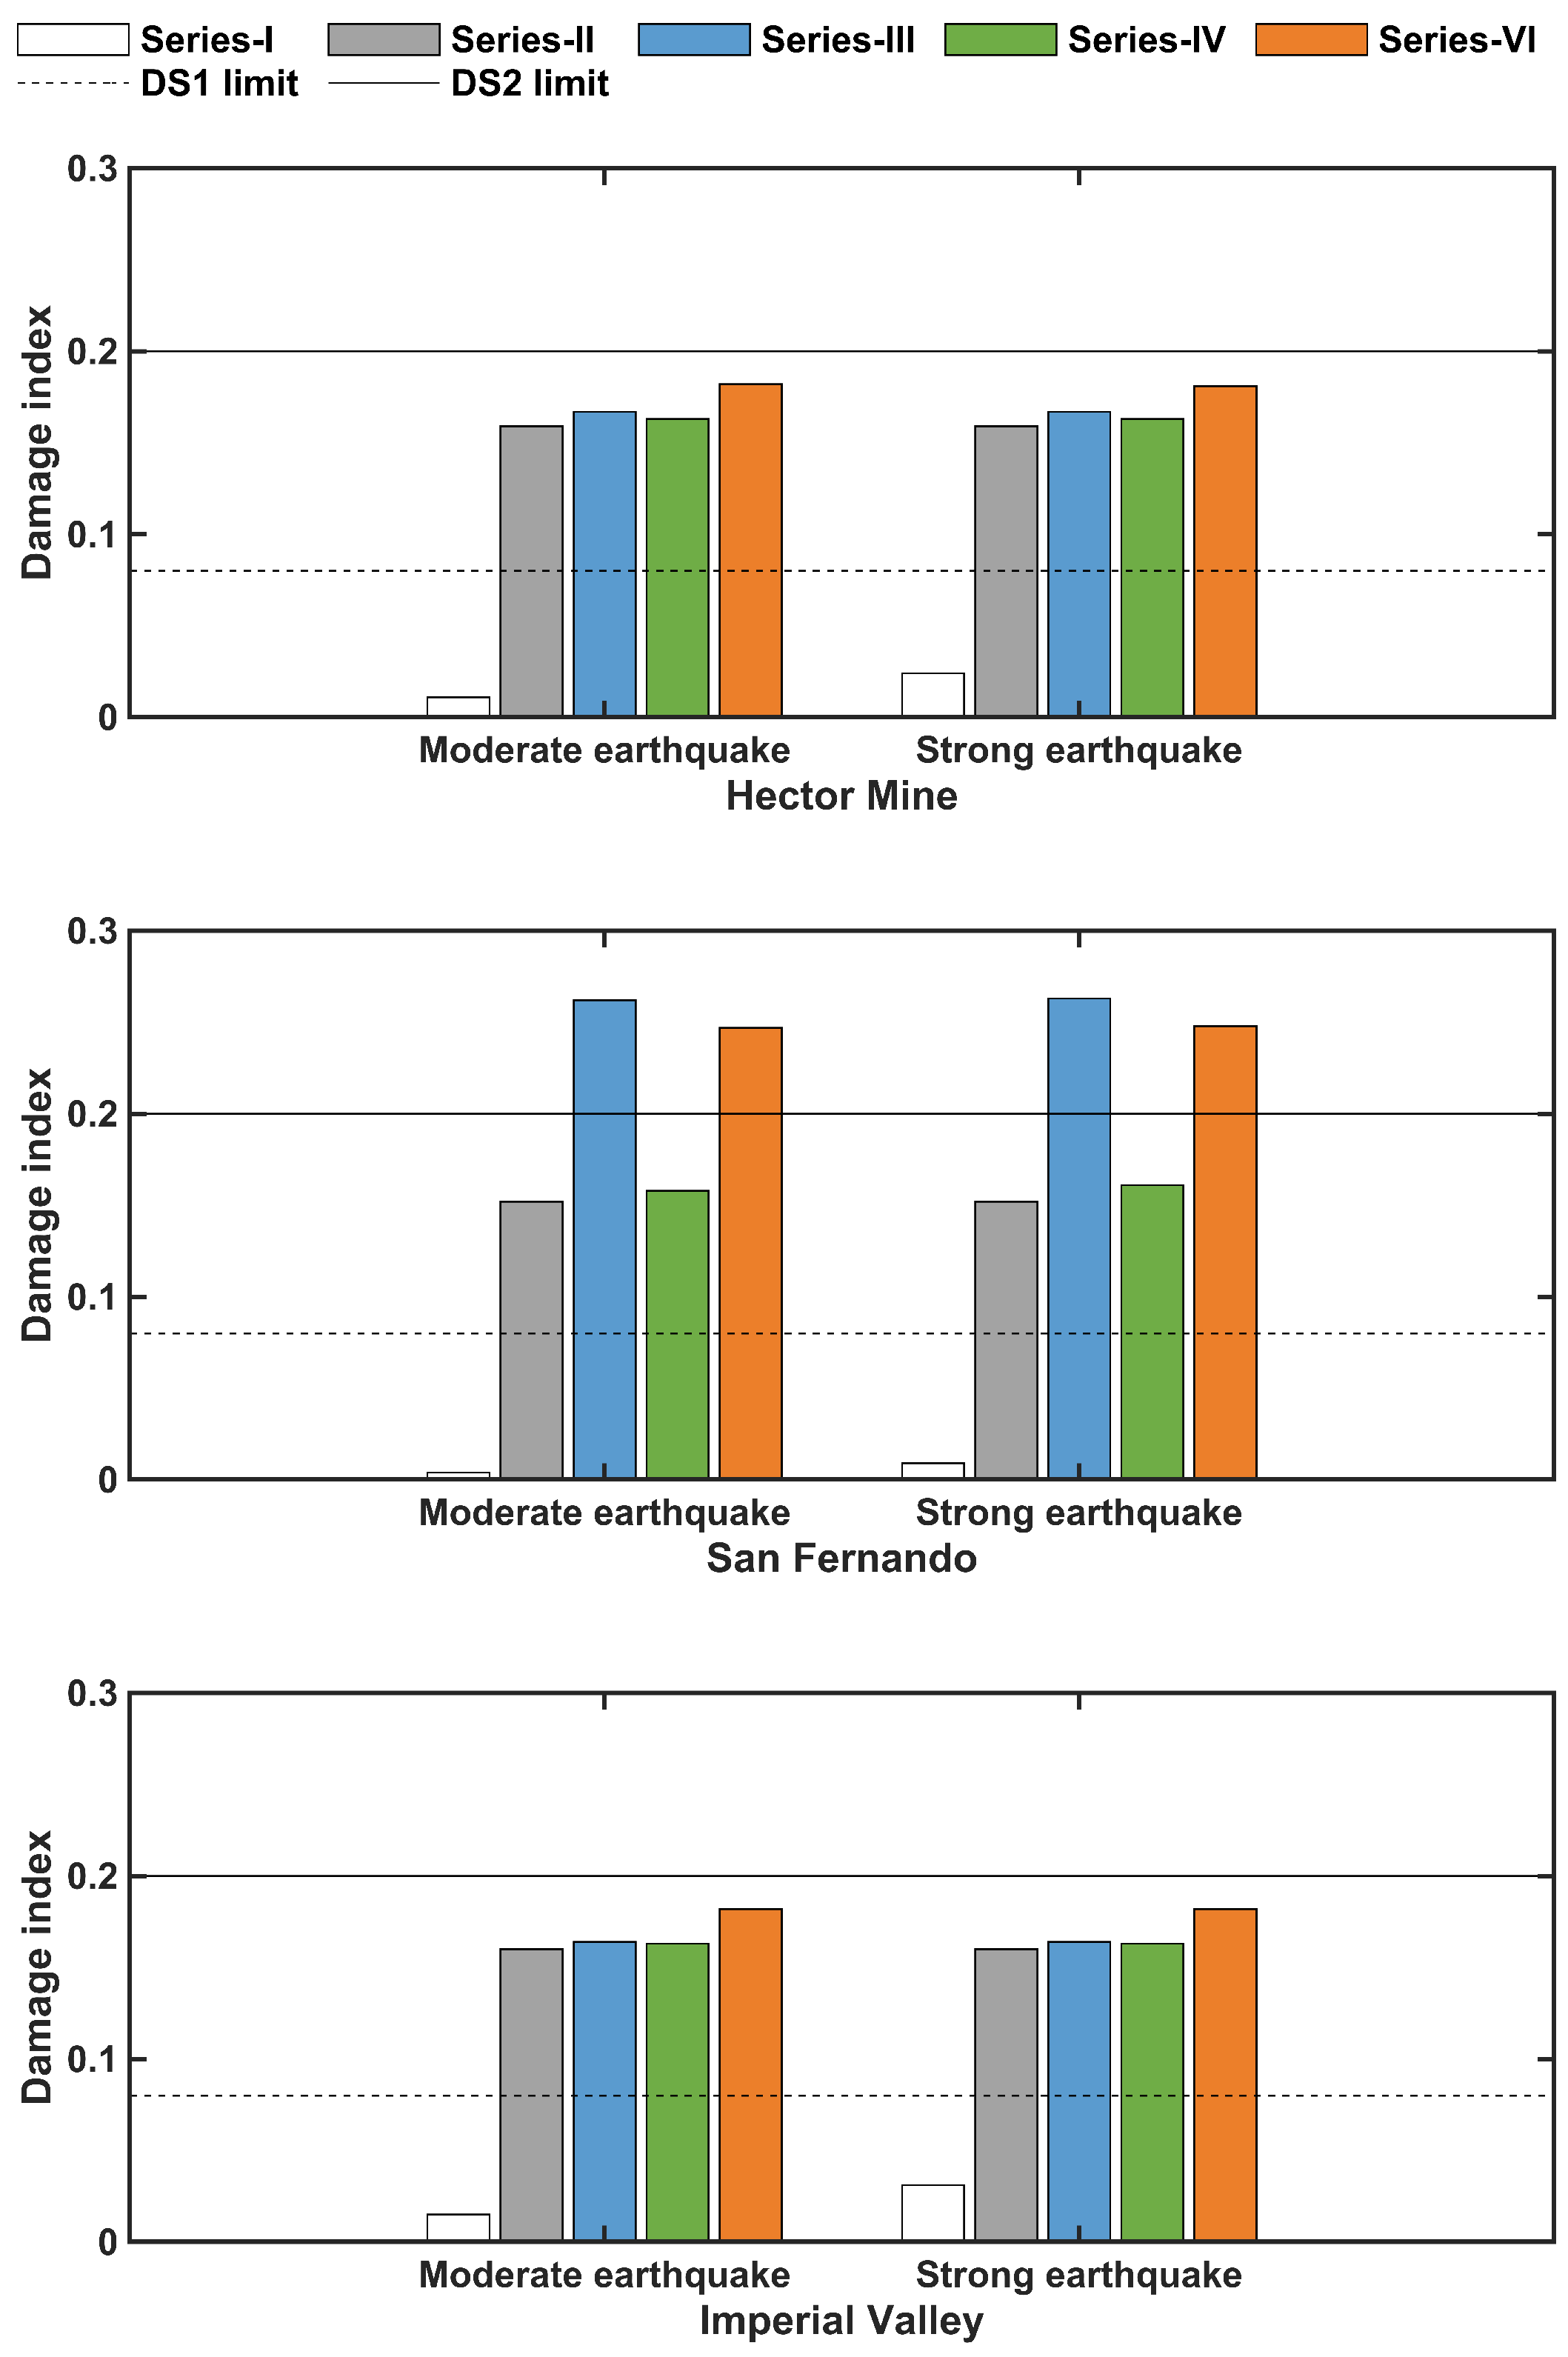
Using Equation (8), the damage indices and damage states of 30 scenarios were compared, and they are listed in Table 12 and Table 13. The tables show that the damage states of the shear wall structure under medium and major earthquakes fell in DS1, and when the gas explosion damaged the shear wall structure, the damage state mostly transitioned from DS1 to DS2. The major earthquake–explosion in the sixth-floor disaster chain caused the damage state to reach DS3. The performance of the shear wall structure after experiencing an earthquake was greatly reduced, and the high-intensity reflected tensile waves can directly or indirectly lead to the serious failure of structural components. The explosion typically inflicts massive damage to the structural system, in which a majority of the shear wall structure enters the plastic state and the anti-hazard capacity is lost.
For the present 30 earthquake–explosion disaster chain scenarios, Figure 15 further shows the distribution of damage index ( ξ D R ). It can be seen that at the end of the earthquake, the structures were mostly in healthy condition (i.e., DS1), indicating that the shear wall has good seismic resistance. After the explosion, the degree of structural damage increased significantly. It is worth noting that the damage states of the structure in cases 8 and 14 far exceeded those in DS2, indicating that the system of the shear wall structure may have been in an unfavorable state, and once the explosion occurred, the structural integrity further degraded into an unsafe condition.

6. Discussion

The low probability of significant disaster events, such as the earthquake–explosion disaster chain, can still significantly degrade a structure’s performance and even threaten the safety performance of the system during the design service cycle. The preliminary study shows the effect of earthquake–explosion disaster chains on the damage of shear wall structures and presents a damage assessment method. However, further studies are needed to more accurately estimate the damage extent of structures under earthquake–explosion disaster chains. A precise FE model of the shear wall structure with the consideration of reinforcements should be used in future study. The investigation on the failure mechanism of the structure under such a disaster chain effect should be carried out. To compensate for the deficiency of numerical simulations, we will conduct an experimental study on the effects of the earthquake–explosion disaster chain on shear wall structures.
Additional validation and advanced analysis methods are desirable to better understand the damage mechanisms of the earthquake–blast disaster chain. In addition, it is important to further study the risks and impacts of the earthquake–blast disaster chain on the capacity-degrading shear wall structures during their life cycle.

7. Conclusions

This paper explored the effect of the earthquake–explosion disaster chain on a shear wall structure and presented a novel damage-assessment methodology. The maximum story drift ratio under an earthquake–explosion disaster chain compared to the maximum story drift ratio when the structural collapse is imminent serves as a new damage index to evaluate the damage levels of the shear wall structures. A 12-story shear wall structure was analyzed numerically to demonstrate the proposed assessment method. The main conclusions are:
(1)
The deformation of the floor directly subjected to the explosion load is much greater than that of other floors. For the case in this paper, the deformation of the sixth story of the structure was much higher than the deformation of the first story.
(2)
The deformations caused by an explosion in the structural system’s middle room are much more significant than if the explosion occurs in a corner room.
(3)
Under earthquake excitation, the damage state of the shear wall structure will be at level 1. After the explosion, the shear wall structure will become severely damaged, reaching level 2 or even level 3.
(4)
The damage induced by an earthquake–blast disaster chain can be more severe than when only a minor or strong earthquake has occurred. The significant local damage of the explosion to the shear wall structures, especially after being weakened by seismic activity, can lead to structural failure.

Author Contributions

L.H. conceived the idea of this research and revised the manuscript, Z.X. made the calculations and wrote the manuscript, P.Y. made the calculations, and H.L. acquired the funding and supervised this research. All authors have read and agreed to the published version of the manuscript.

Funding

The authors sincerely appreciate the State Key Program of the National Natural Science Foundation of China (grant number 51738007), which supported this research.

Conflicts of Interest

The authors declare no conflict of interest.

References

  1. Qin, C.G.; Bai, G.l.; Xu, Y.z.; Su, N.f.; Wu, T. Comparative Study of Seismic Behavior between Monolithic Precast Concrete Structure and Cast-in-Place Structure. Shock Vib. 2018, 2018, 7029287. [Google Scholar] [CrossRef] [Green Version]
  2. Cilsalar, H. Post-earthquake fire collapse performance and residual story drift fragility of two-dimensional structural frames. Structures 2022, 38, 1438–1452. [Google Scholar] [CrossRef]
  3. Dobashi, R. Fire and explosion disasters occurred due to the Great East Japan Earthquake (March 11, 2011). J. Loss Prev. Process Ind. 2014, 31, 121–126. [Google Scholar] [CrossRef]
  4. Zhao, B. Landslides triggered by the 2018 Mw 7.5 Palu supershear earthquake in Indonesia. Eng. Geol. 2021, 294, 106406. [Google Scholar] [CrossRef]
  5. Yilmaz, T.; Banerjee, S.; Johnson, P. Uncertainty in risk of highway bridges assessed for integrated seismic and flood hazards. Struct. Infrastruct. Eng. 2017. [Google Scholar] [CrossRef]
  6. Zheng, X.W.; Li, H.N.; Yang, Y.B.; Li, G.; Huo, L.S.; Liu, Y. Damage risk assessment of a high-rise building against multihazard of earthquake and strong wind with recorded data. Eng. Struct. 2019, 200, 109697. [Google Scholar] [CrossRef]
  7. Dong, Z.Q.; Li, G.; Lu, G.H.; Song, B.; Li, H.N. Copula-based joint probabilistic model of earthquakes and rain for the failure assessment of masonry-adobe structures. J. Build. Eng. 2021, 42, 102821. [Google Scholar] [CrossRef]
  8. Dong, Z.Q.; Li, G.; Song, B.; Lu, G.H.; Li, H.N. Failure risk assessment method of masonry structures under earthquakes and flood scouring. Mech. Adv. Mater. Struct. 2021, 29, 1–16. [Google Scholar] [CrossRef]
  9. Kameshwar, S.; Padgett, J.E. Multi-hazard risk assessment of highway bridges subjected to earthquake and hurricane hazards. Eng. Struct. 2014, 78, 154–166. [Google Scholar] [CrossRef]
  10. Abdollahzadeh, G.; Faghihmaleki, H. Proposal of a probabilistic assessment of structural collapse concomitantly subject to earthquake and gas explosion. Front. Struct. Civ. Eng. 2017, 12. [Google Scholar] [CrossRef]
  11. Abdollahzadeh, G.; Faghihmaleki, H. Seismic-explosion risk-based robustness index of structures. Int. J. Damage Mech. 2016, 26. [Google Scholar] [CrossRef]
  12. Threadgold, I.M. Reducing the Risk of Low-Probability High-Consequence Events. In Proceedings of the SPE Americas E&P Health, Safety, Security, and Environmental Conference, Houston, TX, USA, 21–23 March 2011; p. SPE-141763-MS. [Google Scholar] [CrossRef] [Green Version]
  13. Abdollahzadeh, G.; Faghihmaleki, H.; Avazeh, M. Progressive collapse risk and reliability of buildings encountering limited gas–pipe explosion after moderate earthquakes. SN Appl. Sci. 2020, 2. [Google Scholar] [CrossRef] [Green Version]
  14. JO, H. LS-DNYA Keyword User’s Manual; Livermore Software Technology Corporation: Livermore, CA, USA, 2007. [Google Scholar]
  15. Gorji Azandariani, A.; Gholhaki, M.; Gorji Azandariani, M. Assessment of damage index and seismic performance of steel plate shear wall (SPSW) system. J. Constr. Steel Res. 2022, 191, 107157. [Google Scholar] [CrossRef]
  16. Wang, M.; Guo, Y.C.; Yang, L. Damage indices and fragility assessment of coupled low-yield-point steel plate shear walls. J. Build. Eng. 2021, 42, 103010. [Google Scholar] [CrossRef]
  17. Moghimi, H.; Driver, R. Performance assessment of steel plate shear walls under accidental blast loads. J. Constr. Steel Res. 2015, 106. [Google Scholar] [CrossRef]
  18. Hashemi, S.; Sadeghi, A.; Khizab, B. The Progressive Collapse Assessment of Structures with Steel Plate Shear Wall subjected to Blast. In Proceedings of the 1st National Conference of Impact and Explosion-Proof Structures, Tehran, Iran, February 2019. (In Persian). [Google Scholar]
  19. Kundu, S.; Zanganeh, J.; Moghtaderi, B. A Review on Understanding Explosions from Methane-Air Mixture. J. Loss Prev. Process Ind. 2016, 40. [Google Scholar] [CrossRef]
  20. Edri, I.E.; Grisaro, H.Y.; Yankelevsky, D.Z. TNT equivalency in an internal explosion event. J. Hazard. Mater. 2019, 374, 248–257. [Google Scholar] [CrossRef]
  21. Holmquist, T.J.; Johnson, G.R.; Cook, W.H. A Computational Constitutive Model for Concrete Subjected to Large Strains, High Strain Rates and High Pressures, 14th International symposium, Vol 2; Warhead mechanisms, terminal ballistics. In Proceedings of the BALLISTICS -INTERNATIONAL SYMPOSIUM-, Vol 2; Warhead Mechanisms, Terminal Ballistics, 14th International Symposium, Vol 2; Warhead Mechanisms, Terminal Ballistics; ADPA: Arlington, TX, USA, 1993; Volume 2, pp. 591–600. [Google Scholar]
  22. Wan, Y.; Zhu, L.; Fang, H.; Liu, W.; Mao, Y. Experimental testing and numerical simulations of ship impact on axially loaded reinforced concrete piers. Int. J. Impact Eng. 2019, 125, 246–262. [Google Scholar] [CrossRef]
  23. Wang, X.H.; Zhang, S.R.; Dai, J.G.; Wang, C. Evaluation of base damage and stability of concrete gravity dam subjected to underwater explosion. Structures 2022, 38, 1502–1514. [Google Scholar] [CrossRef]
  24. Su, Q.Q.; Zhai, X.M. Dynamic response of single-layer reticulated shell with explosion-protection wall under blast loading. Thin-Walled Struct. 2018, 127, 389–401. [Google Scholar] [CrossRef]
  25. SEAOC. Vision 2000, Performance Based Seismic Engineering of Buildings, Vols. I and II: Conceptual Framework; Structural Engineers Association of California: Sacramento, CA, USA, 1995. [Google Scholar]
  26. ATC 40, Seismic Evaluation and Retrofit of Existing Concrete Buildings; Applied Technology Council: Redwood City, CA, USA, 1996.
  27. FEMA 273, NEHRP Guidelines for the Seismic Rehabilitation of Buildings; FEMA 274, Commentary; Federal Emergency Management Agency: Washington, DC, USA, 1996.
  28. JGJ3-2010; Technical Specification for Concrete Structure of Tall Buildings. China Architecture & Building Press: Beijing, China, 2010.
  29. GB 50009-2012; Code for Design of Concrete Structures. China Architecture & Building Press: Beijing, China, 2015.
  30. GB 50011-2010; Code for Seismic Design of Buildings. China Architecture & Building Press: Beijing, China, 2010.
  31. Lacambre, J.; Delmas, L. Using LS-DYNA MM-ALE capabilities to help design a wall mitigating accidental blast effects. In Proceedings of the 8th European LSDYNA Users Conference, Strasbourg, France, 23–24 May 2011. [Google Scholar]
  32. Xu, J.; Wu, H.; Ma, L.; Fang, Q. Residual axial capacity of seismically designed RC bridge pier after near-range explosion of vehicle bombs. Eng. Struct. 2022, 265, 114487. [Google Scholar] [CrossRef]
  33. Ma, L.; Wu, H.; Fang, Q. Damage mode and dynamic response of RC girder bridge under explosions. Eng. Struct. 2021, 243, 112676. [Google Scholar] [CrossRef]
  34. Chopra, A.K.; Goel, R.K. Capacity-Demand-Diagram Methods Based on Inelastic Design Spectrum. Earthq. Spectra 1999, 15, 637–656. [Google Scholar] [CrossRef]
  35. GB 6722-2014; Safety Regulations for Blasting. General Administration of Quality Supervision. Inspection and Quarantine of the People’s Republic of China, Standardization Administration of the People’s Republic of China: Beijing, China, 2014.
Figure 1. The framework for damage evaluation of shear wall structures under an earthquake–explosion disaster chain.
Applsci 12 11781 g001
Figure 2. Schematic diagram of the 12-story shear wall structure: (a) elevation; and (b) plan (Unit: m).
Applsci 12 11781 g002
Figure 3. FE model of the shear wall structure under earthquake–explosion disaster chains.
Applsci 12 11781 g003
Figure 4. The first three modes of the shear wall structure: (a) the first order; (b) the second order; and (c) the third order.
Applsci 12 11781 g004
Figure 5. (a) Spectra of three scaled time history records based on design spectra; and (b) comparison of the designed response spectra and the mean response spectra.
Applsci 12 11781 g005
Figure 6. The sketch of explosion loads acting on the structure: (a) the location of the gas leak; and (b) the location of the explosion.
Applsci 12 11781 g006
Figure 7. The overpressure time history of the selected target in series-II.
Applsci 12 11781 g007
Figure 8. Displacement time histories of the first, sixth, and twelfth floor under different conditions: (a) case 4; (b) case 7; (c) case 10; and (d) case 13.
Applsci 12 11781 g008
Figure 9. Peak displacement of each floor.
Applsci 12 11781 g009
Figure 10. Distribution of cumulative plastic deformation.
Applsci 12 11781 g010
Figure 11. The damage distribution of shear wall structures under case 4: (a) Damage caused by an earthquake; and (b) Damage caused by an earthquake–explosion disaster chain.
Applsci 12 11781 g011
Figure 12. The stress distribution of shear wall structures under case 4: (a) x-stress caused by an earthquake; and (b) x-stress caused by the earthquake–explosion disaster chain.
Applsci 12 11781 g012
Figure 13. The strain distribution of shear wall structures under case 4: (a) x-strain caused by an earthquake; and (b) x-strain caused by earthquake–explosion disaster chain.
Applsci 12 11781 g013
Figure 14. Comparison of the maximum story drift ratio: (a) Hector Mine–blast on the first floor; (b) San Fernando–blast on the first floor; (c) Imperial Valley–blast on the first floor; (d) Hector Mine–blast on the sixth floor; (e) San Fernando–blast on the sixth floor; and (f) Imperial Valley–blast on the sixth floor.
Applsci 12 11781 g014
Figure 15. Distribution of damage index ( ξ D R ).
Applsci 12 11781 g015
Table 1. Performance levels, corresponding damage state, and drift limits.
Performance LevelDamage StateDrift
Fully operationalNo damage<0.2%
OperationalRepairable<0.5%
Life safeIrreparable<1.5%
Near collapseSevere<2.5%
Collapse >2.5%
Table 2. Parameters of the constitutive concrete model.
Concrete (*MAT_JOHNSON_HOLMQUIST_CONCRETE & *MAT_ADD_EROSION)
DensityGABCNFCTEPS0
2440 kg/m 3 14.86 GPa0.791.60.0070.610.048 GPa41 s 1
EFMINSFMAXPCUCPLULD1D2K1
0.0170.016 GPa0.0010.8 GPa0.10.041
K1K2K3Failure strain
85 GPa−171 GPa208 GPa0.01
Table 3. Parameters of TNT.
TNT (*MAT_HIGH_EXPLOSIVE_BURN & *EOS_JWL)
Initial densityDetonation velocity DBurst pressure P C J AB R 1 R 2 ω E 0
1630 kg/m 3 6930 m/s21 GPa373.8 GPa3.747 GPa4.150.90.356 × 10 9 J/m 3
Table 4. Parameters of air.
Air (*MAT_NULL&*EOS_LINEAR_POLYNOMIAL)
Initial densityInitial energy E 0 Pressure cutoffDynamic viscosity coefficient C 0 , C 1 , C 2 , C 3 , C 6 C 4 , C 5
1.29 kg/m 3 2.5 × 10 5 J/m 3 0000.4
Table 5. Earthquake events.
Record NumberEventsDateStation NameDuration (s)
A_1Hector Mine16 October 1999San Bernardino-N Verdemont Sch37.80
A_2San Fernando9 February 1971Maricopa Array #229.48
A_3Imperial Valley15 October 1979Niland Fire Station32.00
Table 6. Fifteen earthquake–blast disaster chains.
SeriesExplosion LocationEarthquake Record
Hector MineSan FernandoImperial Valley
Series-IWithout explosionCase 1Case 2Case 3
Series-IIThe corner room on the 1st floorCase 4Case 5Case 6
Series-IIIThe middle room on the 1st floorCase 7Case 8Case 9
Series-IVThe corner room on the 6th floorCase 10Case 11Case 12
Series-VThe middle room on the 6th floorCase 13Case 14Case 15
Table 7. Peak displacement of each floor.
SeriesCaseFloor
123456789101112
Series-II414.40.761.041.181.231.251.251.261.281.331.331.43
514.40.520.760.810.840.860.880.920.941.031.171.51
613.51.101.521.511.451.361.311.331.351.411.501.71
Series-III715.00.761.261.852.432.753.023.473.854.254.484.34
814.70.771.201.742.312.662.933.373.374.124.334.16
923.61.301.541.841.981.991.982.683.474.285.015.55
Series-IV100.831.251.311.4314.214.62.491.561.671.811.992.30
110.551.201.832.1614.314.82.411.661.771.902.082.39
121.861.201.351.5413.43.372.941.531.631.761.922.20
Series-V130.871.221.872.2116.617.01.222.302.092.002.883.80
140.821.201.291.3416.516.71.332.211.992.023.094.02
151.011.932.673.2523.08.071.292.522.012.383.063.65
Table 8. Residual deformation of each floor.
SeriesCaseFloor
123456789101112
Series-II40.270.300.900.770.720.640.600.530.500.580.711.00
51.010.300.760.710.670.540.470.420.400.480.600.88
60.420.681.101.041.040.960.960.961.011.161.341.60
Series-III70.930.761.041.181.231.251.251.261.281.331.331.43
82.200.440.870.810.780.730.750.780.840.981.161.51
90.511.301.521.511.451.361.291.241.211.261.341.69
Series-IV100.831.011.150.951.070.410.570.990.970.900.951.13
110.530.680.890.811.090.670.701.191.261.311.471.75
120.801.011.100.951.140.860.701.151.181.191.291.52
Series-V130.871.251.311.141.111.001.091.441.531.641.772.06
140.821.201.291.181.291.091.331.661.771.902.082.39
150.811.201.271.181.300.231.201.511.591.701.832.10
Table 9. D R m a x of 15 medium earthquake–blast disaster chains.
Earthquake Record D R m a x
Series-ISeries-IISeries-IIISeries-IVSeries-V
Hector Mine0.02780.39870.41670.40710.4541
San Fernando0.01060.37910.65470.39470.6173
Imperial Valley0.03650.39930.40940.40660.4552
Table 10. D R m a x of 15 major earthquake–blast disaster chains.
Earthquake Record D R m a x
Series-ISeries-IISeries-IIISeries-IVSeries-V
Hector Mine0.06000.39800.41750.40860.4530
San Fernando0.07830.38010.65800.40370.6200
Imperial Valley0.02330.40000.40900.40640.4554
Table 11. Damage states, story drift ratio ranges, and damage-index-limit ranges.
Damage StatesStory Drift Ratios Ranges (%)Limit Ranges
No damage (DS1)0~0.20~0.08
Repairable (DS2)0.2~0.50.08~0.2
Irreparable (DS3)0.5~1.50.2~0.6
Severe (DS4)1.5~2.50.6~1
Table 12. Damage indexes and damage states of 15 simultaneous medium earthquake–blast disaster chains.
Earthquake Record ξ DR and DSs
Series-ISeries-IISeries-IIISeries-IVSeries-V
Hector Mine0.0110.1590.1670.1630.182
DS1DS2DS2DS2DS1
San Fernando0.0040.1520.2620.1580.247
DS1DS2DS3DS2DS3
Imperial Valley0.0150.1600.1640.1630.182
DS1DS2DS2DS2DS1
Table 13. Damage indexes and damage states of 15 simultaneous major earthquake–blast disaster chains.
Earthquake Record ξ DR and DSs
Series-ISeries-IISeries-IIISeries-IVSeries-V
Hector Mine0.0240.1590.1670.1630.181
DS1DS2DS2DS2DS1
San Fernando0.0090.1520.2630.1610.248
DS1DS2DS3DS2DS3
Imperial Valley0.0310.1600.1640.1630.182
DS1DS2DS2DS2DS1
Publisher’s Note: MDPI stays neutral with regard to jurisdictional claims in published maps and institutional affiliations.