Abstract
In an offshore operational environment, complex loads such as the hook load, stand load and wind load play a crucial role in the structural strength and reliability of the offshore derrick. Previous studies have mainly focused on the effect of a specific load on the strength of the derrick by using commercial software. Therefore, the influencing mechanism of each complex load on the strength and reliability of the offshore derrick is urgently necessary to explore. Not only is the strength numerical model of the JJ315/45-K typical derrick established and conducted via APDL (ANSYS Parametric Design Language), but also the stress–strength reliability simulation is explored and plotted using Python code and APDL. Furthermore, the influence and contribution of each load to the strength and reliability is determined. With the increase in hook load, the positions of maximum reliability risk appear in section II-1. With the increase in stand load or back wind load, the positions of maximum reliability risk appear in the bottom section. In addition, with the decrease in the columns’ height, the stress proportion of the hook load decreases by 73.5%, the stress proportion of the stand load increases by 22.6%, and the stress proportion of the back wind load changes slightly. When the wind speed is less than 20 m/s, the hook load mainly affects the minimum reliability index of the derrick. Moreover, when the wind speed is more than 20 m/s, the back wind load mainly affects the minimum reliability index of the derrick. This study provides a thorough explanation of the strength distribution law and the reliability of derricks under complex loads.
1. Introduction
As an important piece of load-bearing equipment in the oil platform system, the derrick is key to ensuring oil and gas drilling. In an offshore operation, complex loads such as the hook load, stand load and wind load play a crucial role in the structural strength and reliability of the offshore derrick. It is necessary to evaluate its safety and reliability under complex loads, providing a reliable guarantee for oil and gas drilling.
To prevent failure and potential hazards, the strength safety of the derrick, as a typical piece of steel structure equipment, should be paid attention to firstly. Some relevant studies have been conducted. The stress and displacement variation of the double derrick at different sectional parameters under typical working conditions have been explored in [1]. Considering the hook load, wind load and stand load individually, Liu et al. [2] analyzed the strength of the 350-type workover derrick according to 24 cases. Studies have also investigated the maximum deformation and stress variation of the derrick. However, the influence of each variable load on the strength of the derrick remains unknown in this study, and other typical derricks have not been further discussed. The wind load is a unique offshore load for an offshore derrick. The previous study of [3] calculated the shape coefficient of the wind pressure and wind pressure coefficients, and the displacement and stress response of the derrick structure in four wind load conditions were analyzed. The constant gravity load and maximum hook load were taken into account to perform the static analysis and modal analysis of a towering derrick, then comparing the outcomes of the experiment described in [4]. In the static research, Liang et al. explored the static strength of a derrick after its members were partly removed. The results in [5] showed that the strength of the derrick after its partial member removal was larger than that of the original derrick structure. Liu et al. established a truck-mounted workover rig derrick and analyzed the location of the maximum Mises stress of the derrick in 12 work conditions. The results in [6] showed that the structural strength of the derrick met the requirements of the design. Yang et al. designed a new derrick structure. Through the strength analysis in [7], the maximal stress of the new structure decreased by 12 percent compared to the previous one.
The derrick structure is not only necessary for ensuring the strength of each beam during the operation, but it also plays an important role in the structural reliability. For a reliability analysis, Zhu et al. [8] obtained the stress and displacement distribution of the double derrick structure through a static analysis. Through the stress–strength limit state function, the overall reliability index of the double derrick structure was calculated according to the results of static strength. Han et al. [9] established a residual-life-prediction model based on time-varying reliability and the fatigue effect, which is applied to predict the residual life of the derrick structure by using the S–N curve and the rain-flow-counting method. Considering the weakness of the operational terms in the derrick structure strength, a time-dependent reliability analysis method was proposed and applied to the strength analysis of a towering derrick in [10]. A similar structural reliability analysis was also performed by relevant scholars. For example, the safety level of long-span bridge structures was evaluated according to the reliability index of their components and systems, and the temperature-induced intensity response was also taken into account in [11]. The probabilistic safety analysis of truss roof systems under different snow loads was studied, and the failure probability of each component was calculated in [12]. Combining Latin hypercube sampling with finite element analysis, an analytical framework for fatigue reliability was established to investigate the influence of uncertain parameters on the mechanical response of turbine bladed disks in [13]. Considering the effects of decay on the facility safety, probabilistic methods, based on Monte-Carlo simulation, were applied to analyze the safety of timber structures in [14].
The existing strength analysis of a derrick under a complex load has mostly been aimed at specific working conditions by using commercial software such as Abaqus, ANSYS Workbench and Nastran, etc., there are few studies on the influence of the value of each load on the strength and reliability of the offshore derrick. Ref. [4] reveals the influence of the value of the hook load on the strength of the derrick, but the influence of the stand load and wind load was not studied. So, the influencing mechanism of each load on the strength and reliability is unclear. This will result in an inability to reasonably adjust the working loads, such as the hook load and stand load, according to the environmental load. It is difficult to determine the monitoring points according to the working conditions in inspection task, which seriously restricts the strength evaluation of the derrick.
Based on the above considerations, it is necessary to conduct an analysis of the strength and reliability of an offshore derrick under complex loads and analyze the influence of each load on the strength and reliability. Therefore, the strength numerical model of the JJ315/45-K-type derrick was established and conducted via APDL (ANSYS Parametric Design Language). The stress–strength reliability simulation was explored and plot by using Python Script and APDL. This new method is not only able to perform reliability calculations, but can also display the reliability index contour plot and variation curve of the column reliability index. In this way, the influence of each load on the strength distribution and reliability distribution is studied, and the reliability under a single load, composite load and complex load is calculated. This research has an important guiding role in the crucial strength test and online evaluation of an in-service derrick.
2. Complex Load and Reliability Modeling
This reliability analysis programming and post-plot were conducted by combining Python with APDL. The method can calculate the reliability index of all the beams and draw the contour plot of the reliability index. This new method is introduced in detail as follows.
2.1. Components of the Complex load
Each Component of the Complex Load
The complex load of the offshore derrick consists of gravity, the hook load, stand load and wind load, as shown in Figure 1:
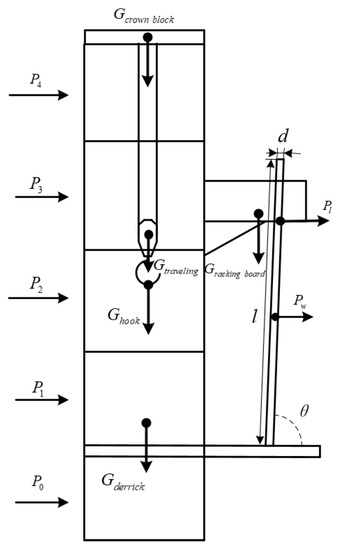
Figure 1.
Simple mechanical analysis diagram of derrick.
(1) The weight of the crown block Gcrown block, traveling block Gtraveling, derrick Gderrick and racking board Gracking board is taken into account. (2) The weight lifted by the hook Ghook is referred to as the hook load. (3) The stand load is the force applied to the derrick by the stand through the racking board beam. Most of the existing research does not consider the stand load. In this model, the stand’s gravity and wind load is fully considered, and the stand’s horizontal component of gravity (1) and wind load (2) are referred to as [3]:
where q is the gravity per unit length of the stand (q = 32 kg/m), n is the number of stands (n = 250), l is the length of the stand (l = 28 m) and θ is the angle between the stand and drill floor (θ = 88°). W is the calculated wind pressure defined by Equation (4). n’ is number of stands per row on the racking board (n’ = 28). d is the diameter of the stand (d = 5.5 in).
(4) The wind load is defined as the load on the derrick by the wind pressure, which is calculated by the equivalent static wind load equation; see [3]:
where W0 is the basic wind pressure, calculated by the speed of the wind v. kz is wind the pressure coefficient and kp is shape coefficient of the wind pressure. F is the area of the bearing wind load, m2. The two coefficients and area F are listed in Table 1.

Table 1.
Value of coefficients and area of bearing wind load.
The above components affect the strength and reliability of the offshore derrick together. In order to clearly reveal the influence of the complex load on the offshore derrick, three typical composite loads, which are applied in the research of Section 4, and other composite loads were designed in this model, such as: (1) gravity and hook load; (2) gravity, hook load and stand load; (3) gravity, hook load, stand load and back wind load; (4) other composite load.
2.2. Reliability Modeling under Complex Load
In the reliability analysis, the Monte Carlo simulation method was used to conduct a large number of random samplings of the variables, and the numerical simulation was analyzed based on the sampling results. The reliability analysis is related to the random variables, including the material elastic modulus (EX), the material yield strength (R), the hook load (GZ), the wind pressure of the stand (Wz_L), and the back wind pressure of each derrick section (Wz(i) (i = 0, 1, 2, 3, 4)). Wz_L is the wind pressure of the stand and Wz (i) is the wind pressure of each section. Wz_L = W0kz, Wz(i) = W0kz. The reliability analysis flow chart is shown in Figure 2.
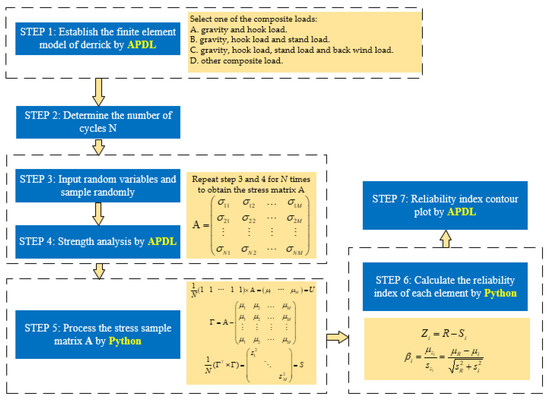
Figure 2.
Flow chart of reliability analysis model of derrick under complex load.
Step 1: Establish the finite element model of the offshore derrick by APDL and select one of the composite loads (See Appendix A).
Step 2: Determine the number of cycles N. To ensure that the mean and variance of the numerical simulation result samples are stable and accurate, a sufficient number of cycles should be selected. According to the relevant literature [15,16], the number of cycles N selected in this paper was 300.
Step 3: Input random variables and sample randomly. Randomly sample x from the inputted random variables X = (EX, R, GZ, Wz_L, Wz (0), Wz (1), Wz (2), Wz (3), Wz (4)) for subsequent finite element analysis.
Step 4: Strength analysis by APDL. The finite element simulation analysis is performed by inputting the sample x. Obtain a 1×M matrix Aj = [σj1, σj2, …, σjM], where σji is the stress of the i-th element in the j-th strength analysis (0 < i ≤ M), and M is the total number of elements.
Repeat steps (3) and (4) N times to obtain the stress matrix A of N strength analysis under complex loads of all M elements; A is an N×M matrix.
Step 5: Process the stress sample matrix A by Python. Substitute the matrix A into Equations (7)–(9) to obtain the matrices U and S, which are composed of each element’s stress mean and variance (See Appendix B).
Step 6: Calculate the reliability index of each element by Python. In the reliability model of the finite element, the stress–strength limit state function Zi of the beam element in the derrick (element number is i, 0 < i ≤ M) is shown in Equation (10); see [17,18,19,20]. The safety margin Zi is a random variable, and it depends on the random variable of R (yield strength) and Si (stress of i-th element). The parameters of this system are the mean of the safety margin μZi and standard deviation of the safety margin szi. Substitute the mean μi and variance s2i of each element and the mean μR and variance s2R of yield strength into Equation (11) to obtain the reliability index βi of each element in the derrick model under complex load:
Step 7: Reliability index contour plot by APDL. According to the reliability index of each element, the derrick’s reliability index under complex load is represented as a visual contour plot.
3. Derrick Model and Calculation Parameters under Complex Load
3.1. Numerical Model and Validation
To study the strength and reliability of the derrick under complex load, the JJ315/45-K-type derrick was used as an example and modeled. The numerical model of the derrick is shown in Figure 3. The opening size of the upper part stationary is 2.3 m, the opening size of the lower part stationary is 8.3 m, the width of the upper side stationary is 2.3 m, the width of the lower side stationary is 2.6 m, and the height from the top to the setback floor is 45 m. The section types of the derrick beam are primarily divided into I-beam, channel, rectangular and pipe. The derrick’s material is Q345 with a density of 7850 kg/m3, an elastic modulus of 206 GPa, a Poisson’s ratio of 0.28 and a yield strength of 345 MPa. The mesh parameter of the derrick model is 1 m, and the boundary condition is that all other degrees of freedom of the bottom four key points are constrained except for the axial rotational freedom of the pin.
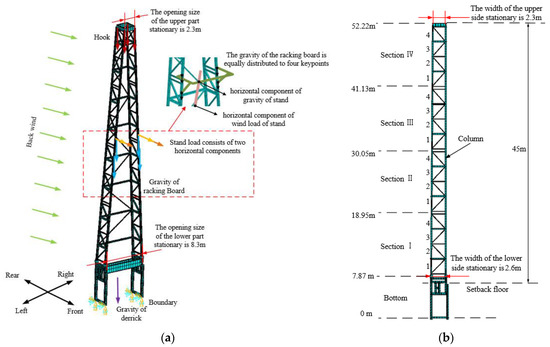
Figure 3.
The numerical model of derrick. (a) The oblique view of derrick. (b) The side view of derrick.
The derrick works under gravity, hook load, stand load and wind load at the same time. The gravity is applied as acceleration to the derrick and the gravities of the crown block, traveling block and racking board are applied on the corresponding node in the form of concentrated force. The hook load is the average applied at the top four nodes of the derrick. The stand load is applied horizontally at the racking board. The wind load of each section is applied as the average pressure at the nodes of the sections.
To ensure the accuracy and reliability of the numerical simulation, the model was verified with the experimental testing results. The above numerical model was verified by stress monitoring, which was monitored from an offshore platform derrick under hook load in a South China Sea oil field by the Safety Environment Quality Supervision and Testing Research Institute. The strain sensor was set at the position of the column in section III-2, and the numerical results of the corresponding position were compared with the testing results. As shown in Figure 4, with the increase in hook load, the 20 measured values are consistent with the numerical results. The maximum error does not exceed 5.2%, indicating that the numerical simulation model is accurate and reliable.
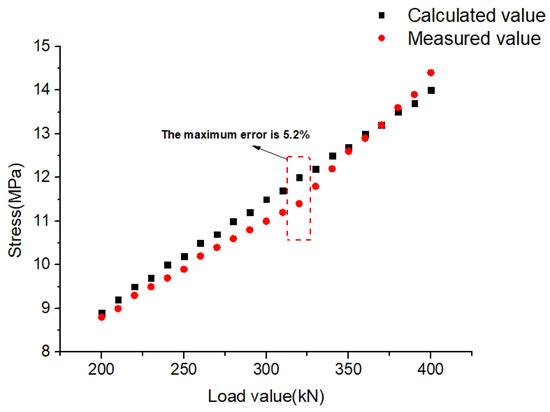
Figure 4.
Stress comparison between numerical results and measured results.
3.2. Numerical Plan and Parameters
Each component of the complex load determines the strength distribution and reliability variation of the derrick. In order to explore the influence of each component load on the strength and reliability under complex load, a research plan was designed as shown in Table 2.

Table 2.
The schematic program of numerical studying of derrick under complex load.
As described in step 3 in Section 2.2, sample x was obtained from random input variables. According to the relevant references [10,18], the random input variables of the reliability analysis include the material elastic modulus (EX), material yield strength (R), hook load (GZ), stand wind pressure (Wz_L), and back wind pressure of each derrick section (Wz(i) (i = 0, 1, 2, 3, 4)). The distribution types and numerical characteristics of the random variables are shown in Table 3.

Table 3.
Random variable distribution and numerical characteristics.
4. Influence of Each Component under Complex Load
4.1. Influence of Hook Load
The structural strength and reliability was analyzed when the derrick was loaded under gravity and hook load; see group 1 in Table 2. As shown in Figure 5, when the hook load increases from 750 kN to 3000 kN, the maximum stress increases from 39.9 MPa to 124 MPa, and the reliability index β decreases from 11.6 to 8.6. Compared with the allowable stress of the beam material, the derrick structure strength is sufficient under the hook load, but the reliability reduces by 25.86%. When the hook load is 3000 kN, the maximum stress is located at the right rear column of section IV-3, and the minimum reliability index is located at the right front column of section II-1. The stress of the right front column of section II-1 is 122.8 MPa. These results demonstrated that the offshore derrick would become exceedingly dangerous at the position of section II and IV under the complex load of gravity and hook load, and the position of the lowest reliability is not in accordance with the position of maximum stress.
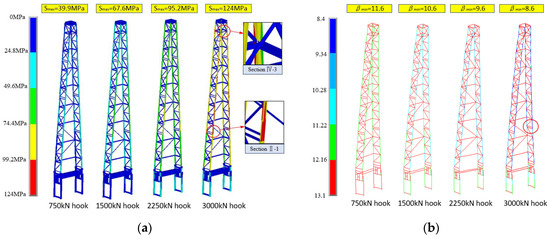
Figure 5.
The variation of the stress and reliability index with hook load increasing. (a) Stress contour plot. (b) Reliability index contour plot.
Figure 6 shows the various trends of the column’s reliability index β along with the height under different hook loads. We assume that βf is the reliability index of the front column, and βr is the reliability index of the rear column. As the hook load increases, the columns’ reliability indexes decrease wholly. At a constant hook load, such as 3000 kN, while the height of the column rises from 0 m to 5.08 m (bottom column), the βf first reduces from 11.38 to 9.54. Then, when the height of the column increases to 8.15 m (the bottom of section I), βf becomes 8.99, which is the smallest value of section I. Above the height of 8.15 m, βf fluctuates constantly with increasing height. The minimum reliability index is located at the bottom of section II, which is 8.6. There is a similar varying trend for other hook loads, and βr has a similar trend to βf. When the derrick only bears hook load, more attention should be paid to the stress at section I to section IV.
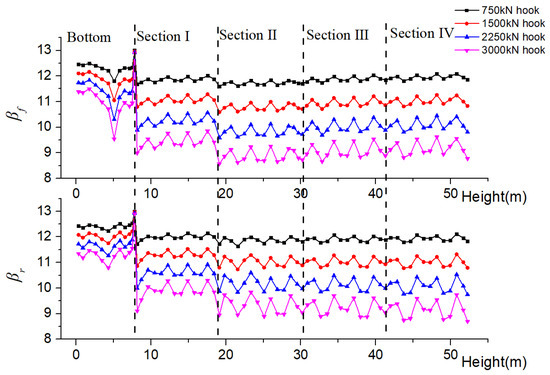
Figure 6.
Variation curve of column reliability index along with height under different hook load.
4.2. Influence of Stand Load
To deeply analyze the influence of stand load on the strength and reliability, the simulation of group 2 (see Table 2) was conducted, and the variation of the structural strength and reliability with the increase in the stand load is discussed. As shown in Figure 7, with the number of stands increasing from 100 to 250, the stand load increases from 15.33 kN to 38.33 kN according to Eq.1. The maximum stress of the derrick increases from 52 MPa to 85 MPa, and the reliability index falls from 11.4 to 10.8. When the number of stands increases to 250, the maximum stress of the derrick appears at the bottom front column, and the reliability index is also the smallest. It can be seen that the increase in the stand load not only increases the stress at the bottom front column, but also reduces its reliability at the same position. Therefore, under the work conditions of the derrick, the stress monitoring of the bottom front column should be paid more attention. It is suggested that the operation of stacking too many stands on the racking board for a long time should be avoided.
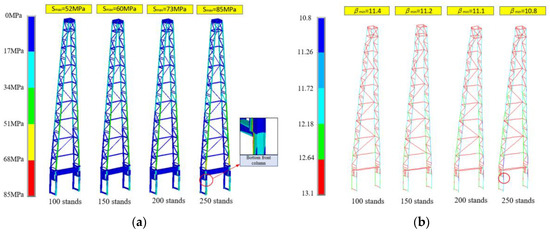
Figure 7.
The variation of the stress and reliability index with increasing number of stands. (a) Stress contour plot. (b) Reliability index contour plot.
Figure 8 shows the various trends of the column reliability index β along with the height under different numbers of stands. As the number of stands increases, βf decreases at the height between 0 m and 34.42 m (racking board). When the height is larger than the height at 34.42 m, βf maintains a stable value. When the number of stands is 250, βf reduces from 12.13 to 10.87 at the height between 0 m and 4.30 m (bottom column), which is the smallest βf of the whole column. Then, with the height rising to 8.15 m (the bottom of section I), βf is 10.93. Above the height of 8.15 m, there is a fluctuating variation of increasing βf. Compared to the four curves under different numbers of stands, βr at the height between 8.15 m and 28.64 m rose slightly with increasing numbers of stands. In other sections, βf varied subtly due to the low influence of the stand load on the columns. Taking the stand number of 250, for example, it is found that βr shows an overall reduction trend. The smallest value of βr is found at the height of 32.65 m, which is close to the racking board of the derrick. There is a similar varying trend for curves under other numbers of stands. It is concluded that when there are too many stands stacked at the racking board, attention should be paid to the front bottom column and rear column close to the racking board.
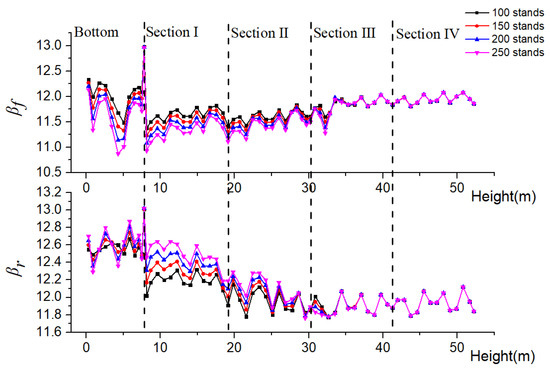
Figure 8.
Variation curve of column reliability index along with height under different number of stands.
4.3. Influence of Wind Load
To discuss the influence of wind load on the strength and reliability, the simulation of group 3 (see Table 2) was conducted. The variation of the structural strength and reliability with the increase in back wind speed is discussed when the derrick works under complex load, including hook load, stand load and back wind load. As shown in Figure 9, with the increase in wind speed, the maximum stress increases from 132 MPa to 272 MPa, and the reliability index β decreases from 8.4 to 3.0. The maximum stress and minimum reliability index appear at the bottom front column. It can be seen from Section 4.2 that the stand load greatly reduces the reliability of the bottom front column, and the back wind load further reduces its reliability, causing the derrick to have a higher reliability risk.
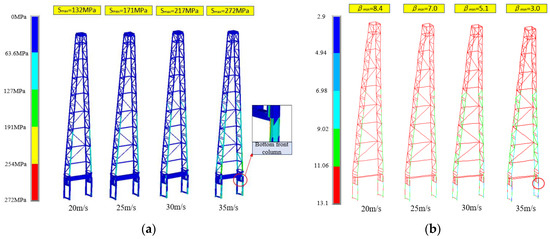
Figure 9.
The variation of the stress and reliability index with increasing wind speed. (a) Stress contour plot. (b) Reliability index contour plot.
Figure 10 shows the various trends of the column reliability index β along with the height under various wind speeds. βf decreases as wind speed increases at the height below 35.30 m. When the height is higher than 35.30 m, the reliability of the columns at four different wind speeds has no apparent difference. At the wind speed of 35 m/s, βf displays a rising trend from the bottom section to section II with increasing height. When the height varies from 0 m to 8.15 m, there are two extreme values, which are 4.61 and 3.0, respectively. Then, as the height increases, the amplitude of the fluctuation of βf drops sharply. There is a similar varying trend for βf at other wind speeds. As shown in Figure 9, βr has a similar variation to βf. The above results indicate that the coexistence of back wind load and stand load seriously reduces the reliability of the bottom column, and the stacking of too many stands should be avoided when the back wind load is large.
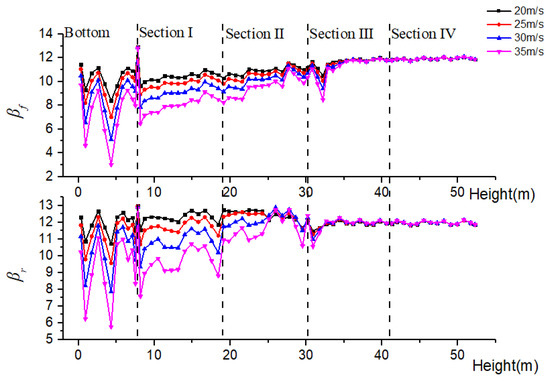
Figure 10.
Variation curve of column reliability index along with height under different wind speeds.
5. Discussion
5.1. The Contribution of Each Load to Strength and Reliability
Previous studies have not discussed the contribution of each load to the strength and reliability. To explore the contribution of each load to strength and reliability, the 750 kN hook load, 250 stands, and 20 m/s back wind speed are taken as an example. Then, the strength analysis and reliability analysis under seven different conditions, including the single hook load, single stand load, single wind load, composite load I (gravity, hook load and stand load), composite load II (gravity, hook load and wind load), composite load III (gravity, stand load and wind load) and complex load, are investigated and discussed. Four main front columns are selected to monitor the performance, which are section III-1, section II-1, section I-1 and the bottom, respectively. The stress proportion is defined as the ratio of the stress of the single load condition or the composite load condition to the stress of the complex load condition. Then, we discuss the stress proportion and minimum reliability index (βmin) of the four selected columns under the above seven conditions.
As shown in Figure 11, with the decrease in the column’s height, the stress proportion of the hook load gradually decreases from 0.68 to 0.18, the stress proportion of the stand load increases from 0.31 to 0.38, and the stress proportion of the wind load is almost unchanged. Under the composite load, with the column’s height decreasing, the stress proportion of composite load I decreases from 0.80 to 0.49, the stress proportion of composite load II decreases from 0.73 to 0.33, and the stress proportion of composite load III increases from 0.51 to 0.89. The results show that composite load I has the maximum stress proportion at the position of section III-1, and for the bottom column, composite load III has the maximum stress proportion. Therefore, as to the column at section III-1, a reasonable value of the hook load can ensure its safety and strength. For the bottom column, a windshield can be set to weaken the influence of wind, and stacking too many stands should be avoided.
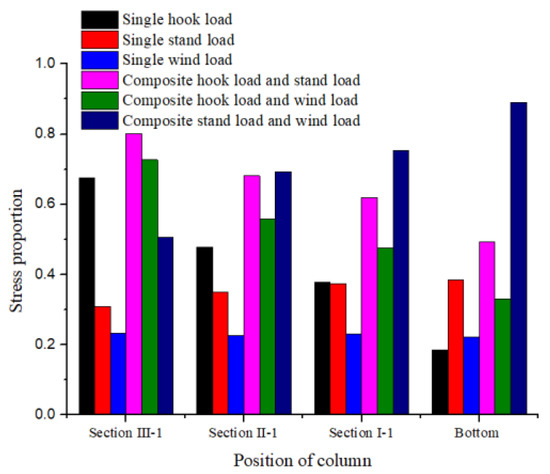
Figure 11.
Stress proportion under each load condition.
The effect of each load on the minimum reliability index βmin is studied as shown in Figure 12. In the composite load III and the complex load conditions, when the height of the column decreases, the βmin of the column decreases sharply, which are 26.8% and 24.3%, respectively. Under other working loads, the maximum varying degree of the reliability index is only 8.8%. It shows that when the back wind load and the stand load exist at the same time, the reliability of the derrick experiences a sharp drop with decreasing height. Therefore, it is particularly important to arrange the drilling load reasonably according to the environmental load.
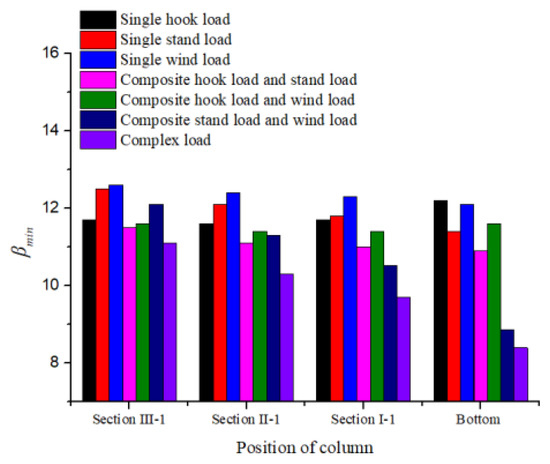
Figure 12.
The minimum reliability index under each load condition.
5.2. The Minimum Value of β under Complex Load
To investigate the influence of each load on the βmin under complex load, the parameters of 250 kN hook load, 28 stands, and 2 m/s back wind were regarded as the minimum value of each load; see Figure 13. It can be seen that with the increase in hook load, βmin is 11.87, 11.2, 10.52, 9.85 and 9.17, respectively. With the increase in the number of stands, βmin is 12.12, 11.97, 11.72, 11.45 and 11.18. As the wind speed increases, βmin is 12.12, 11.82, 11.01, 9.82 and 8.22. Through the above comparison, it can be found that under complex load, with the increase in each load, βmin gradually decreases. The increase in wind load has the greatest influence on the reduction in βmin. Considering the environment in which the offshore platform is located, the reliability of the derrick under different wind speeds has a significant gap. When the wind speed is less than 20 m/s, the hook load mainly affects the reliability of the derrick. When the wind speed is greater than 20 m/s, the wind load dominates the reliability of the derrick, and the influence of the wind load on βmin is 10.36 percent greater than that of hook load and 26.48 percent greater than that of stand load. The results show that the values of the hook load and stand load of the derrick should be reasonably selected according to the local marine wind load.
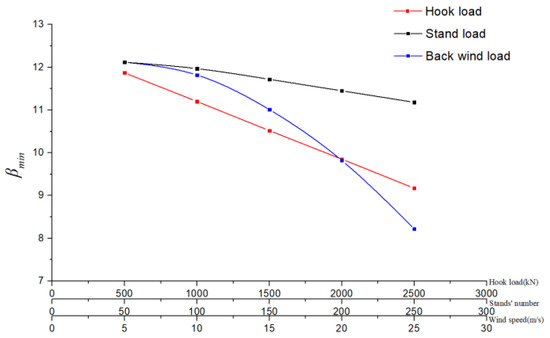
Figure 13.
Influence of each load change on minimum reliability index under complex load.
6. Conclusions
In this paper, based on the new reliability analysis programming and post-processing methods, the stress–strength reliability of the JJ315/45-K derrick under complex load is analyzed, and the following conclusions are drawn:
(1) With the increase in hook load, the positions of maximum reliability risk appear in section II-1. With the increase in stand load or back wind load, the positions of maximum reliability risk appear in the bottom section. It is necessary to monitor the stress of these risk columns.
(2) At the position of section III-1, composite load I has the maximum stress proportion, and for the bottom column, composite load III has the maximum stress proportion. Therefore, as to the column at section III-1, a reasonable value of the hook load can ensure its safety and strength. For the bottom column, a windshield can be set to weaken the influence of the wind, and stacking too many stands should be avoided.
(3) When the wind speed is less than 20 m/s, βmin is mainly affected by the hook load. When the wind speed is greater than 20 m/s, βmin is mainly affected by the wind load. According to the local marine wind load, the hook load and stand load should be reasonably selected.
Author Contributions
Methodology, Z.T., H.C. and C.C.; software, Z.T.; validation, Z.T., F.L. and Y.G.; investigation, F.L. and Y.G.; resources, F.W., F.L. and Y.G.; data curation, Z.T.; writing—original draft preparation, Z.T.; writing—review and editing, C.C.; project administration, C.C., H.C. and F.L. and Y.G.; funding acquisition, C.C. All authors have read and agreed to the published version of the manuscript.
Funding
The authors express their appreciations to the Chinese Scholarship Council (CSC) funding (CSC No. 202008515107), the Scientific Research Starting Project of SWPU (No. 2019QHZ009), Sichuan Science and Technology Plan Project (No. 2021JDRC0114) and CNPC Key Program Funding (No. 2021-JS-463) for their financial support of this work.
Institutional Review Board Statement
Not applicable.
Informed Consent Statement
Not applicable.
Data Availability Statement
Not applicable.
Conflicts of Interest
The authors declare no conflict of interest.
Nomenclature
| q | weight per unit length of stand, kg/m |
| l | length of stand, m |
| n | number of stands |
| θ | angle between stand and setback floor, ° |
| Pl | horizontal component of stand’s gravity, N |
| Pw | horizontal component of stand’s wind load, N |
| W | calculated wind pressure, Pa |
| n’ | number of stands per row |
| d | diameter of stand, m |
| v | wind speed, m/s |
| W0 | basic wind pressure, Pa |
| kz | wind pressure coefficients |
| kp | shape coefficient of wind pressure |
| P | equivalent static wind load, N |
| F | area of bearing wind load, m2 |
| σji | the stress of the i-th element in the j-th strength analysis, MPa |
| μi | stress mean of i-th element, MPa |
| si | stress standard deviation of i-th element, MPa |
| N | the number of cycles |
| βf | reliability index of front column |
| βr | reliability index of rear column |
| βmin | minimum reliability index |
| EX | random variable of elastic modulus |
| R | random variable of yield strength |
| GZ | random variable of hook load |
| Wz_L | random variable of stand wind pressure |
| Wz(i) (i = 0,1,2,3,4) | random variable of back wind pressure of each derrick section |
| x | random sample |
| M | total number of elements |
| A | stress matrix |
| U | stress mean matrix |
| S | stress variance matrix |
| Zi | stress–strength limit state function |
| Si | random variable of stress of i-th element |
| βi | reliability index of i-th element |
| μR | yield strength mean of i-th element, MPa |
| sR | yield strength standard deviation of i-th element, MPa |
Appendix A. Part of APDL Code
- # parameter of material
- e_x = random.normalvariate(u_ex, s_ex)
- mapdl.mp(‘ex’, 1, e_x)
- mapdl.mp(‘nuxy’, 1, 0.28)
- mapdl.mp(‘dens’, 1, 7850)
- ……
- # strength analysis
- mapdl.prep7()
- mapdl.allsel()
- mapdl.antype(‘static’, ‘new’)
- #boundary
- mapdl.run(‘KSEL,S,,,185,188,1’)
- mapdl.run(‘DK,ALL,,,,0,UX,UY,UZ,ROTX,ROTZ,,’)
- #gravity of derrick
- mapdl.acel(acel_z=‘9.8’)
- #stand load
- mapdl.run(‘KSEL,S,,,146,148,2’)
- mapdl.run(‘FK,ALL,FX,’ + str(lgzh)+’/2’)
- # wind load of section IV
- mapdl.run(‘KSEL,S,,,61,65,1’)
- mapdl.run(‘KSEL,A,,,83,87,1’)
- mapdl.run(‘FK,ALL,FX,’ + str(F4) + ‘/10’)
- ……
- #top four keypoints
- mapdl.run(‘KSEL,S,,,22,88,22’)
- mapdl.run(‘FK,ALL,FZ,-’ + str(gz) + ‘/4’)
- #gravity of racking board
- mapdl.run(‘KSEL,S,,,145,148,1’)
- mapdl.run(‘FK,ALL,FZ,-35000/4’)
- mapdl.slashsolu()
- mapdl.allsel()
- mapdl.solve()
Appendix B. Part of Python Code
The input xh_stress is the stress sample matrix A. The reliability of all elements is calculated and stored into the KKDZB[]. Then, according to the reliability data KKDZB[], the data processing and contour plot display can be carried out.
- one_jz = np.ones(((1, xh_num)))
- xh_stress_jz = np.mat(xh_stress)
- U = 1/xh_num * np.dot(one_jz, xh_stress_jz)
- B = U
- for i in range(1, xh_num):
- B = np.concatenate((B, U))
- B_jz = np.mat(B)
- I_jz = xh_stress_jz − B_jz
- I_zz_jz = np.transpose(I_jz)
- S_jz = 1/xh_num * np.dot(I_zz_jz, I_jz)
- S = []
- for i in range(0, totalnum):
- S.append(S_jz[i, i])
- KKDZB = []
- for i in range(0, totalnum):
- kkd = (345e6 − U [0, i])/math.sqrt((26.44e6) ** 2 + S[i])
- KKDZB.append(kkd)
- return KKDZB
References
- Jiang, F.G.; Zhang, M.; Yang, X.J.; Liang, Z. Equal-strength multi-objective optimization of dual derricks of the seventh-generation ultra-deep water offshore drilling rigs. Nat. Gas Ind. 2020, 40, 124–132. [Google Scholar]
- Liu, T.L.; Sun, Q.L.; Zhang, H.; Yi, S.; Feng, D. Study on strength calculation of workover rig derrick based on API extreme conditions. J. Saf. Sci. Technol. 2019, 15, 66–71. [Google Scholar]
- Gao, K. Safety Assessment of Oil Derrick with Damage under Designed Wind Load. Ph.D. Thesis, Yanshan University, Qinhuangdao, China, 2017. [Google Scholar]
- Huang, Z.Q.; Ji, S.D.; Zhang, B.; Qiu, C.S.; Xi, Y.X. Offshore derrick safety evaluation based on the test and simulation analysis. J. Mech. Strength 2016, 38, 721–728. [Google Scholar]
- Liang, L.H.; Gao, Z.L.; Wang, S.N. Structural Strength and buckling analysis for a steel derrick after its members removed partly. Key Eng. Mater. 2007, 353-358, 424–428. [Google Scholar] [CrossRef]
- Liu, Z.; Yao, K.; Wu, D.; Li, D.; Fu, J.Y.; Wu, J.X. The finite element analysis of static strength of workover derrick by truck. Adv. Mater. Res. 2012, 503-504, 918–922. [Google Scholar] [CrossRef]
- Yang, X.H.; Zhang, B.C.; Chen, Z.F. Mechanical analysis and optimization design of oilfield workover derricks. Pet. Explor. Dev. 2007, 34, 488–492. [Google Scholar]
- Zhu, L.; Geng, Y. Reliability analysis of double derrick based on stress analysis. Key Eng. Mater. 2016, 667, 548–554. [Google Scholar] [CrossRef]
- Han, D.Y.; Wang, Z.L.; Zhu, J.L. Analysis of residual life of derrick steel structure based on the time-varying reliability and fatigue effects. Acta Metrol. Sin. 2015, 36, 491–495. [Google Scholar]
- Zheng, Y.; He, D.S.; Cheng, Y.; Mo, L. Time-dependent reliability analysis of oil derrick structures in mechanism failure mode. Int. J. Steel Struct. 2020, 20, 985–1002. [Google Scholar] [CrossRef]
- Catbas, F.N.; Susoy, M.; Frangopol, D.M. Structural health monitoring and reliability estimation: Long span truss bridge application with environmental monitoring data. Eng. Struct. 2008, 30, 2347–2359. [Google Scholar] [CrossRef]
- Çeribaşı, S. Reliability of steel truss roof Systems under variable snow load profiles. Int. J. Steel Struct. 2020, 20, 567–582. [Google Scholar] [CrossRef]
- Niu, X.P.; Wang, R.Z.; Liao, D.; Zhu, S.P.; Zhang, X.C.; Keshtegar, B. Probabilistic modeling of uncertainties in fatigue reliability analysis of turbine bladed disks. Int. J. Fatigue 2021, 142, 105912. [Google Scholar] [CrossRef]
- Brites, R.D.; Neves, L.C.; Machado, J.S.; Lourenço, P.B.; Sousa, H.S. Reliability analysis of a timber truss system subjected to decay. Eng. Struct. 2013, 46, 184–192. [Google Scholar] [CrossRef]
- Xu, D.J. The Structural Strength and Reliability Analysis of K Type Derrick and Substructure; Southwest Petroleum University: Chengdu, China, 2017. [Google Scholar]
- Xu, D.J.; Lian, Z.H.; Zhang, Z.D.; Jing, J.J. The structural strength reliability assessment of K type oil derrick. Comput. Simul. 2016, 33, 189–193. [Google Scholar]
- Mochocki, W.; Obara, P.; Turant, J. Influence of truss topology on reliability index. IOP Conf. Ser. Mater. Sci. Eng. 2019, 471, 52–61. [Google Scholar] [CrossRef]
- Han, D.Y.; Luo, G.; Wei, S.M.; Wei, Q.; Du, C.W. Random reliability analysis of oil derrick based on APDL Second development. In Proceedings of the International Field Exploration and Development Conference, Xi’an, China, 20–21 September 2015. [Google Scholar]
- Leonel, E.D.; Chateauneuf, A.; Venturini, W.S. Coupled reliability and boundary element model for probabilistic fatigue life assessment in mixed mode crack propagation. Int. J. Fatigue 2010, 32, 1823–1834. [Google Scholar] [CrossRef]
- Yin, X.W.; Qian, W.X.; Pham, H. Parametric simulation analysis and reliability of escalator truss. Open Phys. 2018, 16, 938–942. [Google Scholar] [CrossRef]
Publisher’s Note: MDPI stays neutral with regard to jurisdictional claims in published maps and institutional affiliations. |
© 2022 by the authors. Licensee MDPI, Basel, Switzerland. This article is an open access article distributed under the terms and conditions of the Creative Commons Attribution (CC BY) license (https://creativecommons.org/licenses/by/4.0/).