Article

Study on Permeability Stress-Sensitivity in Seepage-Geomechanical Coupling of Fractured Deep Tight Sandstone Gas Reservoirs

1
State Key Laboratory of Geomechanics and Geotechnical Engineering, Institute of Rock and Soil Mechanics, Chinese Academy of Sciences, Wuhan 430071, China
2
University of Chinese Academy of Sciences, Beijing 100049, China
*
Author to whom correspondence should be addressed.
Appl. Sci. 2022, 12(22), 11672; https://doi.org/10.3390/app122211672
Submission received: 25 October 2022 / Revised: 11 November 2022 / Accepted: 14 November 2022 / Published: 17 November 2022
(This article belongs to the Special Issue Structural Geology, Rock Mechanics and Their On-Site Testing Analysis)

Abstract

:
Accurately predicting the characteristics and influencing factors of permeability stress-sensitivity contributes to improving gas production in gas reservoirs. In this paper, the effects of effective stress on the permeability of fractured deep tight sandstone reservoirs were studied by laboratory tests. With the experimental results, a coupled seepage-geomechanical model for fractured deep tight sandstone gas reservoirs was constructed. The influences of pore pressure and geo-stress on permeability characteristics and gas production were studied by numerical simulation. The results indicate: (1) When the effective stress increases from 0 to 65 MPa, the permeability of the natural sample with fractures decreases by 81.28%, and the permeability of the intact core sample decreases by 54.67%. (2) When the pore pressure decreases from 120 to 85 MPa, the three-dimensional effective stress increases. The largest increase of the effective stress was along the vertical direction, which increased by 11~19 MPa. In addition, the permeability of the fractured zone and the intact rock along the vertical direction decreased by about 40% and 16%, respectively. (3) The mean square error between the historical gas production results and the results by simulation was 2.22 when considering the permeability stress-sensitivity, and 4.01 without considering the permeability stress-sensitivity. The proposed coupled seepage-geomechanical model with permeability stress-sensitivity proved to be more accurate in historical gas production comparison and prediction. This study provides a reliable optimization scheme for the development of fractured deep tight sandstone gas reservoirs.

1. Introduction

The exploration and development history of tight sandstone gas reservoirs spans more than 40 years. The United States, Russia and Canada are leading in tight sandstone gas production technology [1]. Tight sandstone gas is widely distributed and has great potential for development. In recent years, a large number of tight sandstone gas reservoirs have been discovered in China, such as those in Tarim, Sichuan, Ordos, Songliao and other basins [2,3]. Compared to conventional sandstone reservoirs, the genesis of fractured deep tight sandstone is more complex. It has poor physical properties, complex pore structure, strong heterogeneity and low permeability and porosity. During the development of gas reservoirs, the original stress system of the reservoir is destroyed and the pore pressure of the reservoir decreases, producing the gas. The increase of effective stress causes deformation of the rock, which in turn leads to changes in the physical parameters of the reservoirs [4,5]. The change in pore-permeability parameters has a great impact on the development of low porosity and low permeability reservoirs. The influence of permeability stress-sensitivity on the development of fractured deep tight sandstone gas reservoirs cannot be ignored.
The research on permeability stress-sensitivity by Chinese and foreign scholars is mainly reflected in theoretical and laboratory experiments. McLatchie et al. [6] found that the permeability stress-sensitivity was more significant in low-permeability rocks compared to high-permeability rocks. Liu et al. [7] found in their experiments that an increase in effective stress caused the decrease in rock porosity and permeability, with a large decrease in the pore-permeability parameters of the fractured cores. Zhu et al. [8] conducted stress-sensitive experiments on tight sandstone and found that tight sandstone reservoirs were highly sensitive to stress under high-temperatures and high-pressures. Yang et al. [9], Jiao et al. [10], Yang et al. [11] and other scholars have successively used the experimental method of variable pore pressure and constant confining pressure to evaluate the stress-sensitivity, forming a test method for tight sandstone. Chalmers et al. [12] and Xiao et al. [13] fitted the exponential function of permeability vs. effective stress, while Dong et al. [14] fitted functions in power format. Zheng et al. [15] improved the exponential function and obtained more accurate fitting results. Zhang et al. [16] optimized the calculation method of effective stress coefficients according to the three-dimensional surface fitting method.
Numerous experimental studies have shown that the increase in effective stress leads to the decrease in a reservoir permeability and porosity, which is particularly evident in low permeability reservoirs [17,18,19]. Li et al. [20] believed that the stress-sensitivity of the low-permeability rocks should be extremely weak, since it’s calculated by the rock compression coefficient and low in the tight reservoirs. However, the mechanism of permeability stress-sensitivity is still unclear in the development of high-temperature and high-pressure tight sandstone gas reservoirs.
Using an accurate mathematical model to describe the seepage-geomechanical coupling is the key to complete the numerical simulation of gas reservoirs. Currently, the simulation of rocks with natural fractures is mainly based on the continuous medium model and discrete fracture model [21,22]. Ghafouri and Lewis [23] first proposed a dual-medium model by using a finite element method to treat natural fractures. Wei and Zhang [24] proposed a triple-porosity/dual-permeability model for coalbed methane mining, which effectively simulates the coupling effect between stress and microporosity expansion and contraction. The continuous medium model focuses on macro-scale fracture seepage, but ignores the heterogeneity of the reservoirs. The discrete fracture model can calculate matrix and fracture nonlinear deformation separately, but the calculation is less efficient [25]. The models above mostly use the full-coupling method, which is only applicable to a homogeneous model. The iterative coupling method can truly reflect the heterogeneity and anisotropic characteristics of the reservoirs, and this method has high correlation.
In this paper, deep tight gas reservoir cores were drilled from the target formation at a buried depth of 6700~7300 m, and the typical rock samples with intact core and natural fractures were screened. In combination with the high-temperature and high-pressure stress-sensitive test system, the permeability stress-sensitivity experiments were carried out to obtain the evolution of mechanical parameters and pore-permeability parameters with effective stress under rock sample development conditions. The refined 4D geological model of the target formation was established. The numerical simulation of fractured deep dense sandstone gas reservoirs was carried out, and the impact of permeability stress-sensitivity on gas reservoir development was analyzed on the basis of fitting with historical gas production data. Based on the numerical simulation results and the production conditions, the gas reservoir development scheme was optimized.

2. Experiments

2.1. Sample Preparation

The rock samples were drilled from the downhole of the target formation at a depth of 4500~8500 m, which led to high-temperature and high-pressure operating conditions in the reservoir. The samples were mainly feldspathic sandstone with pore type of intergranular pores. The target productions wells were in the Bashijiqike Formation, which can be divided into three main lithologic layers from top to bottom, including K1BS1, K1BS2 and K1BS3. The thickness of the reservoir was 280~320 m. The pressure coefficient was 1.76. The original formation pressure was 123.59 MPa. The temperature was 179.97 °C. Thus, the reservoir is regarded as a high-temperature and high-pressure dry gas reservoir [26].
The rock samples were divided into 5 intact core samples and 5 fractured samples, which are shown in Figure 1. Rock samples were made into cylindrical standard specimens with dimensions of 25 mm × 50 mm. The absolute permeability and porosity of the ten rock samples were measured by the steady state method and alcohol saturation method, respectively, and the detailed data are shown in Table 1.

2.2. Experimental Set-Up and Scheme

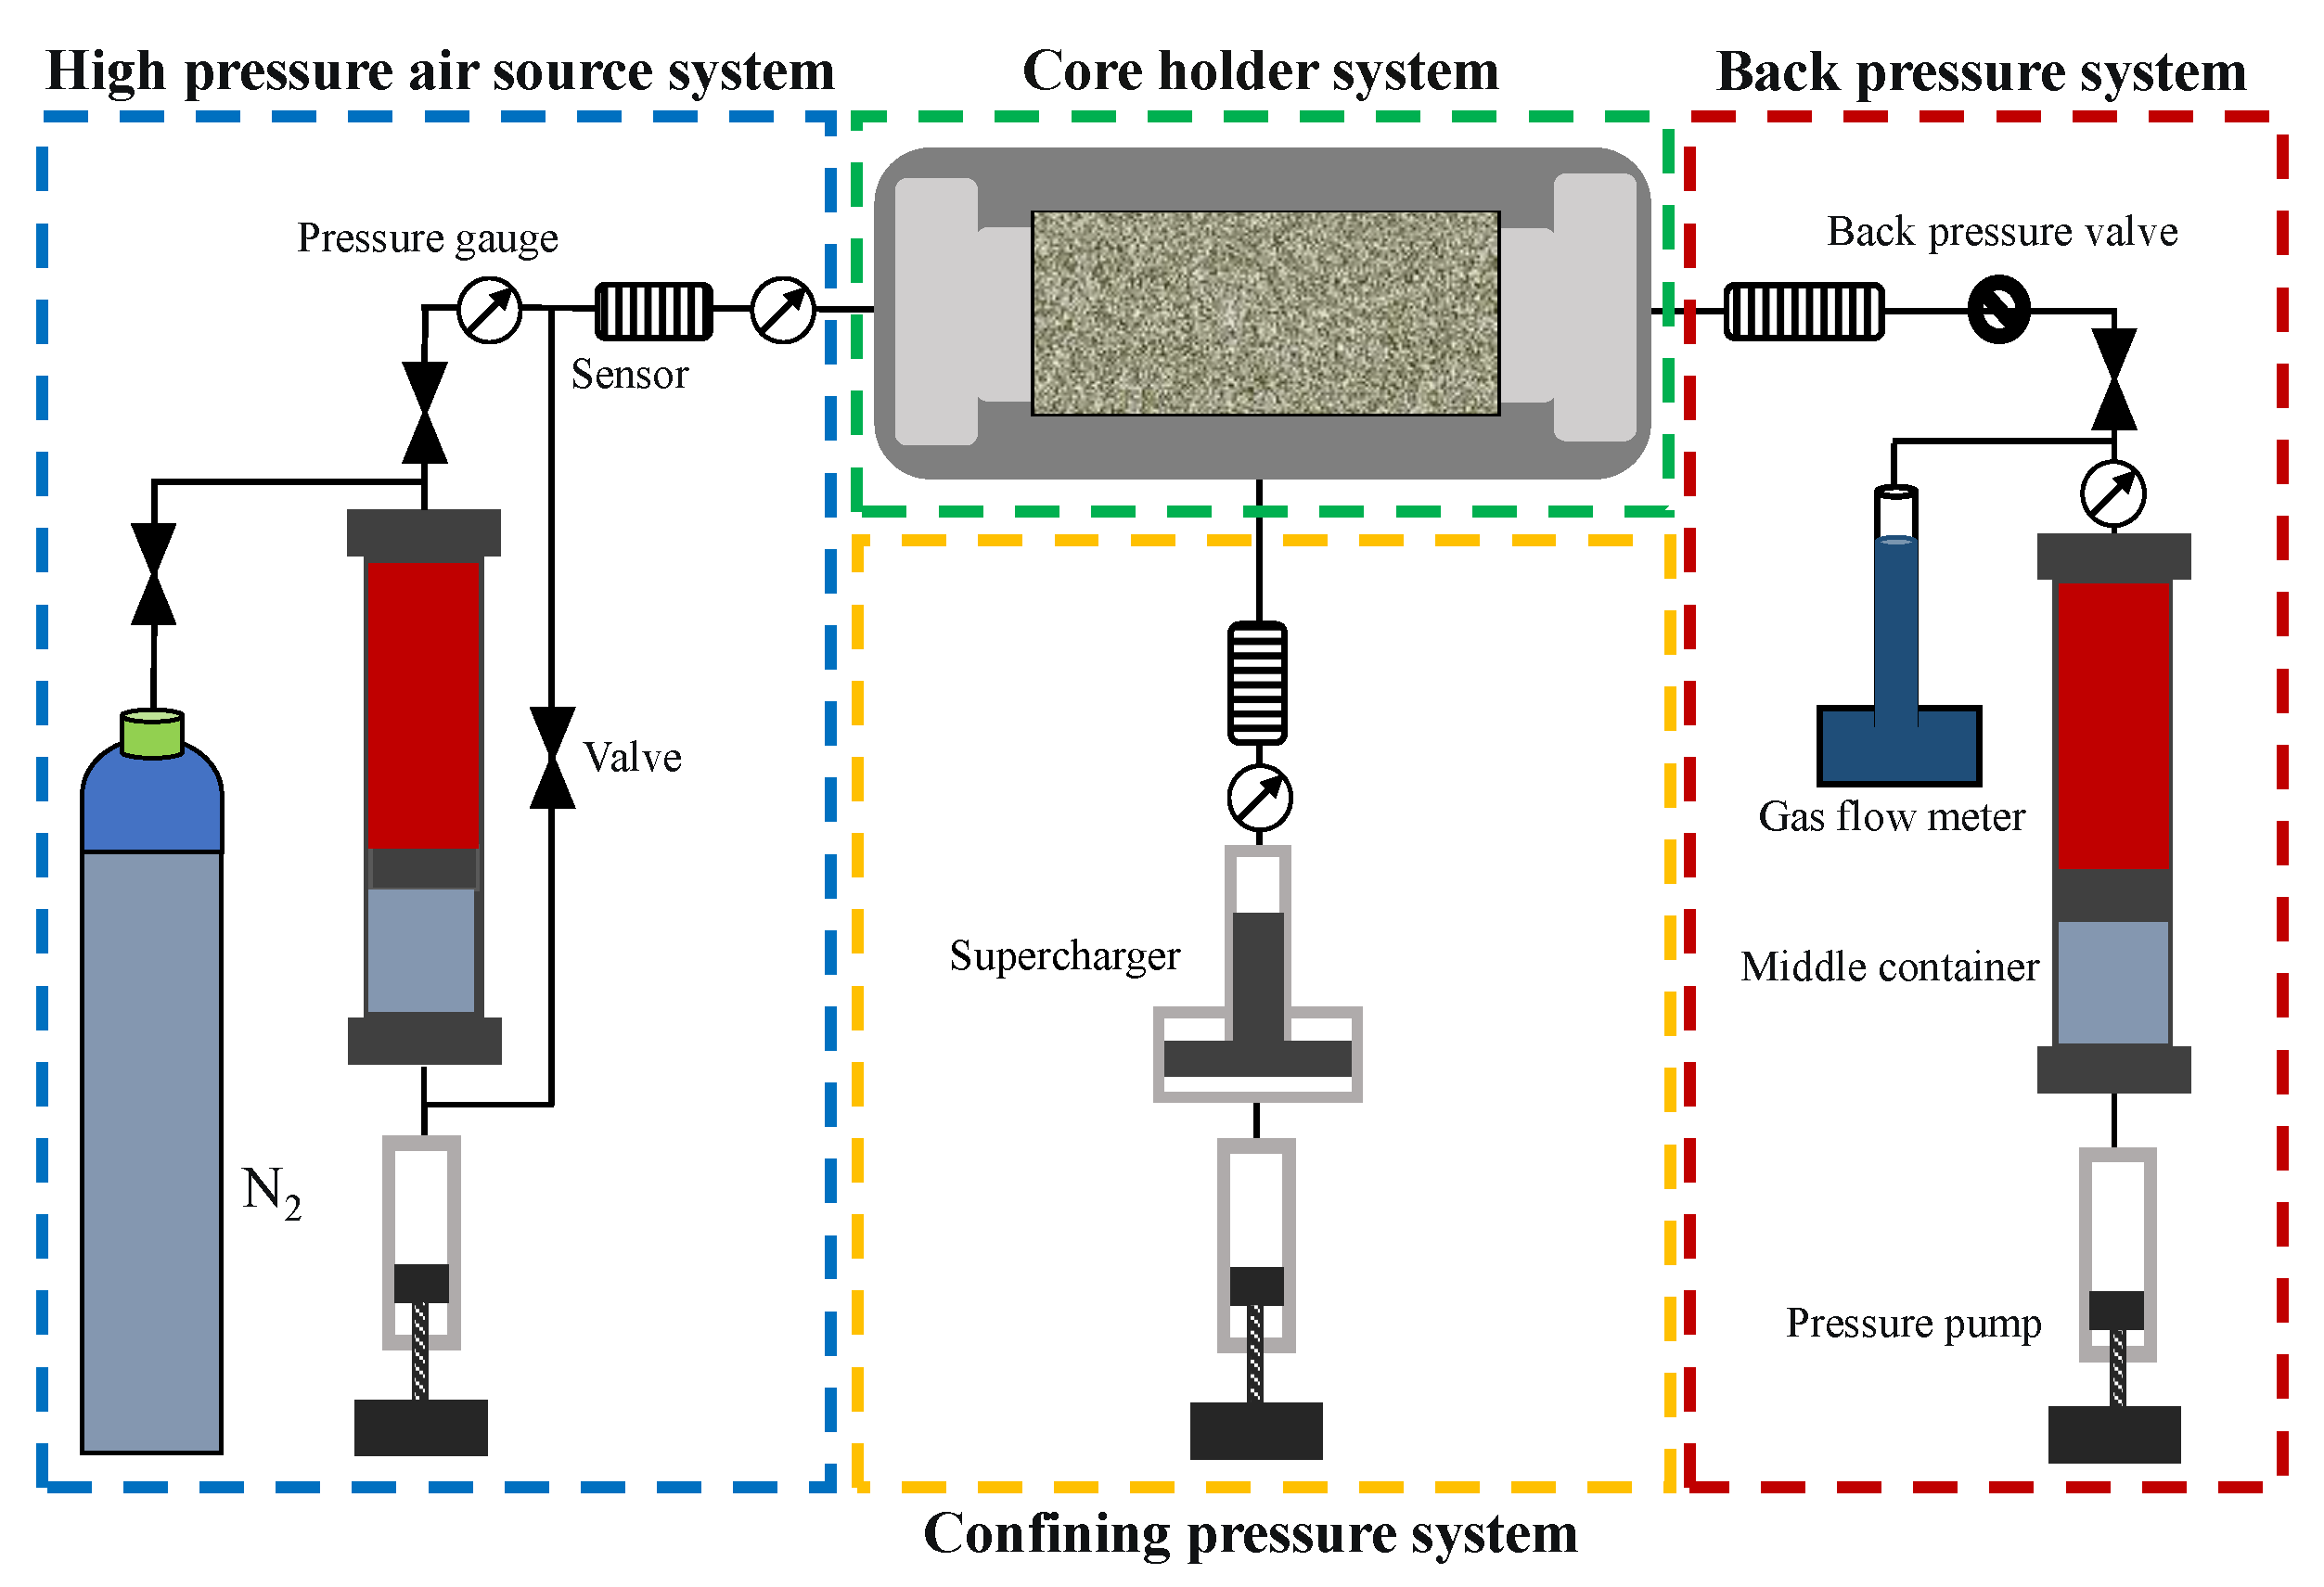
The high-temperature and high-pressure stress-sensitive test system [27] was used to measure the permeability of rock sample by the steady state method, and the structure of the device is shown in Figure 2. The device consists of four parts: hole pressure system, core holder, confining pressure system and back pressure system. The maximum confining pressure that can be set for the device is 90 MPa, the maximum pore pressure is 60 MPa and the maximum temperature is 125 °C, meeting the experimental requirements. Nitrogen is stable, less prone to chemical reaction, safe and controllable, therefore it has been selected as the experimental fluid.
The stress-sensitivity experiments of tight sandstone reservoirs mainly simulate the influence of effective stress changes on rock permeability [28]. The steady-state method was used for the determination of core permeability; the effective stress is increased successively by 5, 10, 15, 25, 35, 45, 55 and 65 MPa. The steady-state time of each test point was two hours, the data were recorded after state stabilized, the test was repeated five times and the average value was taken as the permeability of the test point.

2.3. Experimental Results and Analysis

We chose exponential and power functions to fit the experimental data, and the results are shown in Figure 3. The correlation coefficients of exponential and power functions of the intact core sample were 0.9272 and 0.8899, respectively. The correlation coefficients of exponential and power functions of the fractured sample were 0.9244 and 0.9227, respectively. The correlation coefficient of exponential functions was better than that of power functions, which has the following expression:
k = k 0 e β σ
where, k0 is initial permeability rate, β is Fitting coefficient and σ is the effective stress.
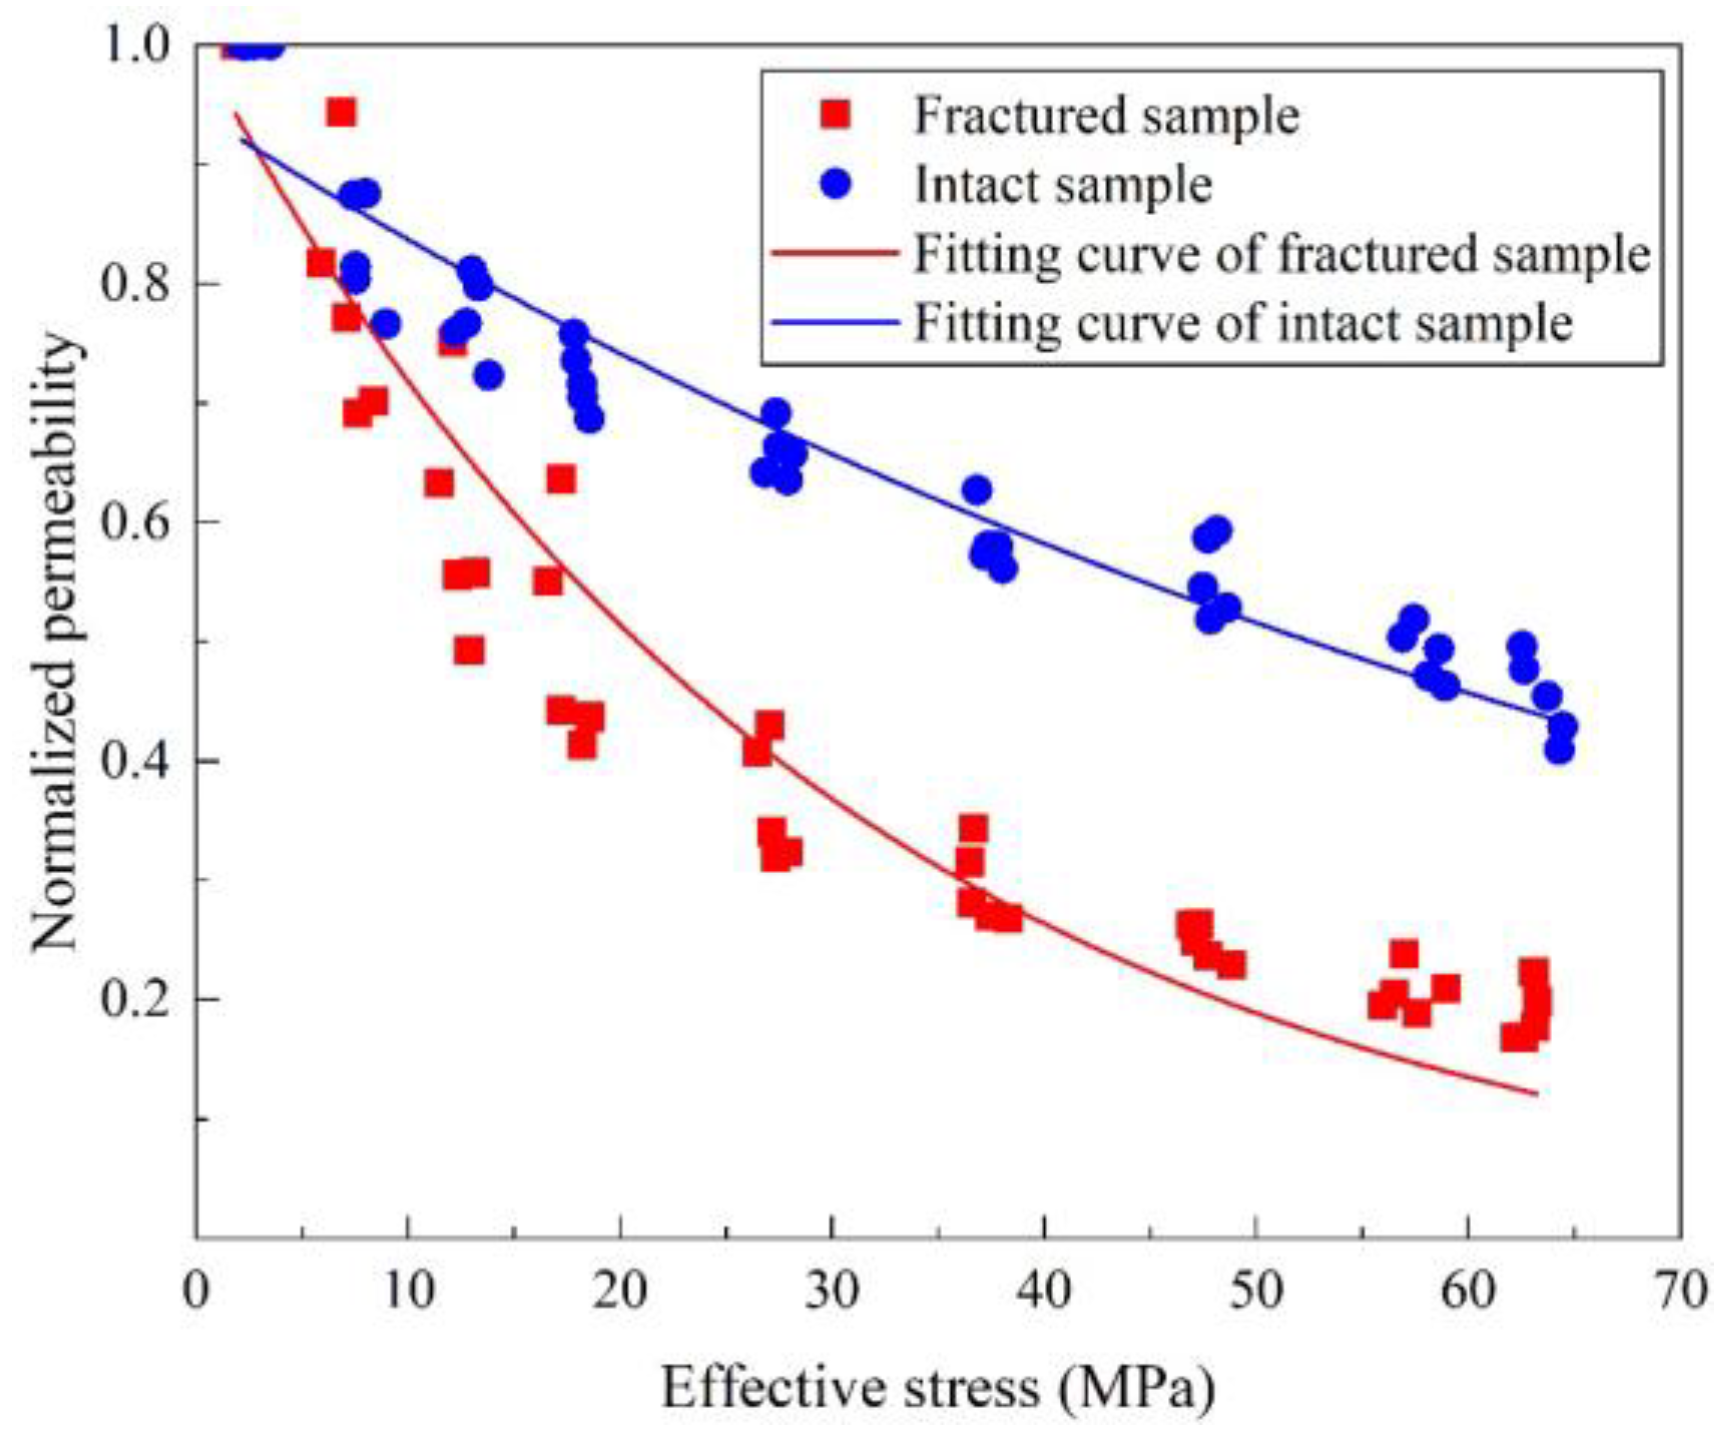
Figure 4 shows the relationships between the normalized permeability and the effective stress of both types of rock samples. The permeability decreases gradually with increasing effective stress. When the effective stress is increased from 0 to 65 MPa, the permeability of the fractured sample decreased by 81.28%, and the permeability of the intact core sample decreased by 54.67%, indicating the permeability stress-sensitivity of the target formation couldn’t be ignored. Additionally, the permeability stress-sensitivity of the fractured samples was found to be higher than that of the intact core samples.

3. Numerical Simulation of Tight Sandstone Gas Reservoirs

3.1. Governing and Constitutive Equations

The dynamic coupling interaction of fluids flow and geo-stress has been regarded as one of the key factors in the development of tight reservoirs. The established mathematical models used in this study followed the assumptions that: (1) the un-uniform temperature of the reservoir is constant in the simulation; (2) only immiscible gas-water two-phase flow is considered; and (3) the reservoir is treated as a dual-porosity medium including the matrix system and the fracture system.

3.1.1. Mathematical Model of Seepage Field

The basic differential equation of the gas-water two-phase seepage based on the mass conservation law and Darcy’s law is as follows [29]:
{ [ ρ g k k rg μ g B g ( p g ρ g g H ) ] ± q mg + q g = t ( ρ g ϕ S g B g ) [ ρ w k k rw μ w B w ( p w ρ w g H ) ] ± q mw + q w = t ( ρ w ϕ S w B w )
where k is absolute permeability, krg and krw are relative permeability of gas and water, respectively, μg and μw are viscosity of gas and water, respectively, po and pw are the pressure of gas and water, respectively, ρg and ρw are density of gas and water under standard conditions, respectively, Sg and Sw are saturation of gas and water, respectively, Sg + Sw = 1, H is elevation, ϕ is porosity, qg and qw are seepage of gas and water, respectively, Bg and Bw are the bulk coefficients of gas and water, respectively, qmg and qmw are matrix-fracture transfer terms of gas and water, respectively. When qmg, qmw are preceded by minus sign, Equation (2) is the matrix seepage differential equation, when qmg, qmw are preceded by plus sign, Equation (2) is the fracture seepage differential equation.

3.1.2. Mathematical Model of Stress Field

Rock deformation may transition from an elastic to a plastic state during gas reservoir development. The elastic-plastic deformation of rock is governed by the following equations [30,31]:
σ i j , j ( α δ i j p f ) , j + f i = 0
ε i j = 1 2 ( u i , j + u j , i )
{ d σ } = [ D ep ] { d ε }
[ D ep ] = [ [ D ] [ D ] { Q σ } { F σ } T [ D ] A + { F σ } T [ D ] { Q σ } ]
where σij is the effective stress tensor, fi is the volume force tensor, α is the effective stress coefficient, δij is the Kronecker delta, εij is the strain tensor, u is the displacement component, [D] is the elastic matrix, [Dep] is the elastic-plastic matrix and A is the strain hardening parameter. According to the law of associated seepage, when the yield function, F, and plastic potential function, Q, in the matrix are equal, [Dep] is a symmetric matrix.
Combining the mechanical properties of rocks in the target formation [32,33], the Mohr-Coulomb yield criterion is chosen considering the elastic-plastic deformation of the formation rocks.

3.2. Modeling Process

3.2.1. Numerical Simulation Coupling Procedure

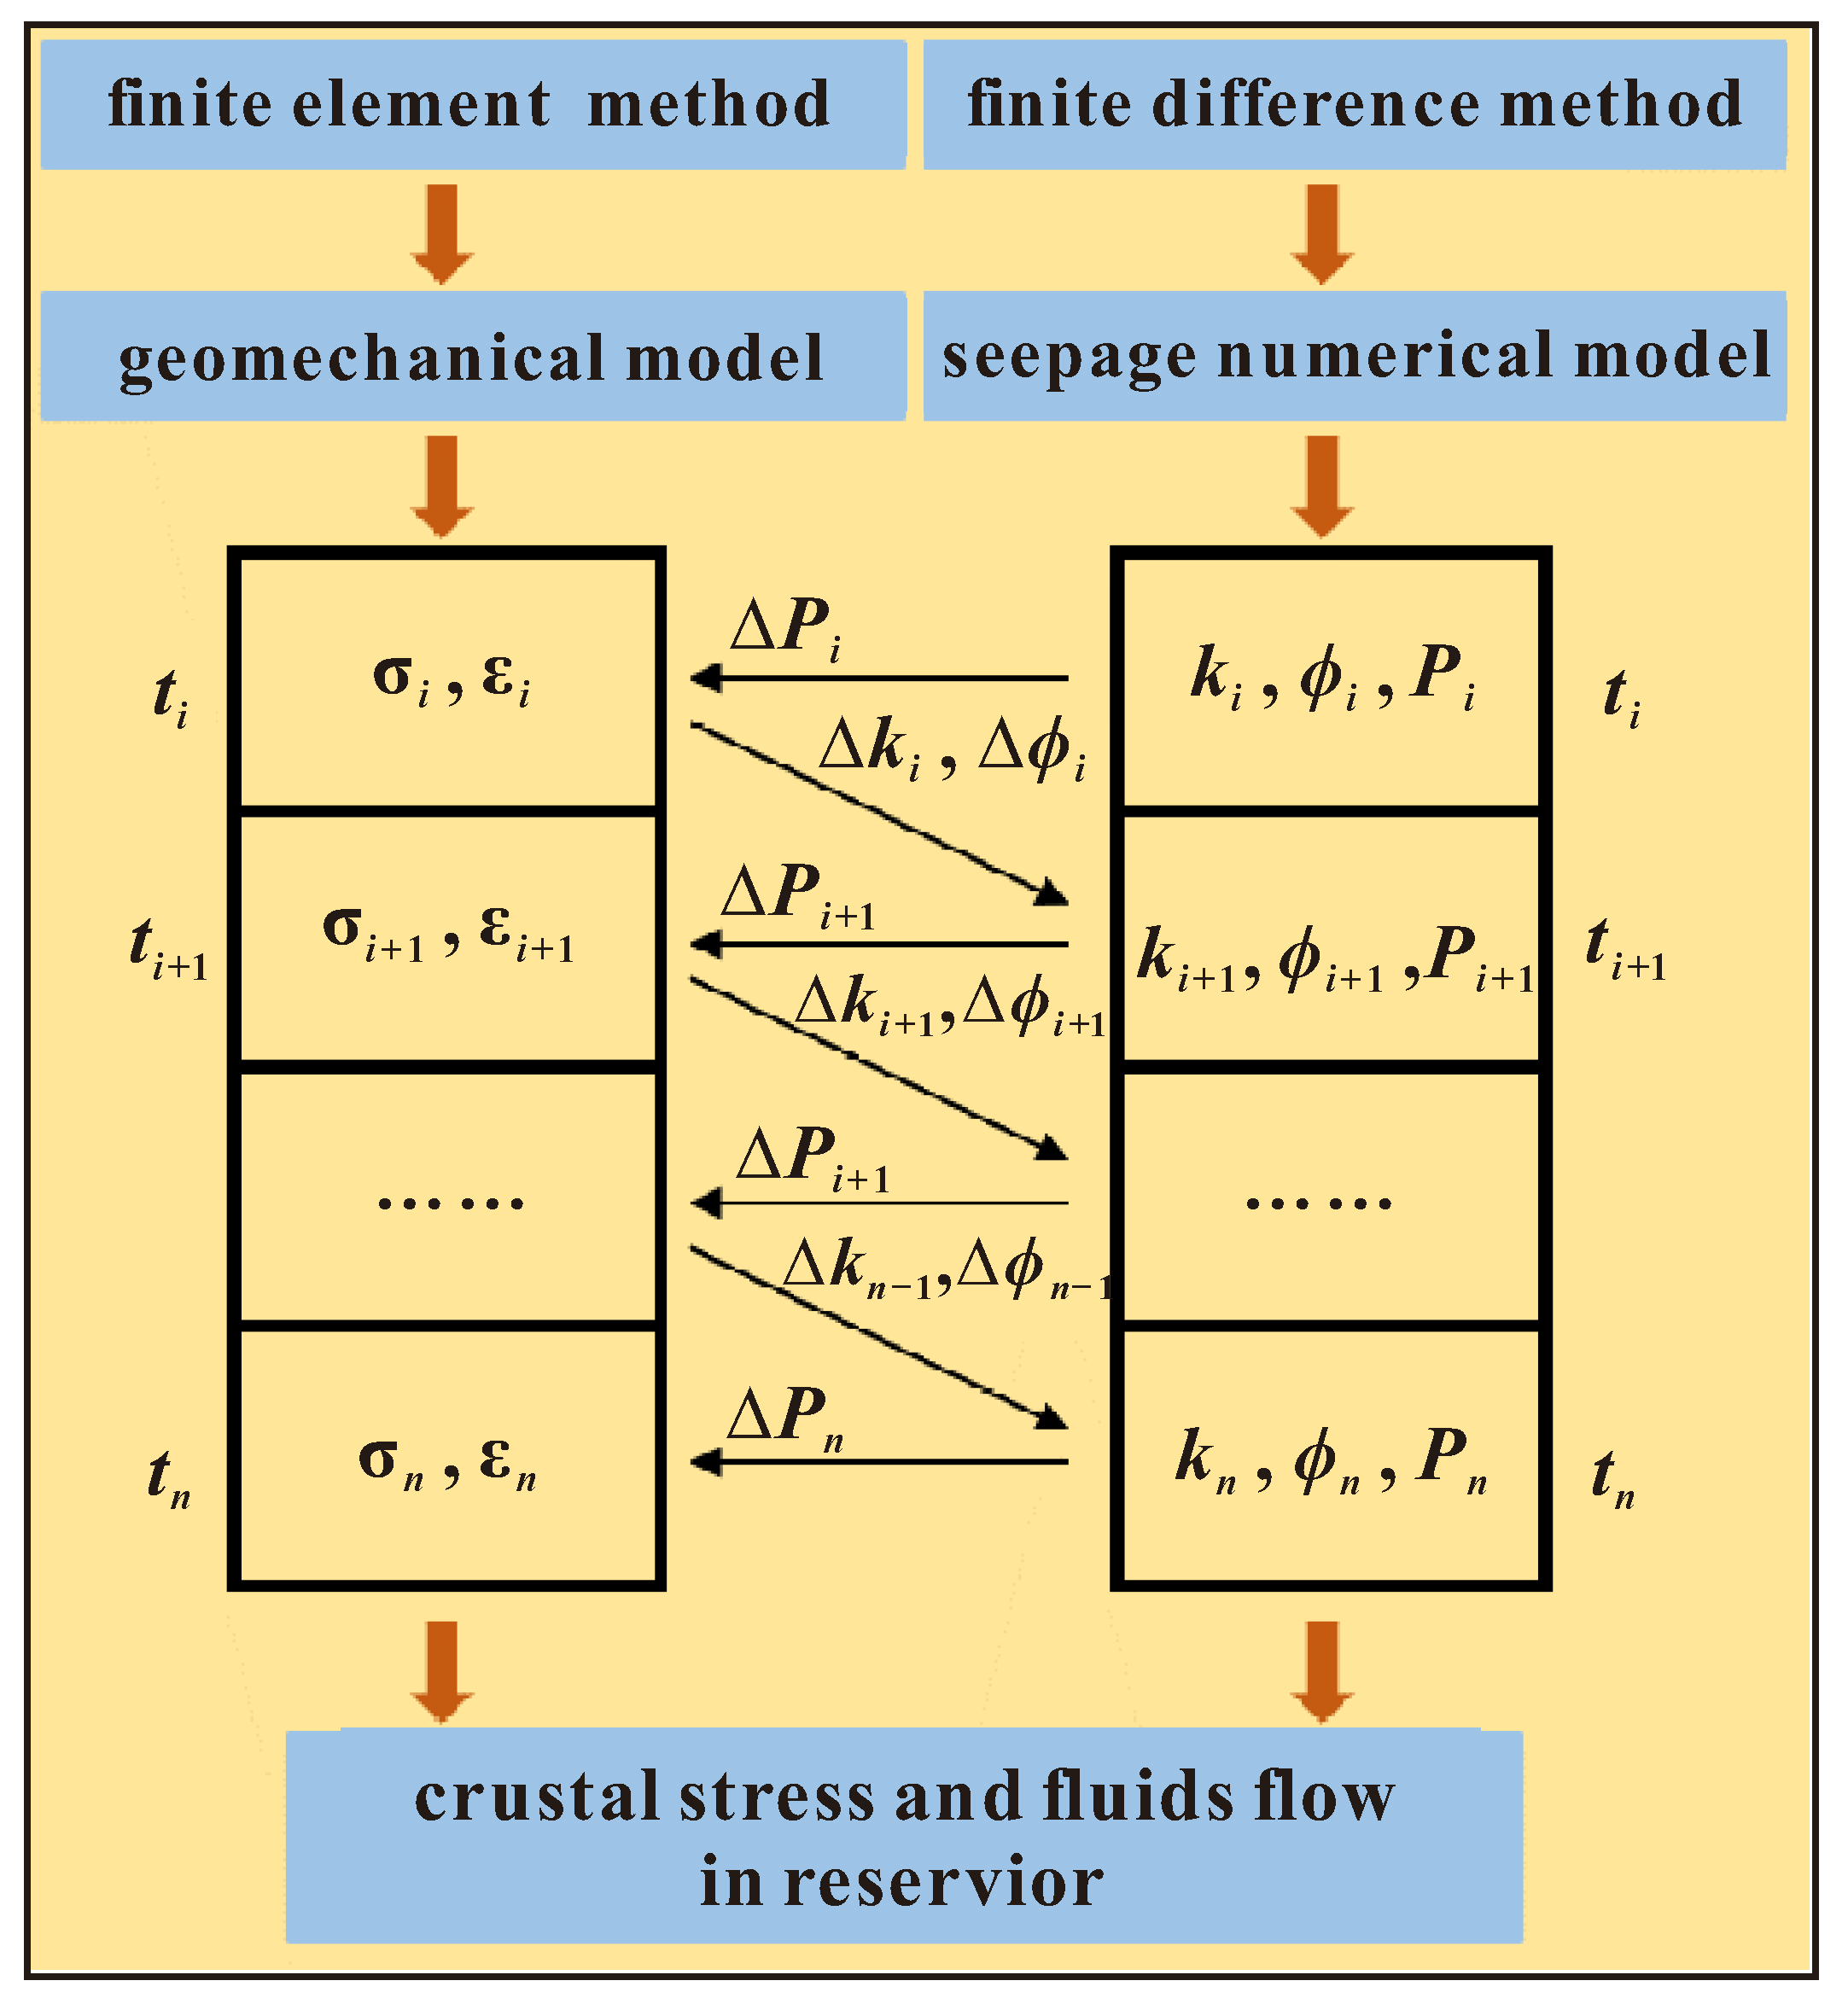
The simulation is based on the Petrel RE simulation software, which calculates the seepage numerical model according to the finite difference method, and the geomechanical model using the finite element method, as shown in Figure 5. The two types of models are coupled by iterative coupling and the pore-permeability parameters of the seepage numerical model are updated according to the geomechanical model data. The established simulation scheme improves the computational efficiency and the accuracy by real-time data transfer between the fluid flow and geo-stress [34,35].

3.2.2. Seepage Numerical Model

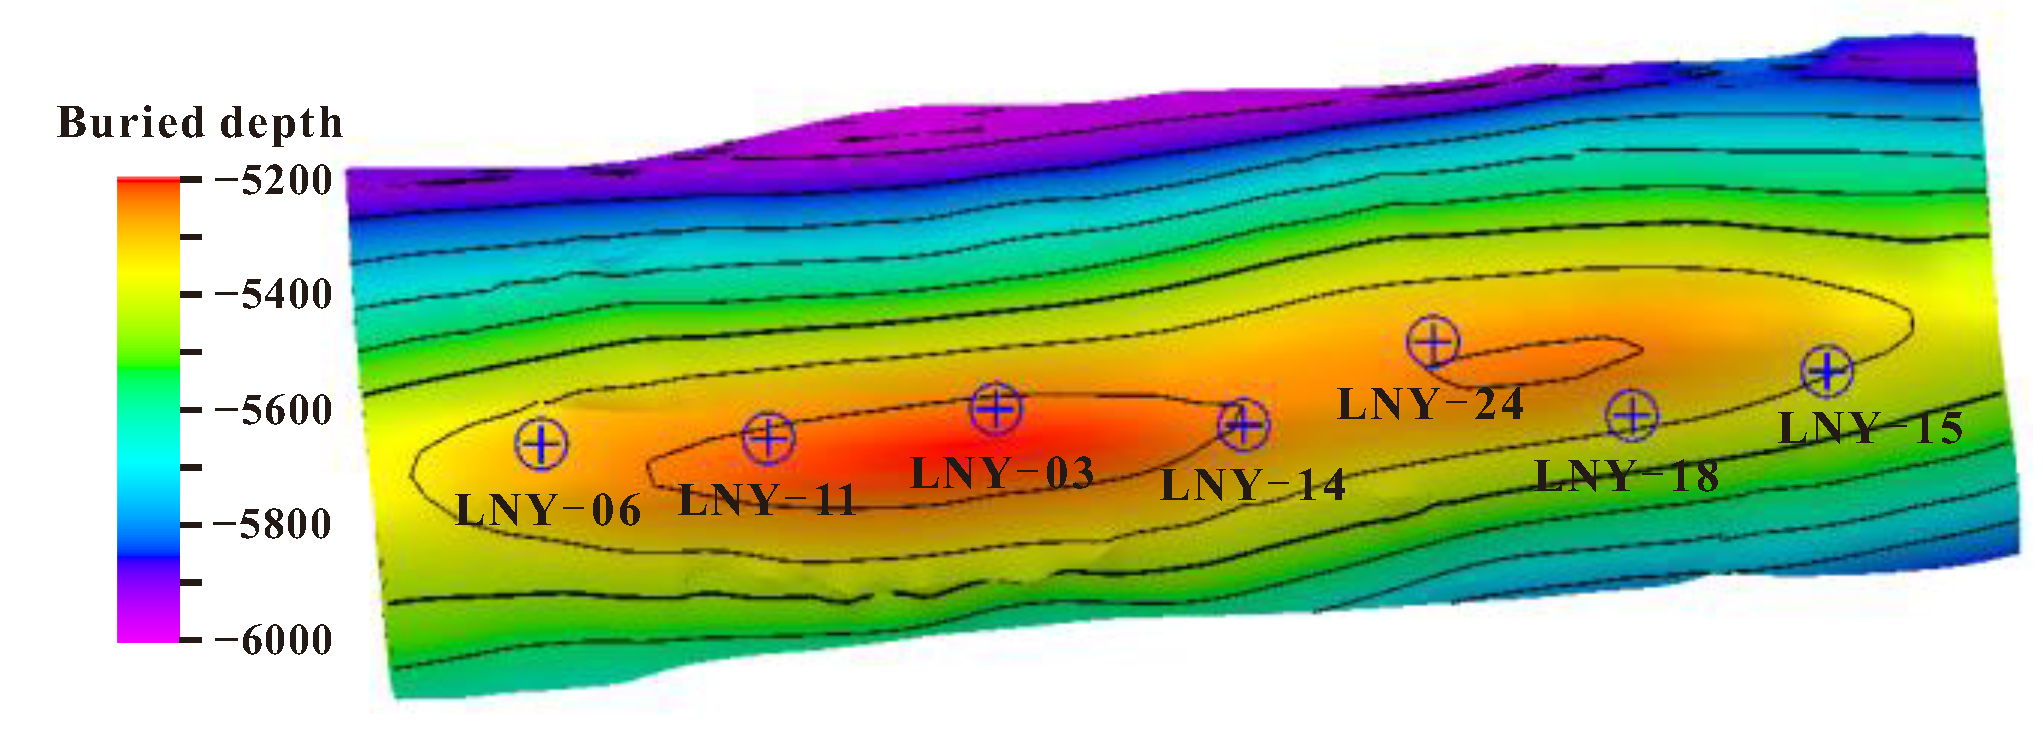
The structural feature of the study block is the anticline trap, with seven wells distributed in rows on the anticline, and the structural map of the top of layer K1BS1 is shown in Figure 6. The burial depth is about −5500 m~−6900 m, reservoir thickness is about 290 m~380 m, the study block is about 8600 m long from east to west, and about 2500 m~2800 m wide from north to south. The geological grid model is established, the plane grid size is 100 m × 100 m, and the number of plane grids is 86 × 26, and according to the horizon thickness it is divided into 50 vertical grids, with size of 6.5 m.
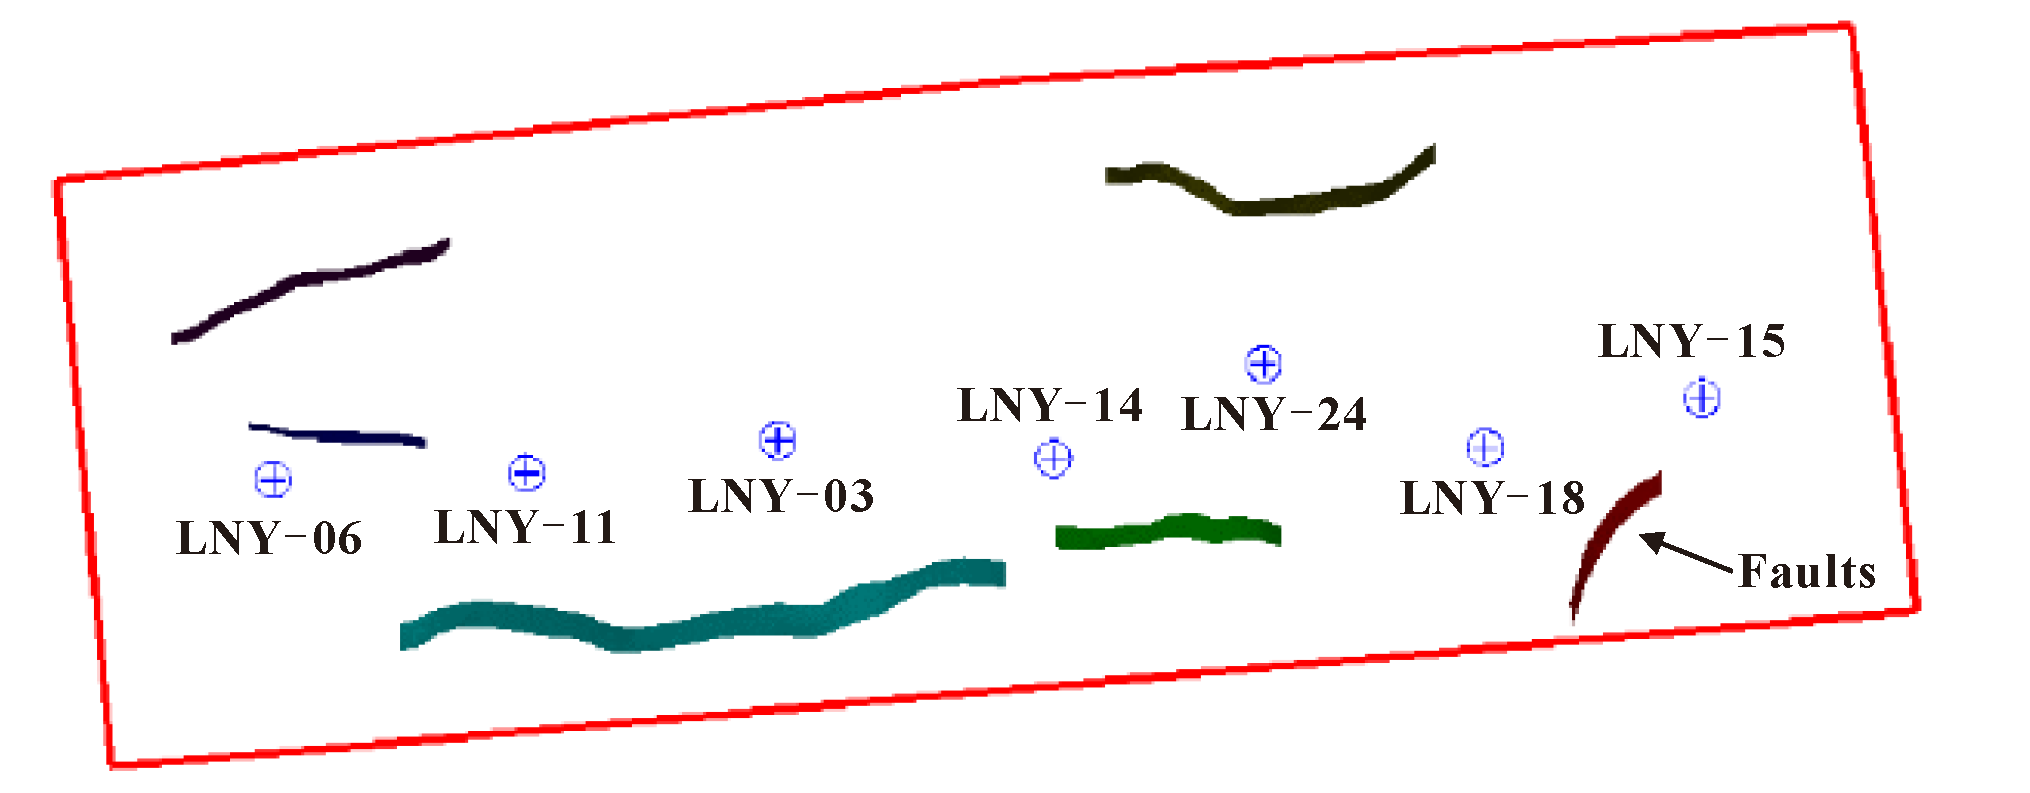
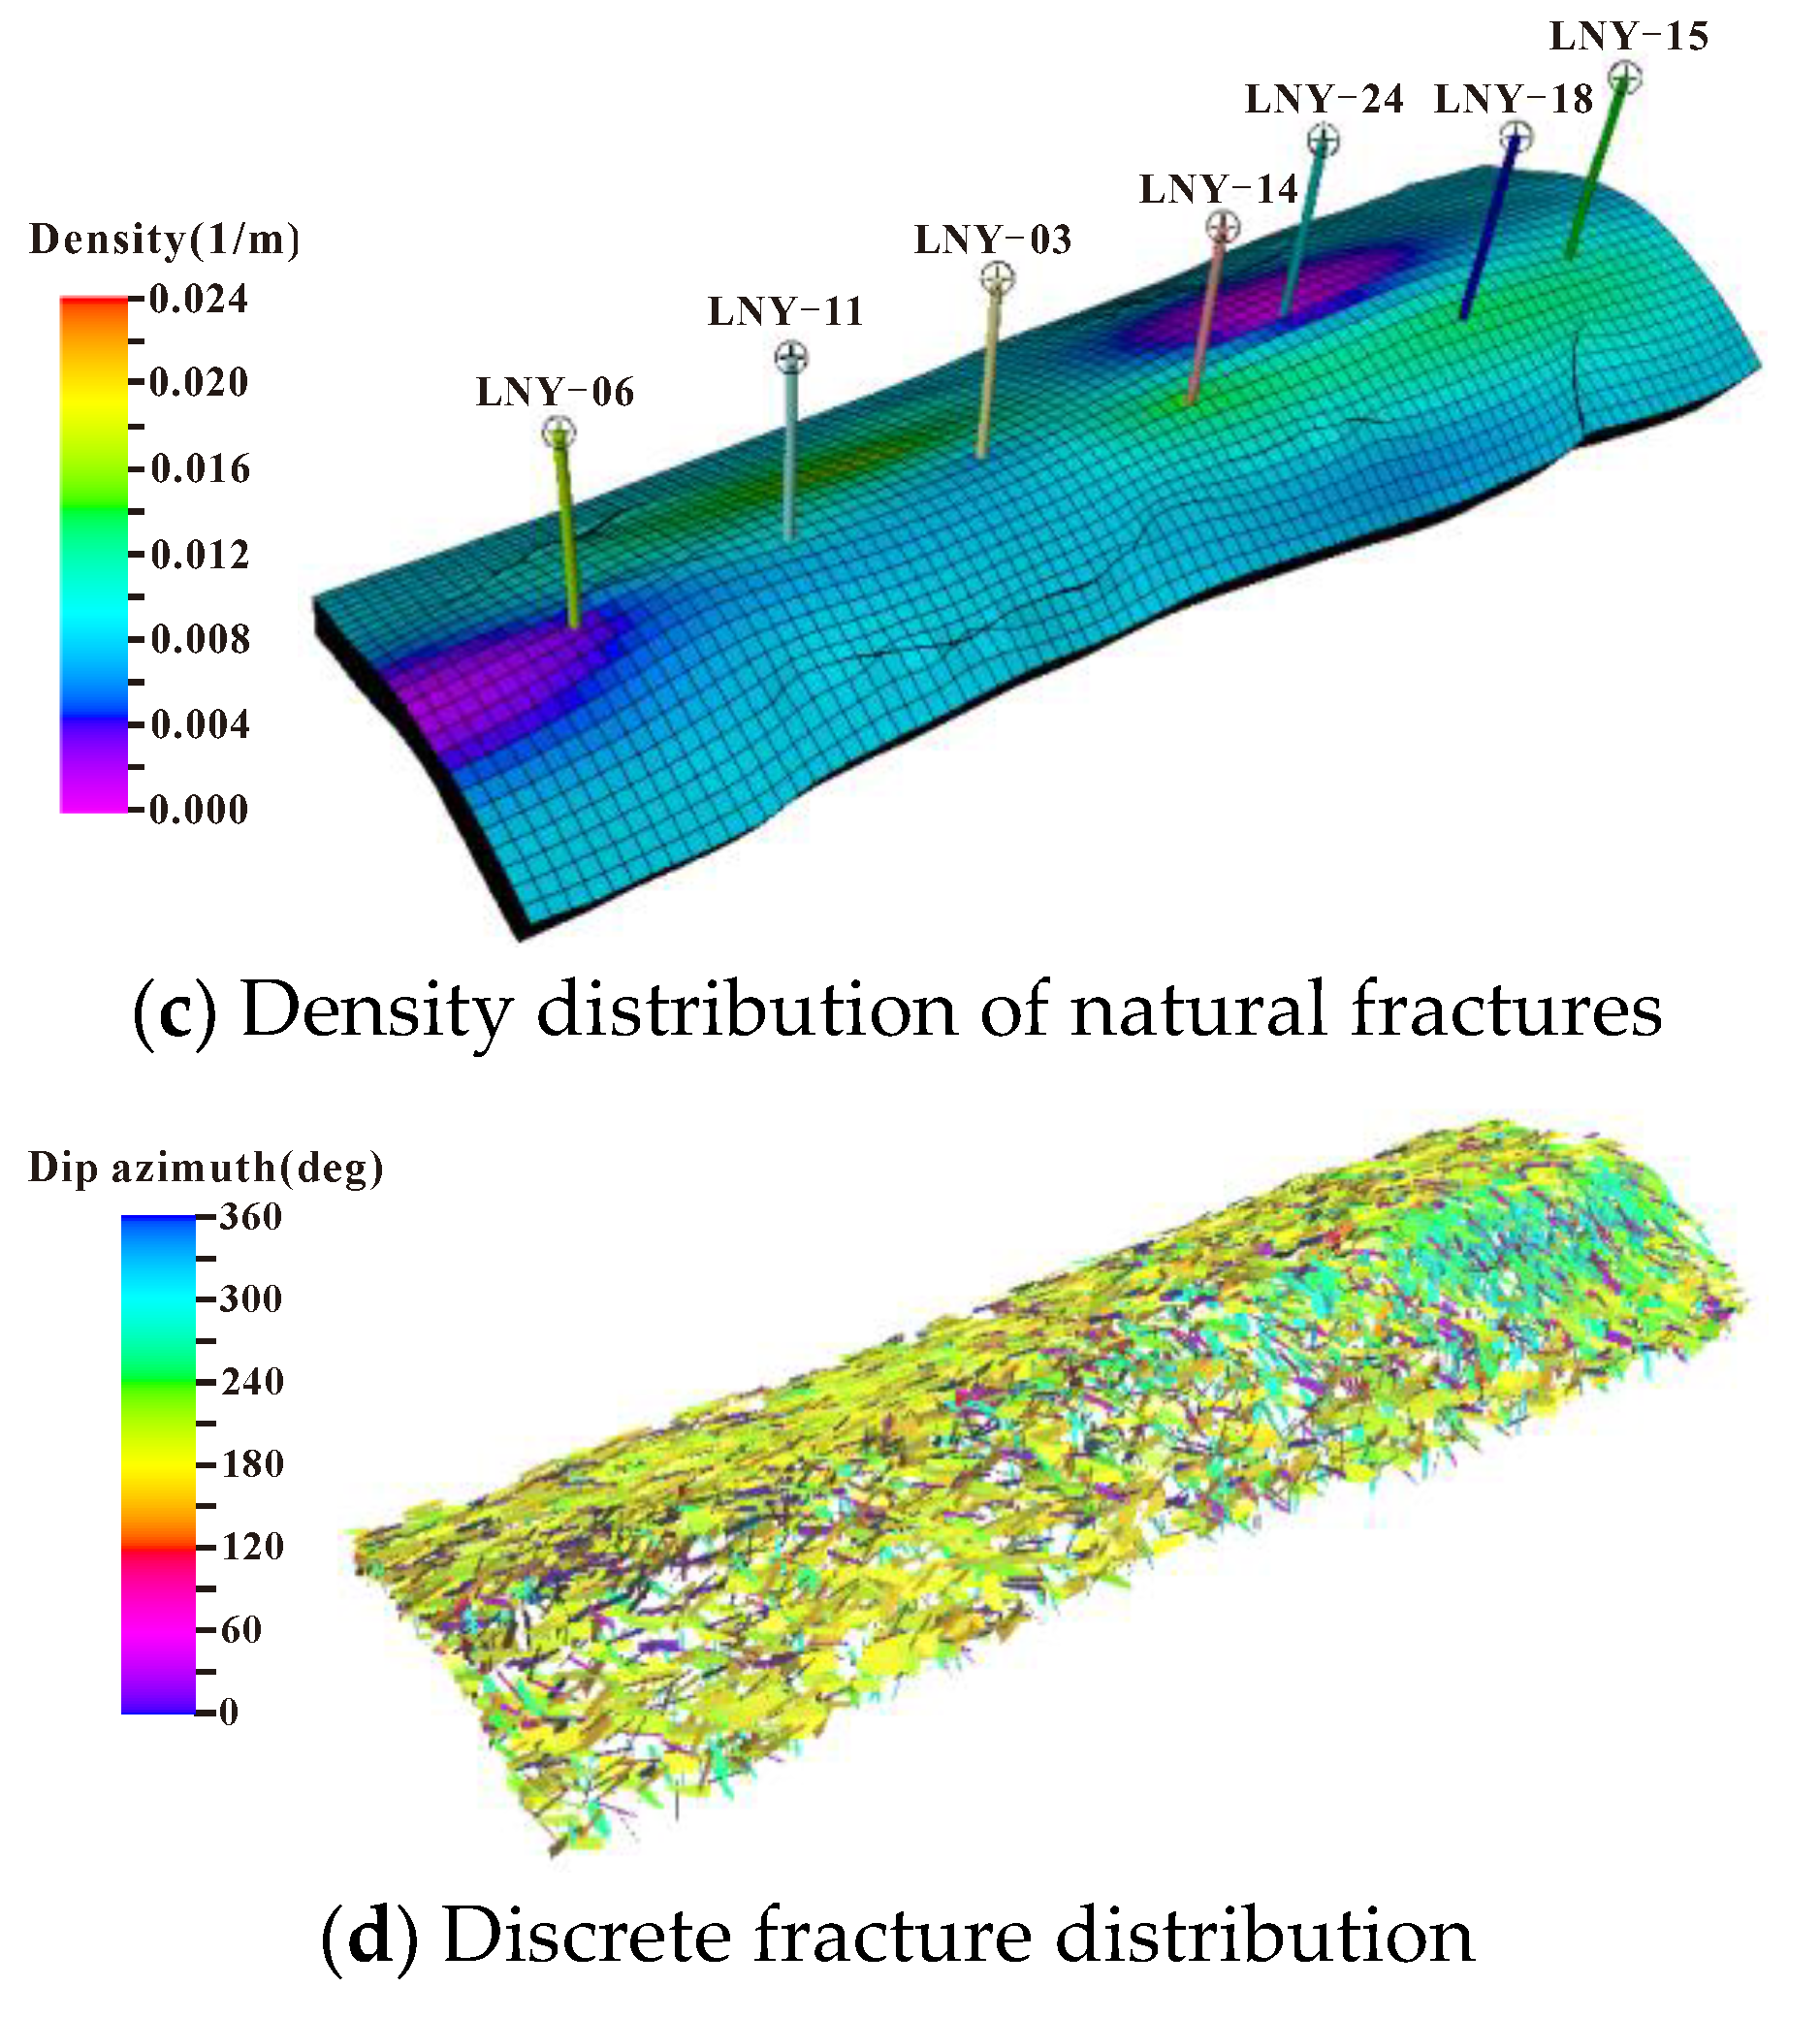
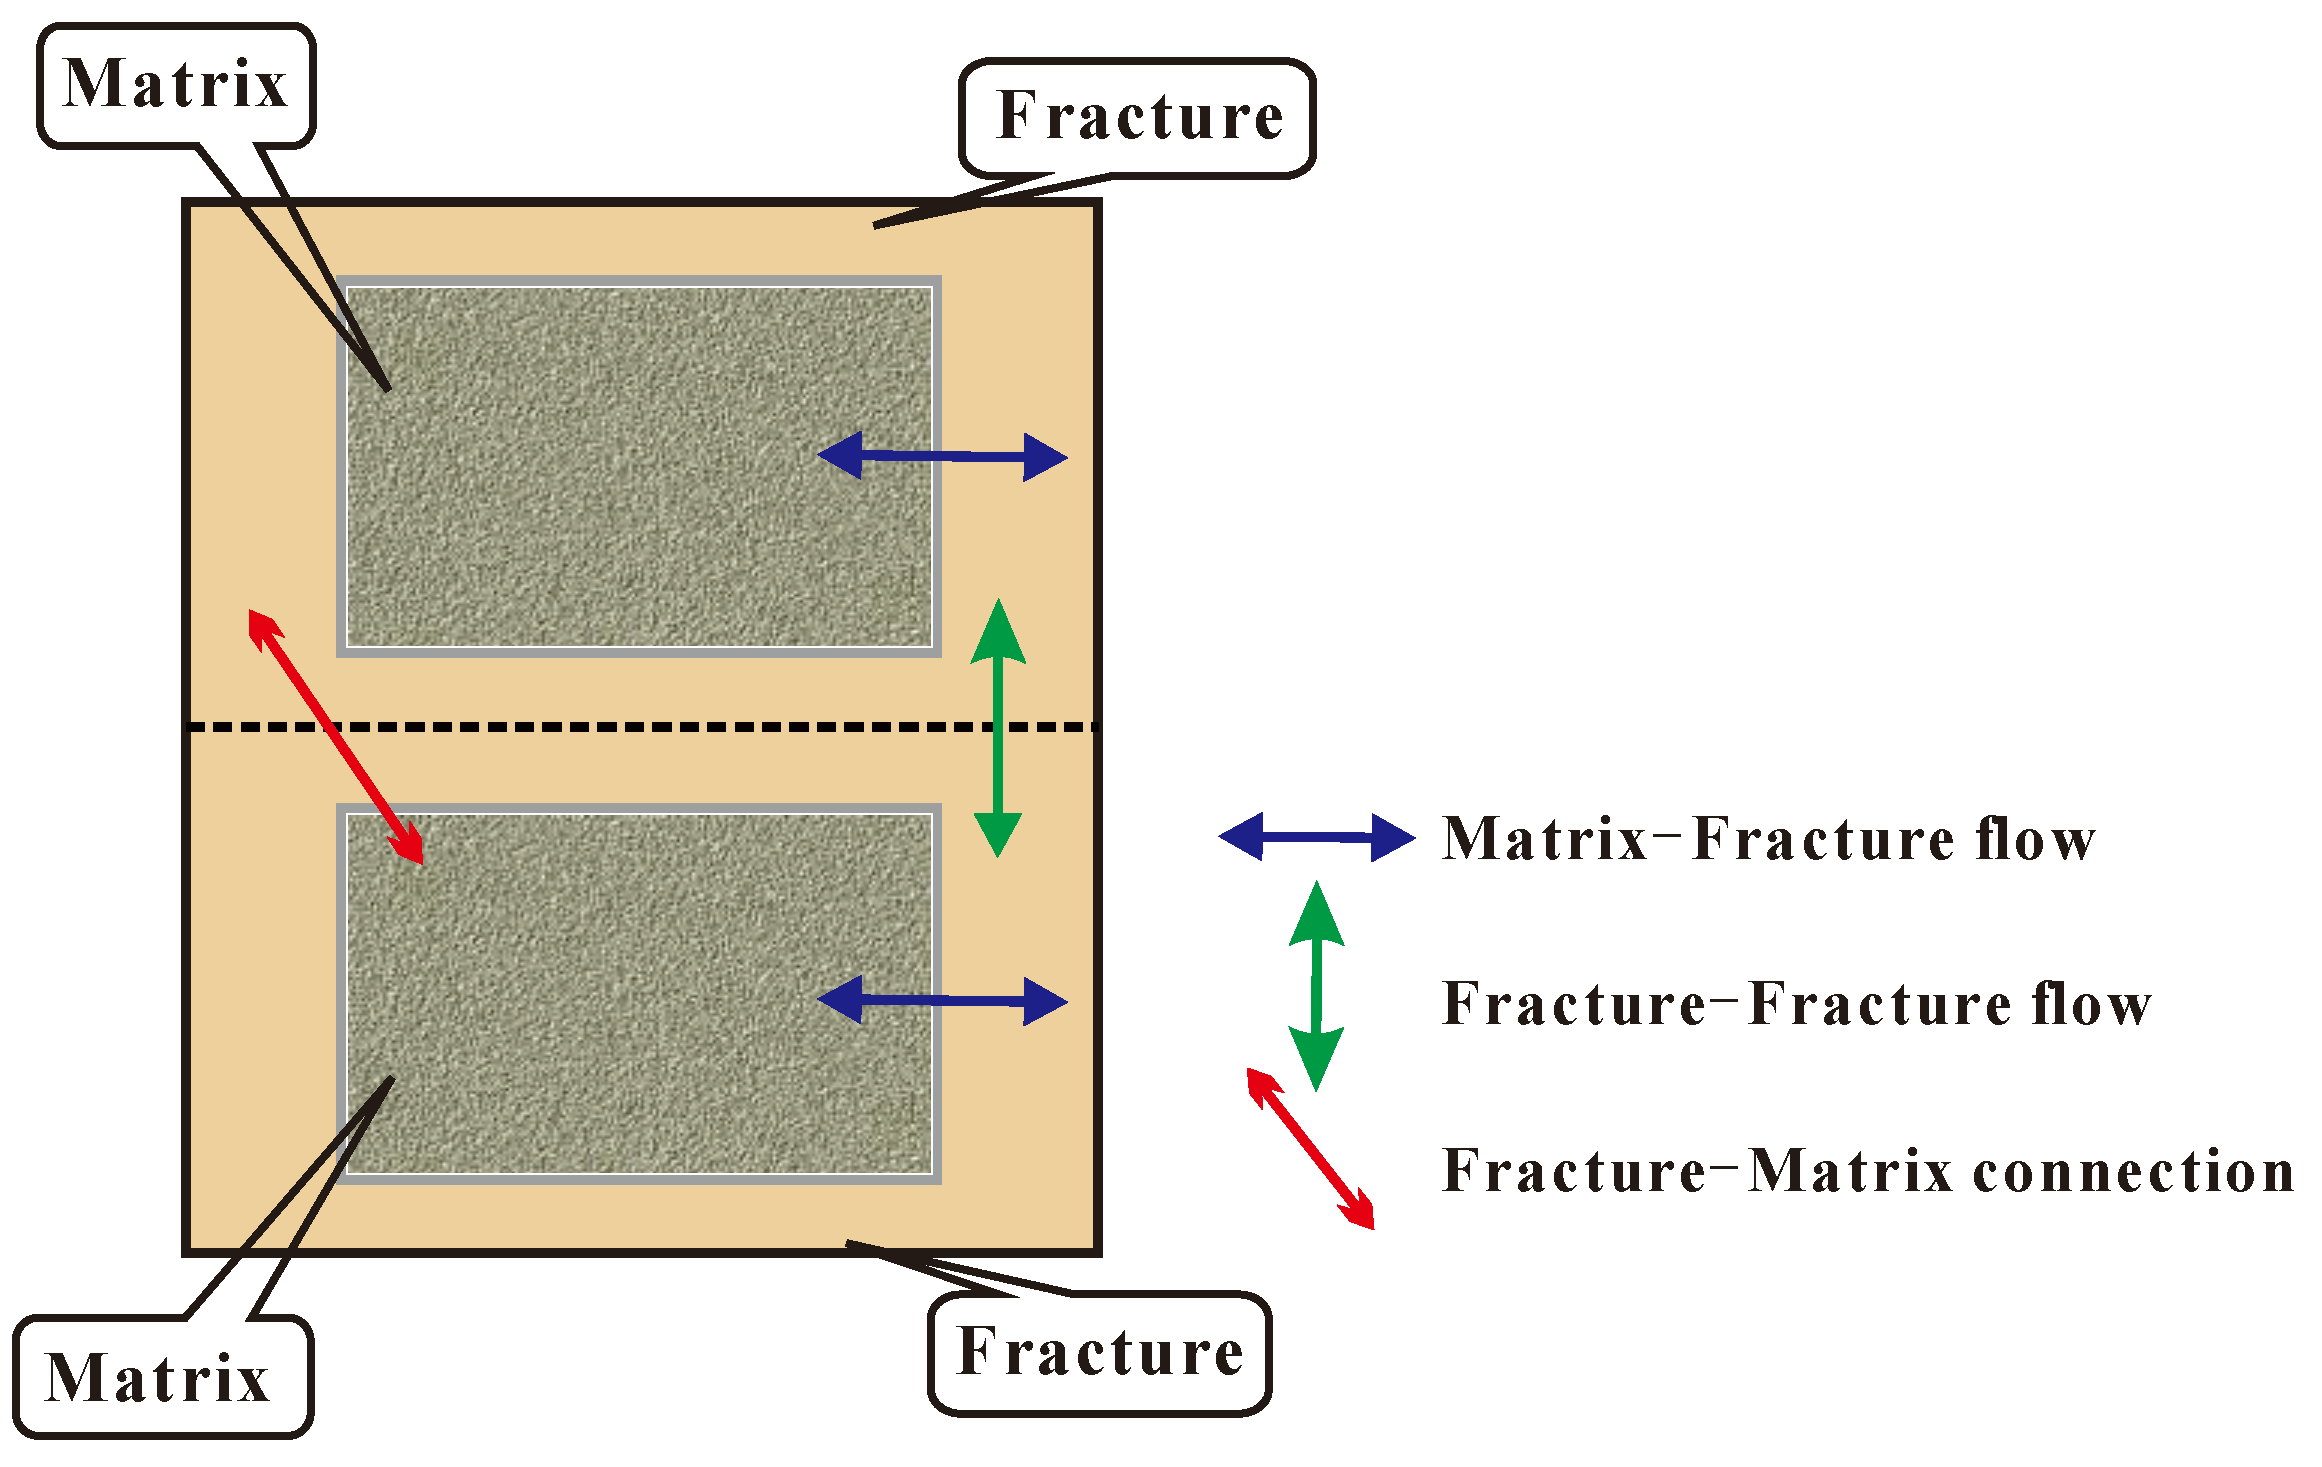
The target formation contains faults and natural fractures, and the distribution of the faults is shown in Figure 7. The faults are mainly E-W strikes with a dip angle of 80°~85°. The natural fractures are mainly near E-W strikes with dip angles of 70°~90°. Combined with the fracture interpretation results of image logging in the target formation, we upscaled and interpolated the dip angle, azimuth and density of natural fractures, and established a discrete fracture model of the reservoirs, as shown in Figure 8. The natural fracture properties were transformed into the geological grid model using the Oda method [36]. The porosity of the natural fractures was calculated to be about 0.00005%~0.0002% andthe three-dimensional permeability was about 0.1~50 mD. The dual pore-permeability model was adopted in the numerical simulation. Figure 9 shows the form of conduction between the fracture grid and matrix grid. Each matrix grid corresponds to a fracture grid. The fluid flow and the energy transfer can be achieved between the matrix grid and its corresponding fracture grid, and also its adjacent fractures.
The change in stress during the development of the gas reservoirs was simulated, without considering the influence of temperature change and capillary force. The target formation is a high-temperature and high-pressure gas reservoir; the initial formation pressure gradient is about 1.8 MPa/100 m, and the converted reservoir pore pressure is about 120 MPa~123 MPa. The water production is small and can be considered as no edge and bottom water. The gas-water interface is set at about 7000 m in the simulation, below the main force level. The rest of parameters are shown in Table 2.

3.2.3. Geomechanical Model

The ratio of horizontal to vertical dimensions in the seepage numerical model is too large and the geomechanical simulation is prone to distortion, so it is necessary to set the outward expanding grid around the seepage numerical model. The grid size of the expanded grid is divided by the isometric method, seven grids are expanded in the X-direction and Y-direction, and six grids are expanded in vertical direction. The grid of the geomechanical model is 100 × 40 × 62, as shown in Figure 10. Based on the mechanical experimental results and logging interpretation data, the geomechanical properties of the model were estimated and set, including Young’s modulus, Poisson’s ratio, density, porosity, compressive strength, tensile strength, friction angle and cohesion force, as shown in Table 3. The control condition of the numerical simulation model is set to constant flow to compare the effect of permeability stress-sensitivity on gas reservoir development.

4. Simulation Results and Discussion

Redefining model coordinates to facilitative analysis, the coordinate system is established with the southwest corner point of the model as the coordinate origin, the east-west direction as the X-axis and the north-south direction as the Y-axis. Numerical simulations were performed for 2090 days on seven wells (LNY-06, LNY-11, LNY-03, LNY-14, LNY-24, LNY-18 and LNY-15) based on the coupled seepage-geomechanical model. From the results of the numerical simulations, the seepage characteristics, stress variation, permeability stress-sensitivity evolution law and productivity of the target formation were analyzed.

4.1. Evolution Results of Seepage-Geomechanical Field

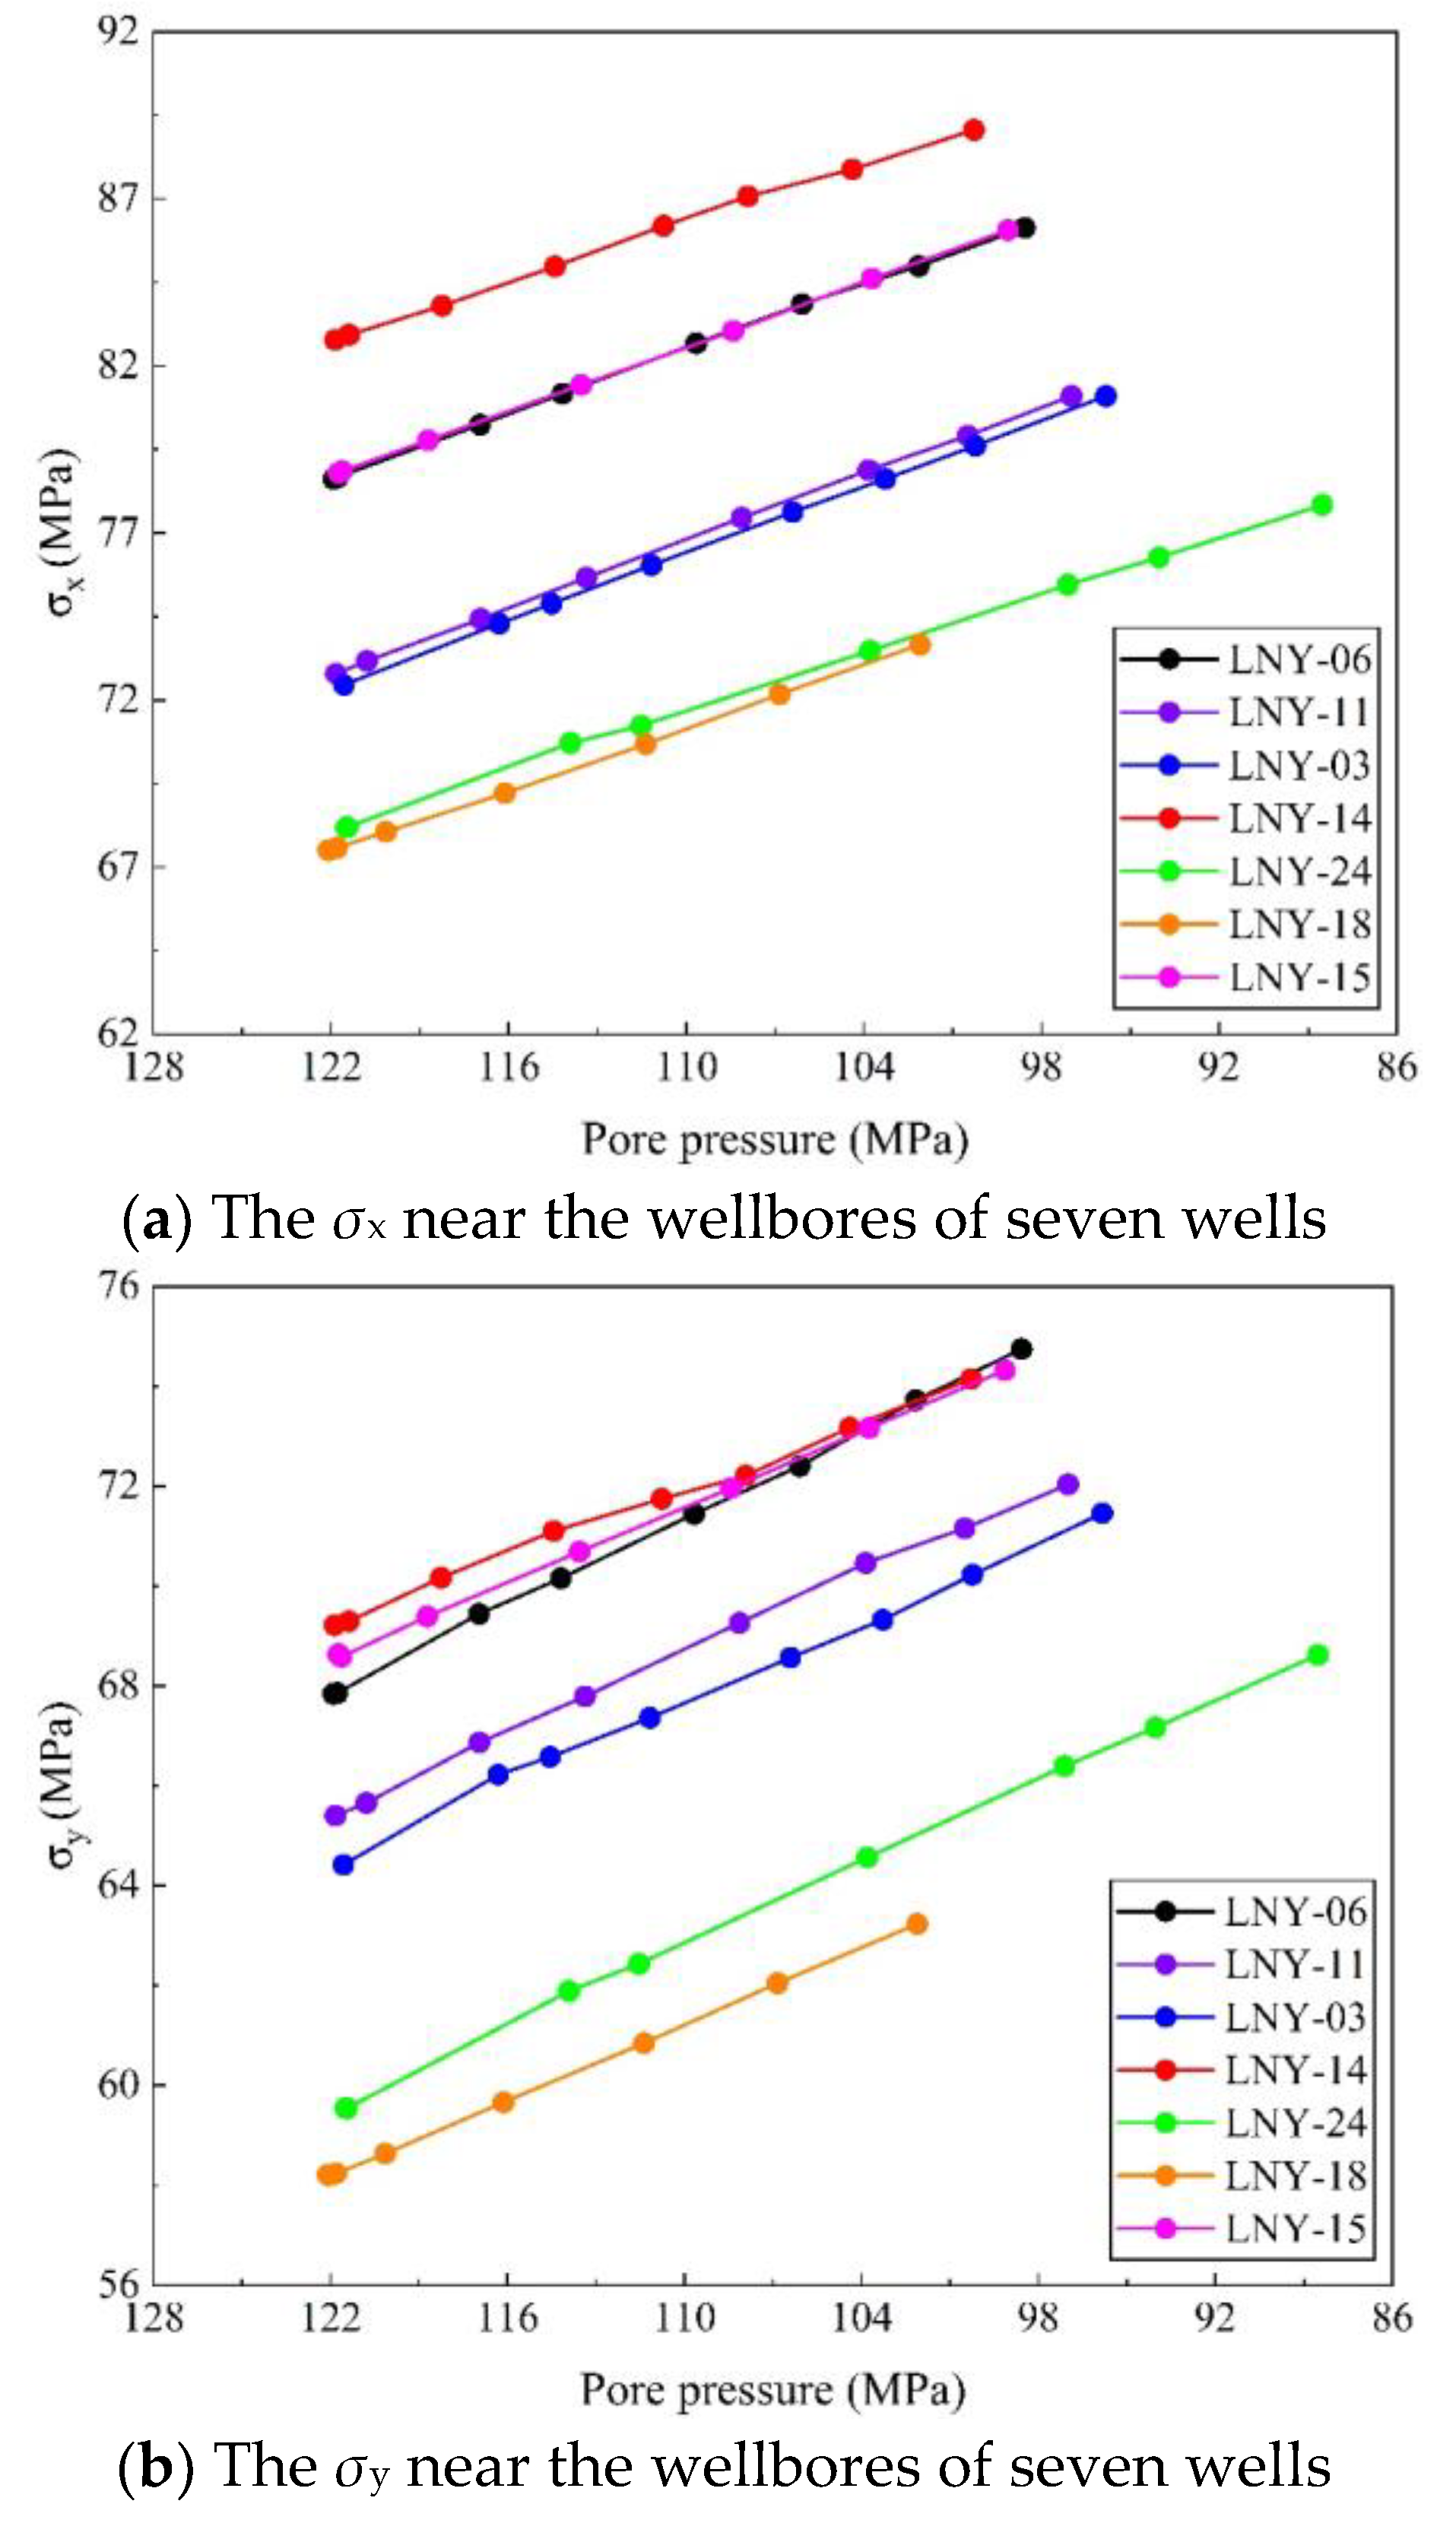
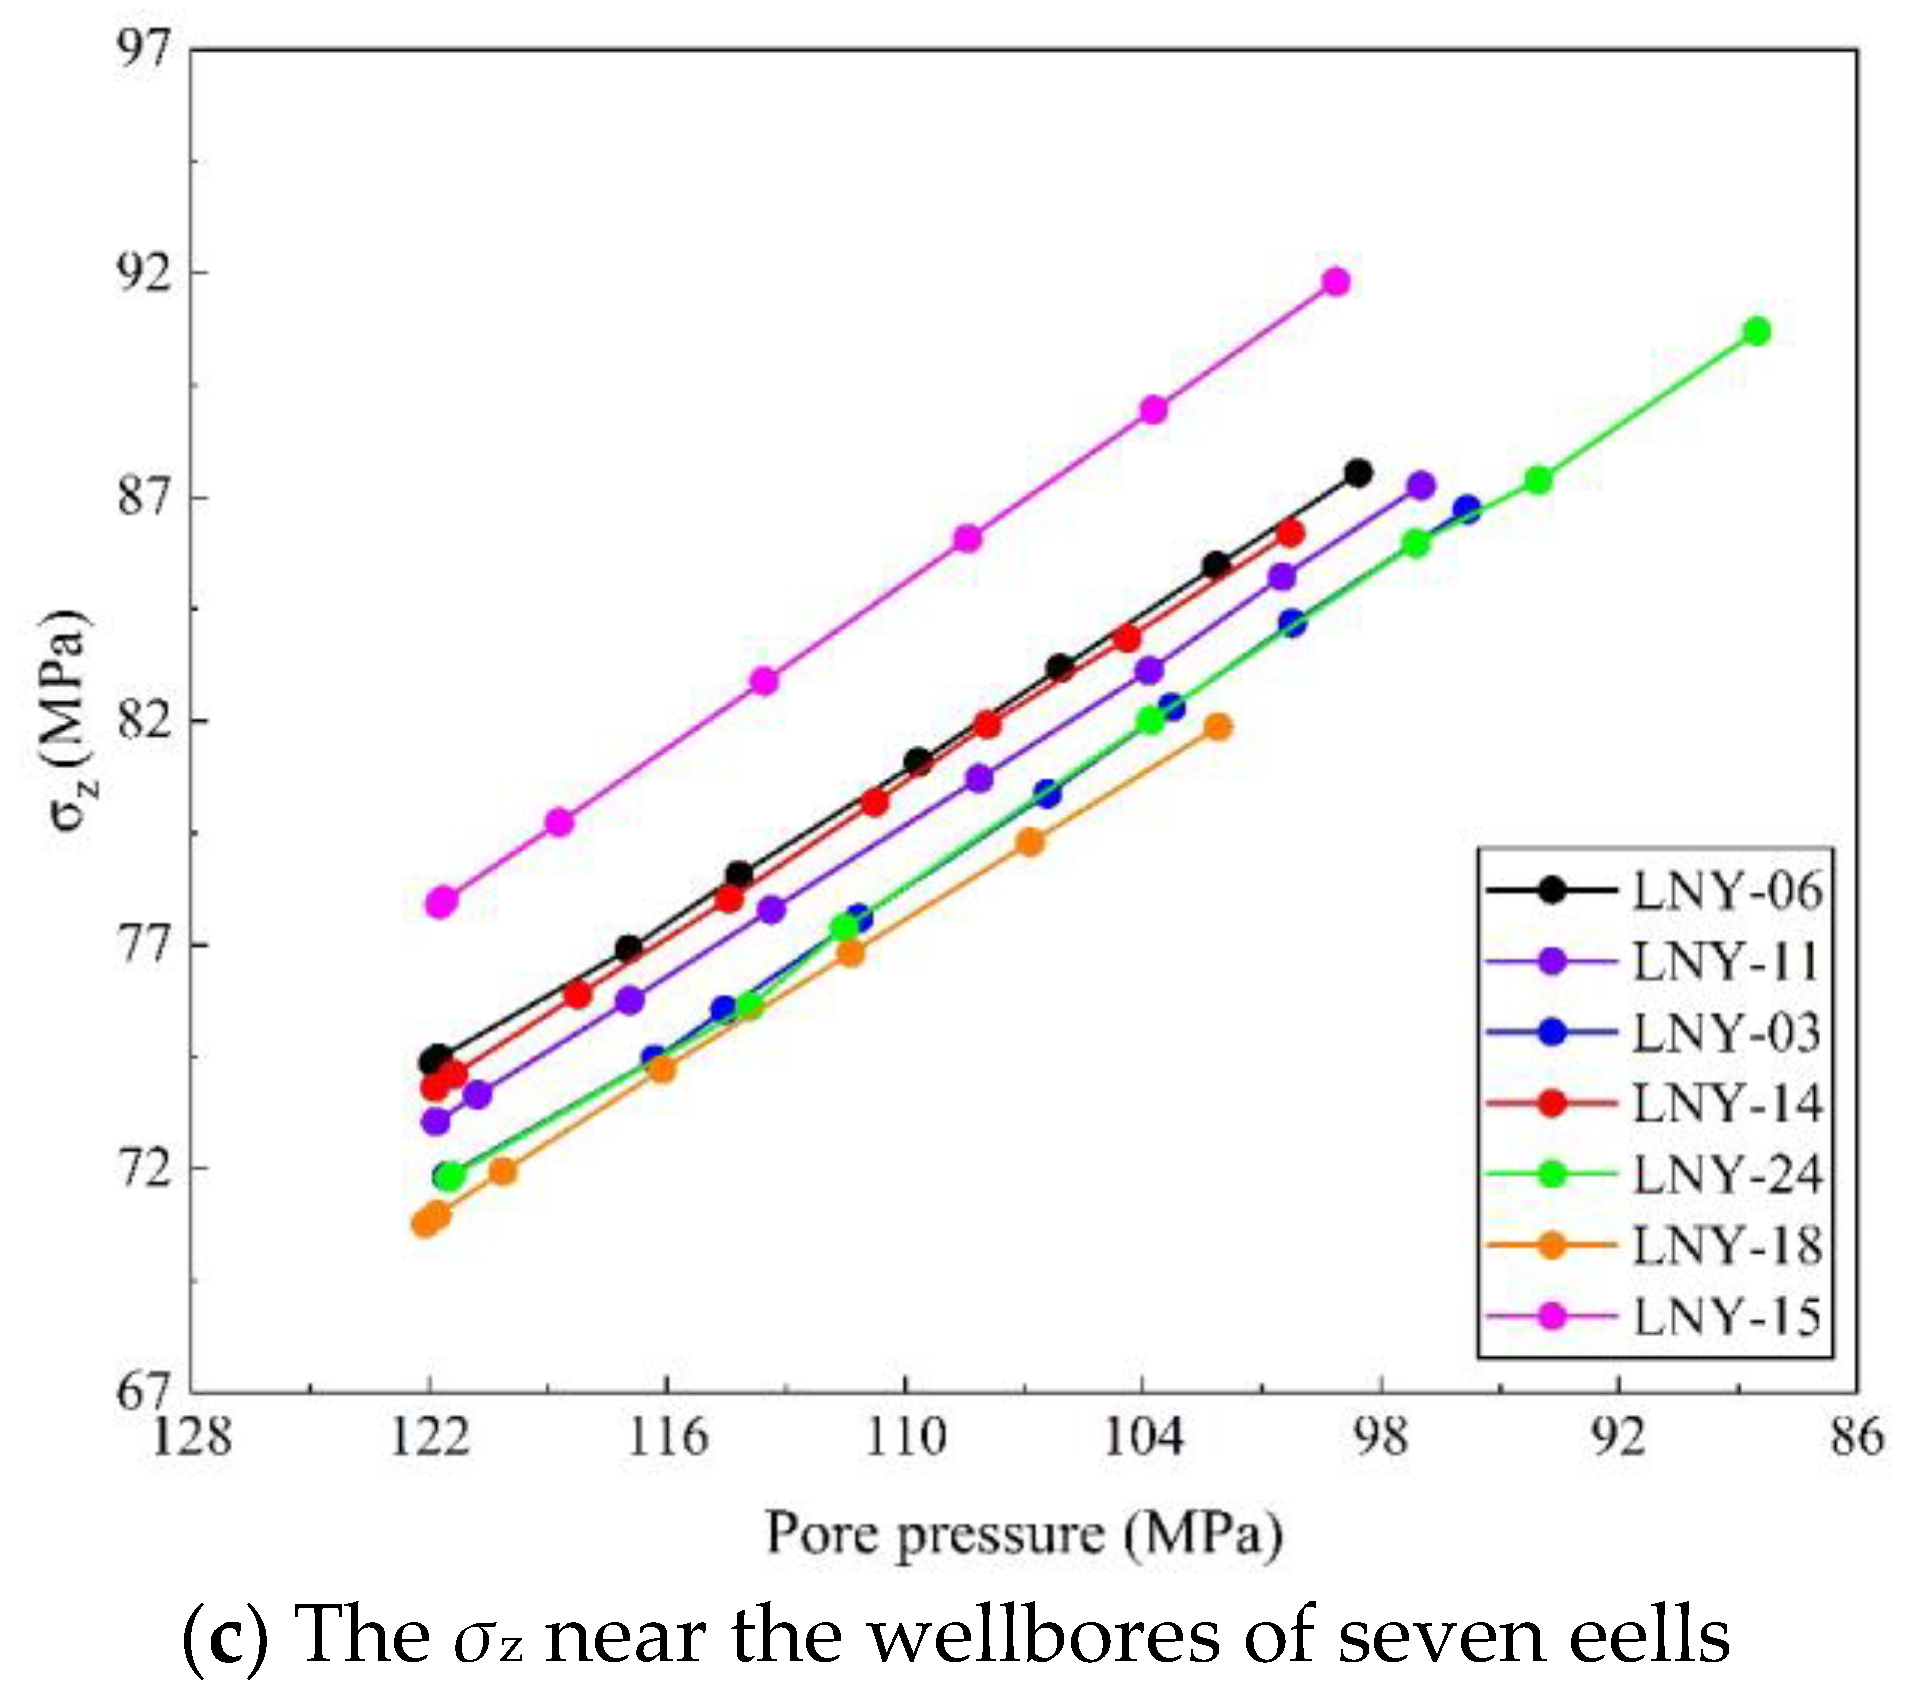
The change in reservoir pore pressure will cause a change in effective stress and the deformation of reservoir rock [37]. The stress condition around the well plays a key role in wellbore stability during development [38]. Figure 11 illustrates the relationship between the pore pressure near the wellbore and the three-dimensional effective stress. The initial pore pressure of the formation is about 120–125 MPa, which gradually decreases as the development time increases. The pore pressure near the wellbore decreases to 85–100 MPa by the end of the simulation, which is essentially the same as the bottom hole pressure. The change rule of effective stress is opposite to that of pore pressure. The three-dimensional effective stress increases, among which the effective stress in the X-direction (σx) increases by 5~10 MPa, the effective stress in the Y-direction (σy) increases by 4~9 MPa and the effective stress in the vertical direction (σz) increases by 11~19 MPa. The difference in three-dimensional effective stress evolution is mainly caused by the difference in reservoir depth, rock mechanical parameters and pore-permeability parameters.
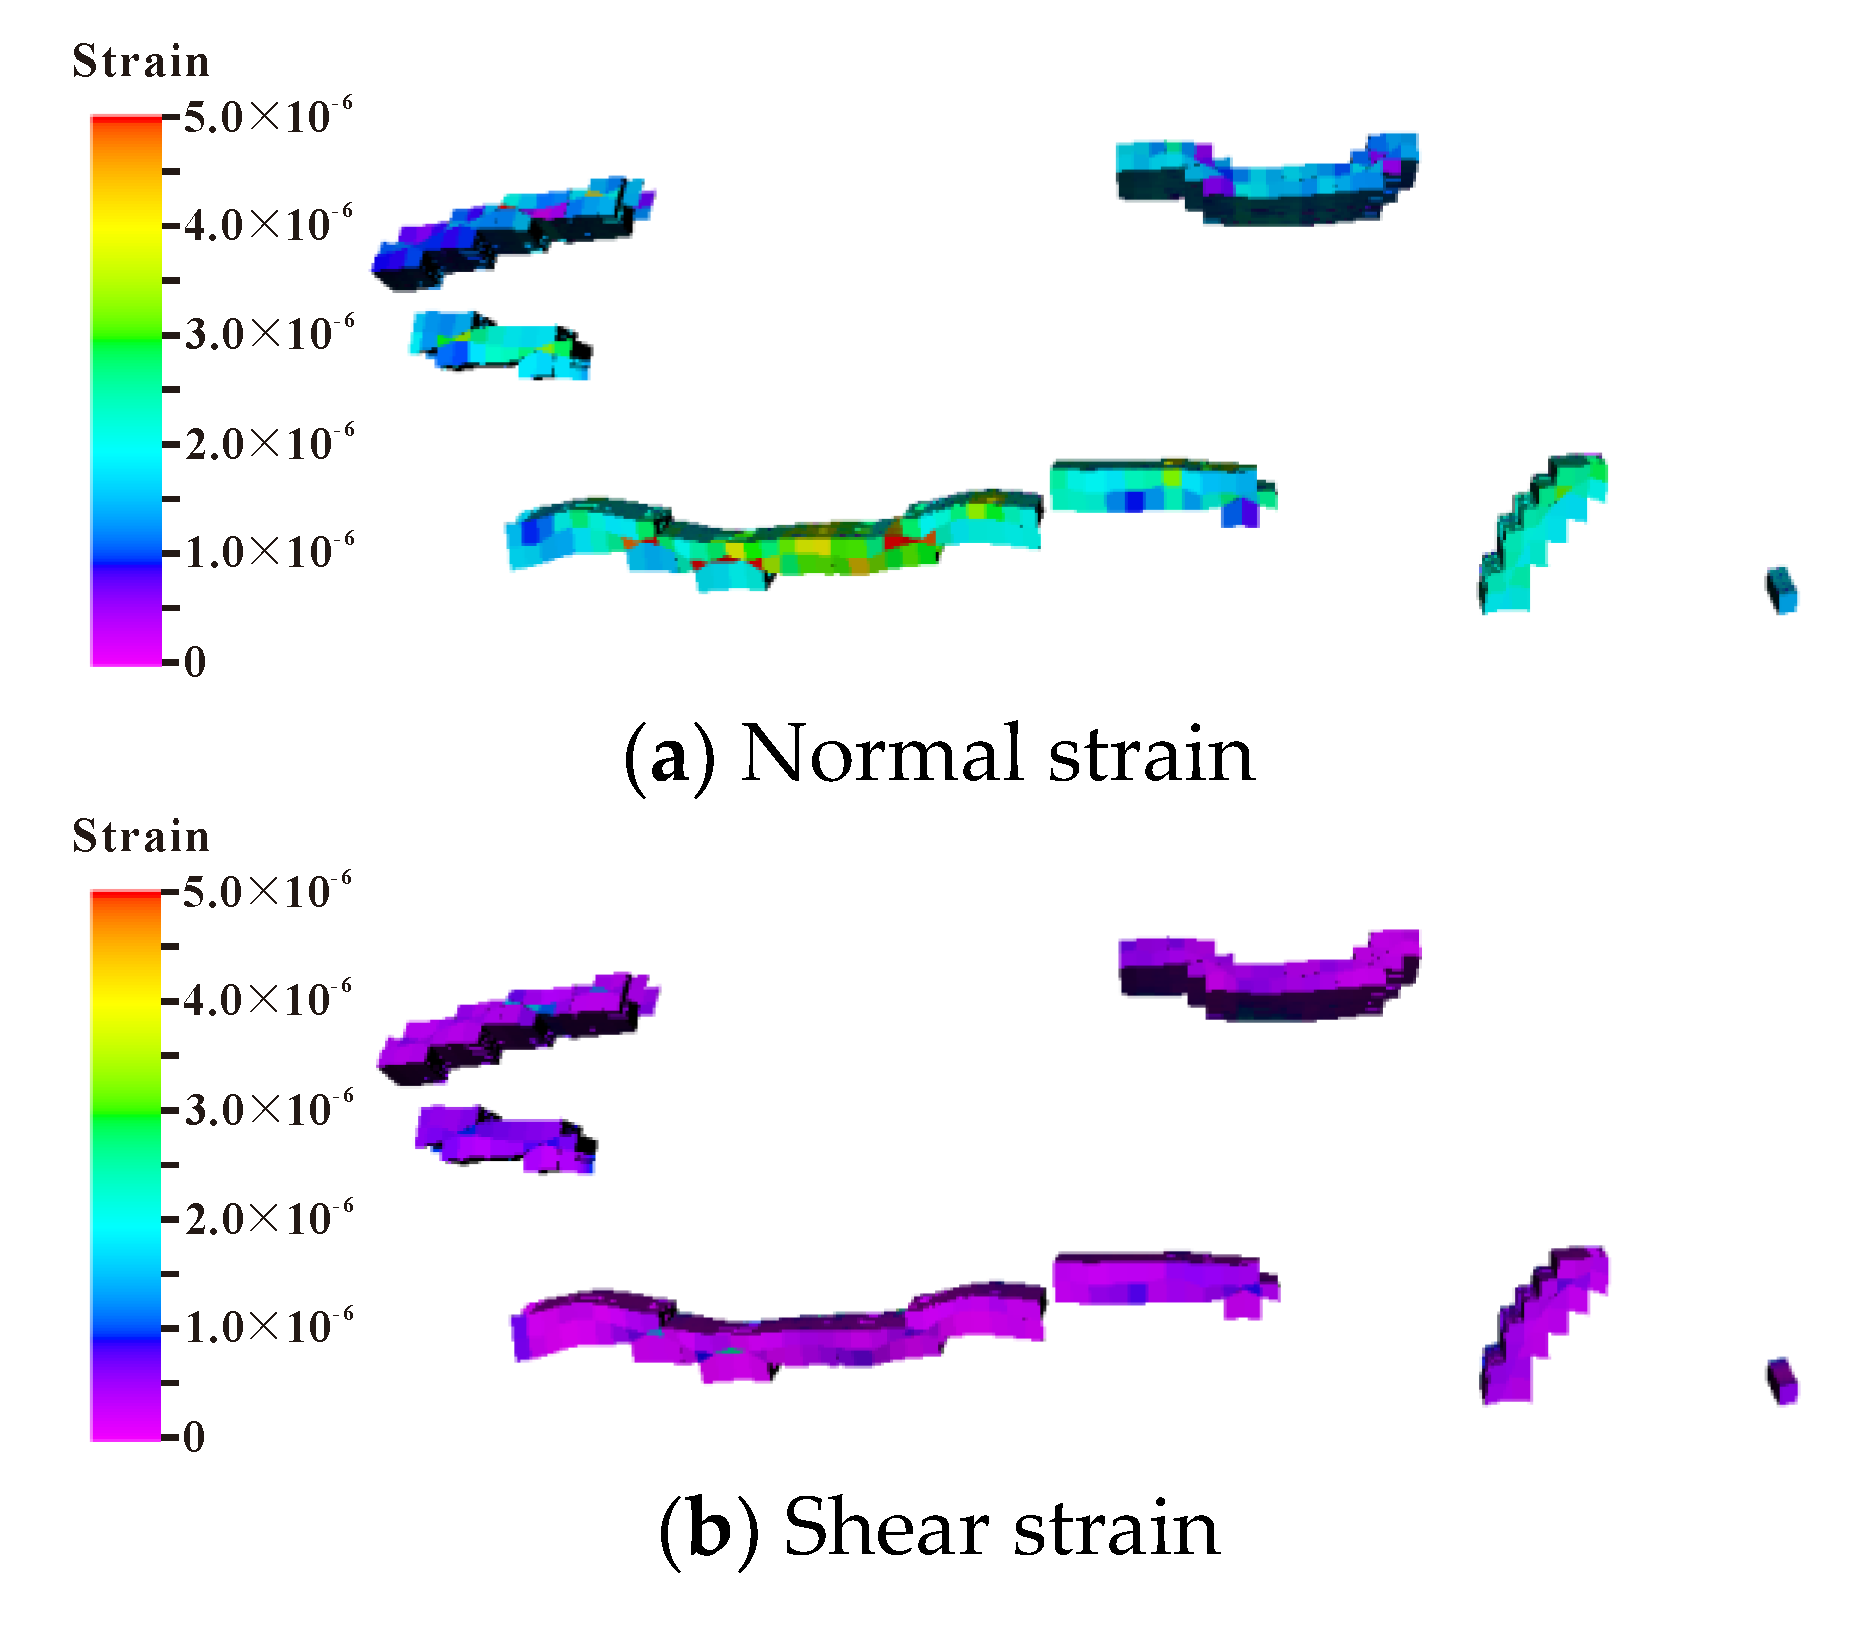
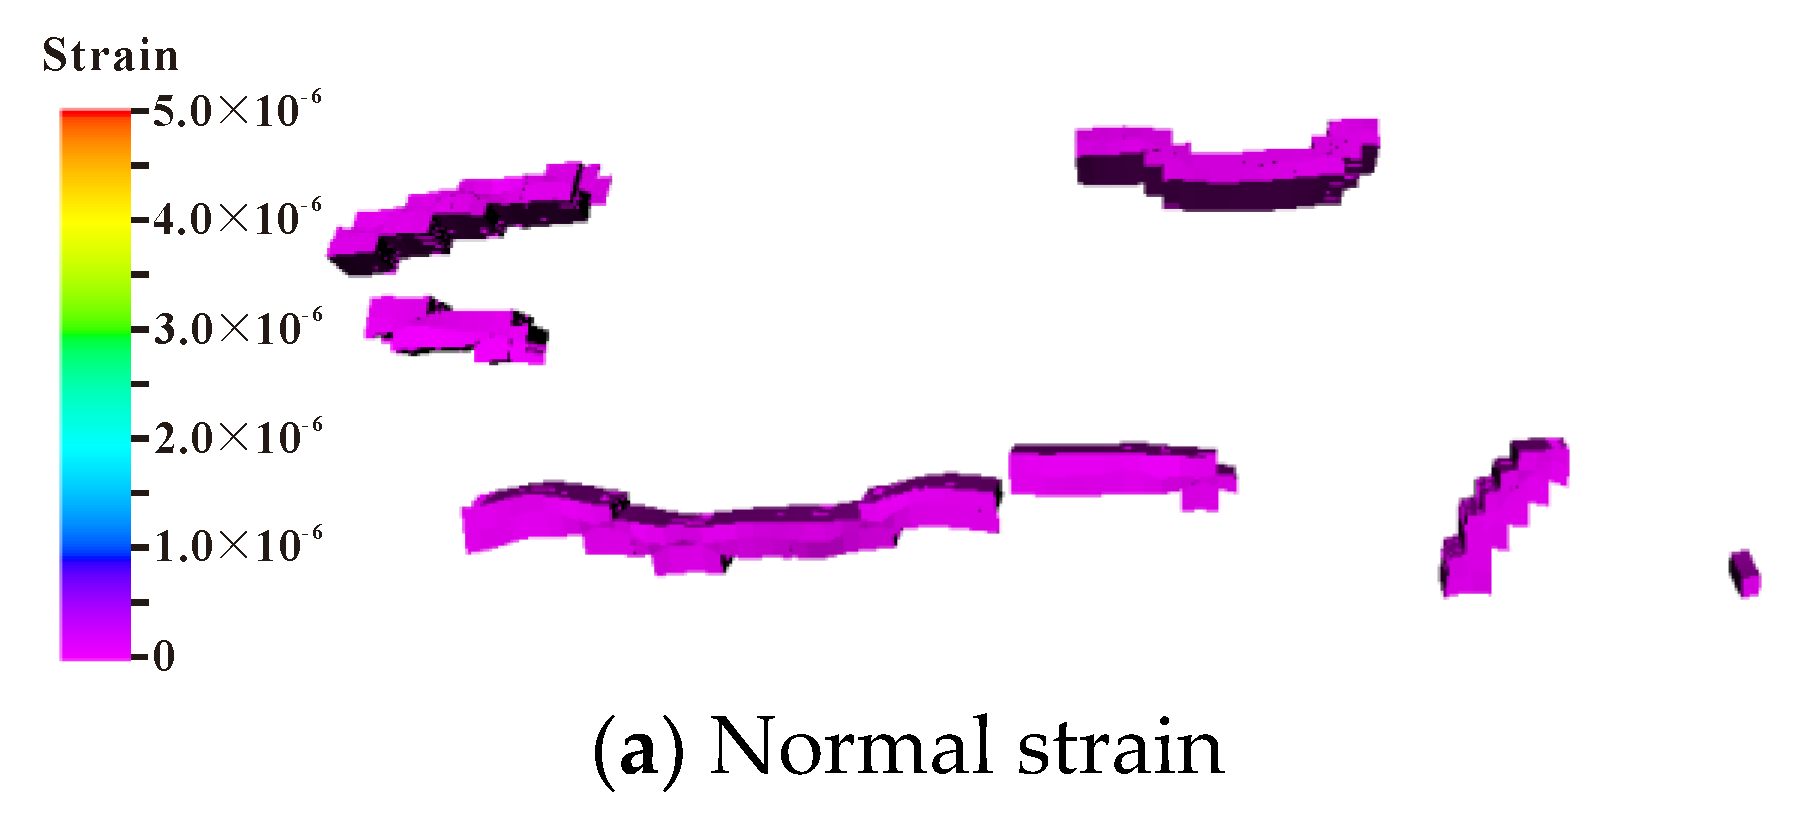
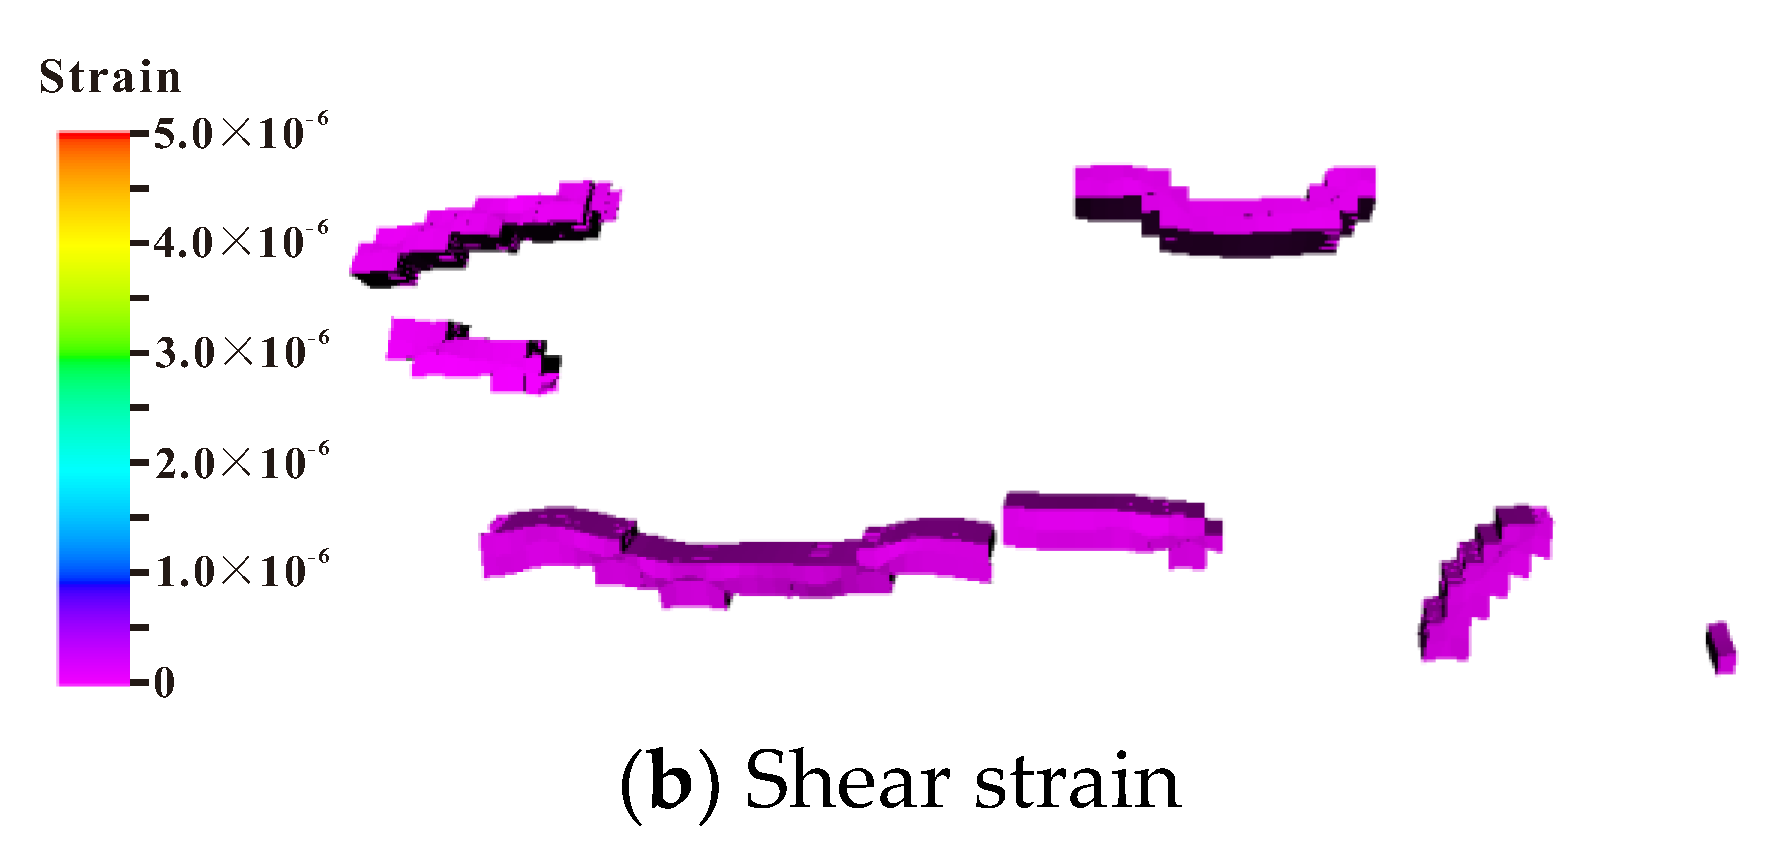
The deformation of natural fractures and faults during the development was simulated. The initial conditions of natural fracture and fault deformation variables were both set to zero. After 2090 days of development, the elastic normal strain and elastic shear strain of the faults were about 3.0 × 10⁻⁷~1.0 × 10⁻⁶ and 2.0 × 10⁻⁷~8.0 × 10⁻⁷, respectively, and the shear strain was smaller than the normal strain. The variation in plastic normal and plastic shear strain of the faults was zero, indicating that the fault had not reached the damage slip stage, as shown in Figure 12 and Figure 13. The elastic normal strain and elastic shear strain of the natural fractures were about 1.0 × 10⁻⁷~4.0 × 10⁻⁷ and 2.0 × 10⁻⁸~1.0 × 10⁻⁷, respectively, and the variation of plastic normal and shear strain of the natural fractures was zero, indicating that the natural fractures also did not reach the damage slip stage during the development process, as shown in Figure 14 and Figure 15.

4.2. Analysis of Permeability Stress-Sensitivity Simulation Results

The relationship between permeability and effective stress can reveal the mechanism of permeability stress-sensitivity in gas reservoir depletion development. Figure 16 shows the variation of normalized permeability and average effective stress (σo = (σx + σy + σz)/3) near the wells of LNY-06 and LNY-24 during gas reservoir development. The effective stress near the well increases and the permeability gradually decreases during depletion exploitation, exhibiting a high stress-sensitivity. Meanwhile, the figure shows the three-dimensional permeability of the fracture and matrix, with the greatest decay of permeability in the Z-direction of the fracture and the least decay of permeability in the Y-direction of the matrix.
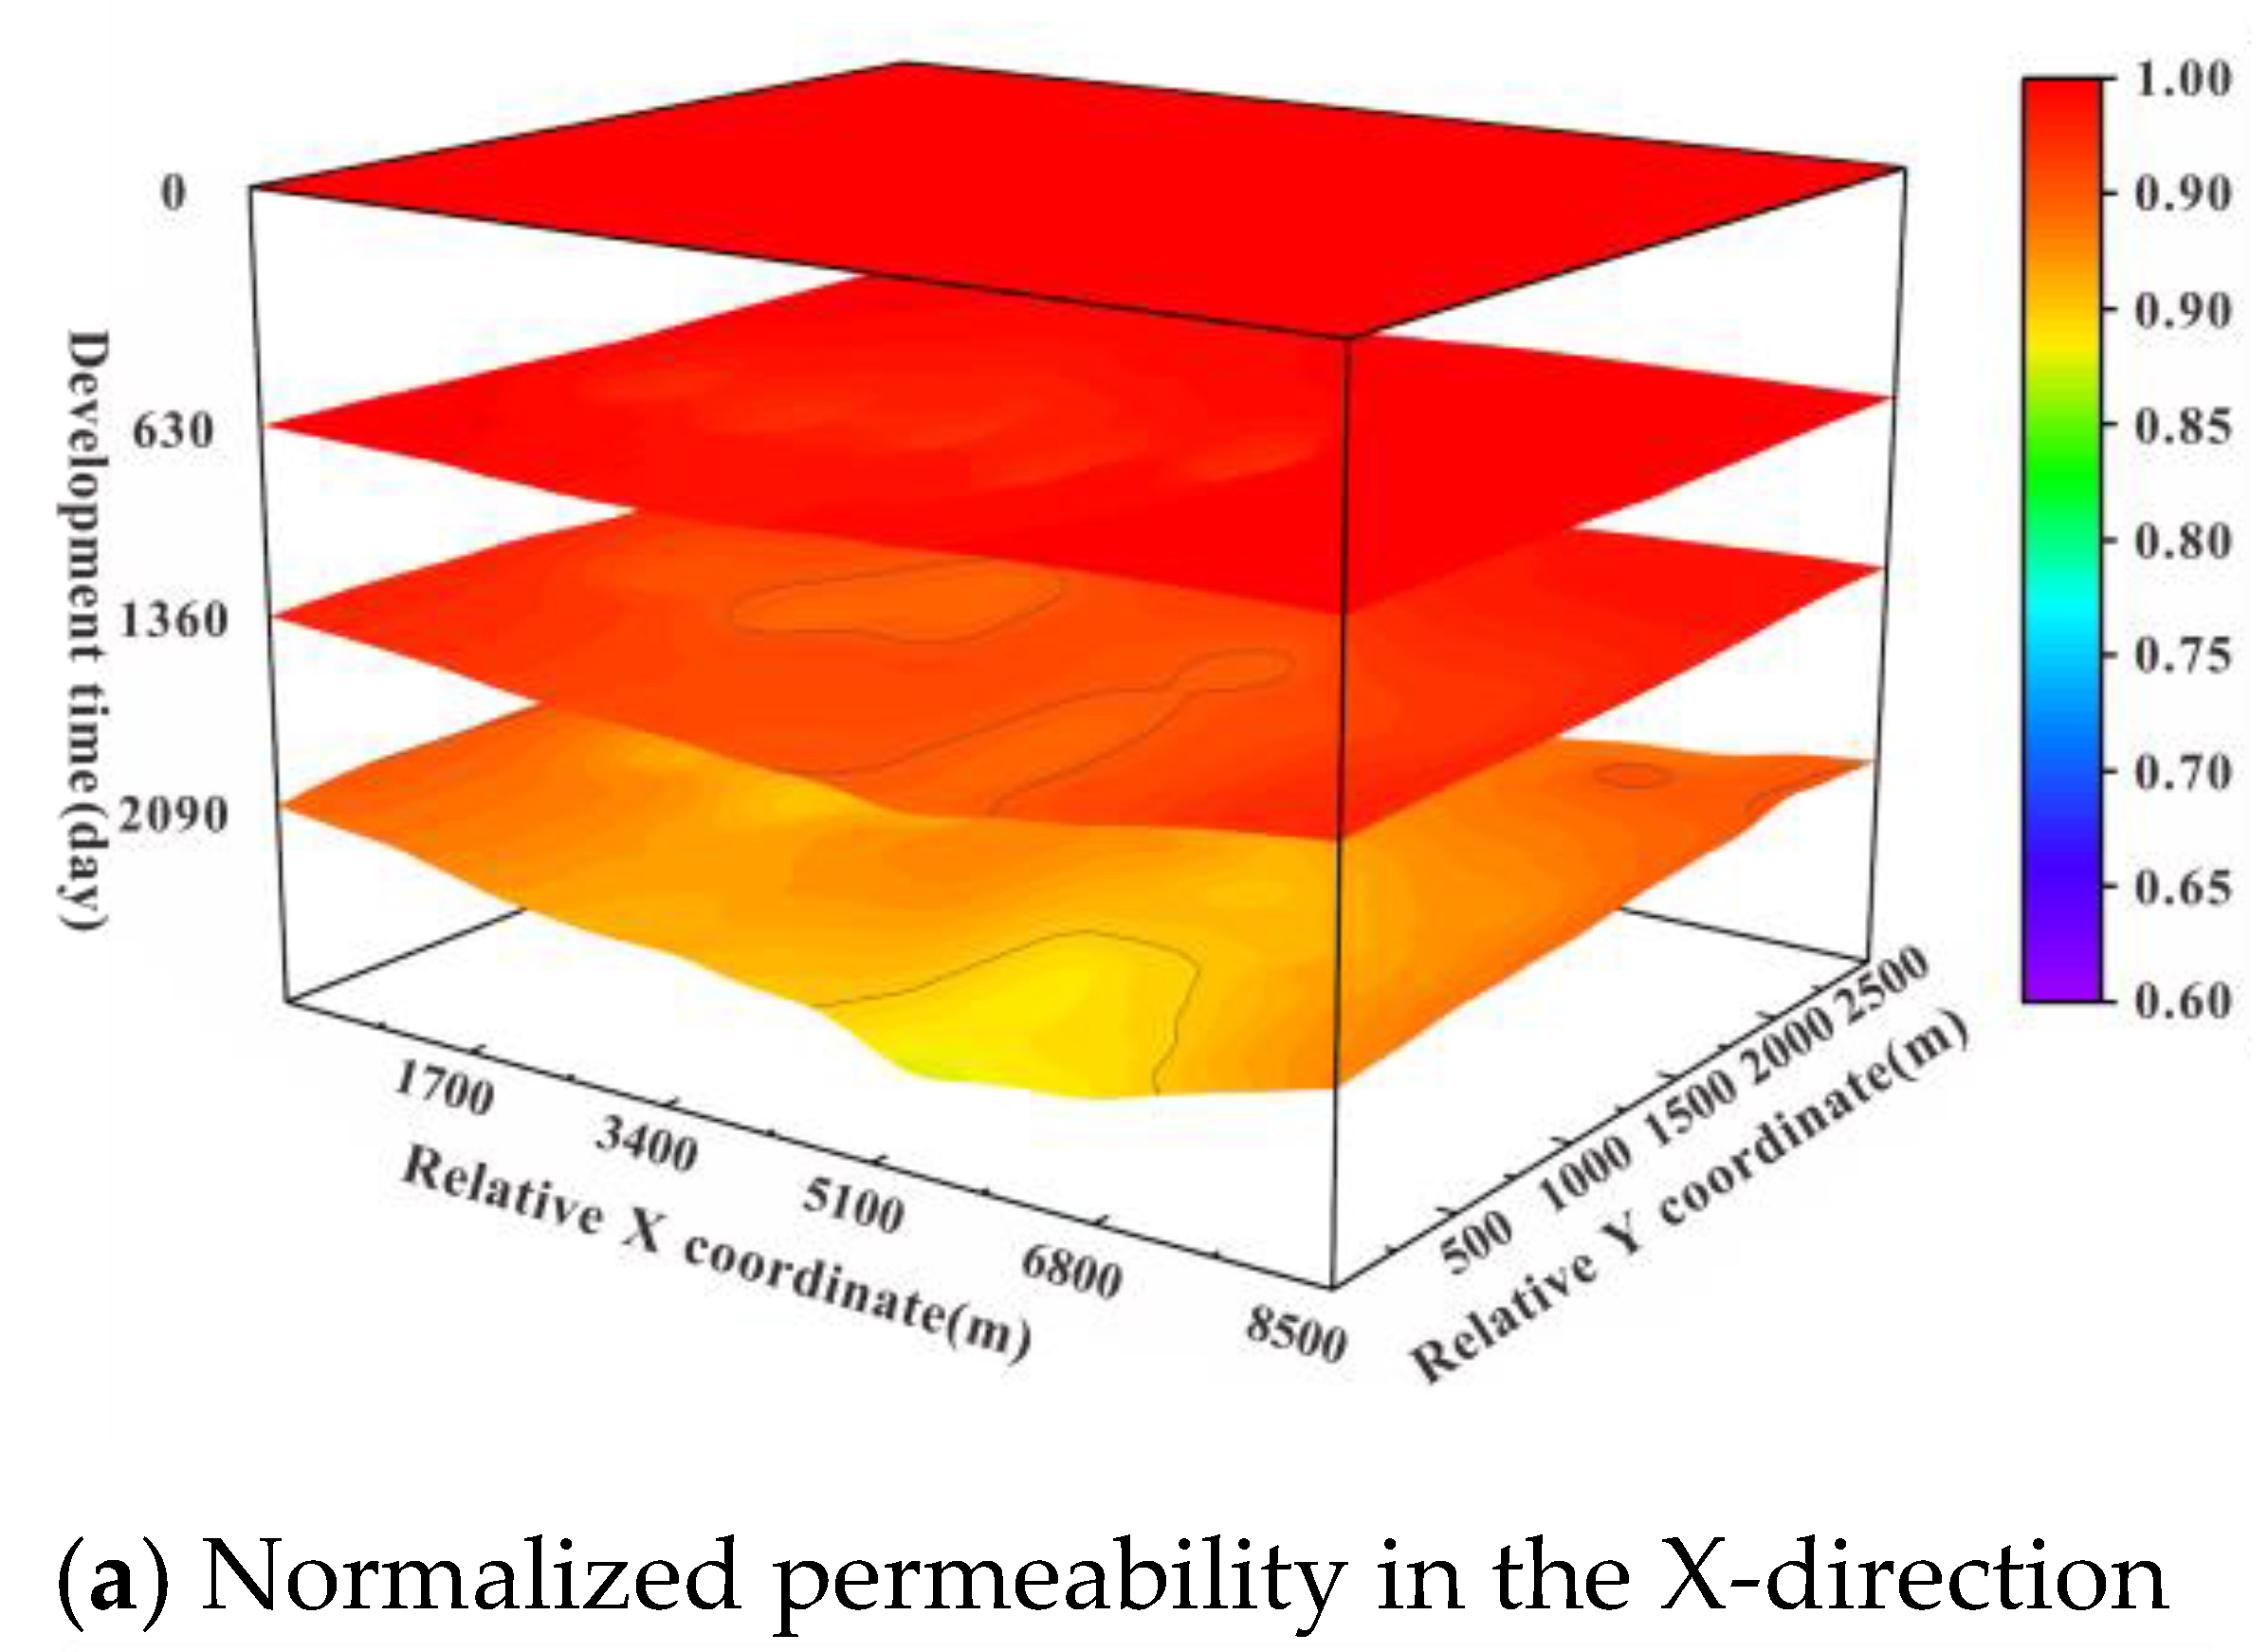
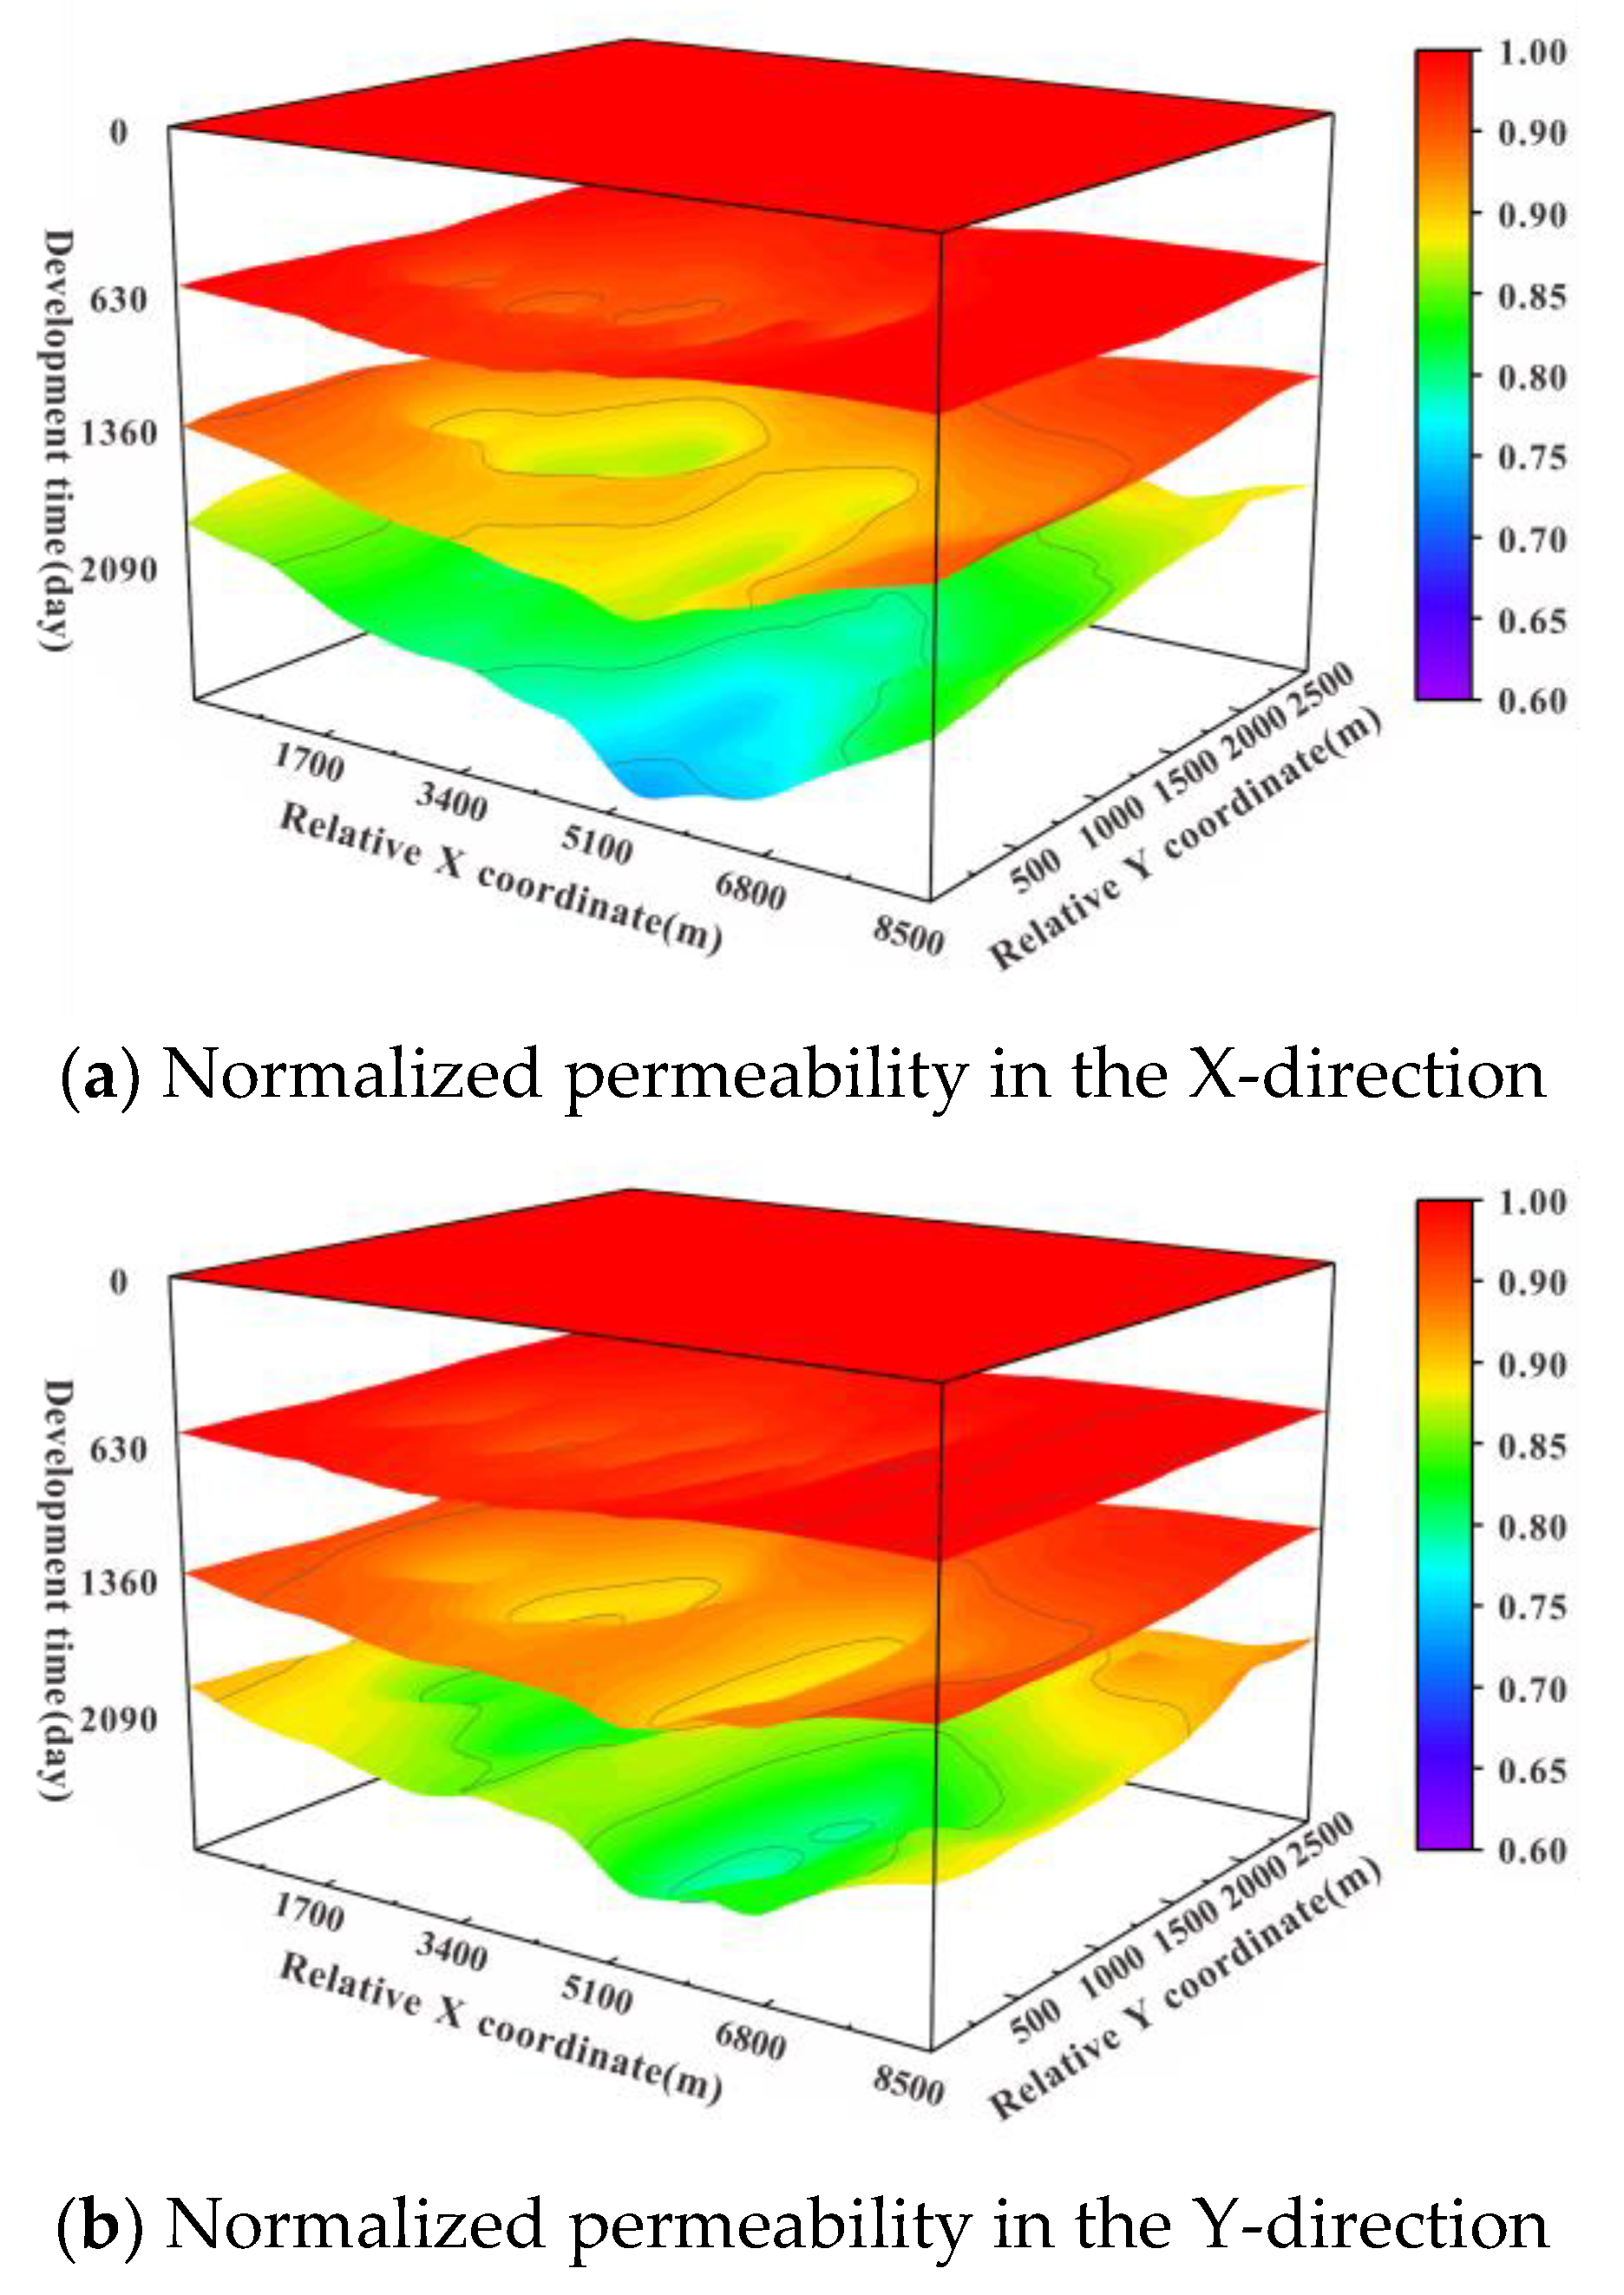
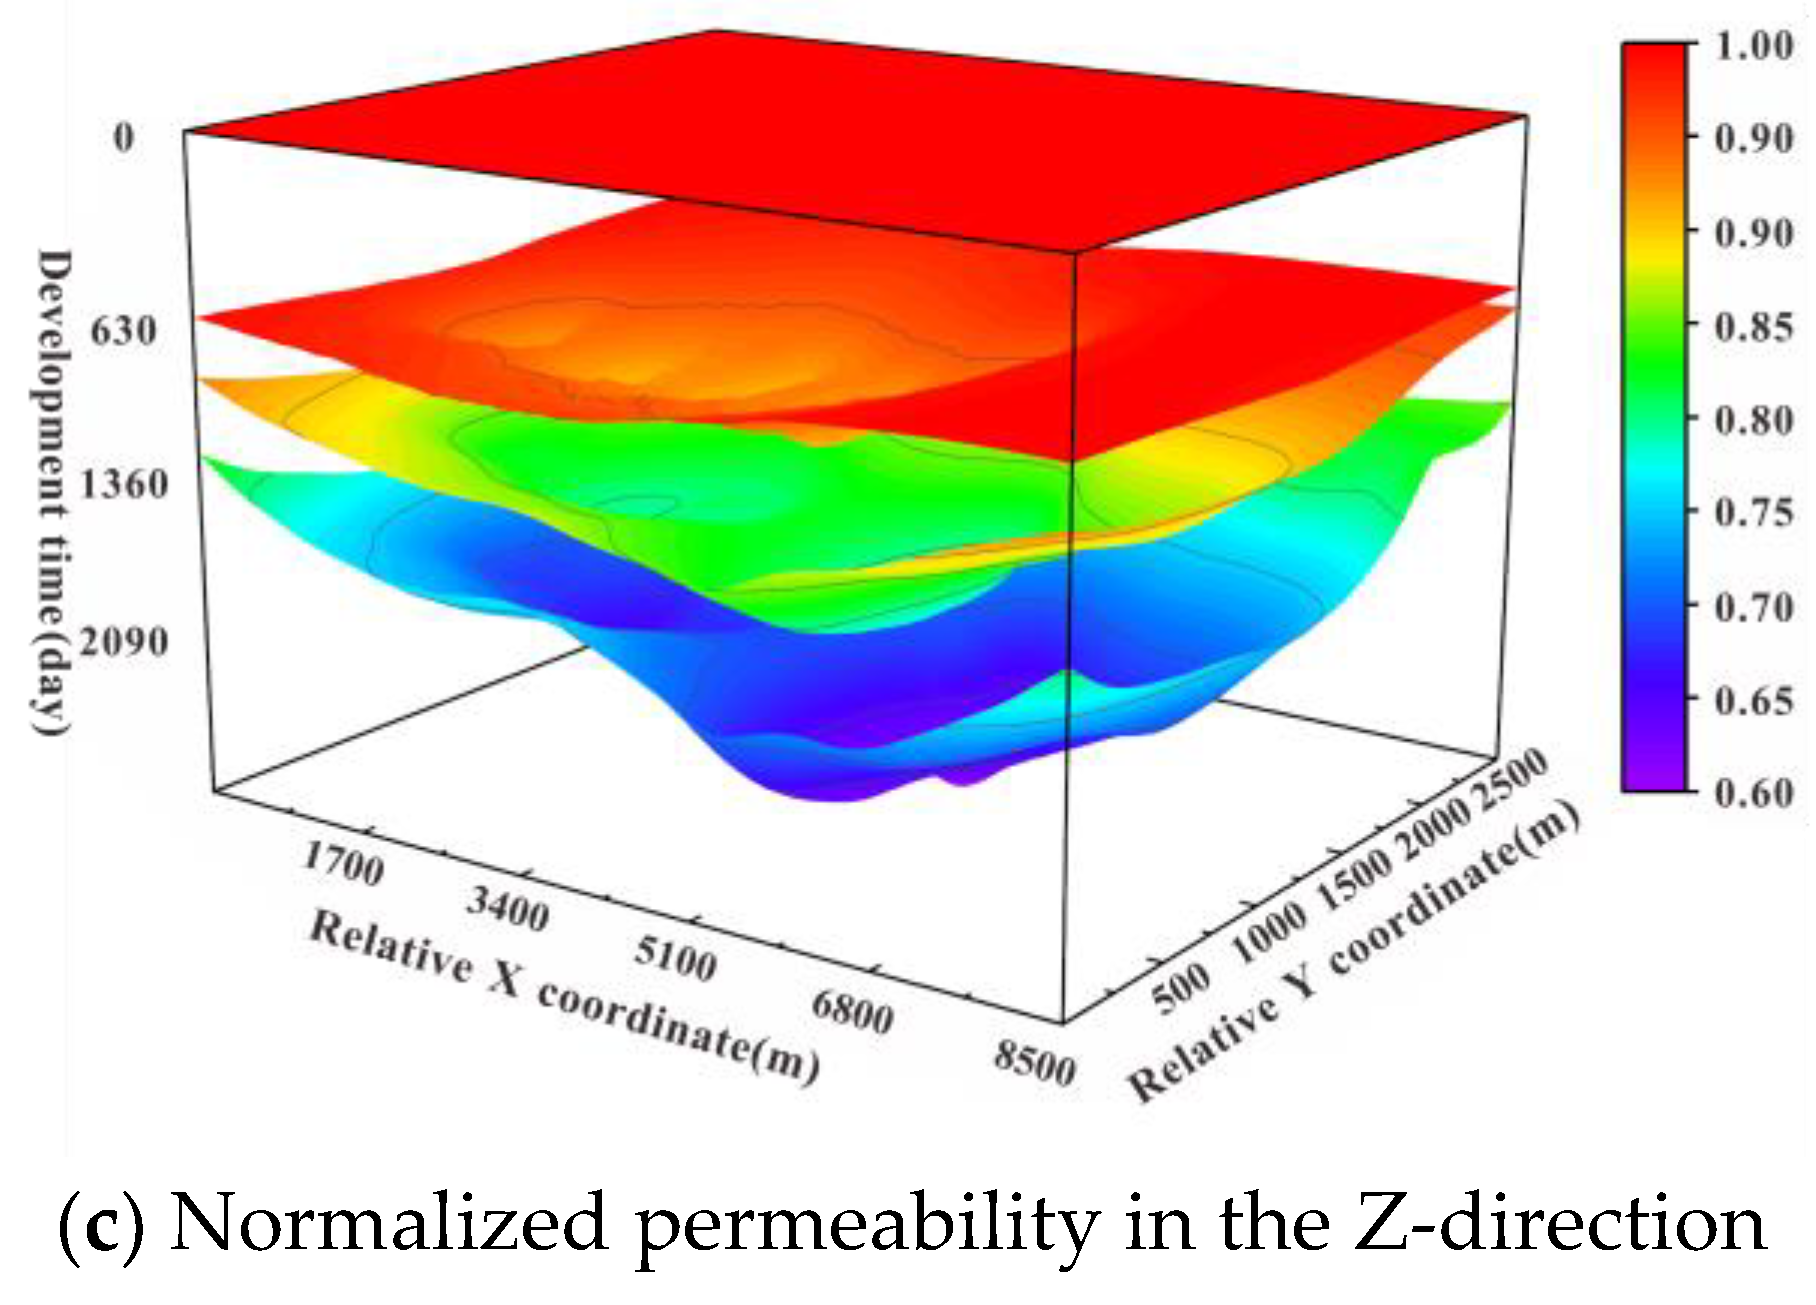
To further explore the permeability stress-sensitivity of the target formation, the evolutionary distributions of the matrix permeability and fracture permeability were plotted in Figure 17 and Figure 18. The permeability gradually decreases with an average decrease of about 25% and a maximum decrease of about 39% by the end of the simulation. The trends in matrix permeability and fracture permeability are consistent, but the maximum decrease in fracture permeability is about 40%, the maximum decrease in matrix permeability is about 20%. The permeability stress-sensitivity of fracture system has a greater impact during gas reservoir development. The variation of matrix permeability and fracture permeability is different between the three-dimensions, with the largest permeability variation in the Z-direction, Figure 17c and Figure 18c, and the smallest permeability variation in the Y-direction, Figure 17b and Figure 18b, which is consistent with the three-dimensional effective stress variation. Thus, it shows that the heterogeneity of the reservoirs can have an impact on the evolution of permeability [39].
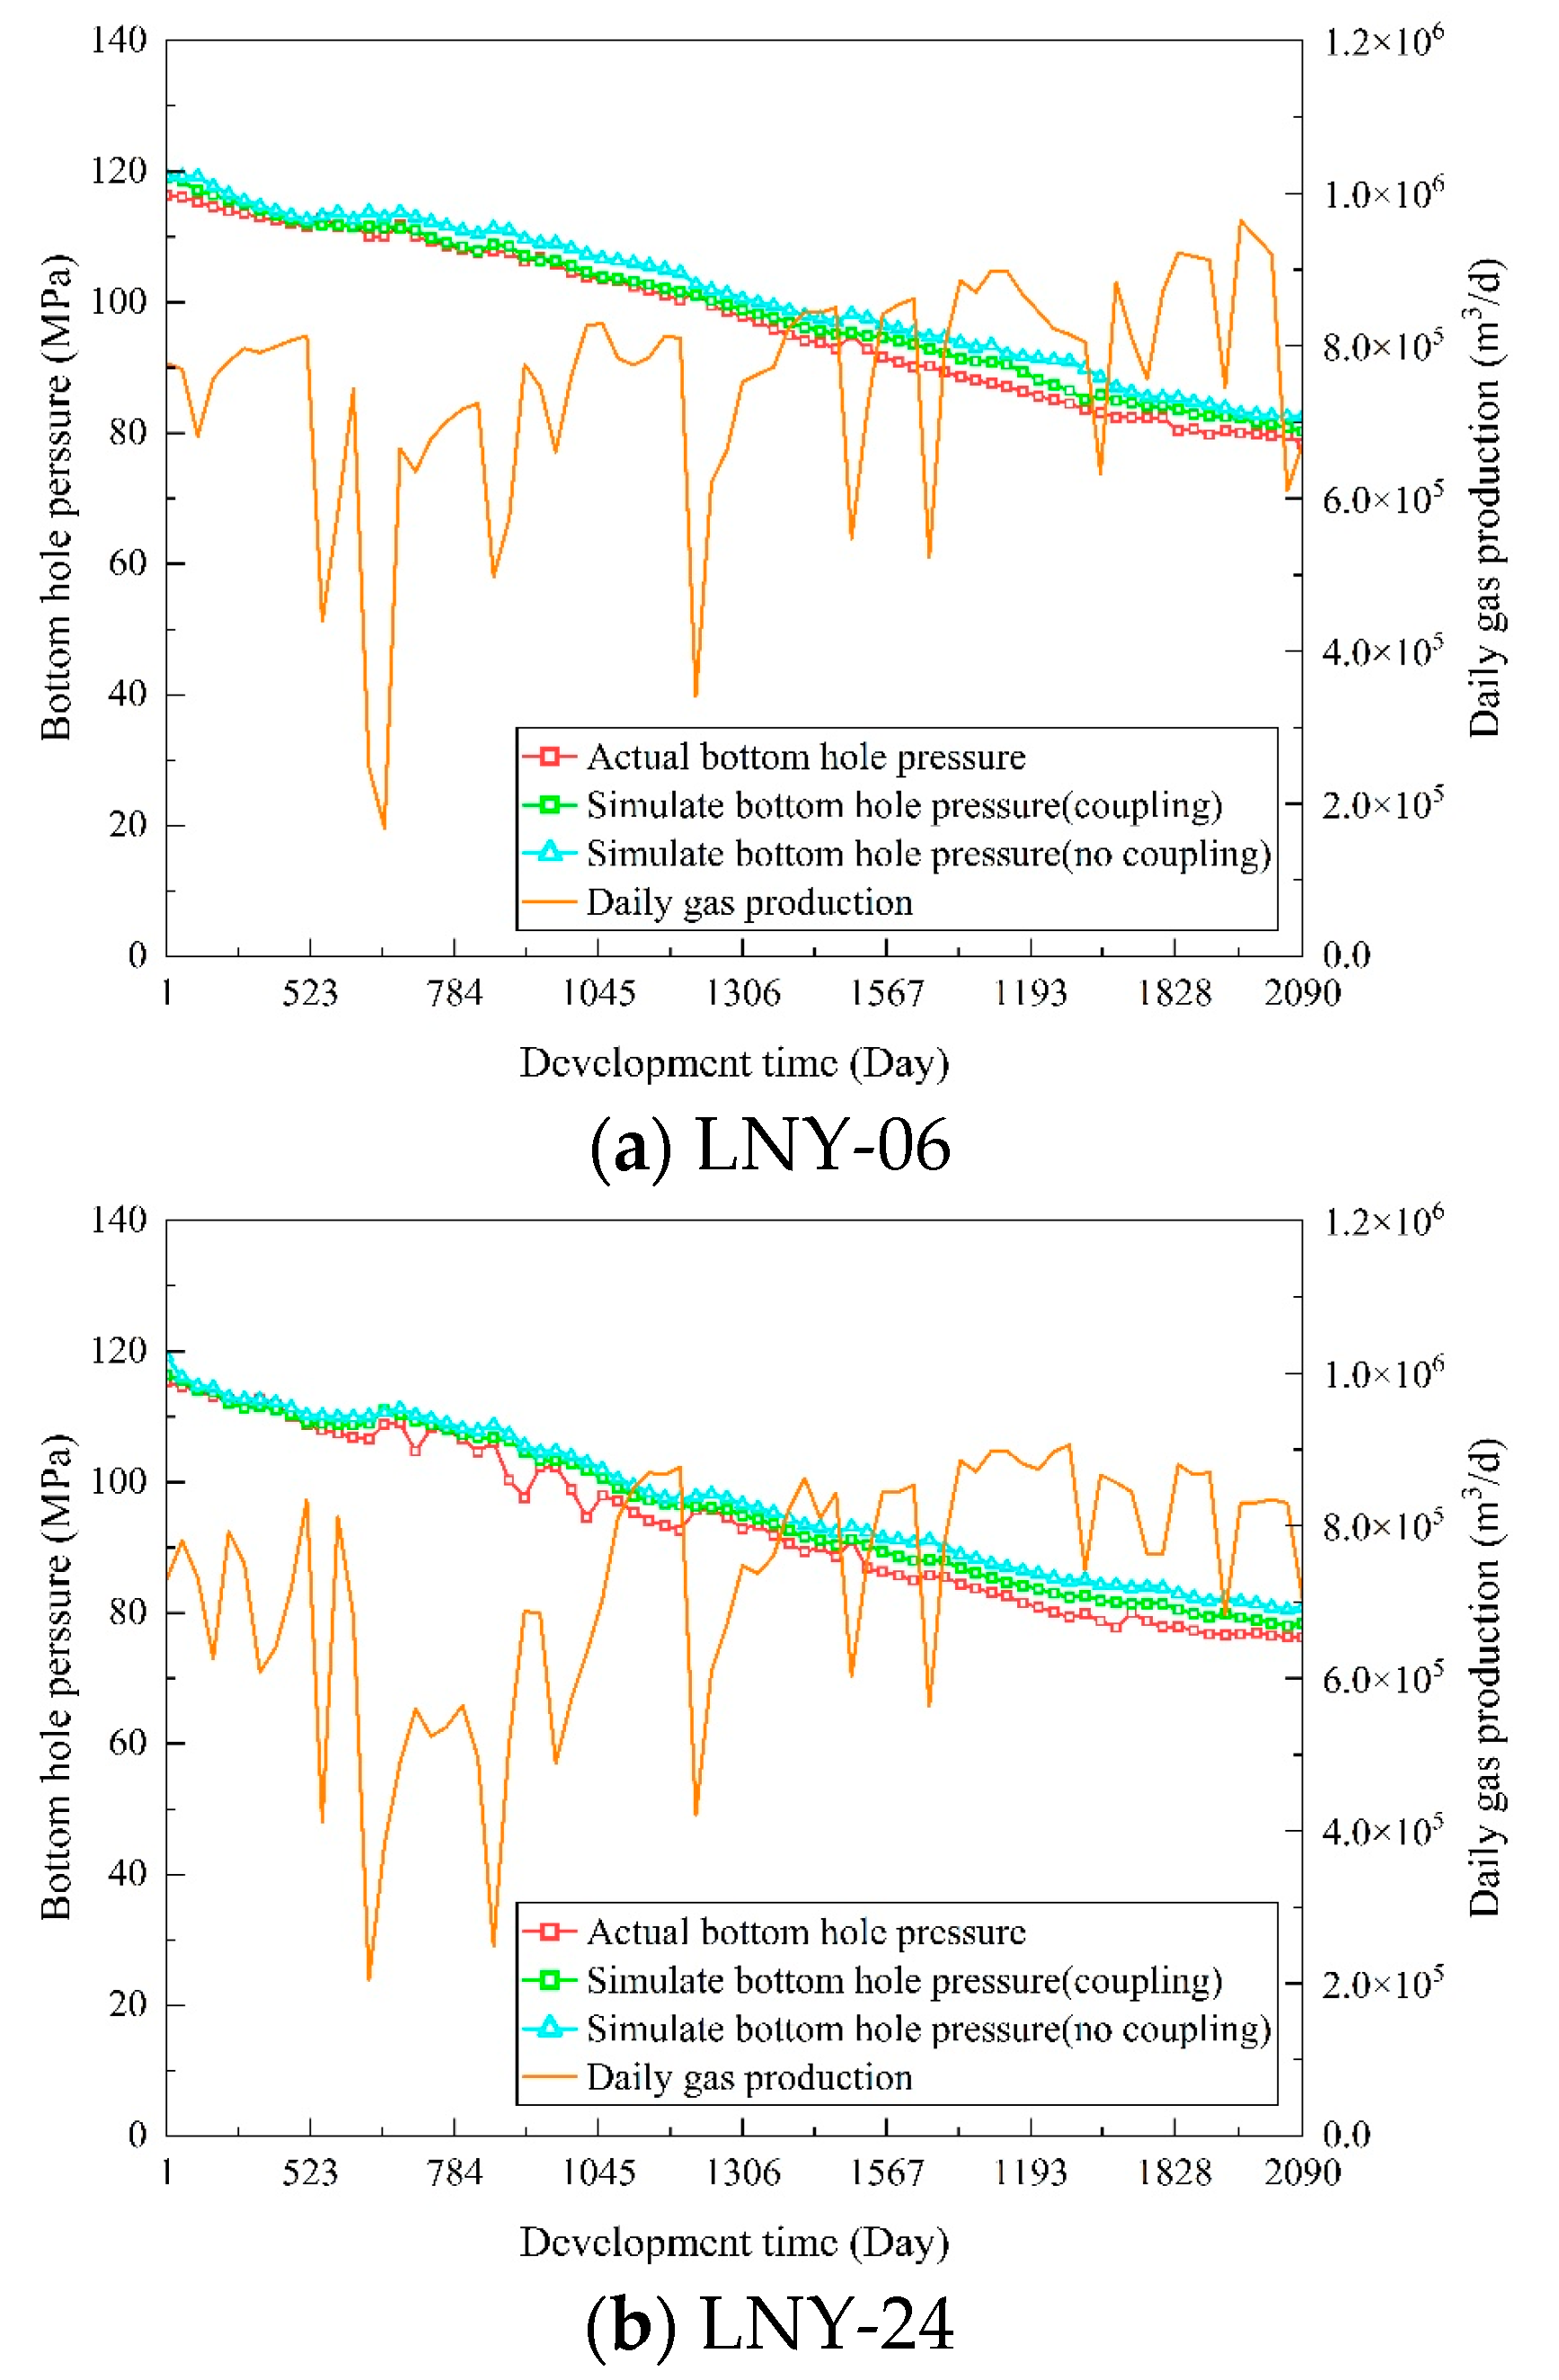
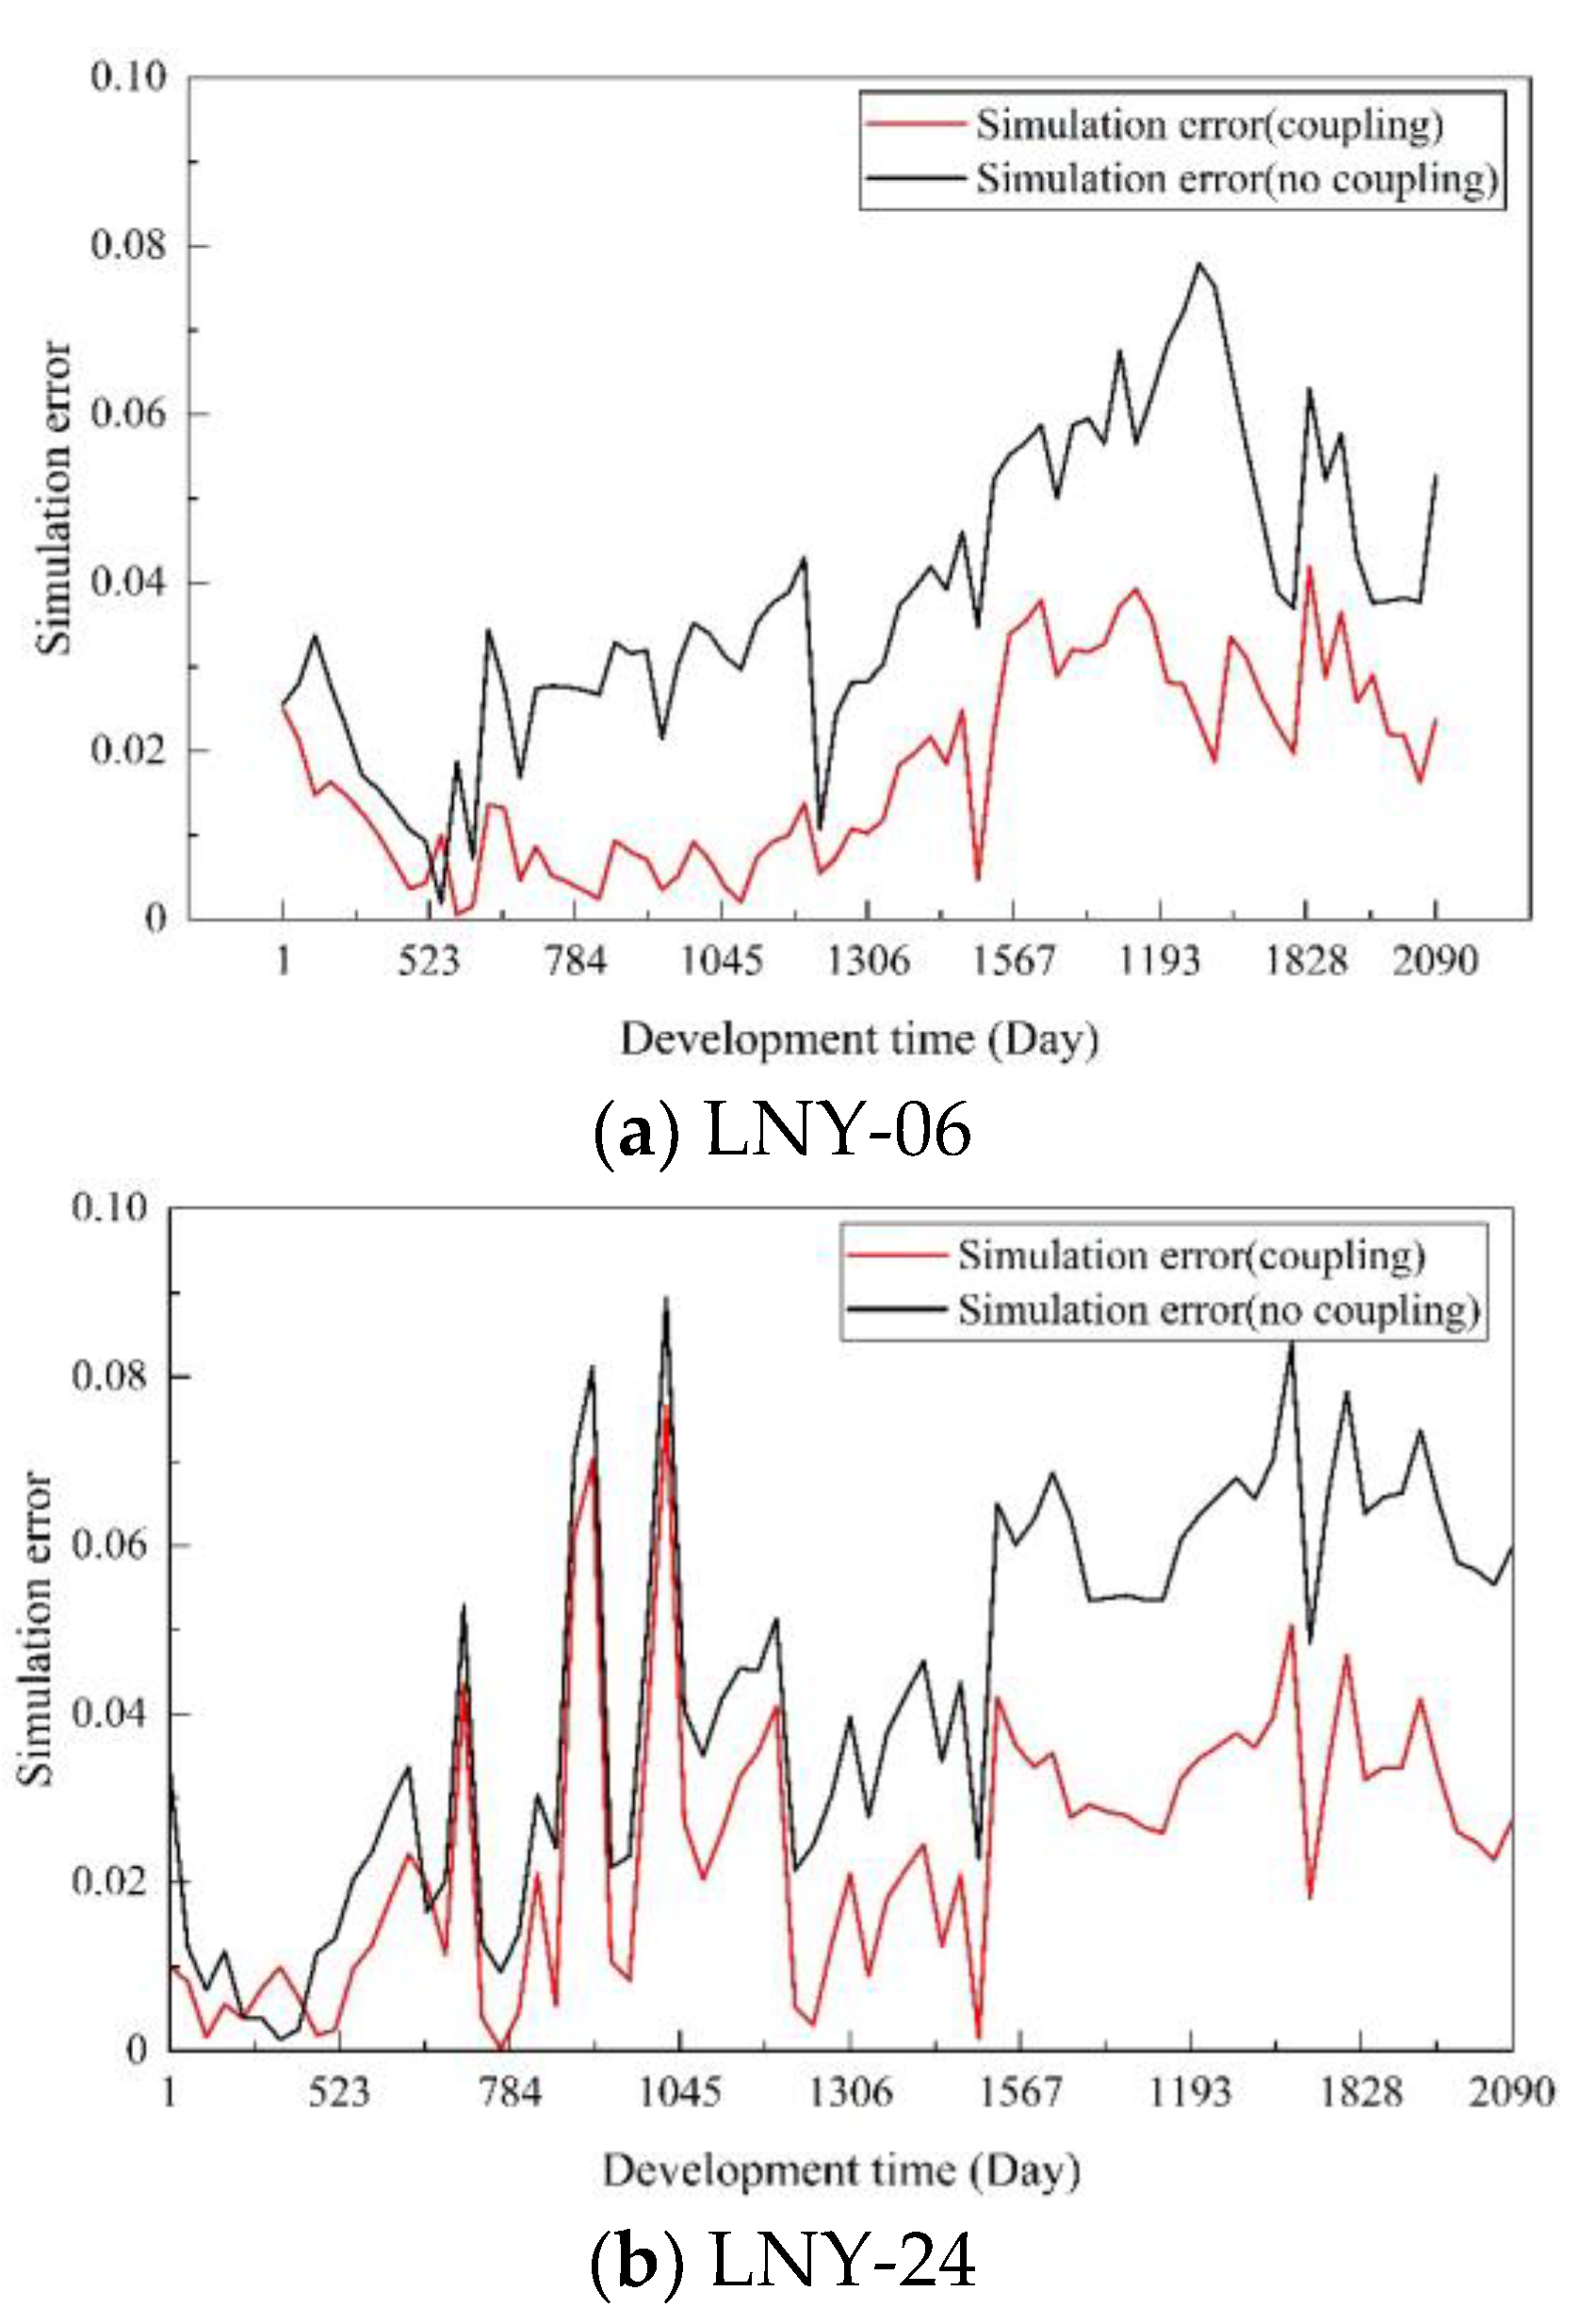
Two types of models were used to simulate fixed production rate of the seven wells in the target formation. The first considered permeability stress-sensitivity while the second did not consider permeability stress-sensitivity. Figure 19 and Figure 20 show the historical fitting results and bottom hole pressure error analysis for wells LNY-06 and LNY-24. Combining the data of the seven wells, the actual bottom hole pressure, the bottom hole pressure of the first type model and the bottom hole pressure of the second type model decreased to 79.64 MPa, 81.48 MPa and 83.42 MPa, respectively, after 2090 days of development. In the early stage of production, the formation pressure shows little change and the deformation is relatively small. The bottom hole pressure change curves for the two types models are basically equal. In the later stage of production, the pore pressure decreased significantly and the reservoir permeability decreased, while the rate of decline in bottom hole pressure increased. The mean square errors between the historical gas production results and the simulation results with and without permeability stress-sensitivity considered were 2.22 and 4.01, respectively. This indicates that the permeability stress-sensitivity is one of the factors affecting gas production.

4.3. Optimization Scheme for Gas Reservoir Development

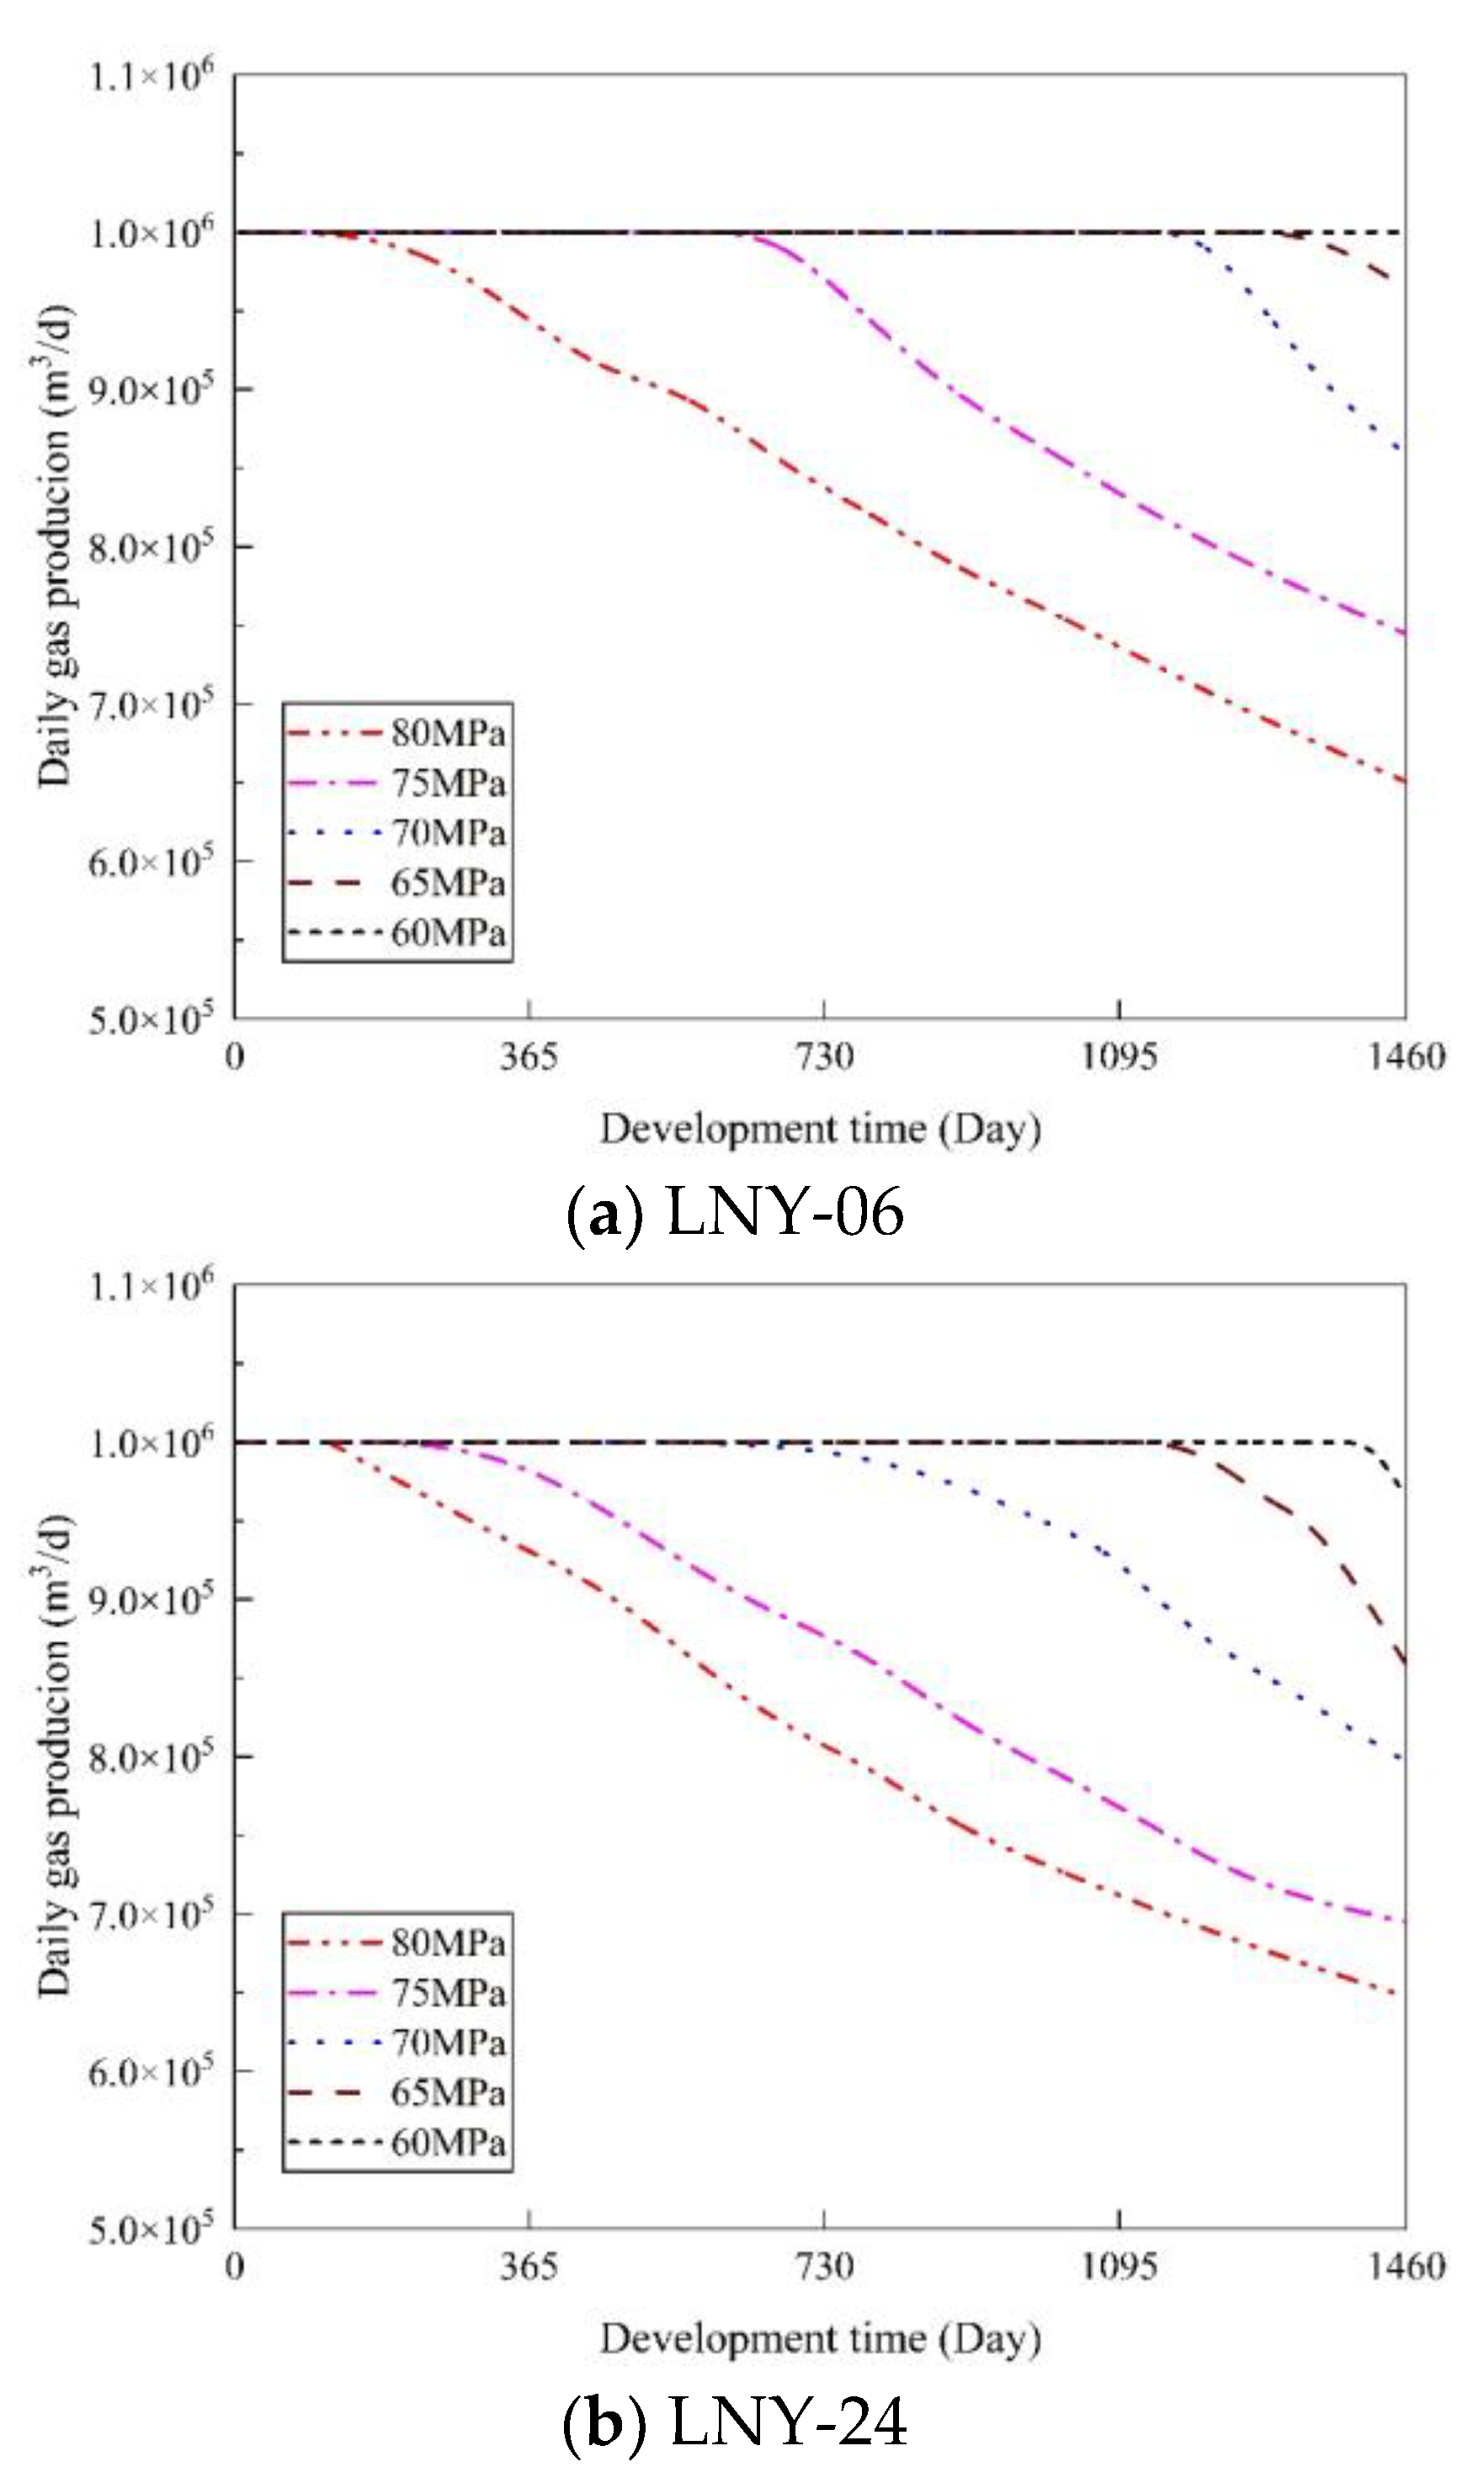
Reducing the bottom hole pressure can effectively increase the production of the well, but too much pressure reduction will reduce the formation permeability and may also lead to sand production in the wellbore and cause damage. Reasonable determination of the bottom hole pressure is of great significance for efficient production. In order to analyze the impact of bottom hole pressure changes on production, the production prediction for 4 years was determinedon the basis of the historical fit. The maximum daily production rate of 1.0 × 10⁶ m3 and five types of bottom hole pressure were set. The two sets of conditions were constrained to each other. Figure 21 shows the production curves for wells LNY-06 and LNY-24 under different bottom hole pressures. With a bottom hole pressure of 60 MPa, the well production can be maintained at 1.0 × 10⁶ m3 for 4 years. With a bottom hole pressure of 80 MPa, the well production is lower than 1.0 × 10⁶ m3 in the early stage of production. When the bottom hole pressure is between 60 and 80 MPa, the production of the well can be stabilized at 1.0 × 10⁶ m3 in the initial stage, and the production gradually declined with development.
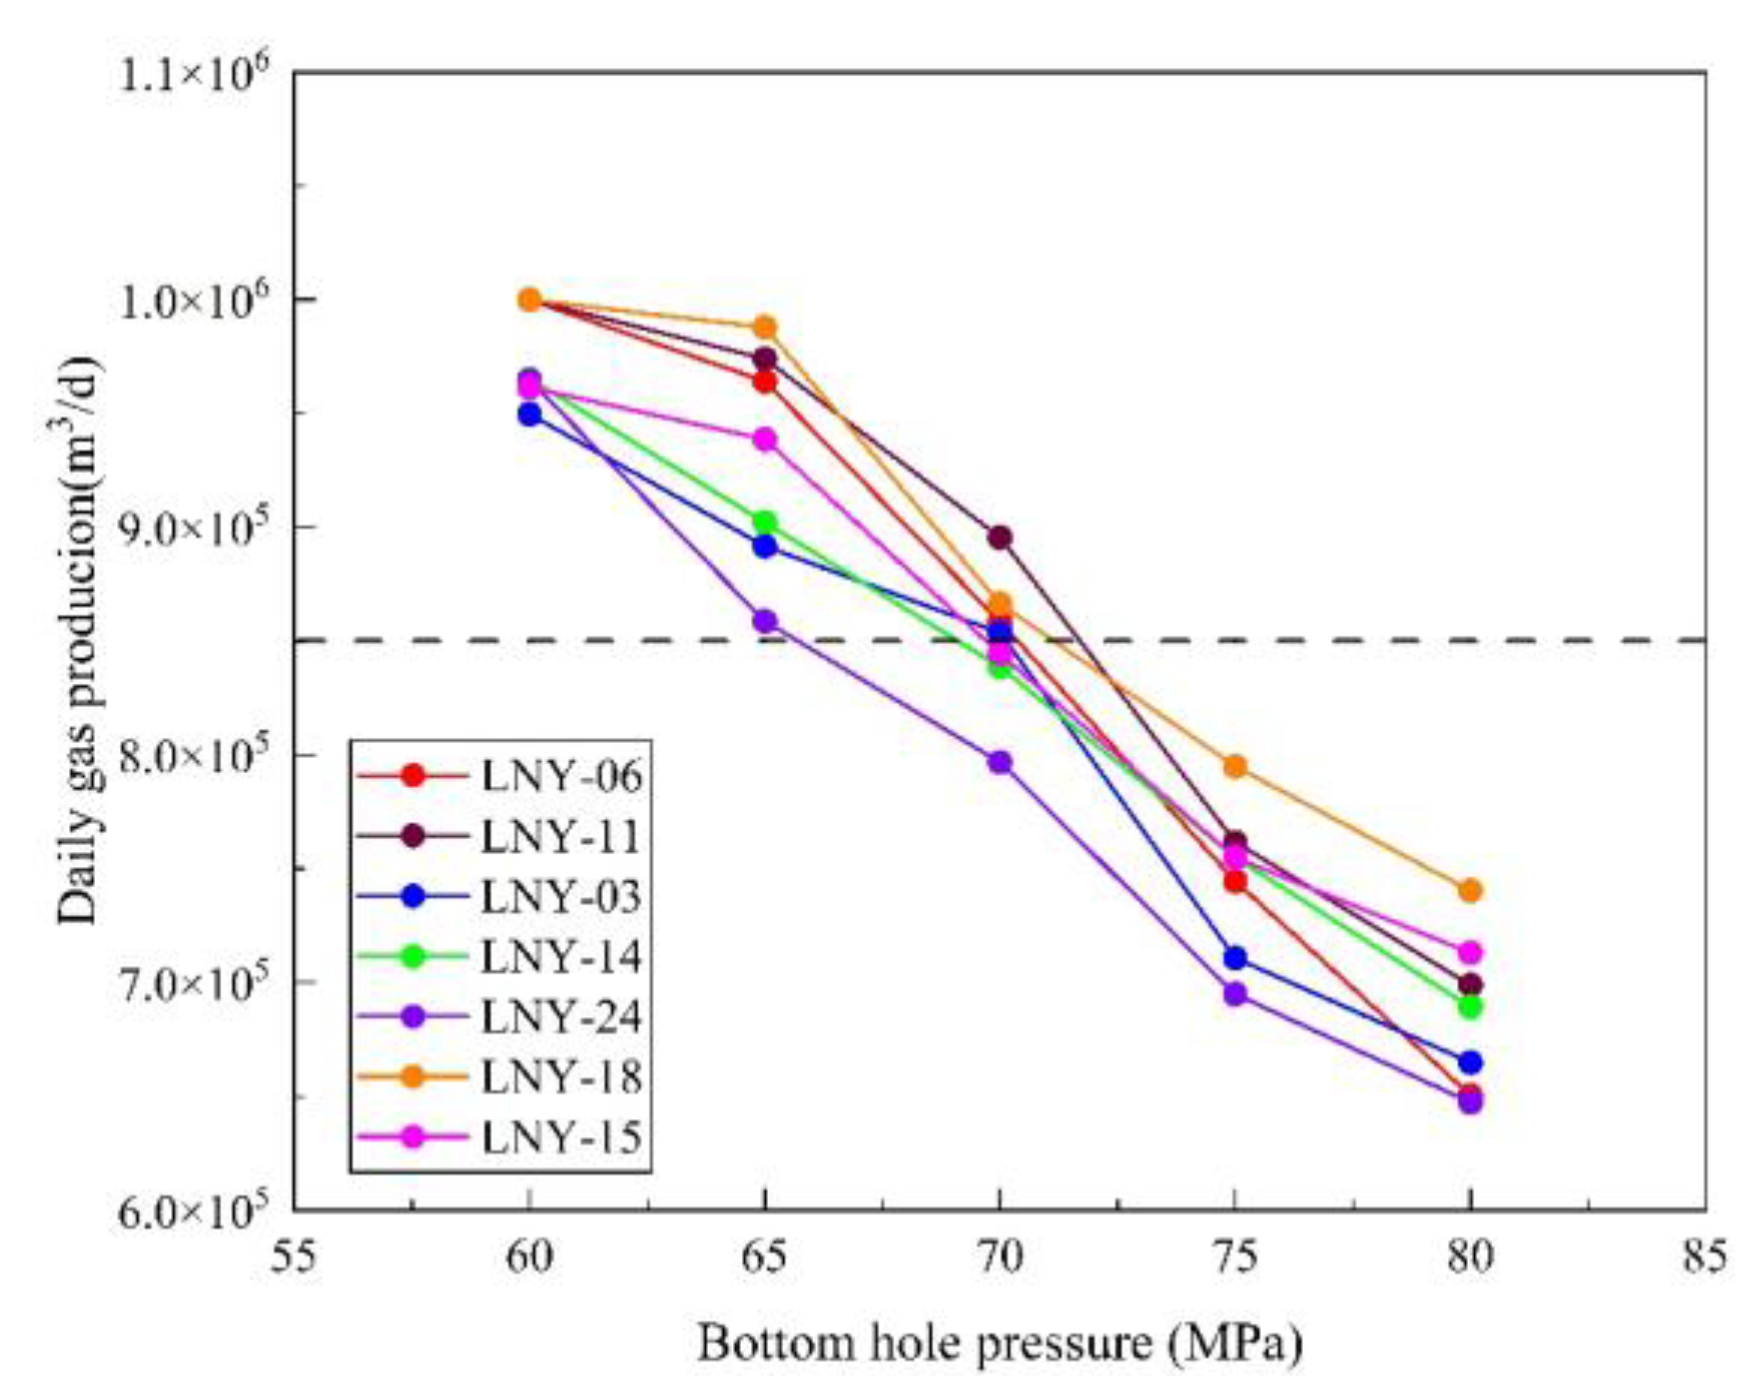
Figure 22 shows the production in seven wells at different bottom hole pressures at the end of the simulation. The gas well production gradually decreases with the increase in bottom hole pressure. With a daily gas production of 8.5 × 10⁵ m3 as the target, a gray reference line was made in Figure 21, and the production of each well is better when the bottom hole pressure is 70 MPa. Based on the results of the production prediction and structural characteristics of the target formation, the production optimization program of gas wells was determined [40]. The four wells LNY-06, LNY-11, LNY-03 and LNY-18 have sufficient gas sources and all produce more than 8.5 × 10⁵ m3 when the bottom hole pressure is 70 MPa, so the existing scheme should be maintained to continue production. The gas production of LNY-14 and the LNY-15 is 83.87 × 10⁵ m3 and 84.46 × 10⁵ m3, respectively, when the bottom hole pressure is 70 MPa. In order to get close to the production target, slight depressurization should be carried out. The gas production of LNY-24 is 79.68 × 10⁵ m3 when the bottomhole pressure is 70 MPa. The bottom hole pressure should be reduced and the production of the well should be monitored during the development. Therefore, LNY-24 should be optimized by combining depressurization and observation.

5. Conclusions

This study analyzed the permeability evolution of tight sandstone with effective stress through permeability stress-sensitivity experiments, and established the coupled seepage-geomechanical model for the target formation. Numerical simulations were conducted for fractured deep tight sandstone gas reservoirs, and the influence of permeability stress-sensitivity on gas reservoir development was analyzed on the basis of fitting with historical gas production data. The following conclusions can be drawn:
(1)
When the effective stress increased from 0 to 65 MPa, the permeability of the natural sample with fractures decreased by 81.28%, and the permeability of the intact core sample decreased by 54.67%. The permeability stress-sensitivity of natural fractures is stronger than that of the matrix, which had a dominant influence on permeability;
(2)
The reservoir heterogeneity can have an impact on the permeability variation, which is manifested by different changes in three-dimensional permeability. The vertical permeability decreases are the most pronounced. The permeability of the fractured zone and the matrix decreased by about 40% and 16%, respectively;
(3)
When the pore pressure near the well decreased from 120 to 85 MPa, the effective stress increased by 5~10 MPa, 4~9 MPa and 11~19 MPa in the three dimensions of X, Y and vertical, respectively. Only elastic deformation occurs in natural fractures and faults, and the normal strain is greater than the shear strain;
(4)
The mean square error between the historical gas production results and the simulation results considering permeability stress-sensitivity was 2.22, while it was 4.01 without considering permeability stress-sensitivity. The coupled seepage-geomechanical model with permeability stress-sensitivity was more accurate in historical gas production fitting;
(5)
According to the numerical simulation and production conditions, three production optimization schemes were determined for the seven wells, including maintaining the state without adjustments, slight depressurization in the well and a combination of depressurization and observation.
This study conducted a case study on the permeability stress-sensitivity in deep tight gas reservoirs using laboratory tests and numerical simulations, which can provide theoretical support for the historical matching and prediction of gas production in the fractured deep tight sandstone gas reservoirs.

Author Contributions

Conceptualization, J.L. and R.S.; Data curation, J.S. and Y.S.; Formal analysis, J.S., R.S. and Y.S.; Funding acquisition, R.S.; Investigation, J.L.; Methodology, J.S. and J.L.; Project administration, R.S.; Resources, J.S., R.S. and Y.S.; Software, J.S.; Supervision, R.S.; Validation, J.L.; Visualization, J.S., J.L. and R.S.; Writing—original draft, J.S.; Writing—review & editing, J.S. and Y.S. All authors have read and agreed to the published version of the manuscript.

Funding

This research was funded by [Knowledge Innovation Program of Wuhan-Basic Research] grant number [2022010801010158]. The APC was funded by [Knowledge Innovation Program of Wuhan-Basic Research].

Institutional Review Board Statement

Not applicable.

Informed Consent Statement

Not applicable.

Data Availability Statement

All the data and materials used in this paper are available from the corresponding author upon request.

Acknowledgments

This work was financially supported by Knowledge Innovation Program of Wuhan-Basic Research (2022010801010158).

Conflicts of Interest

The authors declare no conflict of interest.

References

  1. Li, H.Y.; Zhao, S.; Lin, A.D.; Liu, F.; Li, L.; Dai, X.D. Analysis on World Energy Supply & Demand in 2019—Based on BP Statistical Review of World Energy (2020). Nat. Gas Oil. 2020, 38, 122–130. [Google Scholar]
  2. Dai, J.X.; Ni, Y.Y.; Wu, X.Q. Tight Gas in China and its Significance in Exploration and Exploitation. Pet. Explor. Dev. 2012, 39, 257–264. [Google Scholar] [CrossRef]
  3. Song, R.; Wang, Y.; Tang, Y.; Peng, J.J.; Liu, J.J.; Yang, C.H. 3D Printing of Natural Sandstone at Pore Scale and Comparative Analysis on Micro-Structure and Single/Two-Phase Flow Properties. Energy 2022, 261, 125226. [Google Scholar] [CrossRef]
  4. Li, B.; Xu, N.W.; Dai, F.; Zhang, G.L.; Xiao, P.W. Dynamic Analysis of Rock Mass Deformation in Large Underground Caverns Considering Microseismic Data. Int. J. Rock Mech. Min. Sci. 2019, 122, 104078. [Google Scholar] [CrossRef]
  5. Li1, B.; Ding, Q.F.; Xu, N.W.; Dai, F.; Xu, Y.; Qu, H.L. Characteristics of Microseismic B-value Associated with Rock Mass Large Deformation in Underground Powerhouse Caverns at Different Stress Levels. J. Cent. South Univ. 2022, 29, 693–711. [Google Scholar]
  6. McLatchie, A.S.; Hemstock, R.A.; Young, J.W. The Effective Compressibility of Reservoirs Rock and Its Effects on Permeability. J. Pet. Technol. 1958, 10, 49–51. [Google Scholar] [CrossRef]
  7. Liu, J.J.; Liu, X.G.; Hu, Y.R.; Zhang, Z.S. Study of Fluid-Solid Coupling Flow in Low Permeablable Oil Reservoirs. Chin. J. Rock Mech. Eng. 2002, 21, 88–92. [Google Scholar]
  8. Zhu, J.Z.; Lei, M.; Ren, L.L.; Wang, X.Q.; Xu, G.H.; Huang, W.A. Sensitivity Evaluation and Mechanism of Tight Sandstone Gas Reservoirs Under High Temperature and High Pressure: A Case Study of Tight Gas Reservoirs in B Zone. Fault-Block Oil Gas Field 2017, 24, 222–225. [Google Scholar]
  9. Yang, Z.M.; Feng, C.; Liu, X.W.; Zhu, D.W.; Teng, Q. Experimental Study of Stress-dependent Sensitivity in Ultra-low Permeability Sandstone Planar Model. Sci. Technol. Rev. 2013, 31, 29–33. [Google Scholar]
  10. Jiao, C.Y.; He, S.L.; Xie, Q.; Gu, D.H.; Zhu, H.Y.; Sun, L.; Liu, H.X. An Experimental Study on Stress-dependent Sensitivity of Ultra-low Permeability Sandstone Reservoirs. Acta Pet. Sin. 2011, 32, 489–494. [Google Scholar]
  11. Yang, C.P.; Gao, S.S.; Liu, G.D.; Xiong, W.; Hu, Z.M.; Ye, L.Y.; Yang, R.F. The Research Status and Progress on Percolation Mechanism of Tight Gas Resvervoir. Sci. Technol. Eng. 2012, 12, 8606–8613. [Google Scholar]
  12. Chalmers, G.R.L.; Ross, D.J.K.; Bustin, R.M. Geological Controls on Matrix Permeability of Devonian Gas Shales in the Horn River and Liard Basins, Northeastern British Columbia, Canada. Int. J. Coal Geol. 2012, 103, 120–131. [Google Scholar] [CrossRef]
  13. Xiao, W.L.; Li, T.; Li, M.; Zhao, J.Z.; Zheng, L.L.; Li, L. Evaluation of the stress-sensitivity in Tight Reservoirs. Pet. Explor. Dev. 2016, 43, 107–114. [Google Scholar] [CrossRef]
  14. Dong, J.J.; Hsu, J.Y.; Wu, W.J.; Shimamoto, T.; Hung, J.H.; Yeh, E.C.; Wu, Y.H.; Sone, H. Stress-dependence of the Permeability and Porosity of Sandstone and Shale from TCDP Hole-A. Int. J. Rock Mech. Min. Sci. 2010, 47, 1141–1157. [Google Scholar] [CrossRef]
  15. Zheng, Y.X.; Liu, J.J.; Liu, Y.C.; Shi, D.; Zhang, B.H. Experimental Investigation on the Stress-Dependent Permeability of Intact and Fractured Shale. Geofluids 2020, 2020, 8897911. [Google Scholar] [CrossRef]
  16. Zhang, X.L.; Liu, J.J.; Song, J.C. Optimization Algorithm of Effective Stress Coefficient for Permeability. Energies 2021, 14, 8345. [Google Scholar] [CrossRef]
  17. Fan, X.P.; Xu, X.R. Experimental and Mechanism Research About Permeability Damage with the Change of Stress. Pet. Explor. Dev. 2002, 29, 117–119. [Google Scholar]
  18. Yang, Z.P.; Wu, Z.W.; Li, Y.H.; Heng, Y.; Lu, T.Y. Effect of Connate Water on stress-sensitivity of Tight Gas Reservoirs. Energy Sources Part A-Recovery Util. Environ. Eff. 2021, 43, 1227–1241. [Google Scholar]
  19. Luo, R.L. Queries to the Viewpoint Low Permeability Reservoirs Have Not the Characteristics of Strong stress-sensitivity. Oil Drill. Prod. Technol. 2006, 28, 78–80. [Google Scholar]
  20. Li, C.L.; Zhang, X.L. Misunderstandings of Low Permeability Reservoirs. J. Southwest Pet. Univ. 2009, 31, 177–180,221. [Google Scholar]
  21. Song, R.; Sun, S.Y.; Liu, J.J.; Yang, C.H. Pore Scale Modeling on Dissociation and Transportation of Methane Hydrate in Porous Sediments. Energy 2021, 237, 121630. [Google Scholar] [CrossRef]
  22. Song, R.; Liu, J.J.; Yang, C.H.; Sun, S.Y. Study on the multiphase heat and mass transfer mechanism in the dissociation of methane hydrate in reconstructed real-shape porous sediments. Energy 2022, 254, 124421. [Google Scholar] [CrossRef]
  23. Ghafouri, H.R.; Lewis, R.W. A Finite Element Double Porosity Model for Heterogeneous Deformable Porous Media. Int. J. Numer. Anal. Methods Geomech. 1996, 20, 831–844. [Google Scholar] [CrossRef]
  24. Wei, Z.J.; Zhang, D.X. Coupled Fluid-Flow and Geomechanics for Triple-Porosity/Dual-Permeability Modeling of Coalbed Methane Recovery. Int. J. Rock Mech. Min. Sci. 2010, 47, 1242–1253. [Google Scholar] [CrossRef]
  25. Noorishad, J.; Mehran, M. An Upstream Finite-Element Method for Solution of Transient Transport-Equation in Fractured Porous-Media. Water Resour. Res. 1982, 18, 588–596. [Google Scholar] [CrossRef] [Green Version]
  26. Yang, H.J.; Li, Y.; Tang, Y.G.; Lei, G.L.; Zhou, P.; Zhou, L.; Xu, A.M.; Huan, Z.P.; Zhu, W.H.; Chen, W.L.; et al. Accumulation Conditions, Key Exploration and Development Technologies for Keshen Gas Field in Tarim Basin. Acta Pet. Sin. 2021, 42, 399–414. [Google Scholar] [CrossRef]
  27. Li, M.; Xiao, W.L. Experimental Study on Permeability-Effective-Stress Law in Low-Permeability Sandstone Reservoirs. Chin. J. Rock Mech. Eng. 2008, 27, 3535–3540. [Google Scholar]
  28. Xiao, W.L.; Bernabe, Y.; Evans, B.; Mok, U.; Zhao, J.Z.; Ren, X.Y.; Chen, M. Klinkenberg Effect and Effective Pressure for Gas Permeability of Tight Sandstones. J. Geophys. Res.-Solid Earth 2019, 124, 1412–1429. [Google Scholar] [CrossRef]
  29. Zhu, W.C.; Wei, C.H.; Tian, J.; Yang, T.H.; Tang, C.A. Coupled Thermal-hydraulic-mechanical Model During Rock Damage and its Preliminary Application. Rock Soil Mech. 2009, 30, 3851–3857. [Google Scholar]
  30. Pei, G.H.; Song, J.C.; Zhang, X.L. Numerical Simulation of Temporal and Spatial Evolution of Stress Field in Unconsolidated Sandstone Oil Reservoirs. In Journal of Physics: Conference Series, Proceedings of the 2021 5th International Conference on Electrical, Automation and Mechanical Engineering (EAME 2021), Guangzhou, China, 17–18 September 2021; IOP Publishing: Bristol, UK, 2021; Volume 2095, p. 2095. [Google Scholar]
  31. Liu, J.J.; Zhang, S.Z.; Liu, X.G.; Hu, Y.R. Theory and Simulation of Fluid-Solid Coupling Flow Through Low Permeability Fractured Oil Reservoirs. Theor. Appl. Mech. 2002, 34, 779–784. [Google Scholar]
  32. Jiang, T.W.; Zhang, H.; Xu, K.; Wang, Z.M.; Wang, H.Y. Reservoirs Geomechanical Characteristics and the Influence on Development in Keshen Gas Field. J. Southwest Pet. Univ. 2020, 42, 1–12. [Google Scholar]
  33. Wang, K.; Zhang, R.H.; Wang, J.P.; Sun, X.W.; Yang, X.J. Distribution and Origin of Tectonic Fractures in Ultra-deep Tight Sandstone Reservoirs: A Case Study of Keshen Gas Field, Kuqa Foreland Thrust Belt, Tarim Basin. Oil Gas Geol. 2021, 42, 338–353. [Google Scholar]
  34. Zhu, H.Y.; Song, Y.J.; Lei, Z.D.; Tang, X.H. 4D-stress Evolution of Tight Sandstone Reservoirs During Horizontal Wells Injection and Production: A Case Study of Yuan 284 Block, Ordos Basin, NW China. Pet. Explor. Dev. 2022, 49, 136–147. [Google Scholar] [CrossRef]
  35. Samier, P.; Onaisi, A.; de Gennaro, S. A Practical Iterative Scheme for Coupling Geomechanics with Reservoirs Simulation. SPE Reserv. Eval. Eng. 2008, 11, 892–901. [Google Scholar] [CrossRef]
  36. Ghahfarokhi, P.K. The Structured Gridding Implications for Upscaling Model Discrete Fracture Networks (DFN) Using Corrected Oda’s Method. J. Pet. Sci. Eng. 2017, 153, 70–80. [Google Scholar] [CrossRef]
  37. Wei, H.B.; Zhu, H.L.; Li, H.S.; Shi, S.M.; Gan, S.L.; Zhai, Z.W. The Study of the Reservoirs Inter-architecture Structure and Remaining Oil in the Eastern Part of Sabei II District. Rud.-Geol.-Naft. Zbornik. 2019, 34, 13–20. [Google Scholar] [CrossRef]
  38. Feng, Y.C.; Gray, K.E. A Fracture-mechanics-based Model for Wellbore Strengthening Applications. J. Nat. Gas Sci. Eng. 2016, 29, 392–400. [Google Scholar] [CrossRef]
  39. Zhu, H.Y.; Tang, X.H.; Liu, Q.Y.; Liu, S.J.; Zhang, B.H.; Jiang, S.; McLennan, J.D. Permeability Stress-sensitivity in 4D Flow-geomechanical Coupling of Shouyang CBM Reservoirs, Qinshui Basin, China. Fuel 2018, 232, 817–832. [Google Scholar] [CrossRef]
  40. Chrisangelo, A.U.; Maduabuchi, I.P.; Ma, X.L.; Obunwa, U.J. Application of Machine Learning Models in Predicting Initial Gas Production Rate from Tight Gas Reservoirs. Rud.-Geol.-Naft. Zbornikl. 2019, 34, 29–40. [Google Scholar]
Figure 1. The rock samples drilled from the target formation.
Applsci 12 11672 g001
Figure 2. Structure diagram of experimental equipment.
Applsci 12 11672 g002
Figure 3. Fitted curves of permeability vs. effective stress.
Applsci 12 11672 g003
Figure 4. The experimental normalized permeability.
Applsci 12 11672 g004
Figure 5. Seepage-geomechanics iterative coupling process.
Applsci 12 11672 g005
Figure 6. Schematic diagram of the top of layer K1BS1.
Applsci 12 11672 g006
Figure 7. Schematic diagram of the distribution of faults.
Applsci 12 11672 g007
Figure 8. Natural fractures properties of modeling.
Applsci 12 11672 g008aApplsci 12 11672 g008b
Figure 9. Schematic of fracture grid and matrix grid conduction patterns.
Applsci 12 11672 g009
Figure 10. Geomechanical model grid diagram of the target formation.
Applsci 12 11672 g010
Figure 11. Three-dimensional effective stress near the wellbores of seven wells.
Applsci 12 11672 g011aApplsci 12 11672 g011b
Figure 12. Elastic strain distribution of faults in the target formation.
Applsci 12 11672 g012
Figure 13. Plastic strain distribution of faults in the target formation.
Applsci 12 11672 g013aApplsci 12 11672 g013b
Figure 14. Elastic strain distribution of natural fractures in the target formation.
Applsci 12 11672 g014
Figure 15. Plastic strain distribution of natural fractures in the target formation.
Applsci 12 11672 g015
Figure 16. Normalized permeability and mean effective stress around the well.
Applsci 12 11672 g016
Figure 17. Normalized permeability contours of matrix systems.
Applsci 12 11672 g017aApplsci 12 11672 g017b
Figure 18. Normalized permeability contours of fracture systems.
Applsci 12 11672 g018aApplsci 12 11672 g018b
Figure 19. Production history matching.
Applsci 12 11672 g019
Figure 20. Comparison of bottom hole pressure fitting errors.
Applsci 12 11672 g020
Figure 21. Variation of gas production at different bottom hole pressures.
Applsci 12 11672 g021
Figure 22. Daily gas production of seven wells.
Applsci 12 11672 g022
Table 1. The parameter values of rock samples.
No.Depth (cm)Weight (g)Length (cm)Diameter (cm)Porosity (%)Permeability (mD)
A16786.2964.795.0422.5001.4680.047
A26703.5062.485.0452.5004.5750.028
A36707.4364.245.0482.5000.036
A46706.6162.295.0452.5044.6060.033
A57001.9156.714.4332.5001.5940.023
B16778.6264.385.0632.5022.5580.095
B26783.9266.105.0632.5163.454
B36706.6162.415.0542.4990.622
B46878.8062.495.0552.5004.1980.087
B57363.0764.215.0302.5000.113
Table 2. The parameters of the seepage numerical model for the target formation.
ParametersValue
Gas phase density under standard conditions (kg/m3)0.6972
Water phase density under standard conditions (kg/m3)1020.30
Viscosity of water phase under standard conditions (cP)0.20
Volume coefficient of water phase1.0622
Compression coefficient of water phase 0.4596 × 10⁻³
Table 3. The parameters of geomechanical model for the target formation.
ParametersOver BurdenUnder BurdenSide BurdenPlateReservoirs
Young’s modulus (GPa)1536323617~35
Poisson’s ratio0.250.220.270.20.24~0.3
Density (g/cm3)2.652.522.62.522.46~2.68
Porosity (%)42411.5~6.0
Compressive strength (MPa)10512011012580~110
Tensile strength (MPa)3545421541~45
Friction Angle (°)7.59.59.5126.5~10
Cohesive force (MPa)2024242418~24
Publisher’s Note: MDPI stays neutral with regard to jurisdictional claims in published maps and institutional affiliations.