1. Introduction
In recent years, a large number of hydropower projects have been under construction in southwest China. With economic and technical considerations taken into account, most of these hydropower projects have placed their hydraulic structures inside mountains, such as the Jinping-I [
1], Houziyan [
2], Shuangjiangkou [
3], and Baihetan [
4] hydropower stations. Construction is more challenging in southwest China due to the uneven ground stress, complex rock mass structure, and development of weak structural planes. In addition, because the majority of ongoing hydropower projects are running behind schedule, it is essential to construct tunnels in a safe and efficient manner. To ensure the safety of project construction and operation, it is urgently necessary to find solutions to a number of problems related to the stability and control of the surrounding rock of deep tunnels.
The initiation, growth, and propagation of micro-fractures in the rock mass can cause macroscopic deformation and failure of that rock mass, and MS events can fully describe how these micro-fractures develop in the rock mass. MS monitoring was firstly used to check on the safety of mines [
5,
6,
7,
8]. Later, given its quick growth, widespread adoption, and extensive use, it was also widely used in the extraction of oil, natural gas, and geothermal energy [
9,
10,
11]. In recent years, it has been applied in projects such as CO
2 storage [
12,
13], deep-pit oil and gas reserves [
14], and underground nuclear waste protection [
15]. With the cascading development of hydropower stations in southwest China, MS monitoring has also been introduced into the safety monitoring of hydropower projects on a large scale.
Li et al. [
16,
17,
18] deployed an MS monitoring system in the deep underground powerhouse of several hydropower stations, analyzed the relationship between the b-value of MS events and macroscopic deformation of the surrounding rock and its change law over time, and identified the potential unstable zone of the underground cavern under the effect of excavation and unloading. The team, led by Feng Xiating [
19,
20,
21], successfully built an MS monitoring system in the Baihetan hydropower station and Jinping-II hydropower station, studied rock bursts in tunnels under high ground stress, and identified the evolution law and characteristics of MS events. Xu Nuwen et al. [
22,
23,
24] introduced the MS monitoring system into several large hydropower stations, including the Jinping-I hydropower station, Baihetan hydropower station, Houziyan hydropower station, and Wudongde hydropower station, carried out research on engineering problems such as rock slope instability and surrounding rock failure in underground caverns, and achieved a wealth of engineering research results by combining numerical simulation means, conventional monitoring methods, source parameter analysis of MS events, and dynamic construction analysis.
Based on engineering geological data and site surveys, MS monitoring was employed in this paper to monitor the surrounding rock deformation and failure in the spillway tunnel of the Jinchuan hydropower station online in real time, and source parameter analysis was used to analyze and study the stability of the surrounding rock.
2. Engineering Background
The Jinchuan hydropower station is located on a reach roughly 1 km upstream of the confluence of the Dadu River and the right bank tributary Xinzagou River, approximately 13 km north of Jinchuan County, Ngawa Tibetan and Qiang Autonomous Prefecture, Sichuan Province. It is the sixth stage of the cascade development of hydropower stations on the main stream of the Dadu River, downstream of the Shuangjiangkou hydropower station, and upstream of the Badi hydropower station via Jinchuan County. The location of the Jinchuan hydropower station is shown in
Figure 1With a total length of 938.5 m and a maximum discharge of 1612 m3/s, the spillway tunnel was built on the right side of the spillway for the purpose of flood control during the construction period and flood relief during the permanent operation period. The pressurized section of the spillway tunnel was made up of an inlet transition section, a circular pressurized section, and an outlet transition section. In particular, the inlet transition section gradually changed from a 7 m × 12 m rectangular section into a circular section with a diameter of 10 m, and the outlet transition section gradually changed from a circular section with a diameter of 10 m into an 8 m × 7 m rectangular section. The unpressurized section had a total length of 456.0 m and an 8 m × 14 m section with a circular arch and vertical wall. Subject to the dead load and tectonic stress, the ground stress field in the project area was affected by the topography and fault form; the principal stress value decreased at the fault, and one principal stress tended to deflect to the normal direction of the fault plane; gravity was the dominant factor controlling the ground stress field in the project area. A few faults with shallow dip angles occurred in the surrounding rock of the tunnel, which made it simple to produce unstable blocks when combined with the cracks in the steeply dipping plane. This was unfavorable to the top arch and easy to cause neighboring blocks to fall and collapse. It is important to enhance the support treatment since the surrounding rock at the outlet and inlet sections of the spillway tunnel and the weak interlayer in the middle of the tunnel had poor quality.
3. MS Monitoring System for the Spillway Tunnel
MS monitoring, a new geotechnical engineering safety monitoring method, can make up for the drawbacks of conventional monitoring methods with qualities such as timeliness and high accuracy. Therefore, it is important to introduce MS monitoring into hydropower projects to track the development of micro-fractures in the surrounding rock. Based on the preceding understanding, an MS monitoring system was successfully built for the spillway tunnel of the Jinchuan hydropower station in July 2020 to achieve 24-h continuous monitoring and provide opinions and suggestions for the safe construction of the spillway tunnel.
3.1. Principles of MS Monitoring
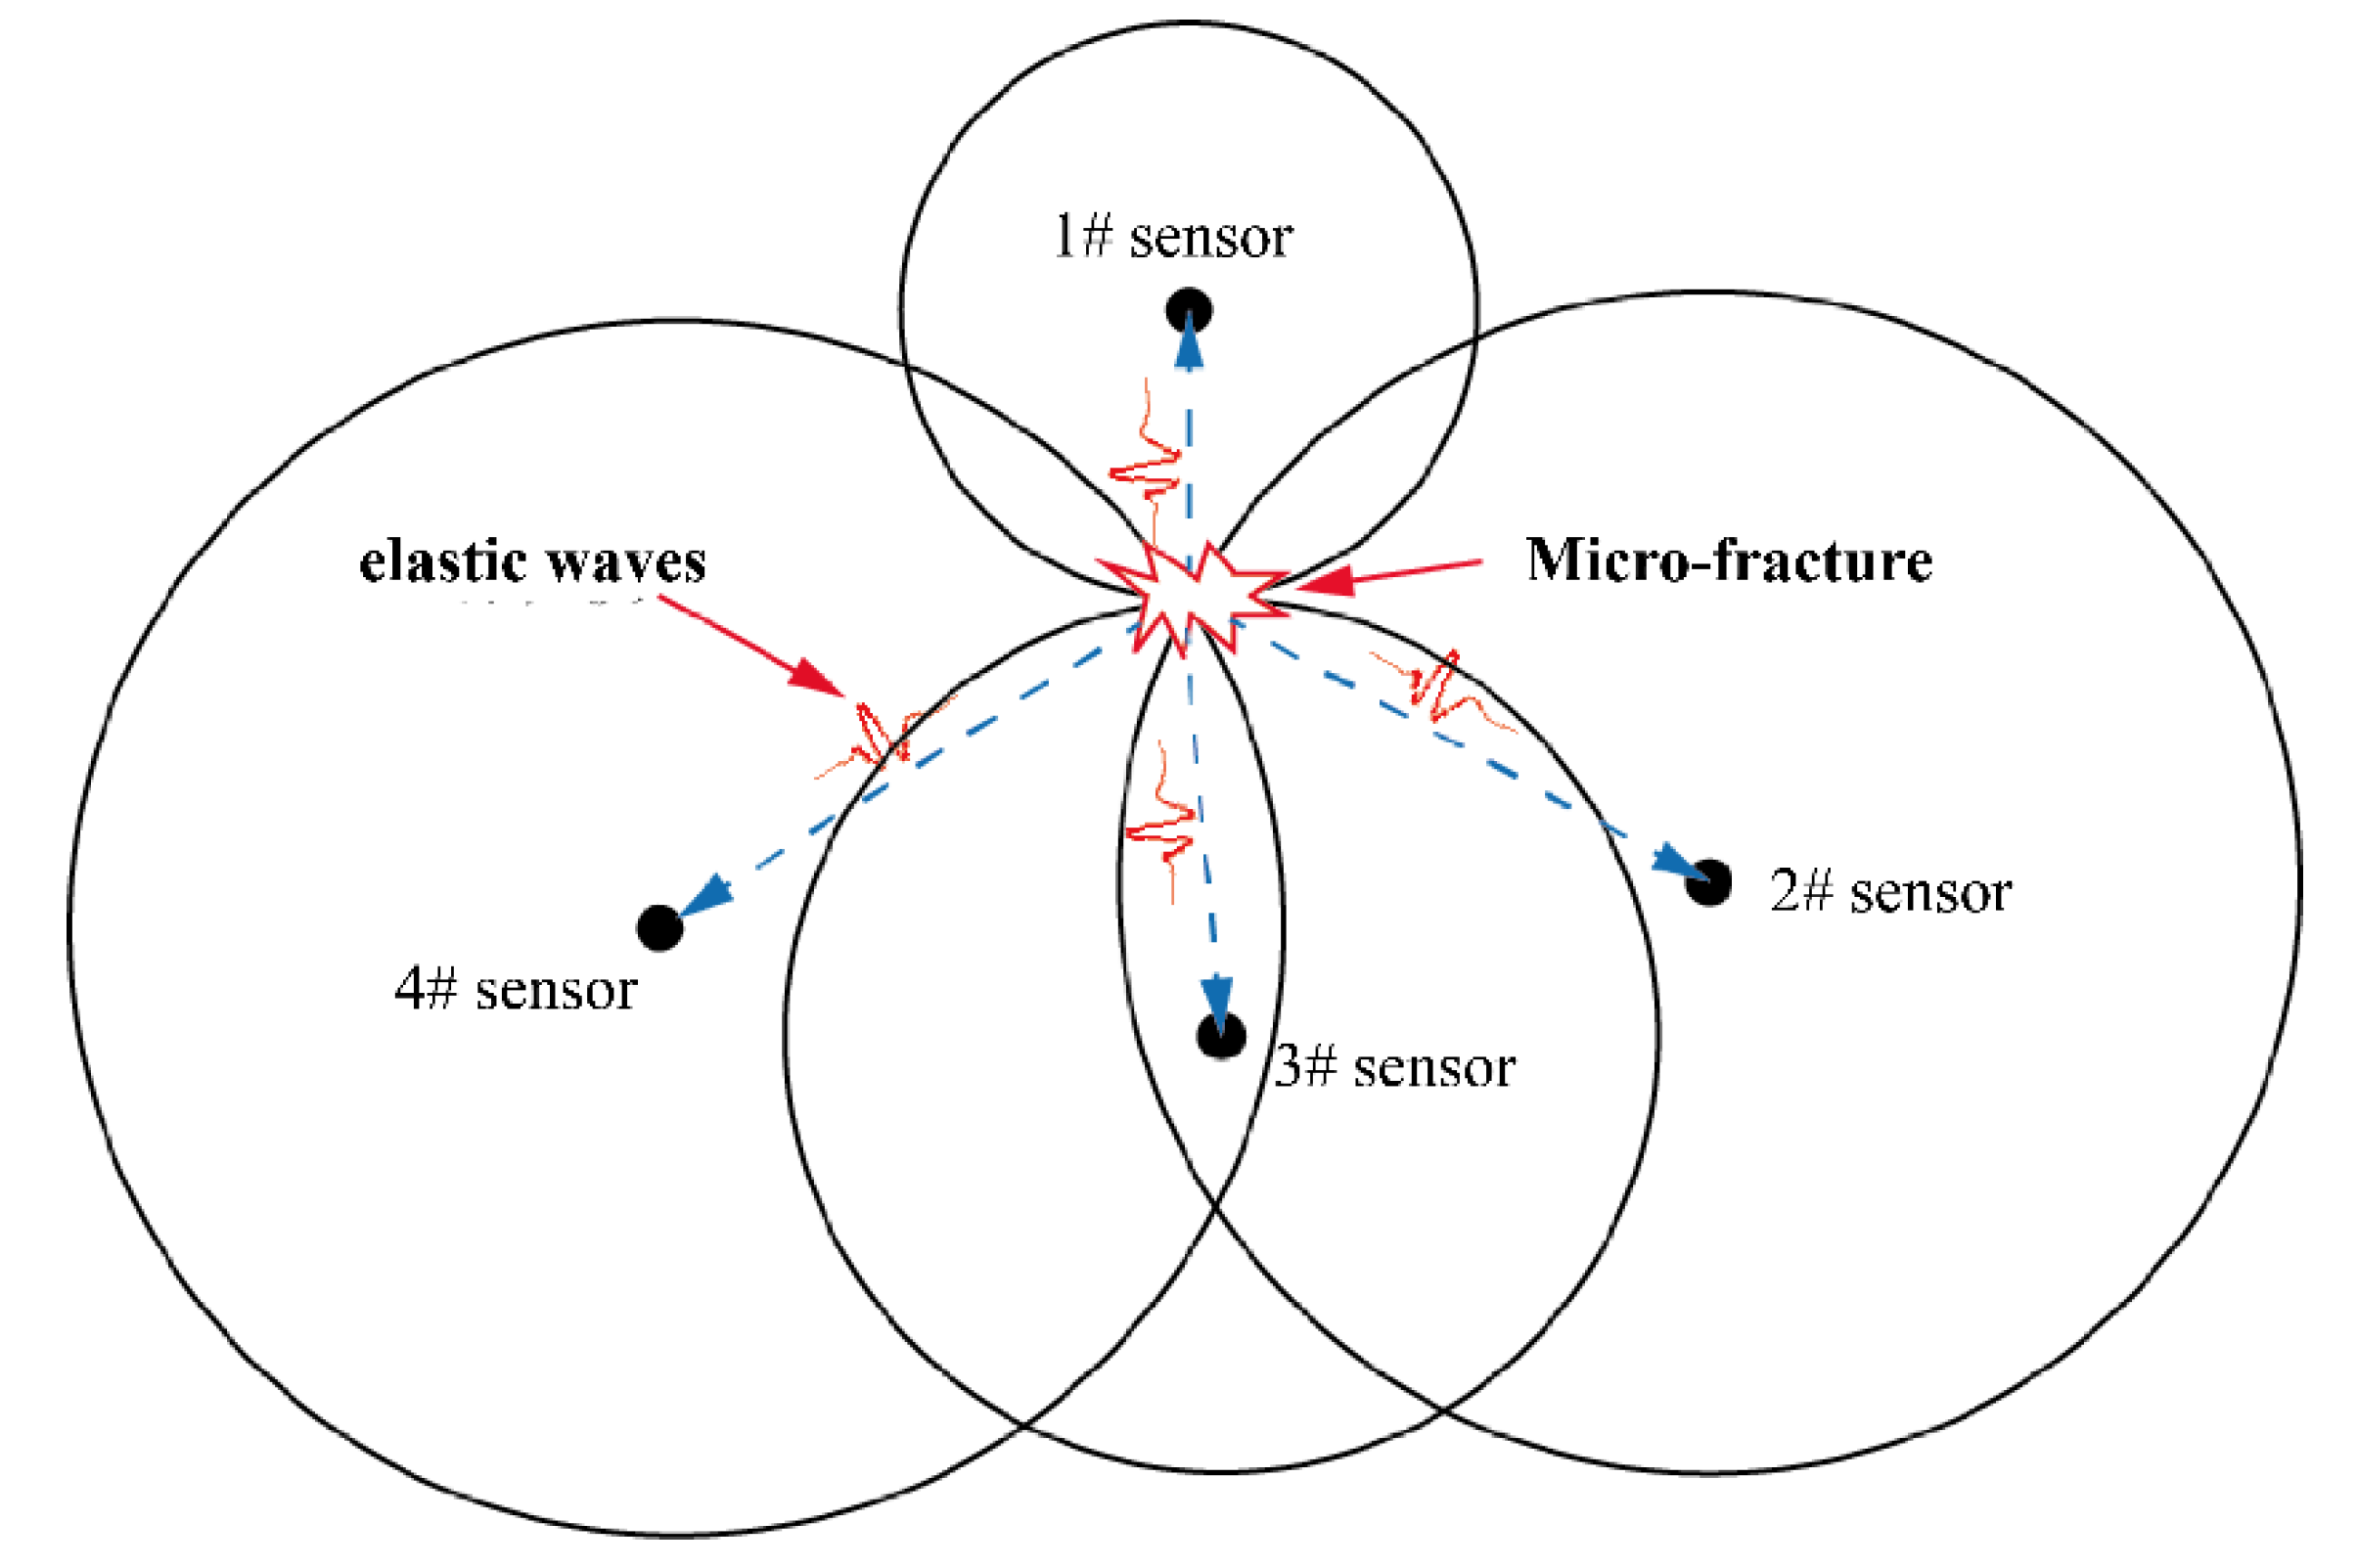
The weak structural planes (micro-fractures) contained in a discontinuous rock mass will go through a process consisting of initiation, propagation, and penetration when the stress and temperature change, and this process will release strain energy in the form of elastic waves. Such elastic waves released along with the development of micro-fractures are called microseisms, and the monitoring method of inverting seismological parameters based on elastic waves to analyze the stability of the rock mass is called MS monitoring. A valid MS event can be detected only after at least four sensors have collected valid elastic wave signals for parsing the temporal and spatial parameters (time t and spatial coordinates X, Y, and Z) from the exact starting point, as shown in
Figure 2. In addition, the collected elastic waves can also be used to invert the important source information such as the magnitude, energy released, apparent stress, and apparent volume. Therefore, the macroscopic deformation failure trend of the surrounding rock can be predicted based on the analysis of the temporal, spatial, and intensity as well as other source parameters, thus ensuring safe construction.
3.2. Construction of the MS Monitoring System
Engineering Seismology Group (ESG), one of the top producers of MS monitoring systems worldwide, is the company that made the MS monitoring system used in this project. Its MS monitoring equipment is widely used because of its high applicability. The MS monitoring system for the spillway tunnel of the Jinchuan hydropower station was composed of hardware and software. The hardware part mainly consisted of (1) uniaxial acceleration sensors for signal pickup, (2) Paladin data acquisition substations for signal acquisition, and (3) a Hyperion data processing system for signal processing. The software part mainly consisted of (1) HNAS software for real-time signal acquisition and recording, (2) WaveVis software for waveform processing and analysis, and (3) Seisvis software for 3D visualization of MS information.
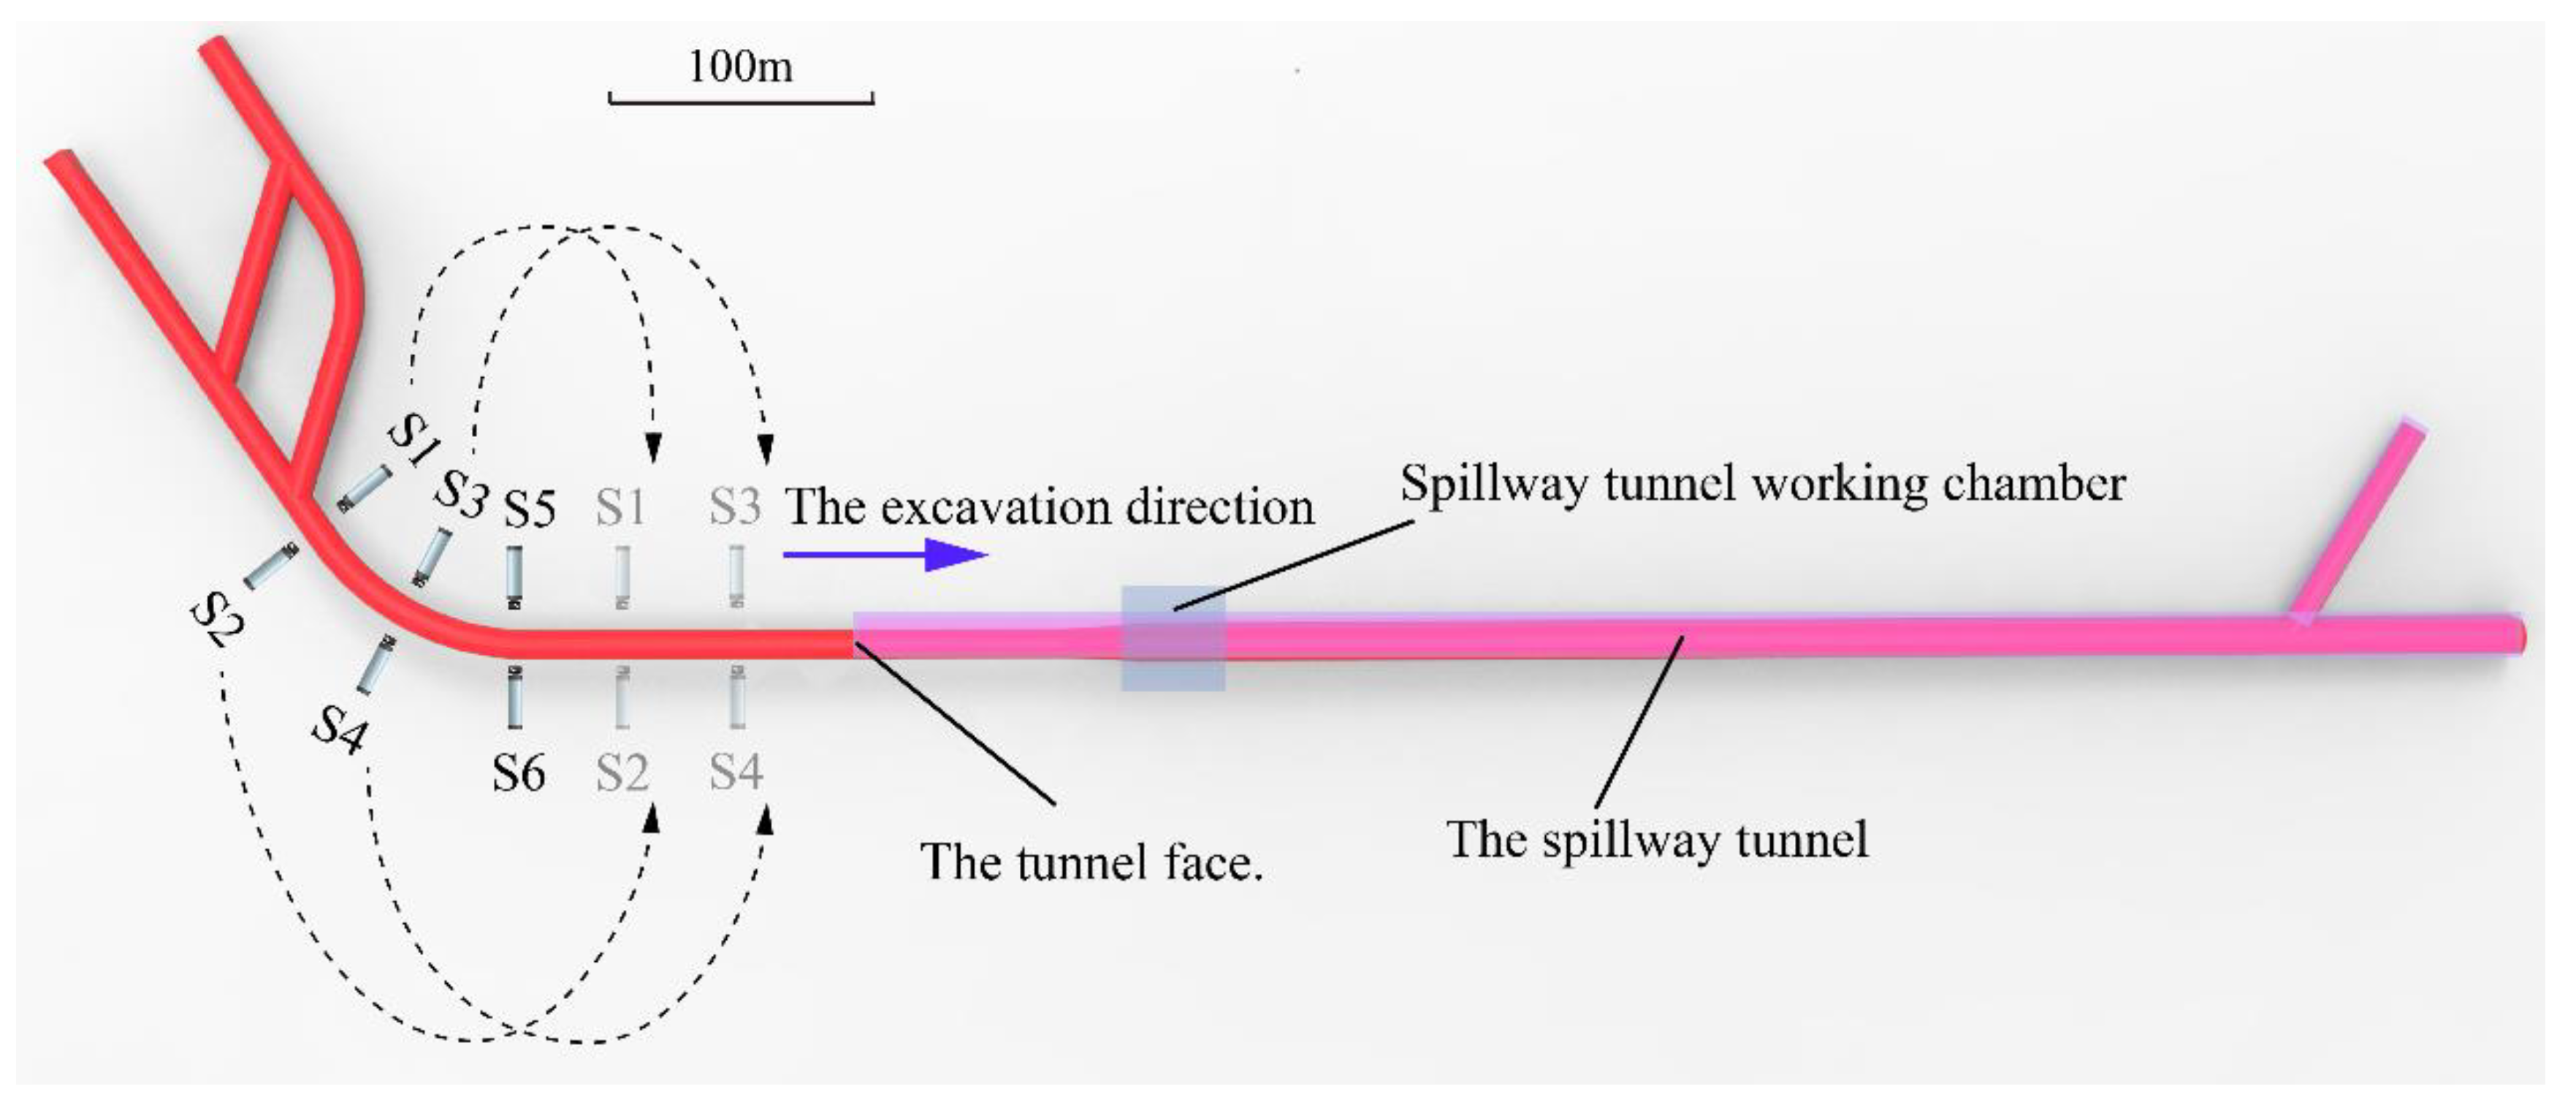
With the geological conditions and site construction status of the spillway tunnel in the Jinchuan hydropower station taken into account, six acceleration sensors were installed on the side walls of three different sections, respectively, behind the tunnel face. These six sensors were placed at different altitudes to create a spatial mesh structure, and they had to move forward with the tunnel face as the project advanced to ensure that the vicinity of the tunnel face was in the effective range of the MS monitoring system. In particular, when the tunnel face advanced a certain distance, the two sensors farthest away from the tunnel face (for example, #1 and #2 in
Figure 3) would be moved to be closest to it, and so on.
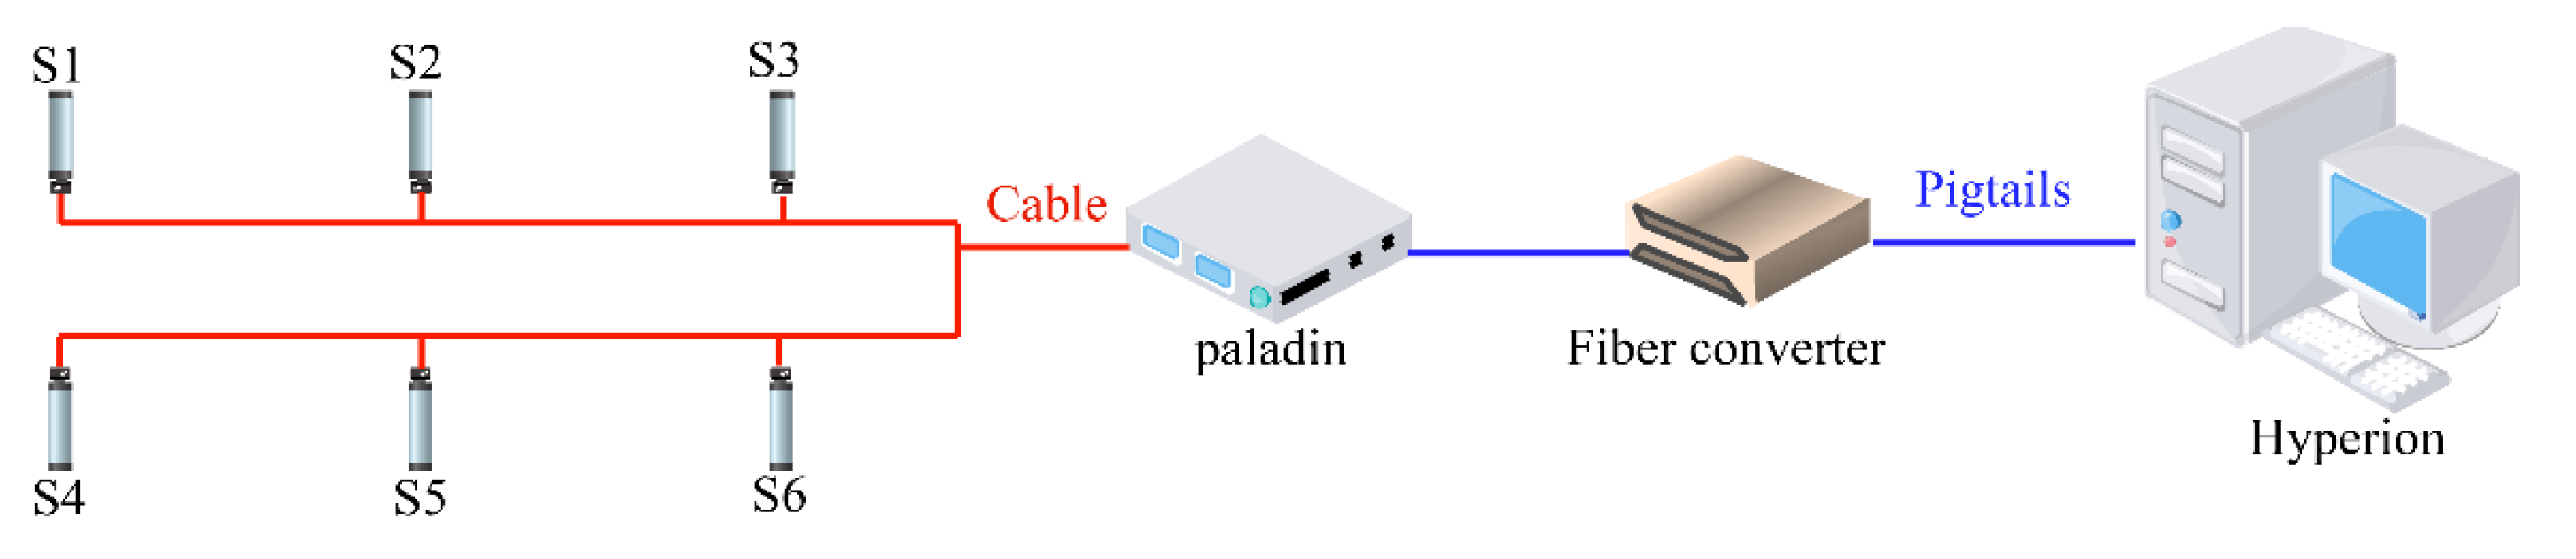
Figure 4 shows the spatial topology of the MS monitoring system for the spillway tunnel project in the Jinchuan hydropower station. The six sensors could provide 24-h continuous monitoring of the micro-fractures near the tunnel face during the excavation of the spillway tunnel in real time. In particular, the sensors converted the received micro-fracture elastic wave signals into electrical signals that were transmitted to the Paladin data acquisition substation connected to the sensors through the cable. In the Paladin data acquisition substation, the electrical signals were converted into digital signals. Then, the converted digital signals were transmitted to the Hyperion signal processing host connected to the Paladin data acquisition substation via the optical fiber.
3.3. MS Signal Noise Reduction
The monitoring system often works in a pretty noisy environment, and the signals picked up by each channel contain a lot of external noises, which seriously interfere with the subsequent research work such as P-wave and S-wave first-arrival pickup, source localization, and source mechanism interpretation. Therefore, it is necessary to reduce noises in MS signals. This paper provides complementary ensemble empirical mode decomposition (CEEMD), compressed sensing (CS), and soft thresholding (ST) methods for reducing noises in MS signals. Generally, the steps are as follows:
First, the CEEMD method was adopted to decompose MS signals containing noises into multiple intrinsic mode function (IMF) components by frequency from high to low and to perform cross-correlation analysis on each IMF component and the original signals, thus identifying the boundary IMF between noises and signals. Next, the IMF components containing noises were decomposed into sparse signals using the discrete wavelet transform (DWT) and reconstructed using the CS method, so that the reconstruction coefficient θ was obtained. Then, soft thresholding was performed to filter θ values, thus filtering out the sparsity coefficients corresponding to most of the noises. Finally, the IMF components with noise reduction were reconstructed using the inverse discrete wavelet transform (IDWT) and recombined with the remaining IMF components to achieve the effective noise reduction in MS signals.
In this paper, three groups of MS signals containing noises were randomly selected from the monitoring data for analysis. To facilitate calculation and comparison, the main MS signals were intercepted from each group of 30,000 sampling points. In particular, the MS signals were intercepted from sampling points No. 8000–18000. Therefore, the signals at each group of 10,000 sampling points had the same wavelength, and the fast Fourier transform (FFT) could be used for time and frequency analysis, which could judge the noise reduction effect of MS signals more intuitively. The methods in this paper were adopted to reduce noises from the three groups of MS signal waveforms.
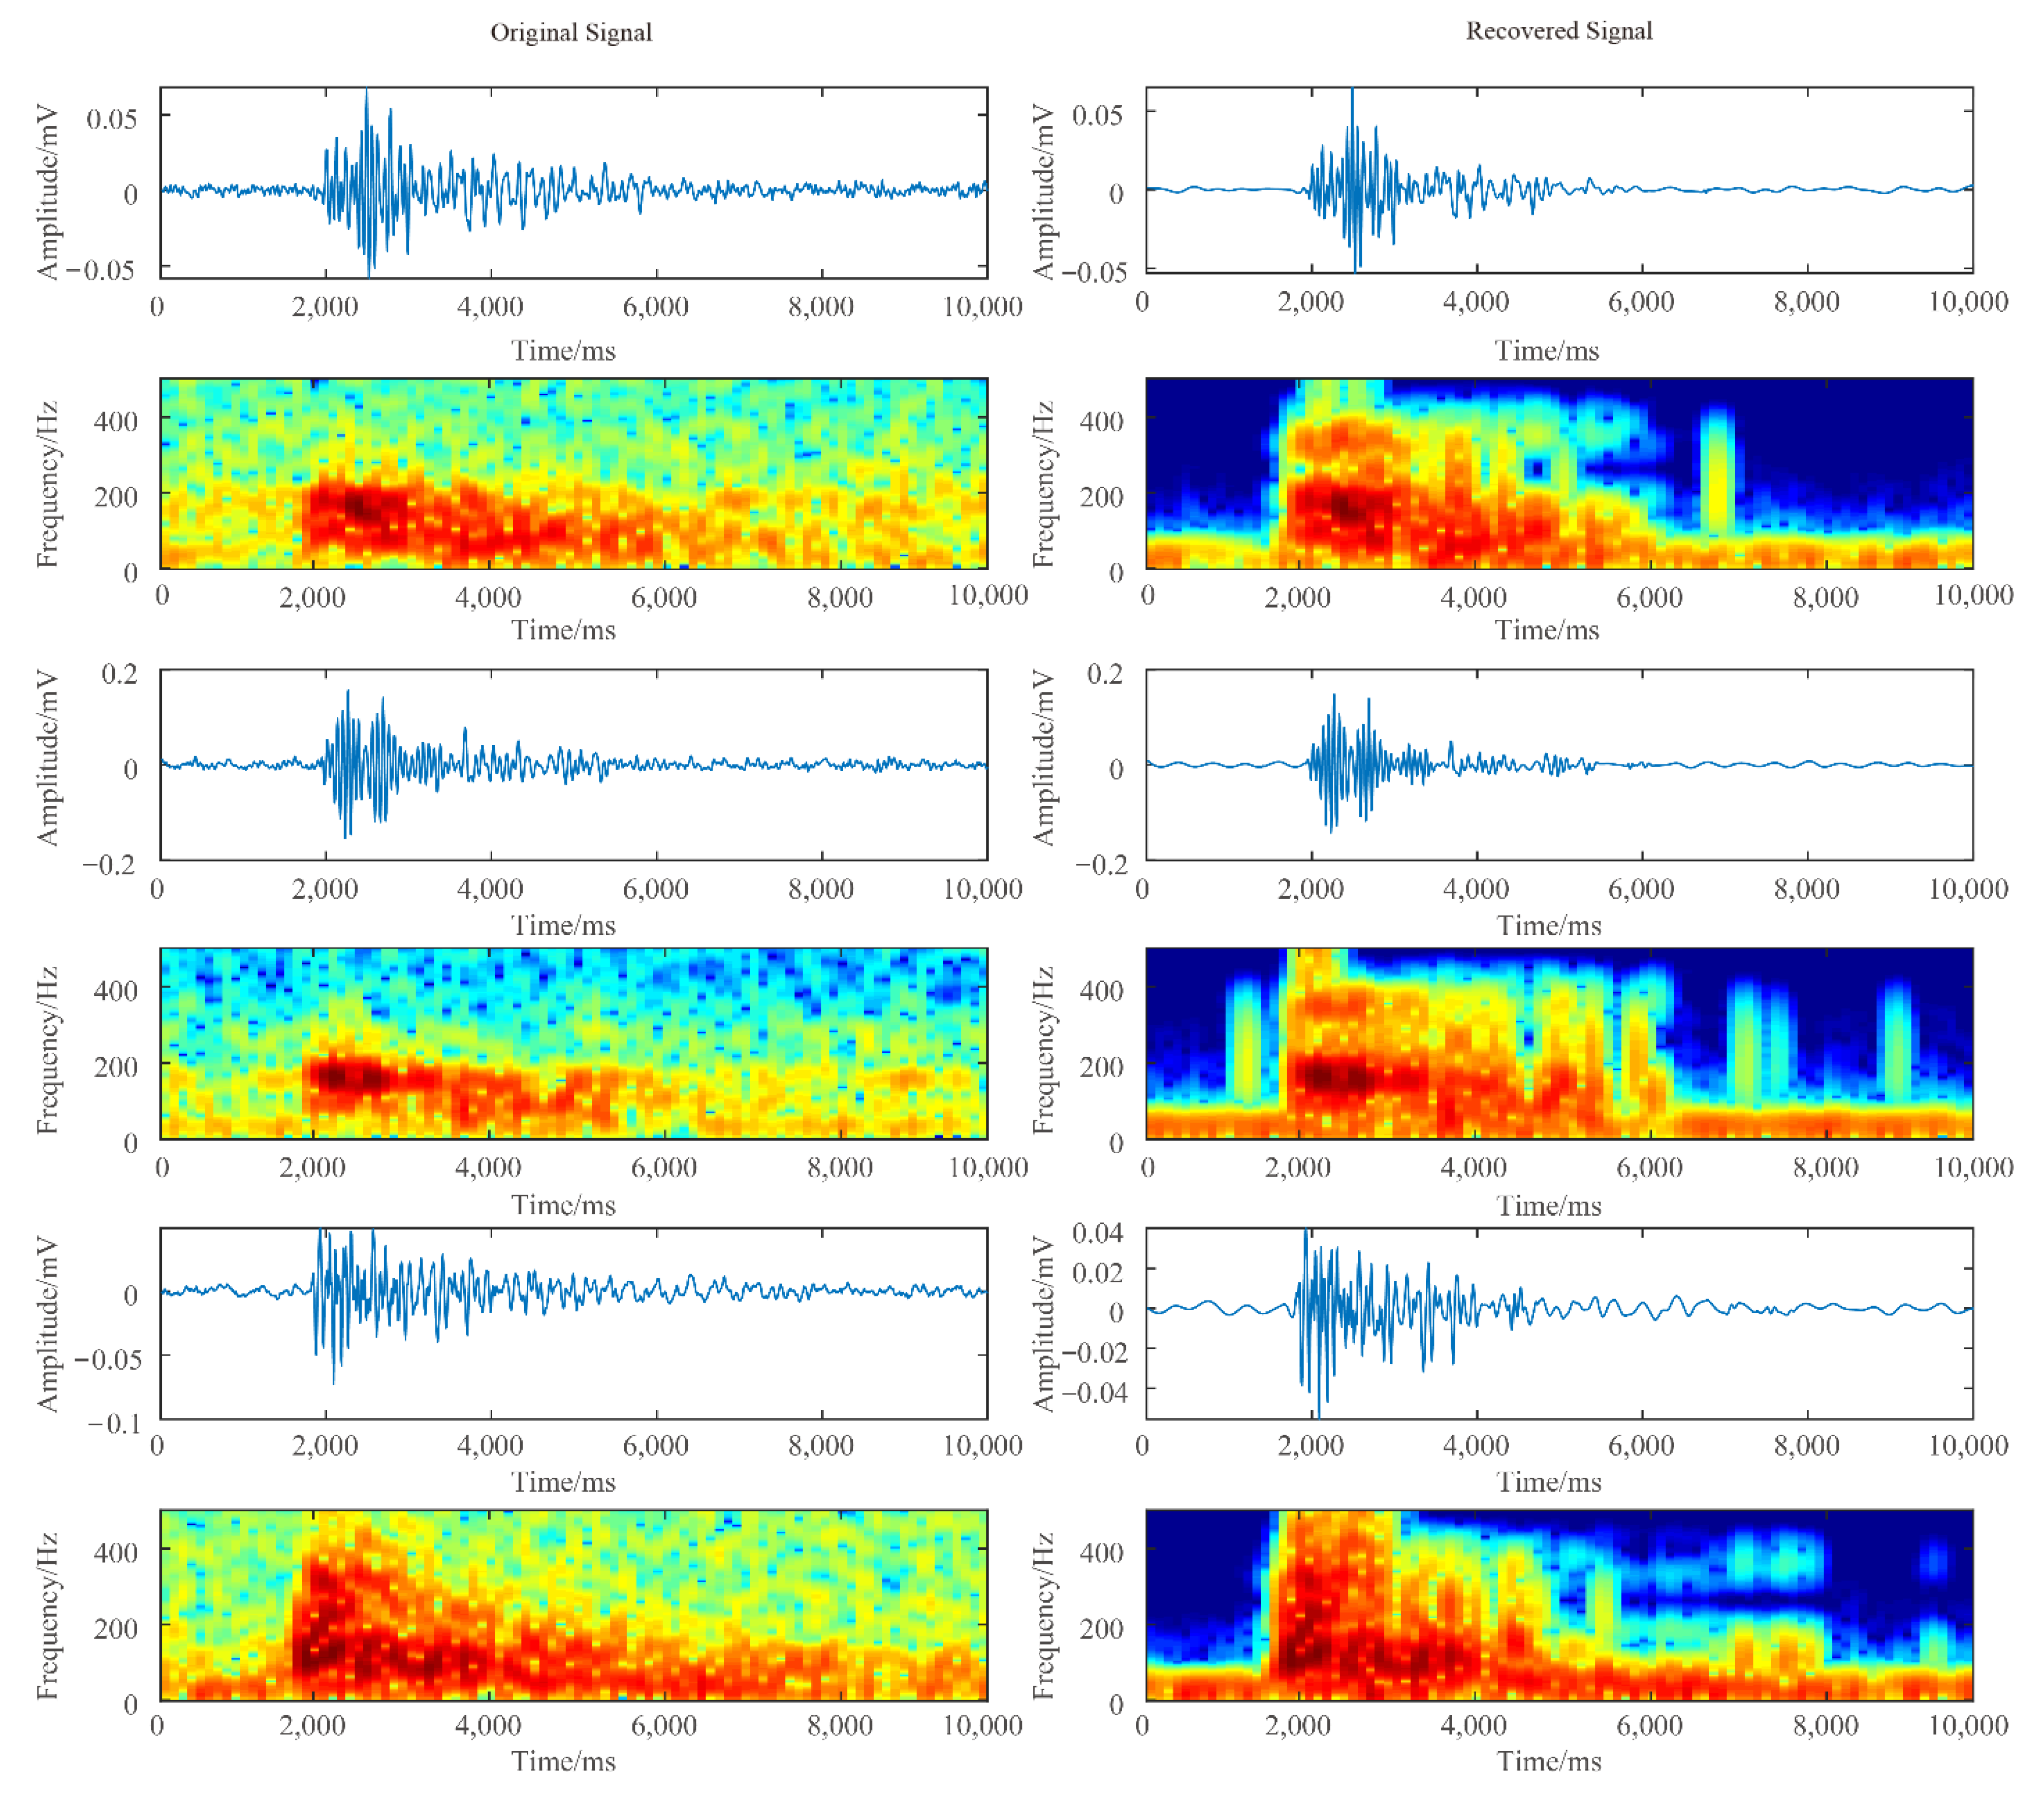
Figure 5 shows the waveforms and time-frequency spectra before and after noise reduction. Moreover, the signal-to-noise ratio (SNR), information standard deviation (SD), and correlation coefficient (CC) of the original signals and signals after noise reduction were calculated, and the calculation results are listed in
Table 1.
Figure 5 shows that the three groups of original MS signals all contained a lot of random noises. Although the distribution of the dominant spectrum in these signals could be seen from the time-frequency spectrum, it was not obvious due to the interference from noise, which would cause interference to the MS monitoring at a later stage. After noise reduction was made as described in this paper, the MS signal waveform and time-frequency spectrums were clearer, and the dominant spectrum was more obvious.
Table 1 shows that the SNRs of the original signals are all 0 dB, and the SNRs after noise reduction are up to 24.325 dB, that the standard deviations of the signals are all small, indicating a small deviation of the original signals from the signals after noise reduction, and that the correlation coefficients of the original signals and the signals with noise reduction are all close to 1, indicating remarkably similar waveforms between the original signals and the signals with noise reduction.
4. Study on MS Events in the Surrounding Rock during Excavation and Unloading
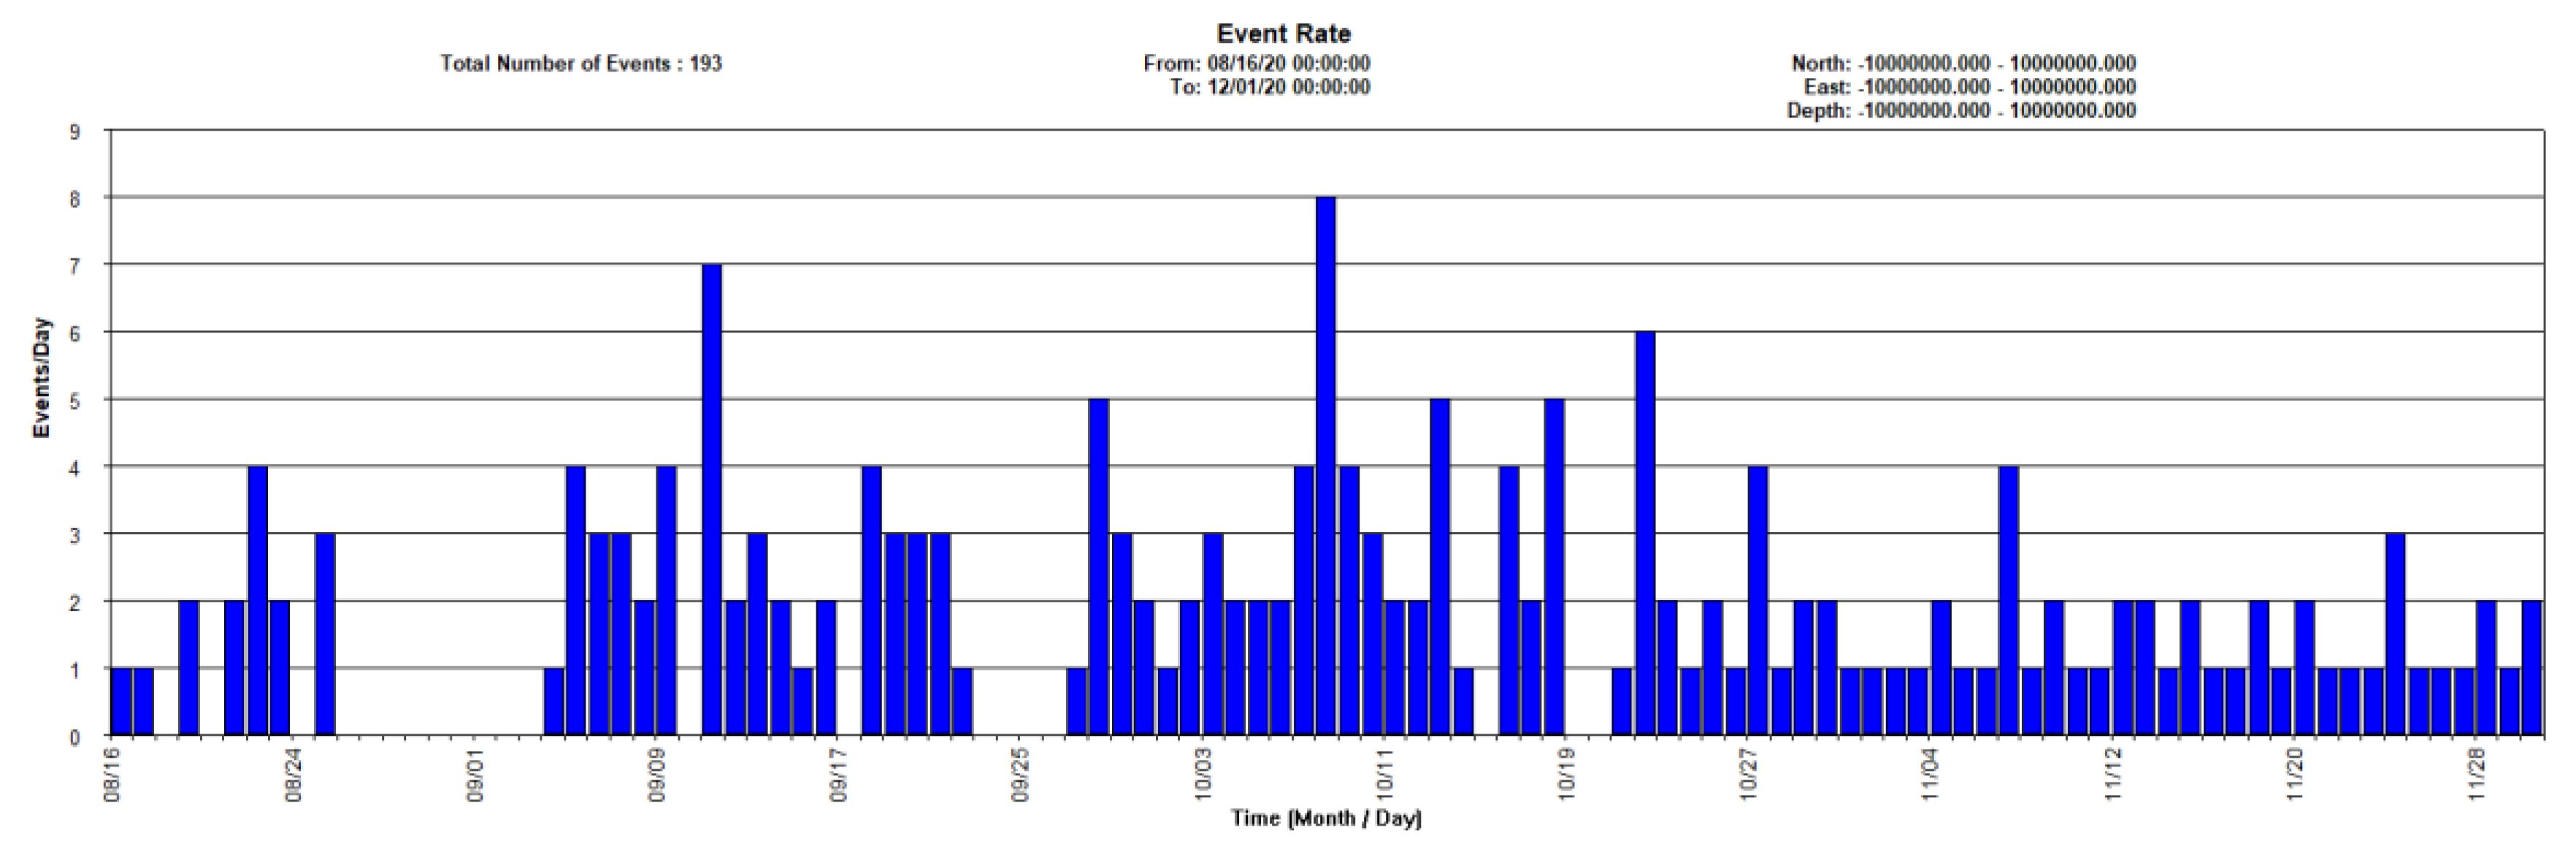
The instrument and system installation for the MS monitoring system in the spillway tunnel project of the Jinchuan hydropower station began in July 2020, and construction was formally finished at the end of August. After a trial run period and equipment debugging, the system started to run officially on 2 August 2020, which conducted 24-h dynamic real-time monitoring of the rock mass in the excavation and unloading area of the spillway tunnel. Due to complex site conditions, the signals detected by the MS monitoring system included blasting signals, mechanical signals, current interference signals, and other unknown signals in addition to rock micro-fracture signals. From 16 August to 30 November 2020, a total of 193 valid rock micro-fracture signals were picked up after signal identification, unscrambling, and removal of the remaining non-MS signals. The source parameters of the collected MS data were studied to summarize the temporal and spatial evolution characteristics of MS events in the surrounding rock during the excavation and unloading process of the spillway tunnel project.
4.1. Temporal Evolution Characteristics of MS Events
Figure 6 shows the temporal distribution of daily MS events in the spillway tunnel project of the Jinchuan hydropower station. It can be seen that, despite the uneven distribution of MS events over time during the monitoring period, these events can generally be divided into three stages. To be specific, the first stage saw a general increase in the number of MS events and a gradual increase in the cumulative energy; the second stage saw a significant increase in the cumulative energy and a wide range in the number of MS events, from 0 to 6; and in the third stage, the number of MS events was generally 1 or 2 and remained low while the cumulative energy initially increased significantly and then tended to level out.
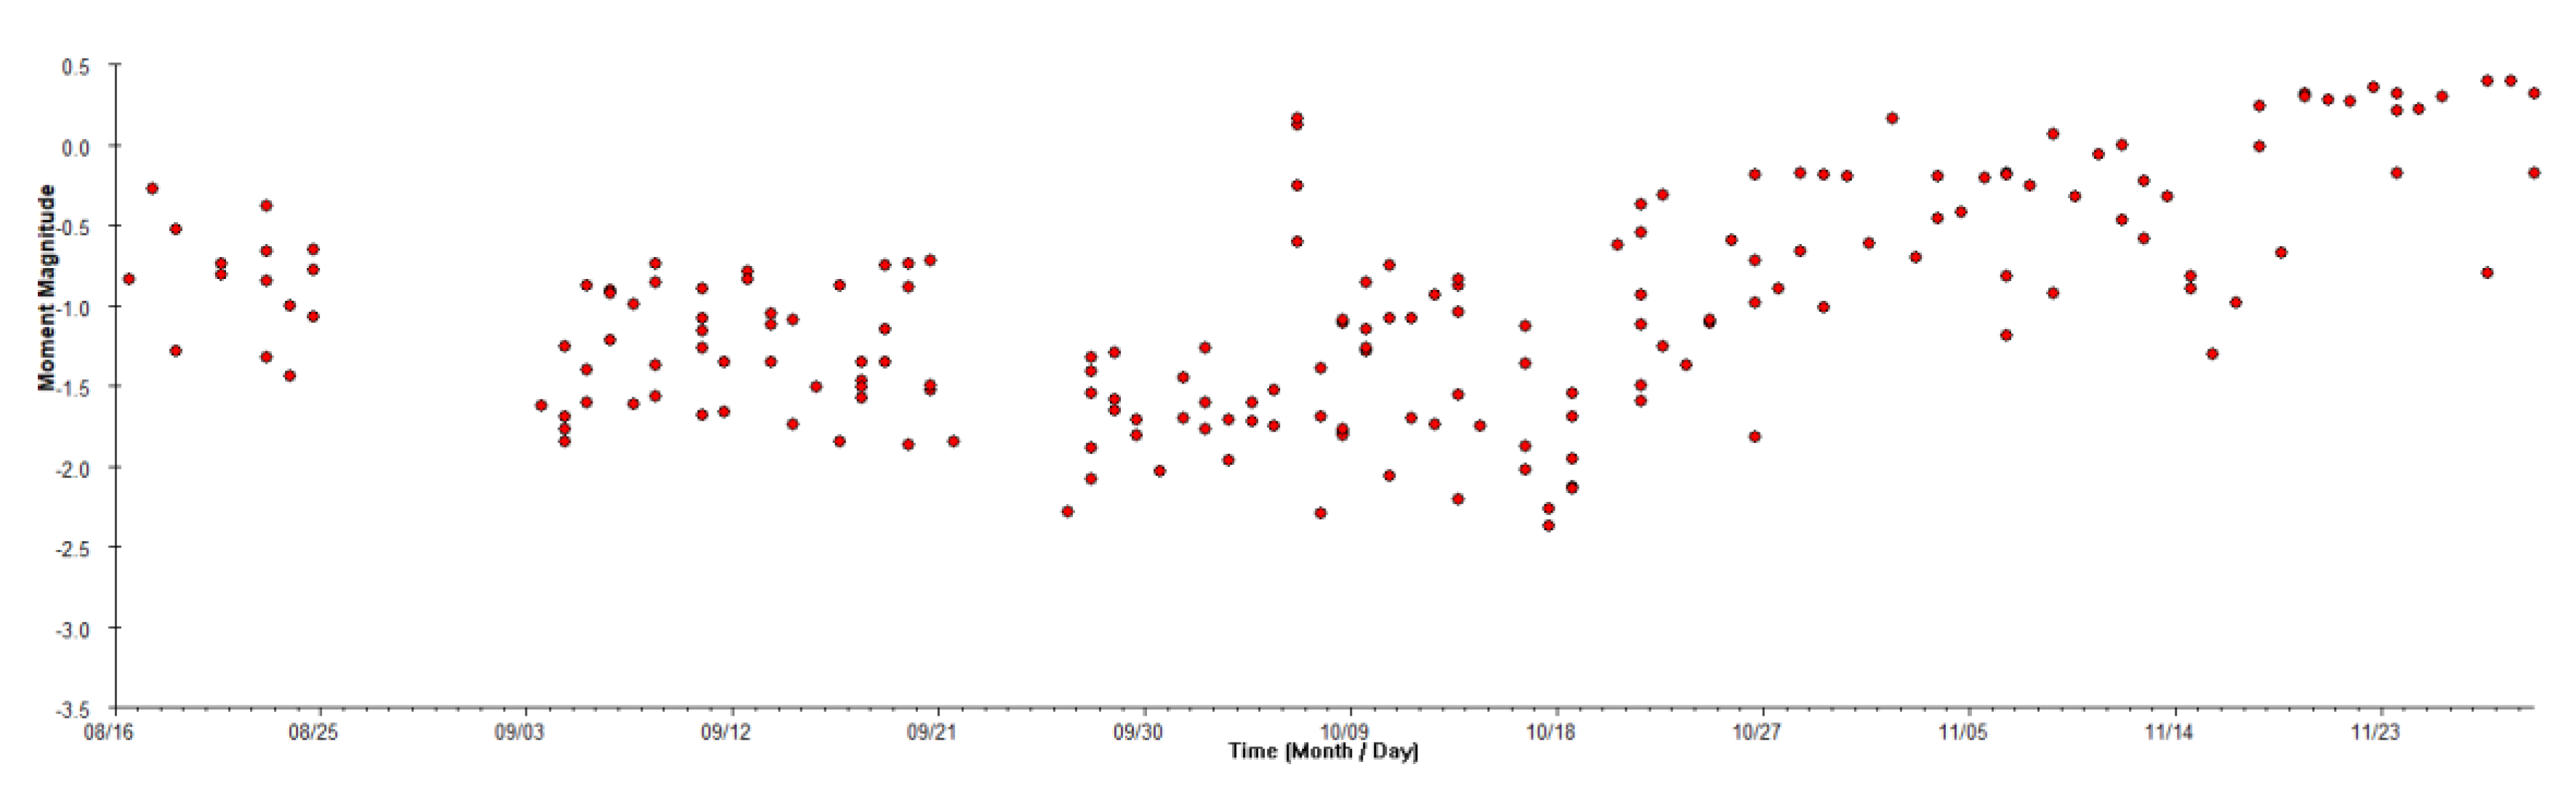
Figure 7 shows the temporal evolution of the moment magnitude of MS events. It can be seen that the moment magnitude of MS events in the surrounding rock of the spillway tunnel mainly ranged from −2.5 to 0.5, maintaining an overall low level. Note that after the completion of excavation and support of the working chamber of the spillway tunnel, the moment magnitude of MS events was distributed in a concentrated manner in the excavation stage of the unpressurized section of the spillway tunnel, ranging from −1.0 to 0.5. In this stage, the surrounding rock was mainly affected by excavation and unloading, as well as the higher-frequency blasting excavation of the adjacent diversion tunnel. Despite a decrease in the quantity of MS events, the moment magnitude was greater and more concentrated, and the level of energy dissipation increased.
4.2. Spatial Evolution Characteristics of MS Events
The MS events characterize micro-fractures inside the surrounding rock, so the spatial concentration of MS events and the dynamic migration of the concentration zone characterize the evolution of micro-fractures inside the rock mass. Therefore, the study on the spatial concentration and dynamic migration of MS events can reveal the development of micro-fractures inside the surrounding rock, so as to delineate the damage zone and circle the risk area of the surrounding rock deformation to ensure the safety and efficiency of site construction.
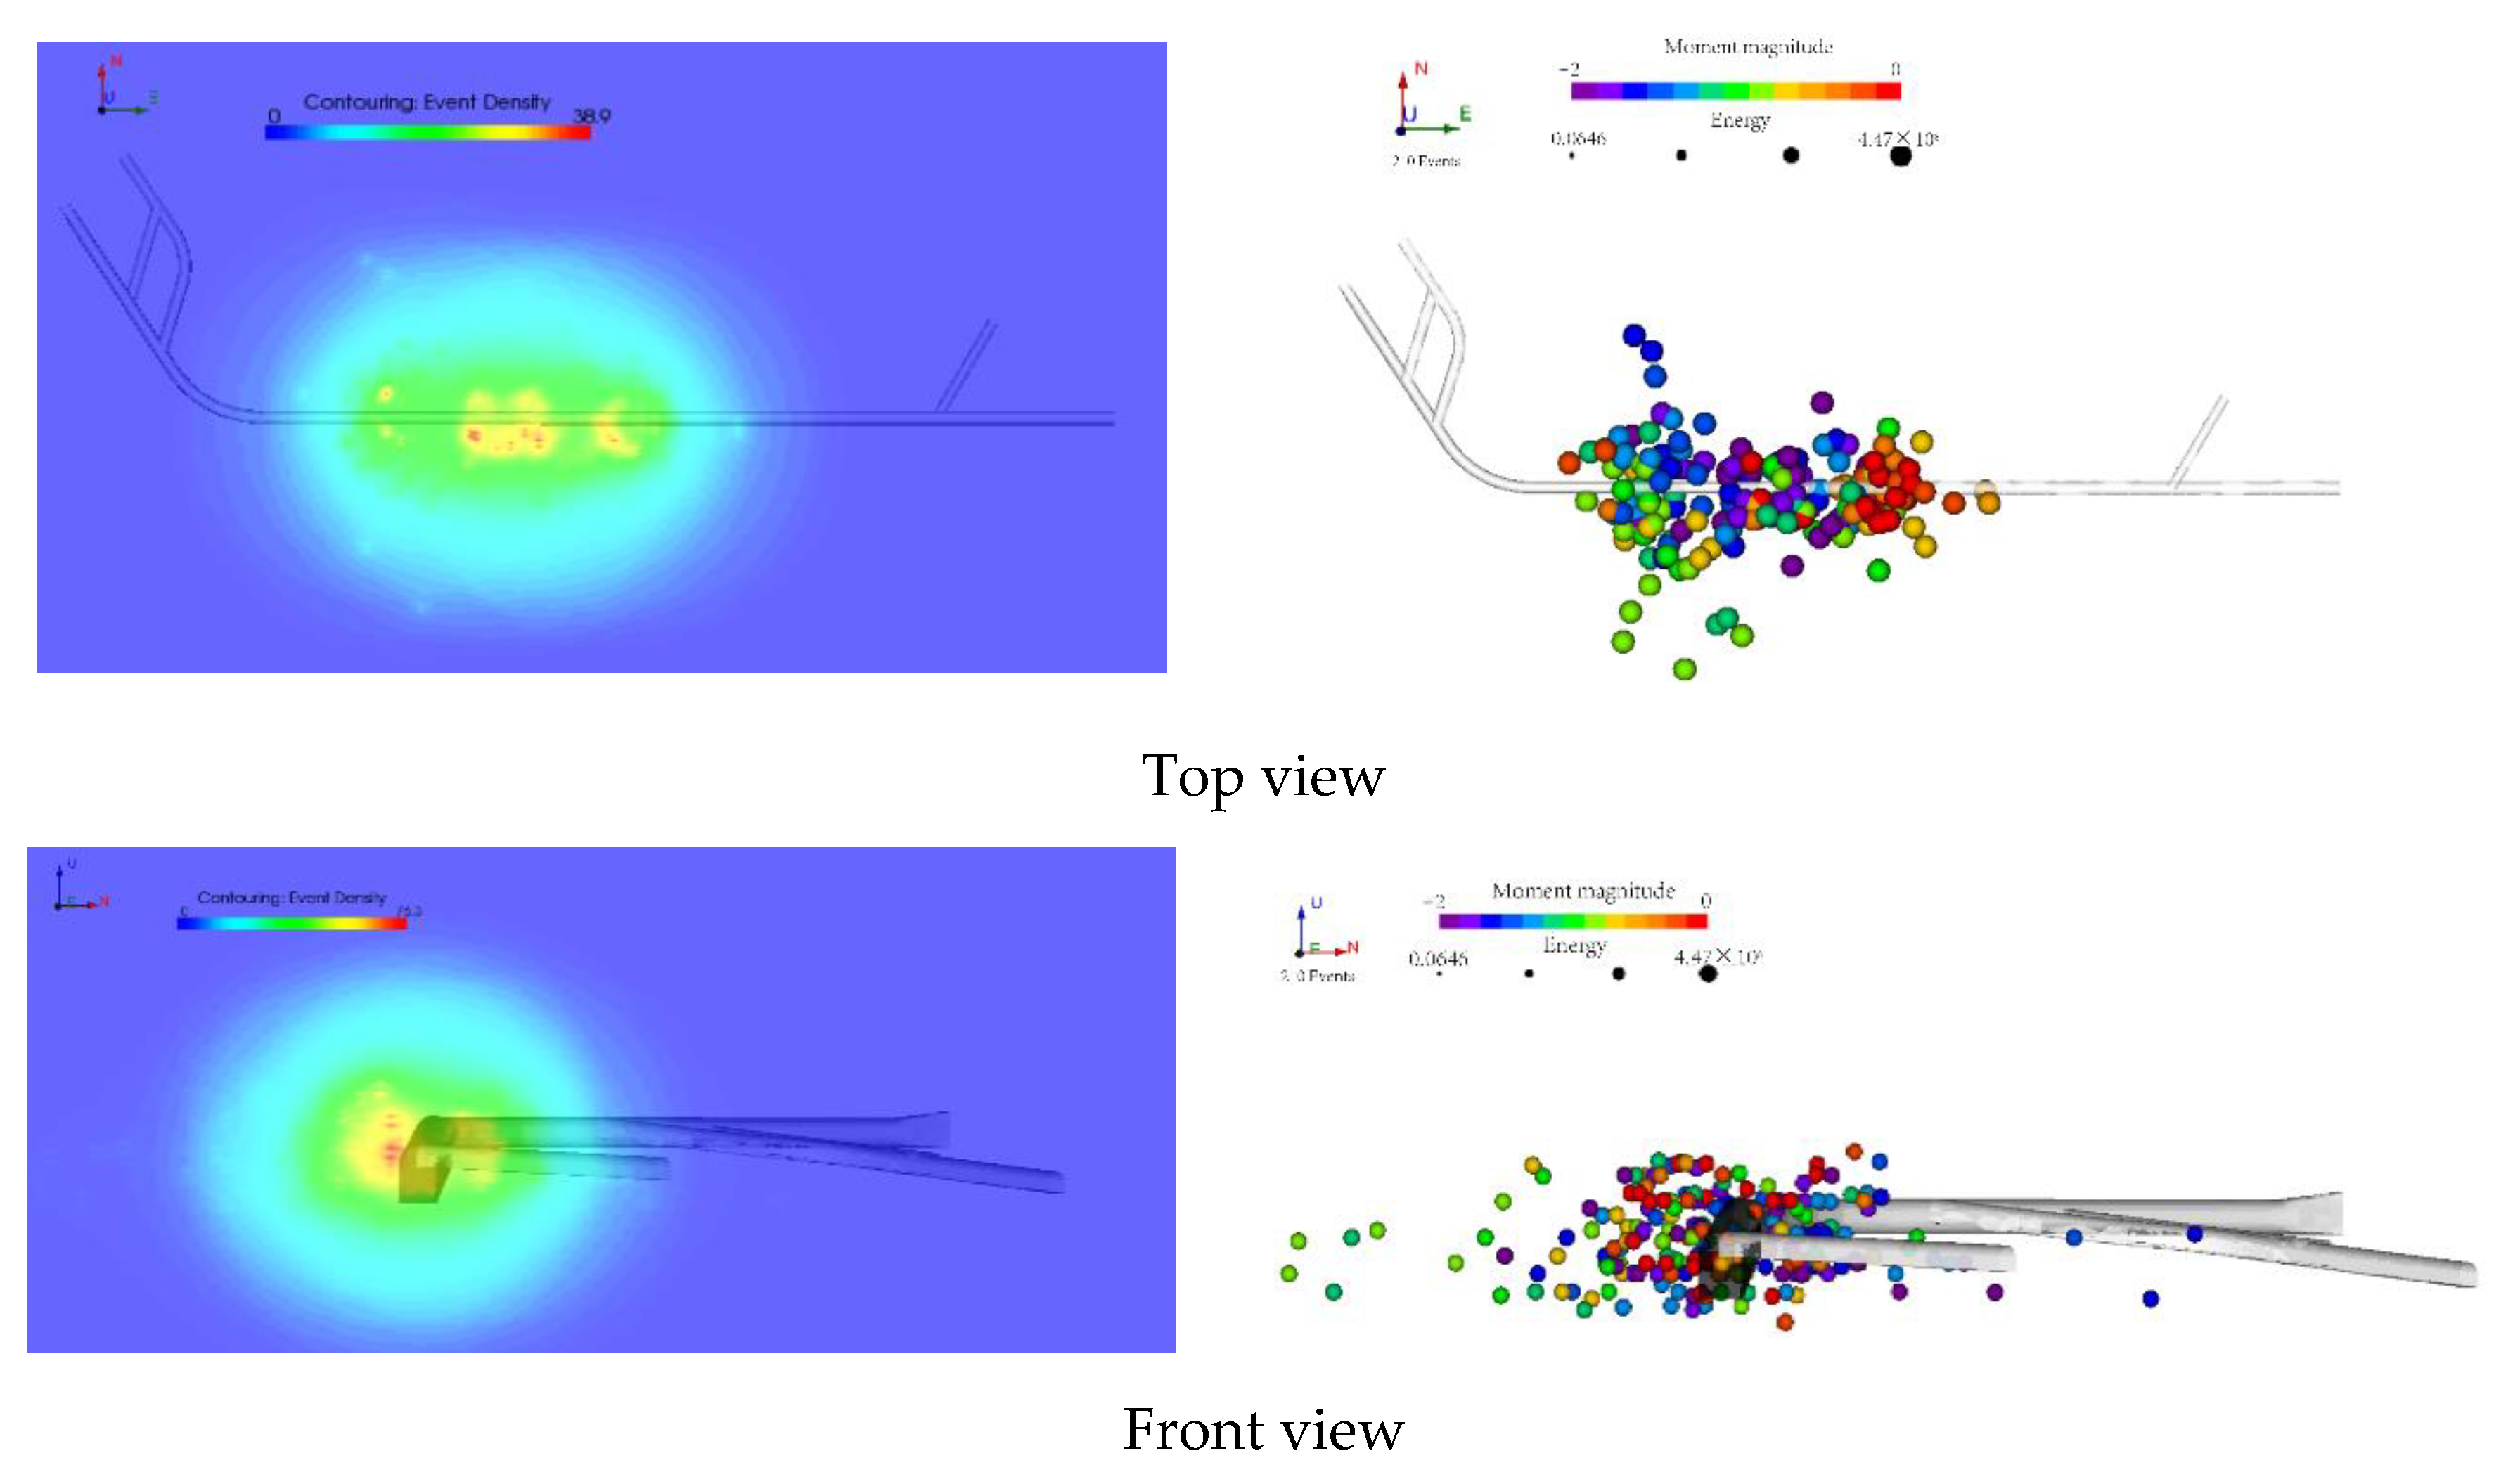
Figure 8 shows the spatial distribution diagram and density cloud diagram of MS events. In the spatial distribution diagram, the filled circles indicate MS events; the size of the filled circles indicates the energy level of the MS events; the color of the filled circles indicates the moment magnitude of the MS events. In the density cloud diagram, different colors indicate different densities of MS events. Analysis of the figure shows the spatial distribution law of MS events intuitively. In particular, according to the top view, MS events are mainly distributed in the surrounding rock on both sides of the spillway tunnel, mainly concentrated in three areas, stakes 0+340 m, 0+400 m to 0+450 m, and 0+500 m to 0+540 m. With the excavation and unloading of the spillway tunnel, micro-fractures concentrated in the area of poor geological structures and the area disturbed by strong unloading under the influence of stress adjustment, which is consistent with the law presented in the spatial distribution diagram and density cloud diagram of MS events.
4.3. Fracture and Damage Mechanism of the Surrounding Rock
The seismological theory holds that the ratio of S-wave energy to P-wave energy (ES/EP) is regarded as an important indicator to study the type of rock fractures, and this indicator is often used in MS monitoring to analyze the fracture and damage mechanism of the surrounding rock. In the field of MS monitoring, both ES and EP can be calculated by using the following formula:
where
ρ is the rock density (kg/m
3);
c is the wave velocity (m/s);
r is the distance from the source to the sensor (m);
Jc is the integral of the particle motion velocity;
Fc is the empirical coefficient of seismic wave radiation types, usually Fα = 0.52 (P-wave) and Fβ = 0.63 (S-wave) in the case of unknown source mechanism [
25].
A lot of research work has been carried out at home and abroad on the ES/EP value of MS signals. According to Boatwright [
26], the ES/EP value was greater than 10 for fault-slip and shear failure, less than 3 for non-shear failure, and ranging from 3 to 10 for mixed failure.
Figure 9 shows the distribution of the ES/EP value of MS events in the spillway tunnel. The figure shows that the ES/EP value was less than 3 for 32.7% of the MS events, less than 10 for 88.2%, greater than 10 for only 11.8%, and ranging from 3 to 10 for more than half. Thus, the failure mode in the surrounding rock of the spillway tunnel was mainly tensile failure and mixed failure, with traces of shear failure. Due to the excavation of the spillway tunnel, a free face was formed on the side wall, and the surrounding rock completed stress self-adjustment due to horizontal unloading, which was prone to tensile failure.
4.4. MS Activity Controlled by Adverse Geological Structures
The concentration zone is now specifically examined for further study after the temporal and spatial dispersion characteristics of microseisms were examined in
Section 4.2.
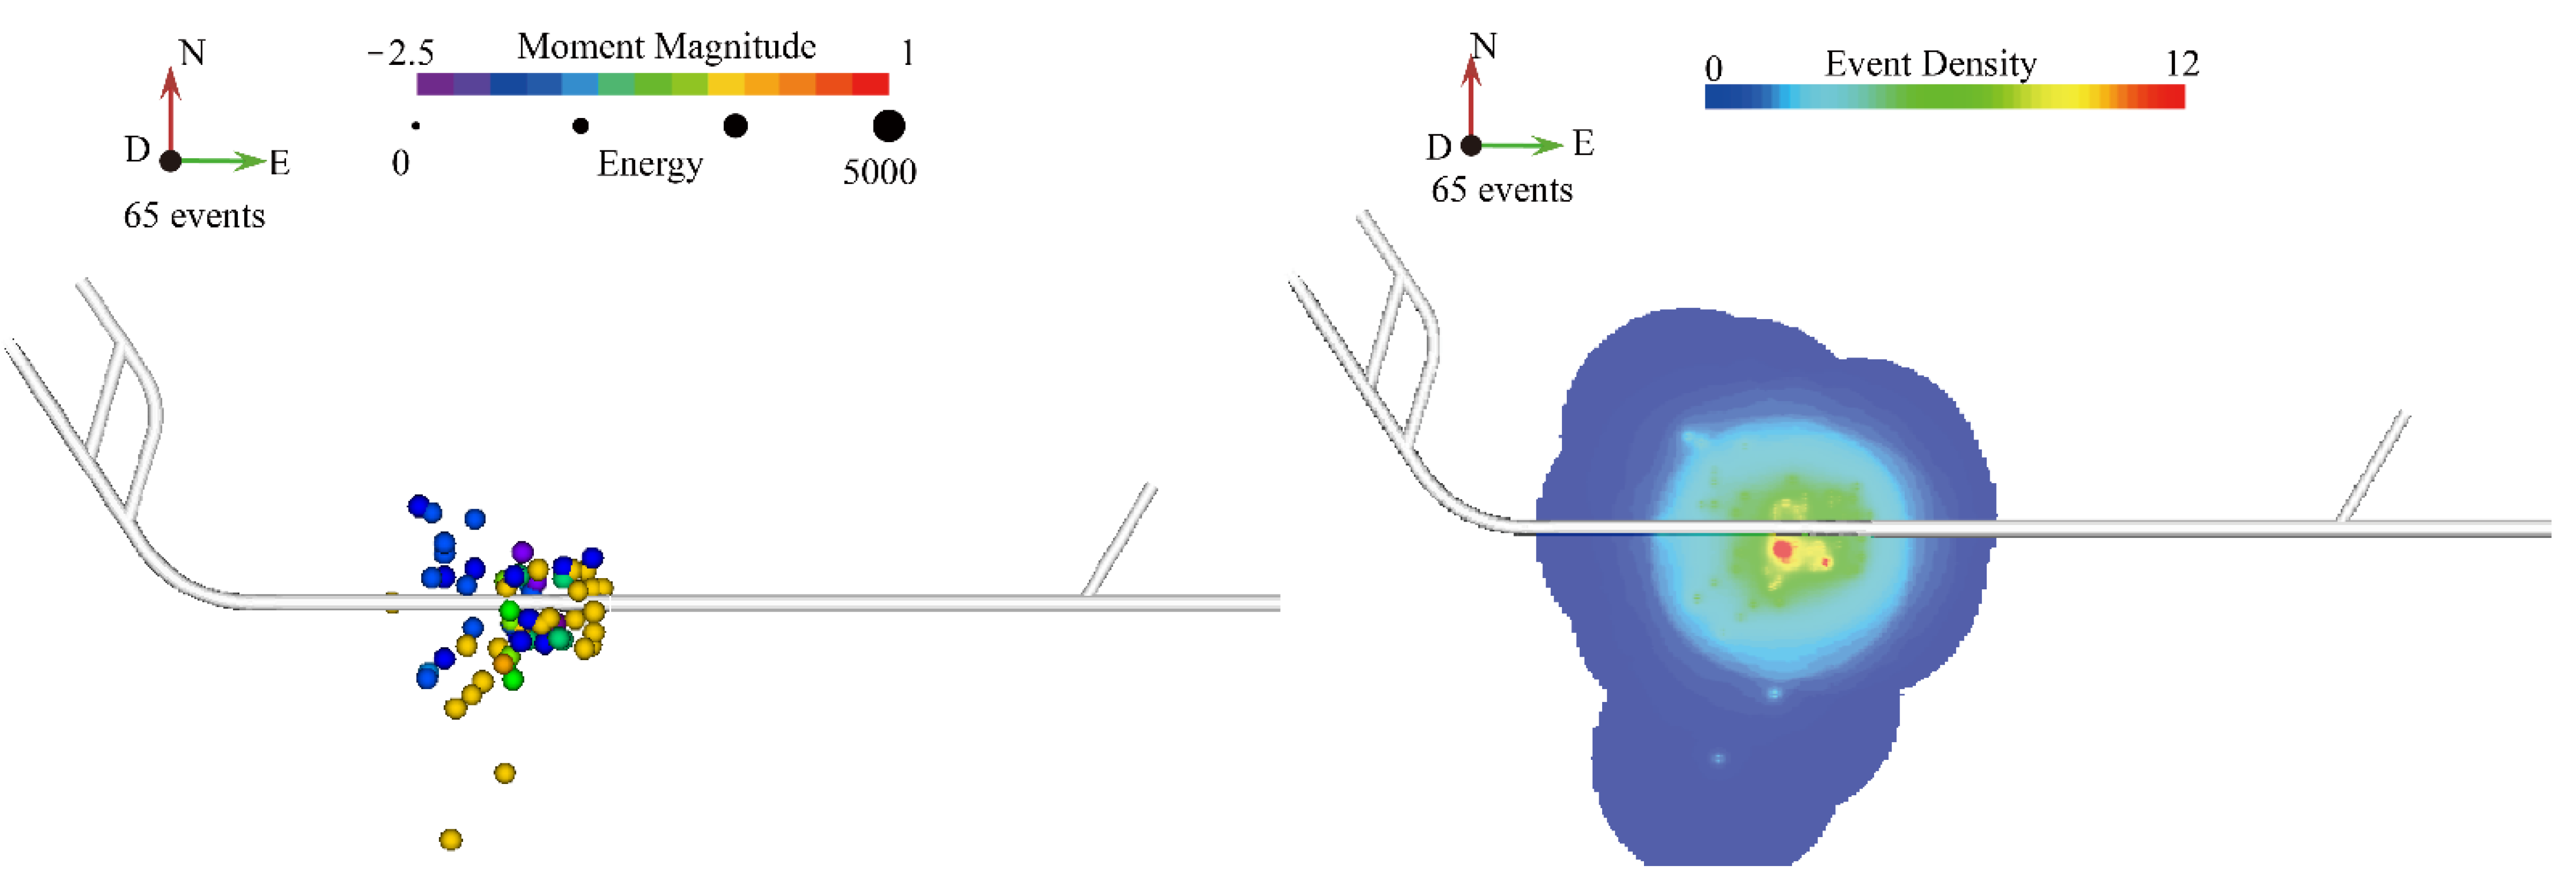
The research period from 15 September to 11 October 2020, was selected. During this period, blasting and excavation at the working chamber (stakes 0+340 m to 0+450 m) were carried out in the spillway tunnel. The engineering geological drawing (as shown in
Figure 10) shows that this area intersected with faults f27 and f31.
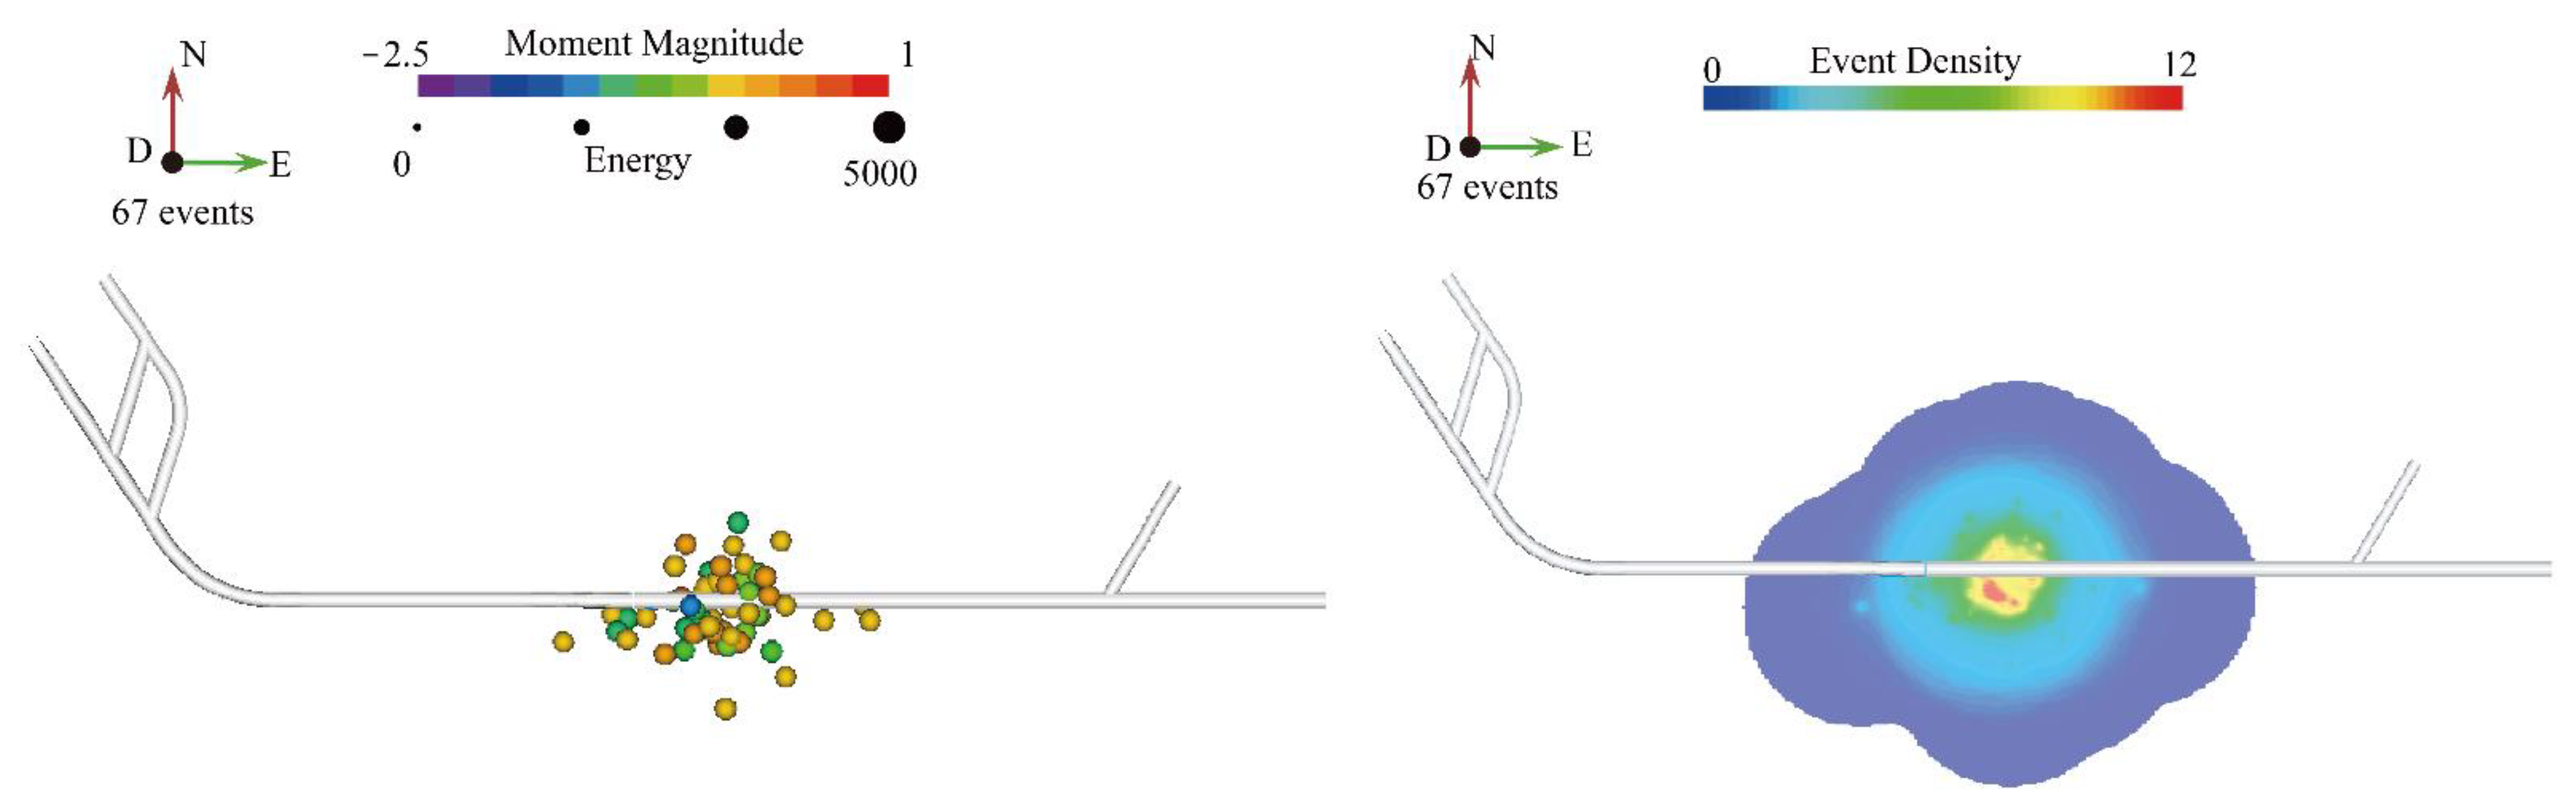
Figure 11 shows the distribution and density cloud diagram of MS events that occurred when the excavation of the spillway tunnel reached the area controlled by adverse geological structures. A total of 65 MS events were induced during the excavation and unloading process. In this period, due to the influence of excavation disturbance and adverse structural planes, stress concentration tended to occur at the intersection of multiple faults, which led to the concentration of MS events with greater magnitudes within the control range of the structural plane.
The fracture mechanism of MS events induced during this period was analyzed.
Figure 12 shows the ratio of S-wave energy to P-wave energy (ES/EP) of MS events controlled by adverse geological structures. It can be seen from
Figure 12 that the ES/EP value was less than 3 for only 12.1% of the MS events, greater than 3 for 87.9%, and greater than 10 for 31.8%. Therefore, the failure mode of MS events controlled by the adverse geological structure of the spillway tunnel was mainly shear failure, with traces of tensile failure. Analysis of the reasons indicated that the low mechanical strength of the fault and the nearby rock mass made it simple for cracks to develop along the direction of the fault plane and led to shear failure during the excavation and unloading and stress adjustment of the spillway tunnel.
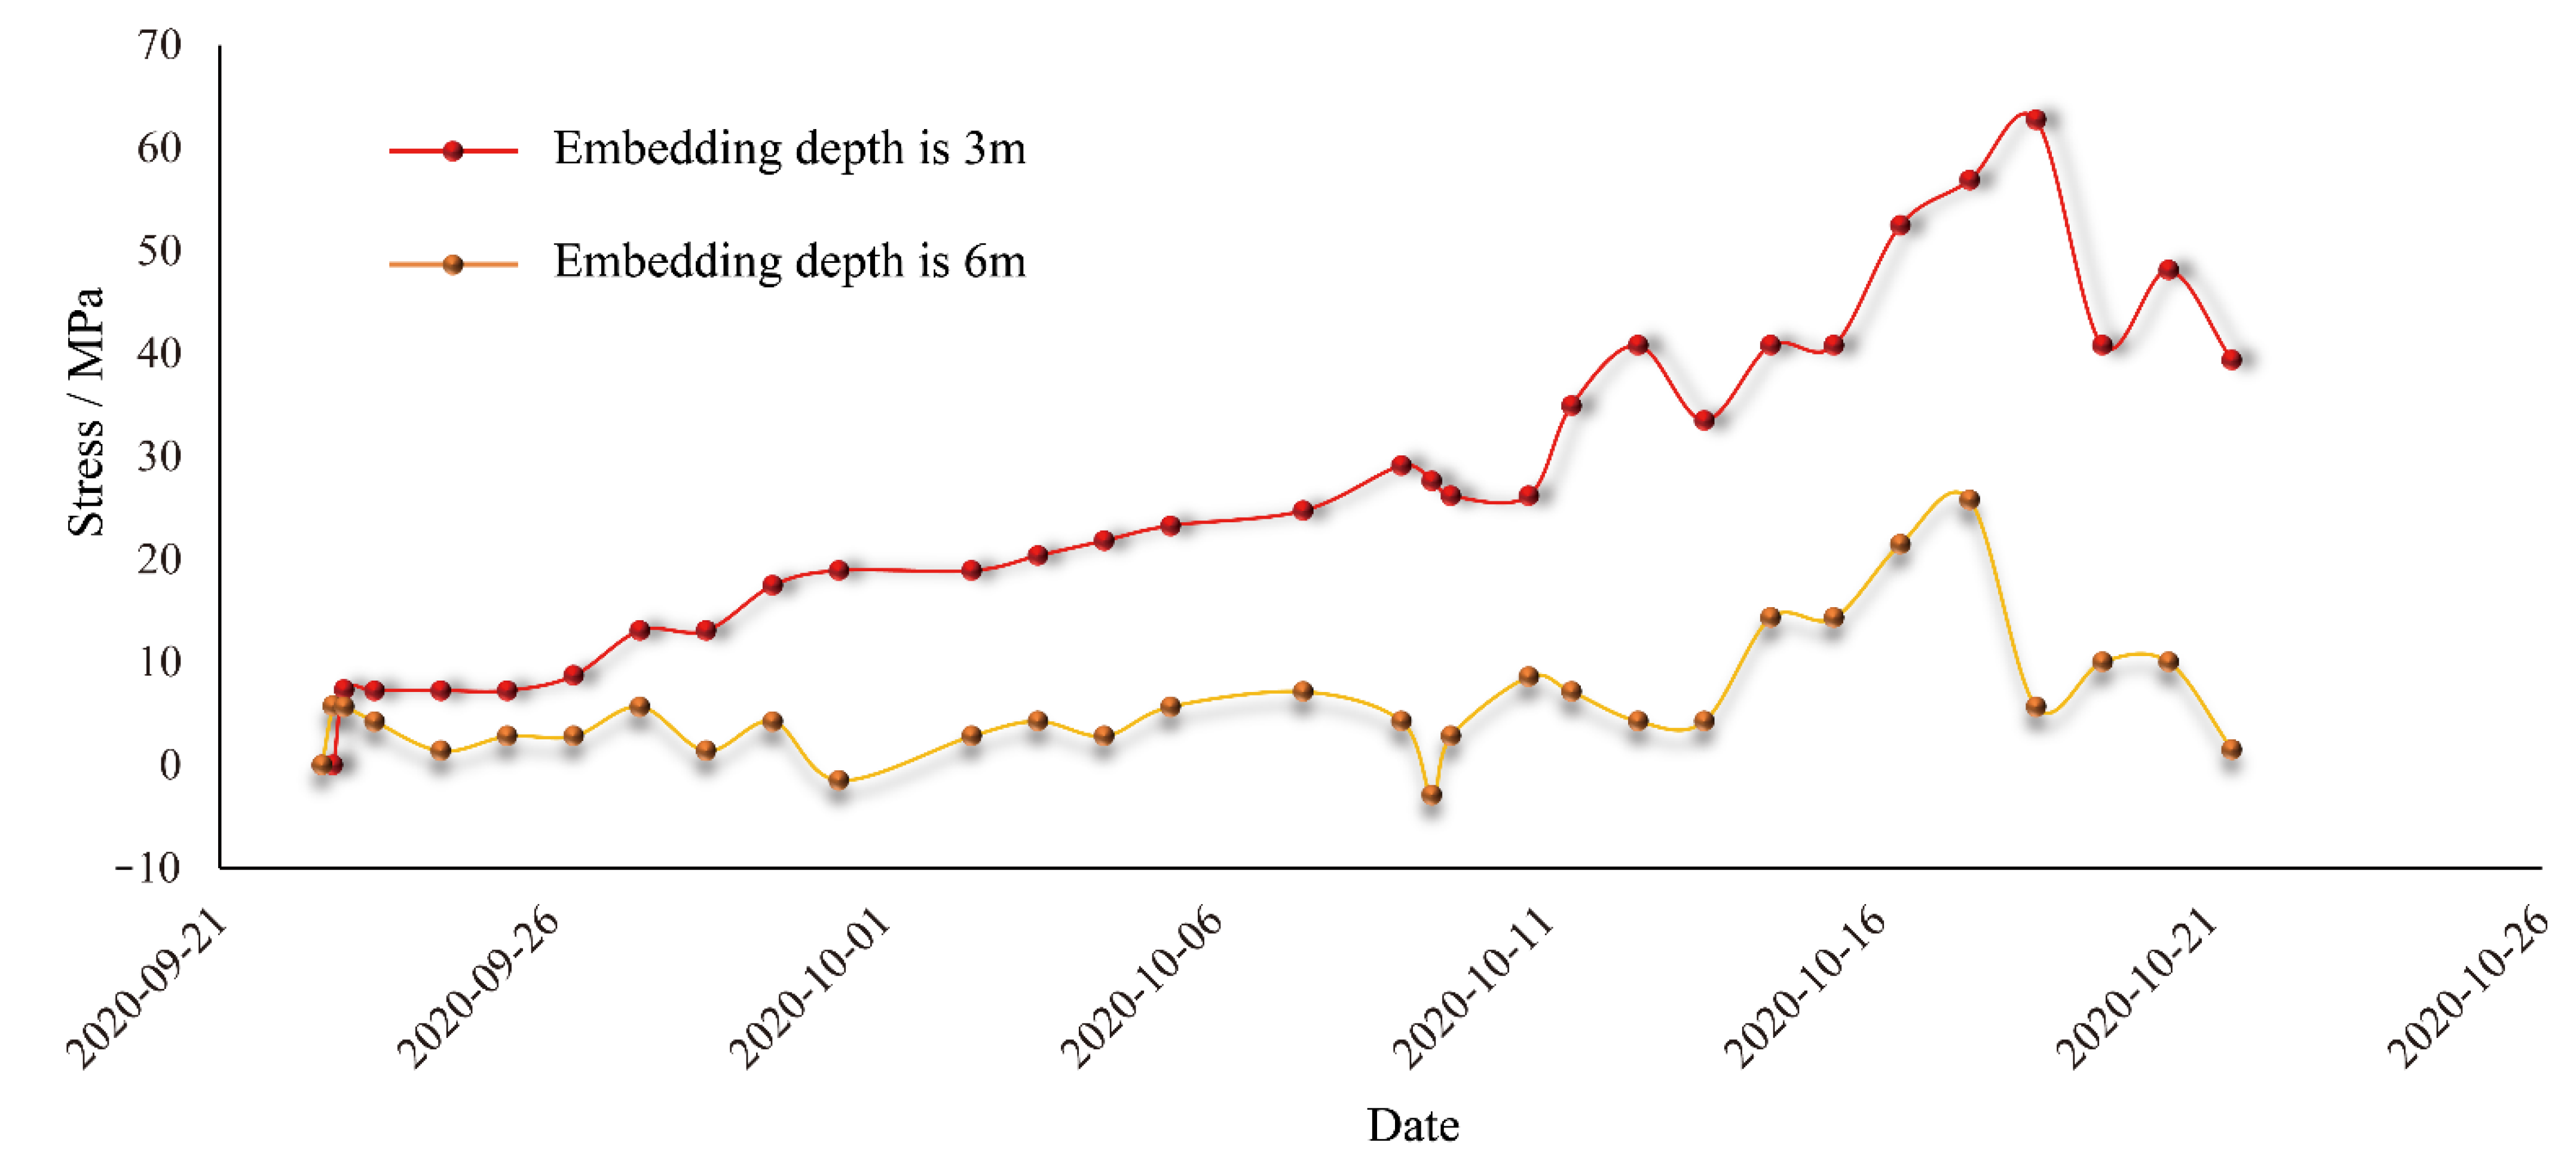
A bolt stress meter was installed on the side wall at stake 0+457 m to ensure the safety of site construction, and it started operation on September 22.
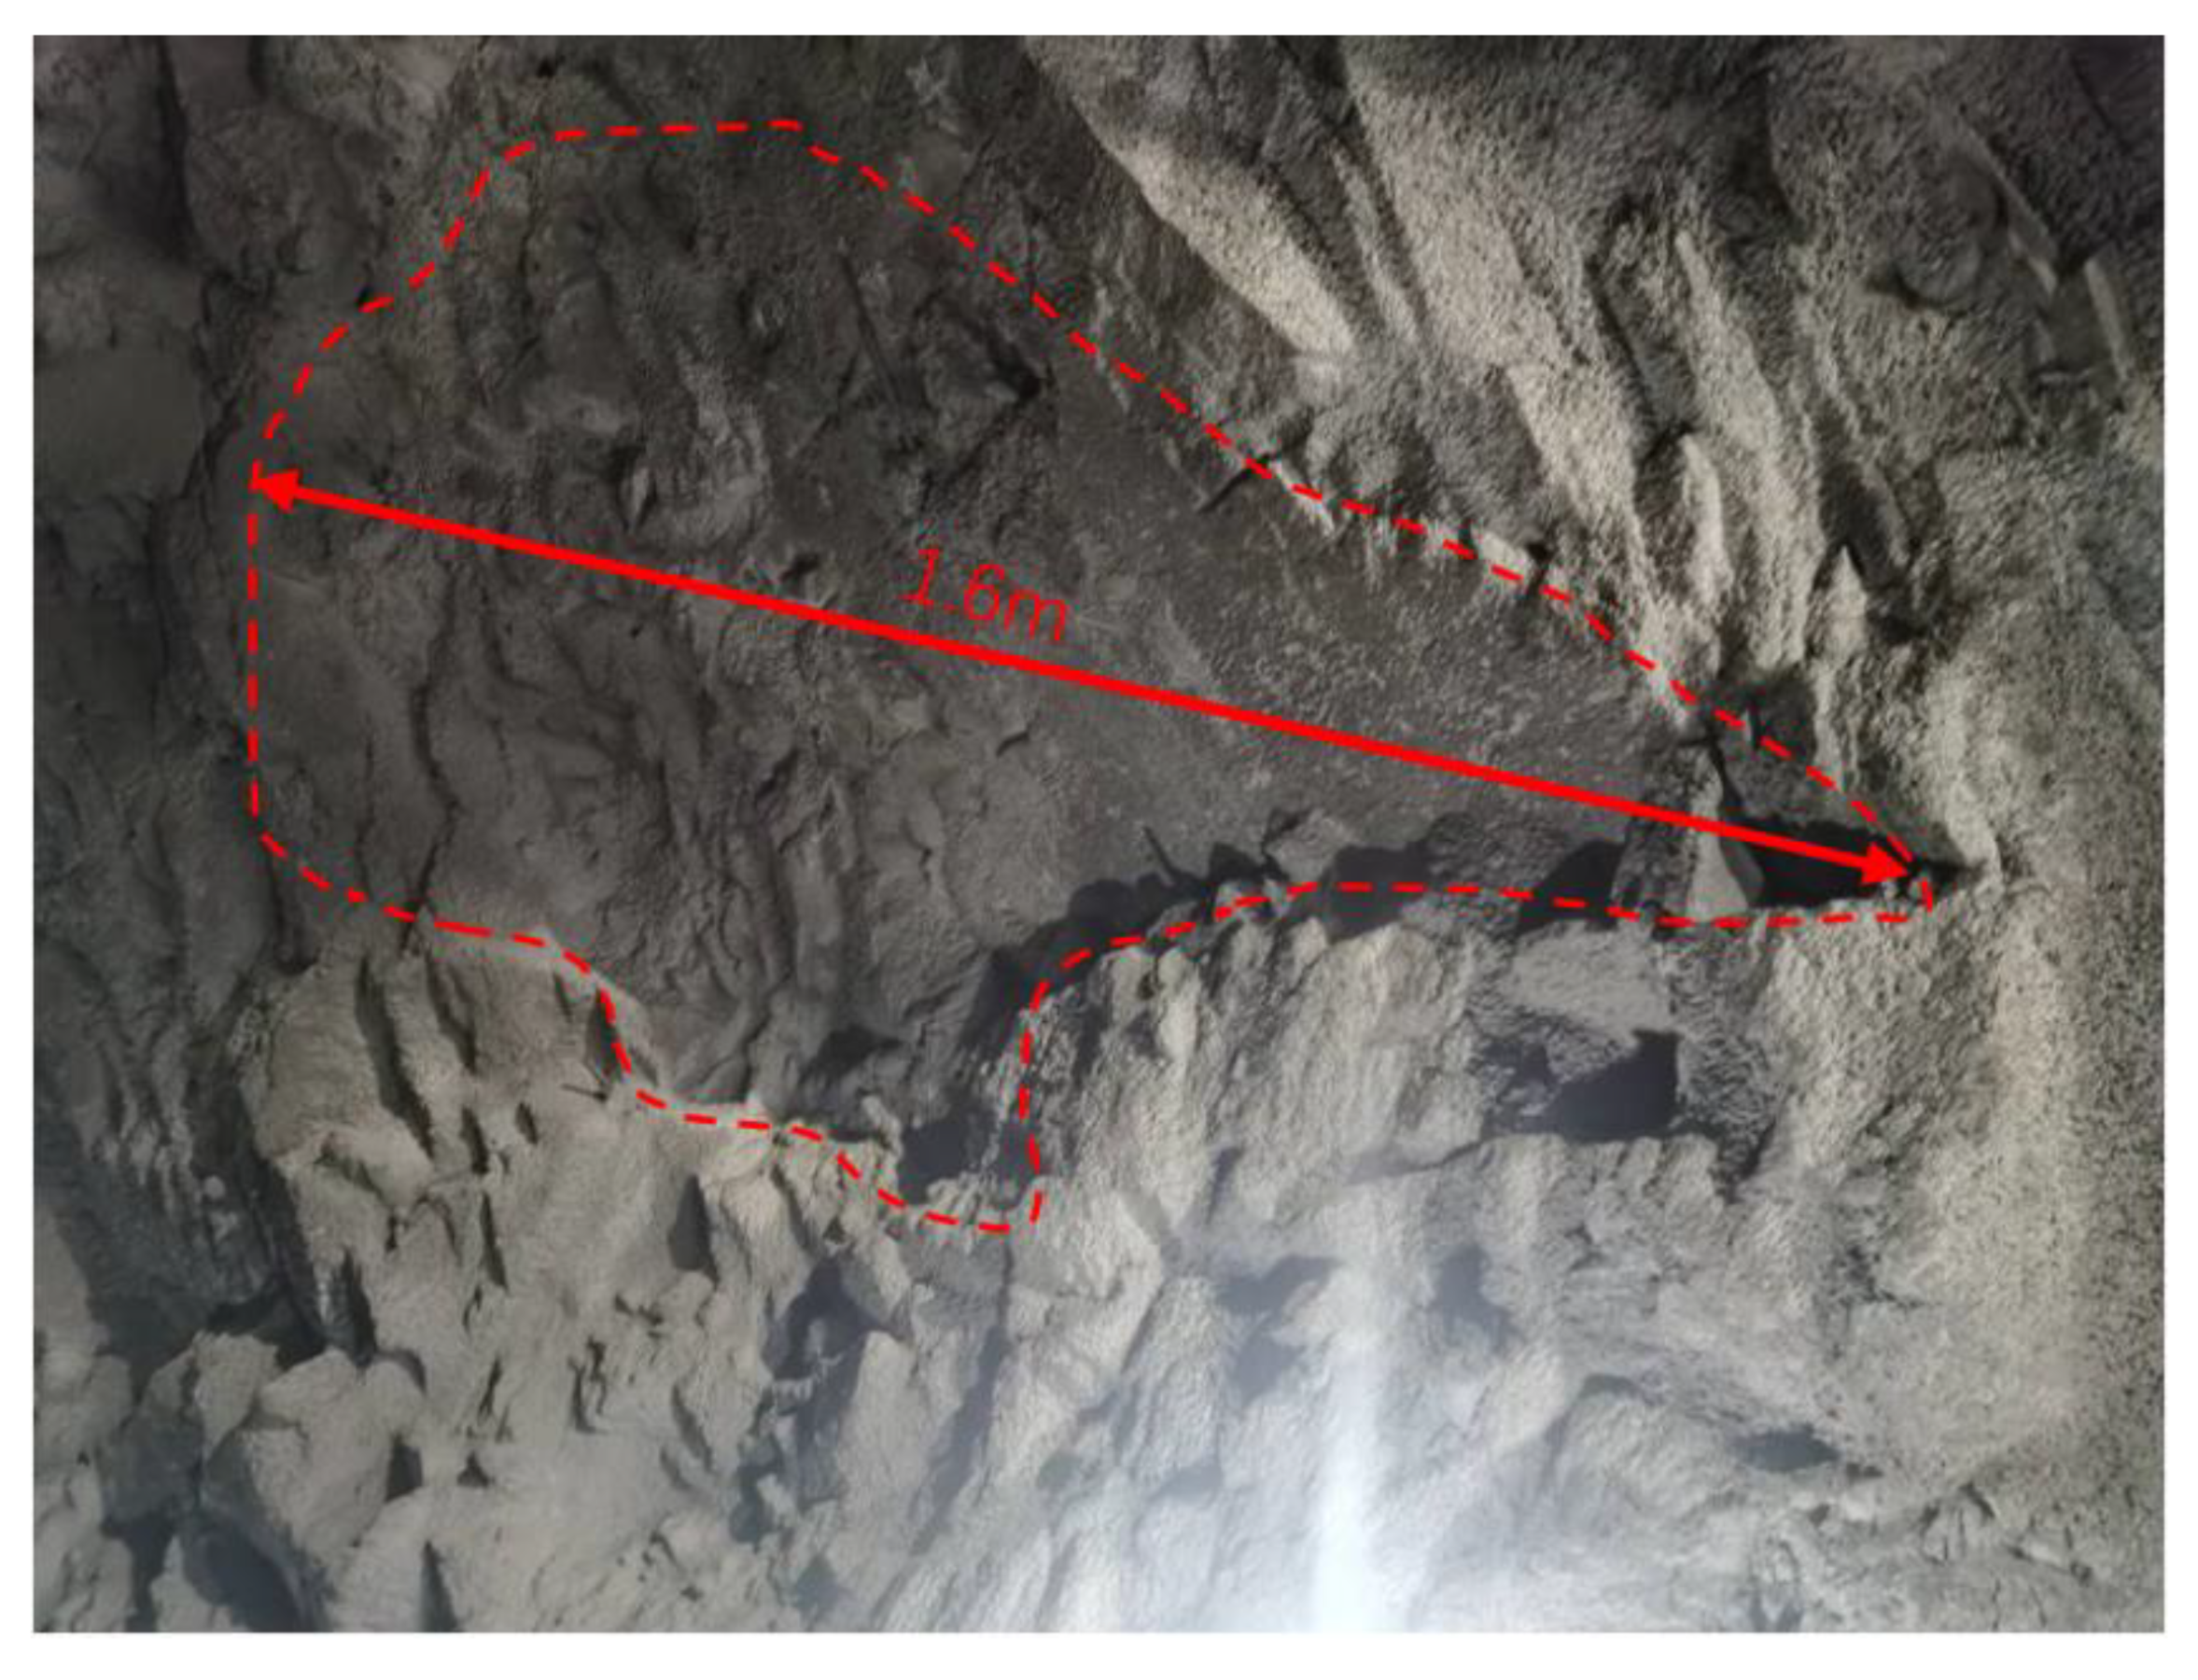
Figure 13 shows the monitoring results. The readings on the bolt stress meter changed slowly from September 22 to October 6, but drastically after that period. It was believed that the excavation and unloading of the spillway tunnel caused cracks to develop along the direction of the fault plane and caused shear failure to predominate in a large area. According to field surveys, the block fall occurred at 0+443 m in the control area of the structural plane, as shown in
Figure 14, where a smooth structural plane can be seen. It was considered that the block fall was caused by the growth and penetration of cracks in the direction of the structural plane.
4.5. Relationship between MS Events and Construction Response
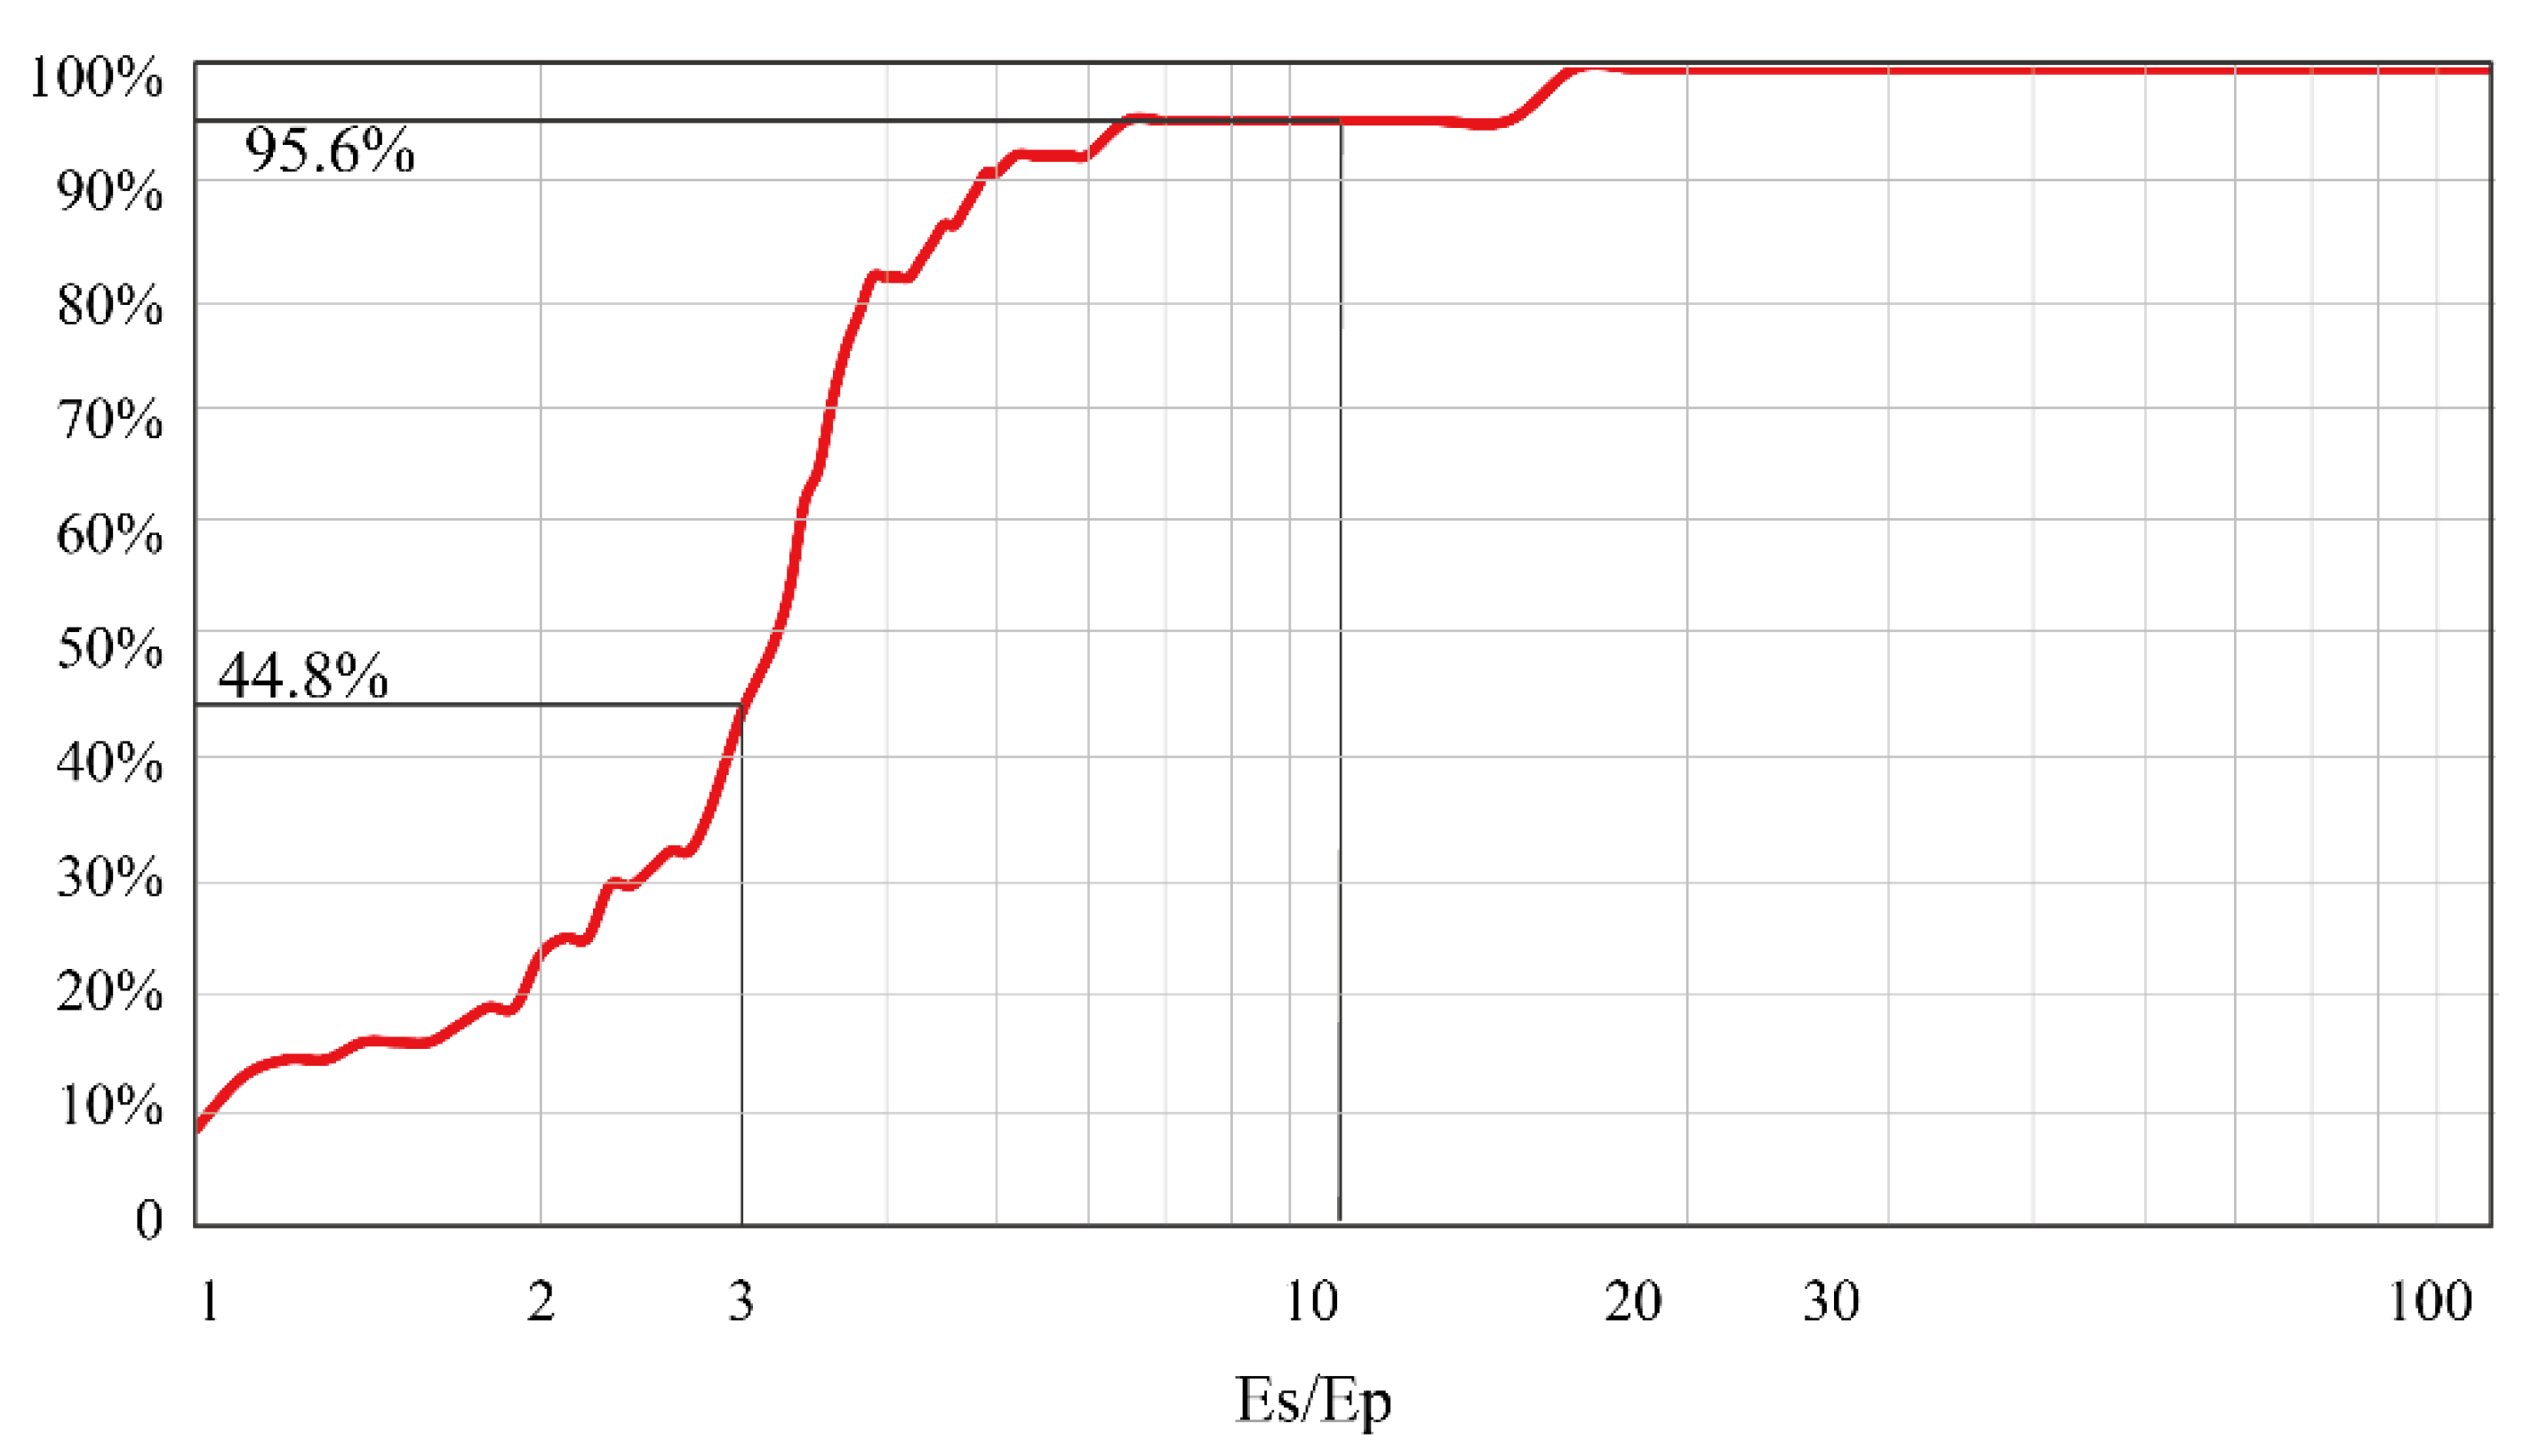
Figure 15 shows the spatial distribution and density diagram of MS events from 22 October to 1 December. The early stages of this period were primarily devoted to the excavation and support of the first layer of the spillway tunnel, which was followed by the excavation of the second layer. In addition, due to the accelerated blasting and excavation of the adjacent diversion tunnel towards the upstream side, the blasting and excavation intensity was increased, which induced MS events with greater magnitudes and higher energy and caused a large number of MS events to be concentrated at stakes 0+500 m to 0+540 m. The density of MS events on one side near the diversion tunnel was significantly greater than that on the other side, causing serious damage to the surrounding rock of the area. Based on the review of available geological data and site surveys, no adverse structural planes were found in the area, so it can be inferred that the MS events in the area during this period were mainly caused by the increased excavation and unloading intensity of the spillway tunnel and the diversion tunnel. The MS events in the area were categorized as research objects and their fracture mechanisms were investigated.
Figure 16 shows the distribution of the ES/EP value of MS events controlled by excavation and unloading intensity. The figure shows that the ES/EP value was less than 10 for 95.6% of the MS events, less than 3 for 44.8% and greater than 10 for only 4.4%. Therefore, tensile failure predominated in the spillway tunnel with MS events controlled by excavation and unloading intensity, with traces of shear failure.
5. Conclusions
In this study, a 3D MS monitoring system was created to monitor the micro-fracture signals of the rock mass during the excavation and unloading process of the spillway tunnel in the Jinchuan hydropower station. The system was used to pick up, identify, denoise, and locate the waveforms in real time. Moreover, the temporal and spatial evolution characteristics and the fracture mechanism of the MS concentration zone were analyzed with geological and construction conditions taken into account; the fracture or damage area of the spillway tunnel was circled; the following conclusions were reached:
- (1)
For MS signals with non-stationary noise, the CEEMD-CS-ST-based noise reduction method was applied, and the SNR, SD, and CC were introduced to quantitatively demonstrate the reasonableness and effectiveness of this method.
- (2)
In order to examine the temporal and spatial evolution characteristics of MS events induced by blasting, excavation, and unloading of the spillway tunnel, the temporal and spatial distribution, moment magnitude, and other source parameters of MS events were analyzed. With the site construction conditions taken into account, the causes of MS event concentration under different working conditions were elaborated, and it was determined that the construction disturbance and adverse geological structures were the main causes of micro-fracture events, which damaged the surrounding rock and made it prone to macroscopic deformation.
- (3)
Analysis of the fracture mechanism of MS events indicated that tensile failure and mixed failure predominated in the surrounding rock of the spillway tunnel, with traces of shear failure.
Author Contributions
Methodology, X.Z.; resources, G.L.; data curation, J.C.; writing—original draft preparation, Z.L.; writing—review and editing, H.M.; project administration, B.L. All authors have read and agreed to the published version of the manuscript.
Funding
This research was funded by the National Natural Science Foundation of China (42277461) and the Science Foundation for Distinguished Young Scholars of Sichuan Province (2020JDJQ0011).
Institutional Review Board Statement
Not applicable.
Informed Consent Statement
Not applicable.
Data Availability Statement
Data are based on field monitoring and can be obtained from the author via email if necessary.
Conflicts of Interest
The authors declare no conflict of interest.
References
- Qian, Q.H.; Zhou, X.P. Failure behaviors and rock deformation during excavation of underground cavern group for Jinping I Hydropower Station. Rock Mech. Rock Eng. 2018, 51, 2639–2651. [Google Scholar] [CrossRef]
- Xu, N.W.; Dai, F.; Li, B.; Zhu, Y.G.; Zhao, T.; Yang, D.S. Comprehensive evaluation of excavation-damaged zones in the deep underground caverns of the Houziyan hydropower station, Southwest China. Bull. Eng. Geol. Environ. 2017, 76, 275–293. [Google Scholar] [CrossRef]
- Huang, X.; Xu, N.; Wu, W.; Xiao, P.; Dong, L.; Li, B. Instability of an intersecting fault-dyke system during deep rock excavation. Int. J. Rock Mech. Min. Sci. 2022, 153, 105087. [Google Scholar] [CrossRef]
- Xiao, Y.X.; Feng, X.T.; Feng, G.L.; Liu, H.J.; Jiang, Q.; Qiu, S.L. Mechanism of evolution of stress–structure controlled collapse of surrounding rock in caverns: A case study from the Baihetan hydropower station in China. Tunn. Undergr. Sp. Technol. 2016, 51, 56–67. [Google Scholar] [CrossRef]
- Young, R.P.; Collins, D.S.; Reyes-Montes, J.M.; Baker, C. Quantification and interpretation of seismicity. Int. J. Rock Mech. Min. Sci. 2004, 41, 1317–1327. [Google Scholar] [CrossRef]
- Trifu, C.I.; Shumila, V. Microseismic monitoring of a controlled collapse in Field II at Ocnele Mari, Romania. Pure Appl. Geophys. 2010, 167, 27–42. [Google Scholar] [CrossRef]
- Leśniak, A.; Isakow, Z. Space–time clustering of seismic events and hazard assessment in the Zabrze-Bielszowice coal mine, Poland. Int. J. Rock Mech. Min. Sci. 2009, 46, 918–928. [Google Scholar] [CrossRef]
- Hudyma, M.; Potvin, Y.H. An engineering approach to seismic risk management in hardrock mines. Rock Mech. Rock Eng. 2010, 43, 891–906. [Google Scholar] [CrossRef]
- Denlinger, R.P.; Bufe, C.G. Reservoir conditions related to induced seismicity at the Geysers steam reservoir, northern California. Bull. Seismol. Soc. Am. 1982, 72, 1317–1327. [Google Scholar] [CrossRef]
- Rutledge, J.T.; Phillips, W.S. Hydraulic stimulation of natural fractures as revealed by induced microearthquakes, Carthage Cotton Valley gas field, east Texas. Geophysics 2003, 68, 441–452. [Google Scholar] [CrossRef]
- Majer, E.L.; McEvilly, T.V. Seismological investigations at The Geysers geothermal field. Geophysics 1979, 44, 246–269. [Google Scholar] [CrossRef]
- Oye, V.; Aker, E.; Daley, T.M.; Kühn, D.; Bohloli, B.; Korneev, V. Microseismic monitoring and interpretation of injection data from the In Salah CO2 storage site (Krechba), Algeria. Energy Procedia 2013, 37, 4191–4198. [Google Scholar] [CrossRef]
- Takagishi, M.; Hashimoto, T.; Horikawa, S.; Kusunose, K.; Xue, Z.; Hovorka, S.D. Microseismic monitoring at the large-scale CO2 injection site, Cranfield, MS, USA. Energy Procedia 2014, 63, 4411–4417. [Google Scholar] [CrossRef]
- Hong, J.S.; Lee, H.S.; Lee, D.H.; Choi, Y.T.; Park, Y.J. Microseismic event monitoring of highly stressed rock mass around underground oil storage caverns. Tunn. Undergr. Space Technol. 2006, 21, 01032462. [Google Scholar] [CrossRef]
- Cai, M.; Kaiser, P.K.; Martin, C.D. A tensile model for the interpretation of microseismic events near underground openings. Pure Appl. Geophys. 1998, 153, 67–92. [Google Scholar] [CrossRef]
- Li, B.; Ding, Q.F.; Xu, N.W.; Dai, F.; Xu YQu, H.L. Characteristics of microseismic b-value associated with rock mass large deformation in underground powerhouse caverns at different stress levels. J. Cent. South Univ. 2022, 29, 693–711. [Google Scholar] [CrossRef]
- Li, B.; Ding, Q.F.; Xu, N.W.; Lei, Y.F.; Xu, Y.; Zhu, Z.P.; Liu, J.F. Mechanical response and stability analysis of rock mass in high geostress underground powerhouse caverns subjected to excavation. J. Cent. South Univ. 2020, 27, 2971–2984. [Google Scholar] [CrossRef]
- Li, B.; Xu, N.W.; Dai, F.; Zhang, G.L.; Xiao, P.W. Dynamic analysis of rock mass deformation in large underground caverns considering microseismic data. Int. J. Rock Mech. Min. Sci. 2019, 122, 104078. [Google Scholar] [CrossRef]
- Feng, X.T.; Yu, Y.; Feng, G.L.; Xiao, Y.X.; Chen, B.R.; Jiang, Q. Fractal behaviour of the microseismic energy associated with immediate rockbursts in deep, hard rock tunnels. Tunn. Undergr. Space Technol. 2016, 51, 98–107. [Google Scholar] [CrossRef]
- Feng, G.L.; Feng, X.T.; Chen, B.R.; Xiao, Y.X. Microseismic sequences associated with rockbursts in the tunnels of the Jinping II hydropower station. Int. J. Rock Mech. Min. Sci. 2015, 80, 89–100. [Google Scholar] [CrossRef]
- Li, P.-X.; Feng, X.-T.; Feng, G.-L.; Xiao, Y.-X.; Chen, B.-R. Rockburst and microseismic characteristics around lithological interfaces under different excavation directions in deep tunnels. Eng. Geol. 2019, 260, 105209. [Google Scholar] [CrossRef]
- Xu, N.W.; Dai, F.; Liang, Z.Z.; Zhou, Z.; Sha, C.; Tang, C.A. The dynamic evaluation of rock slope stability considering the effects of microseismic damage. Rock Mech. Rock Eng. 2014, 47, 621–642. [Google Scholar] [CrossRef]
- Xu, N.W.; Tang, C.A.; Li, L.C.; Zhou, Z.; Yang, J.Y. Microseismic monitoring and stability analysis of the left bank slope in Jinping first stage hydropower station in southwestern China. Int. J. Rock Mech. Min. Sci. 2011, 48, 950–963. [Google Scholar] [CrossRef]
- Xu, N.W.; Tang, C.A.; Li, H.; Dai, F.; Ke, M.A.; Shao, J.D.; Wu, J.-C. Excavation-induced microseismicity: Microseismic monitoring and numerical simulation. J. Zhejiang Univ. Sci. A 2012, 13, 445–460. [Google Scholar] [CrossRef]
- Boore, D.M.; Boatwright, J. Average body-wave radiation coefficients. Bull. Seismol. Soc. Am. 1984, 74, 1615–1621. [Google Scholar] [CrossRef]
- Boatwright, J.; Fletcher, J.B. The partition of radiated energy between P and S waves. Bull. Seismol. Soc. Am. 1984, 74, 361–376. [Google Scholar] [CrossRef]
| Publisher’s Note: MDPI stays neutral with regard to jurisdictional claims in published maps and institutional affiliations. |
© 2022 by the authors. Licensee MDPI, Basel, Switzerland. This article is an open access article distributed under the terms and conditions of the Creative Commons Attribution (CC BY) license (https://creativecommons.org/licenses/by/4.0/).


